Article

Search of Reflectance Indices for Estimating Photosynthetic Activity of Wheat Plants Under Drought Stress

1
Department of Biophysics, National Research Lobachevsky, State University of Nizhny Novgorod, 23 Gagarin Avenue, 603022 Nizhny Novgorod, Russia
2
N.I. Vavilov All-Russian Institute of Plant Genetic Resources (VIR), 42–44 Bolshaya Morskaya, 190000 Saint Petersburg, Russia
3
Department of High-Performance Computing and System Programming, National Research Lobachevsky State University of Nizhny Novgorod, 23 Gagarin Avenue, 603950 Nizhny Novgorod, Russia
*
Author to whom correspondence should be addressed.
Plants 2025, 14(1), 91; https://doi.org/10.3390/plants14010091
Submission received: 12 December 2024 / Revised: 26 December 2024 / Accepted: 28 December 2024 / Published: 31 December 2024

Abstract

:
Global climate change and the associated increasing impact of droughts on crops challenges researchers to rapidly assess plant health on a large scale. Photosynthetic activity is one of the key physiological parameters related to future crop yield. The present study focuses on the search for reflectance parameters for rapid screening of wheat genotypes with respect to photosynthetic activity under drought conditions. The development of drought stress modelled in laboratory conditions by stopping irrigation caused changes in chlorophyll fluorescence parameters that corresponded to a decrease in photosynthetic activity. In particular, a decrease in the photochemical quantum yield of photosystem II (ΦPSII), which characterizes the rate of linear electron transport in the photosynthetic electron transport chain and is one of the most sensitive parameters responding at the early stages of drought stress, was observed. Along with the measurement of the photosynthetic activity, spectral characteristics of wheat plants were recorded using hyperspectral imaging. Normalized difference indices (NDIs) were calculated using the reflectance intensity of wheat shoots in the range from 400 to 1000 nm. Four NDIs that showed a strong correlation with the level of photosynthetic activity estimated by ΦPSII were selected from different wavelength ranges (NDI610/450, NDI572/545, NDI740/700, and NDI820/630). The indices NDI572/545 and NDI820/630 showed the best combination of sensitivity to soil moisture deficit and strong relationship with photosynthetic activity under drought stress. Possible molecular and physiological causes of this relationship are discussed. The use of the proposed indices will allow to monitor in detail the specific features of wheat plant response and can serve as one of the criteria for selection of the most promising genotypes in breeding of drought-tolerant cultivars.

1. Introduction

Wheat is an important crop that provides a significant portion of the calories and protein consumed by humans [1,2]. The efforts of breeders have resulted in cultivars that produce high yields under favorable growing conditions. Yield losses are strongly related to stress factors, among which drought is one of the most devastating. According to [3], drought-induced yield losses can reach up to 15%. These losses have been increasing in recent years, including due to the climate change [4]. In addition, the negative effect of soil moisture deficit can be enhanced by soil salinity [5,6,7]. The problems outlined above challenge breeders to obtain new cultivars that give high yields under drought stress.
Yield losses under drought stress are associated with a complex of changes, including a decrease in the activity of photosynthesis, which is a key component of the production process. The crucial role of photosynthesis in productivity has led researchers to pay great attention to the study of its activity under drought conditions. The results of such studies are summarized in reviews [8,9,10,11]. The following general patterns of changes in photosynthetic activity during drought progression can be identified. The early stage of drought-induced changes in the activity of the photosynthetic apparatus (PSA) is associated with modulation of stomatal conductance, reduction in CO2 availability, and suppression of linear electron transport in the photosynthetic electron transport chain (PETC) due to a slowdown of light-independent reactions and enhancement of the non-photochemical quenching of fluorescence (NPQ) mechanism [12,13]. These processes are accompanied by a decrease in chlorophyll fluorescence (ChlF) parameters such as the effective photochemical quantum yield of PSII (ΦPSII), the coefficient of photochemical fluorescence quenching (qP), and the electron transport rate (ETR) and an increase in NPQ, the quantum yield of regulated non-photochemical energy dissipation in PSII (ΦNPQ), and the coefficient of non-photochemical fluorescence quenching (qN), etc. [14]. Long-term drought results in damage to photosynthetic proteins and thylakoid membranes caused by reactive oxygen species (ROS), the increased accumulation of which accompanies the early stage [15]. Such destructive changes are detected together with a decrease in the maximum quantum efficiency of PSII (Fv/Fm) and, in some cases, a decrease in NPQ [14].
The development of drought-tolerant cultivars is based on genotyping and phenotyping [14,16]. Genomic approaches have identified a number of genotypic traits associated with drought tolerance [17,18]. In addition, instrumental phenotyping, including remote optical methods, has been actively developed in recent years [19,20]. Screening of genotypes with respect to higher photosynthetic potential and stability under water deficit conditions is performed. In particular, the method of ChlF registration demonstrates high information content [14]. Its successful application for phenotyping in breeding under both laboratory and field conditions has been demonstrated. Despite the advantages of the ChlF method, including the ability to directly record photosynthetic activity, it has a throughput limitation due to the duration of an individual measurement. This has led to a search for other approaches that can correctly assess drought stress-induced alterations in photosynthetic activity. These include, first of all, spectral imaging methods, which make it possible to carry out larger-scale studies due to high speed and large scale of measurements. A number of studies in recent years have shown that changes in the reflectance spectrum can be associated with changes in photosynthesis activity [21,22,23,24].
Various indices calculated using the values of the reflection coefficients at two or more wavelengths are widely used to assess the state of plants. Among them, the structural, water, and xanthophyll indices are the most commonly correlated with plant water stress [25]. Structural indices are based on measurements in the visible (VIS) and near-infrared (NIR) range. These include the normalized difference vegetation index (NDVI), the renormalized difference vegetation index (RDVI), optimized soil-adjusted vegetation index (OSAVI), and others. In addition to using structural indices to assess yields, they are used to monitor plant stress, in particular, to detect changes caused by water shortage [26,27]. The next group includes the water indices, measured in NIR: water index (WI), simple ration water index (SRWI), normalized difference water index (NDWI), and others. This group of indices makes it possible to estimate the water content in plants. Another subgroup, xanthophyll indices, includes the photochemical reflectance index (PRI) and its various modifications [25]. The PRI is sensitive to the epoxidation state of the xanthophyll cycle pigments, and is also related to NPQ and photosynthesis efficiency [23].
Despite active research in this area, a comprehensive body of knowledge sufficient to recommend a specific approach for assessing the photosynthetic response to drought in individual genotypes using spectral imaging is currently lacking.
The aim of this work was to identify reflectance indices that can act as indicators of drought-induced changes in photosynthesis activity. We hypothesized that drought-induced shifts in a number of wheat reflectance indices caused by alterations in leaf structure and pigment composition may be associated with the changes in photosynthetic activity. Identification of such indices will make it possible to monitor in detail the peculiarities of the response of individual genotypes in breeding trials. This, in turn, will make it possible to select drought-tolerant genotypes as well as to identify genetic markers for genomic selection that reflect a specific pattern of the response to drought.

2. Results

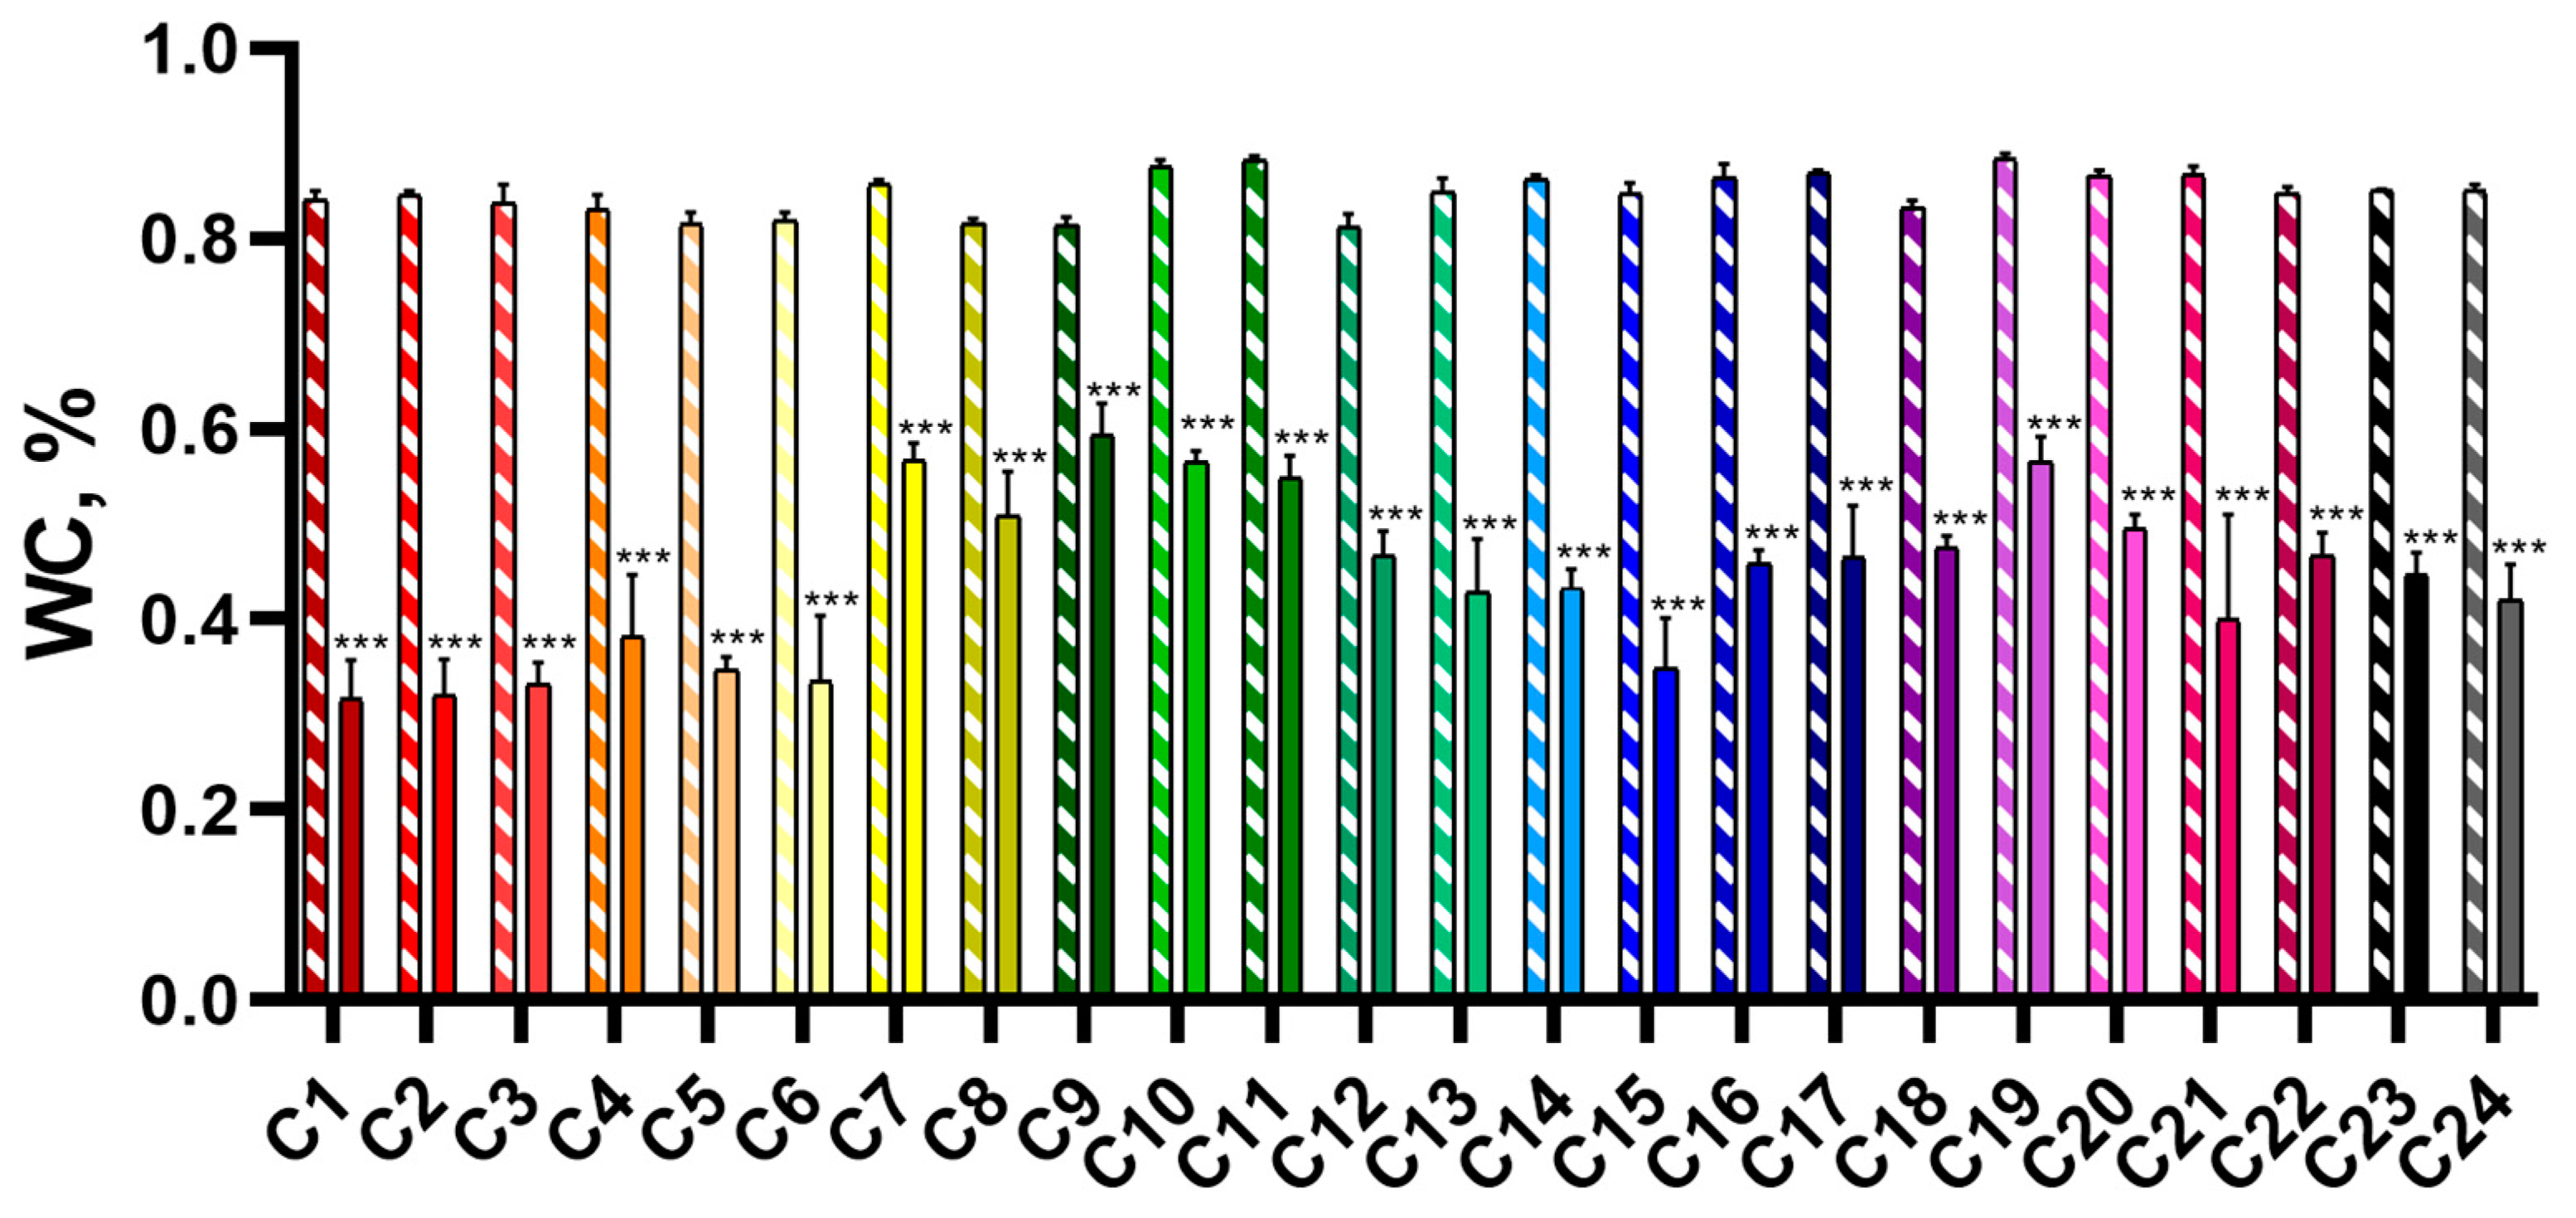
2.1. Effect of Soil Moisture Deficit on Phenotypic Parameters of Wheat Seedlings

2.1.1. Morphometric Parameters

A comparison of biomass accumulation and the water content (WC) in control plants (CC) and plants subjected to drought stress (DS) was performed to evaluate the effect of short-term soil drought on morphometric parameters of seedlings. It was shown that dry weight (DW) of CC plants ranged from 155 ± 19 mg (C2) to 327 ± 17 mg (C12) (Figure 1). DW of DS plants was significantly lower than the control plants and ranged from 105 ± 11 mg (C19) to 157 ± 7 mg (C12).
WC in the CC group ranged from 81.3 ± 1% in C12 to 88.4 ± 0.3% in C19; in the DS group, WC ranged from 31.6 ± 2% in C1 to 59.3 ± 1.7% in C9 (Figure 2). On average for all cultivars, WC in plants of the DS group decreased by 40.2 ± 1.7% (from 22.0 ± 1.6% in C9 to 52.6 ± 1.8% in C2) compared to CC plants. Figure 2 shows the values of WC in 28-day-old plants of the CC and DS groups.

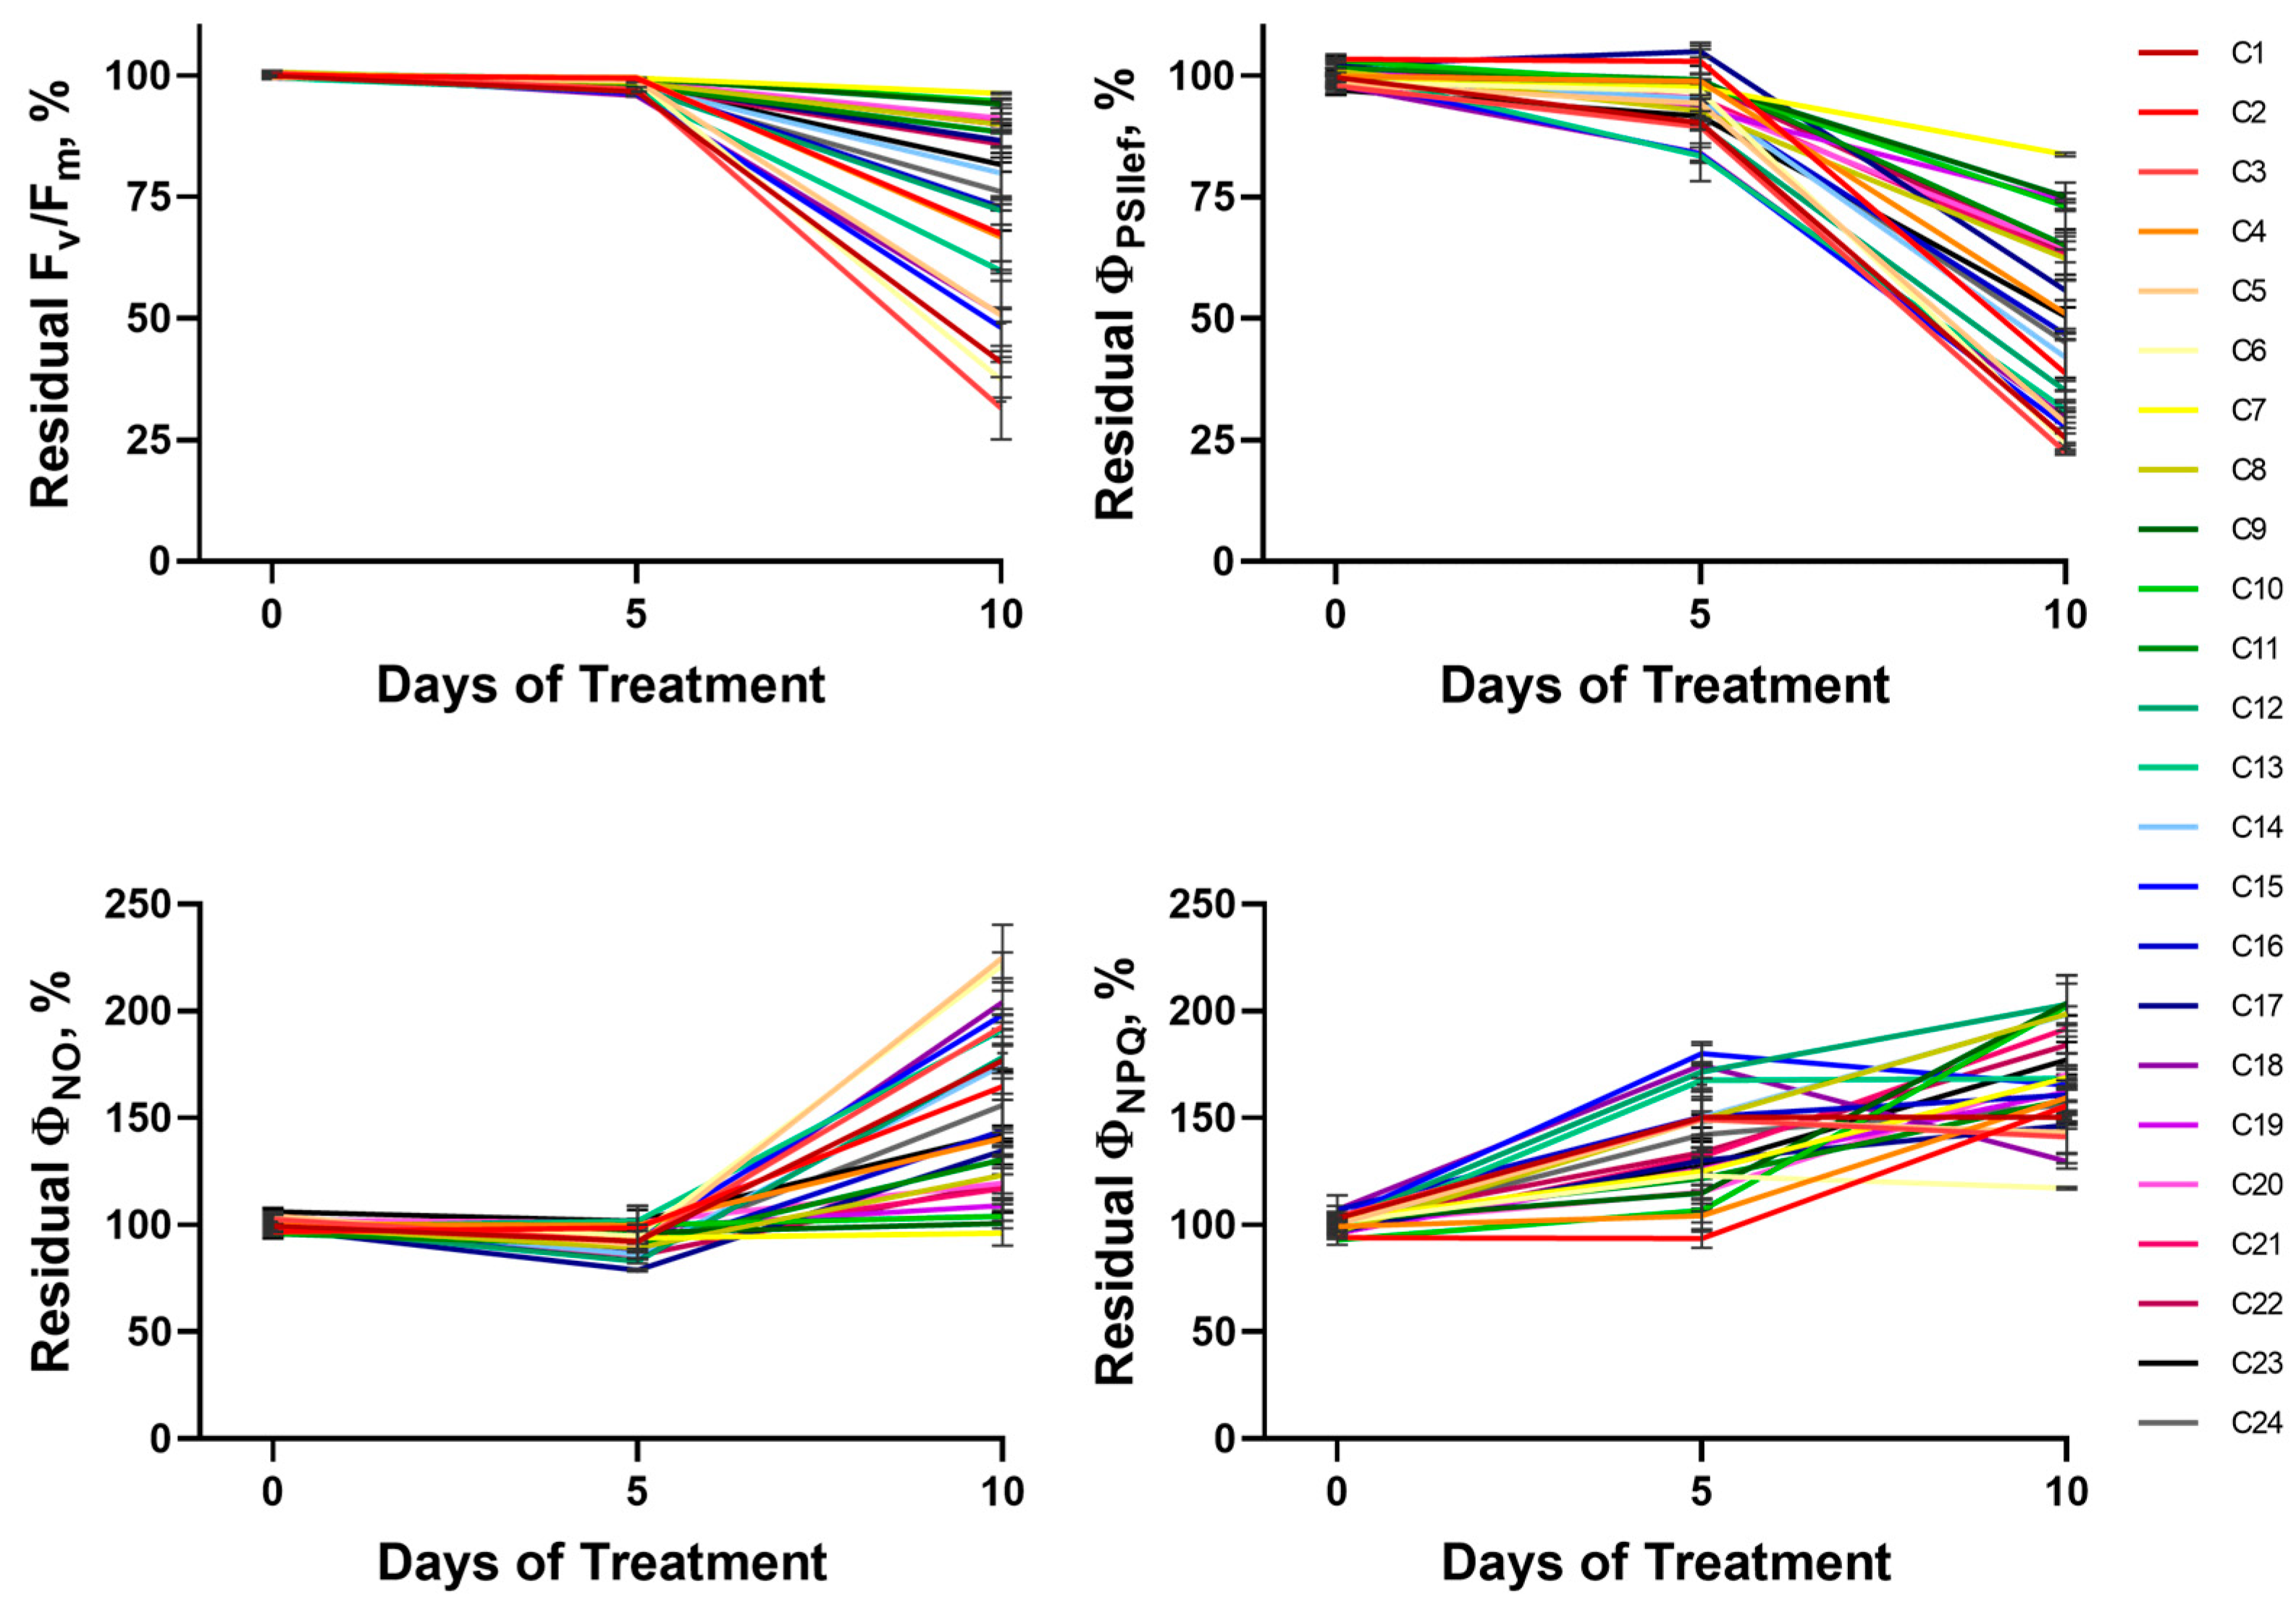
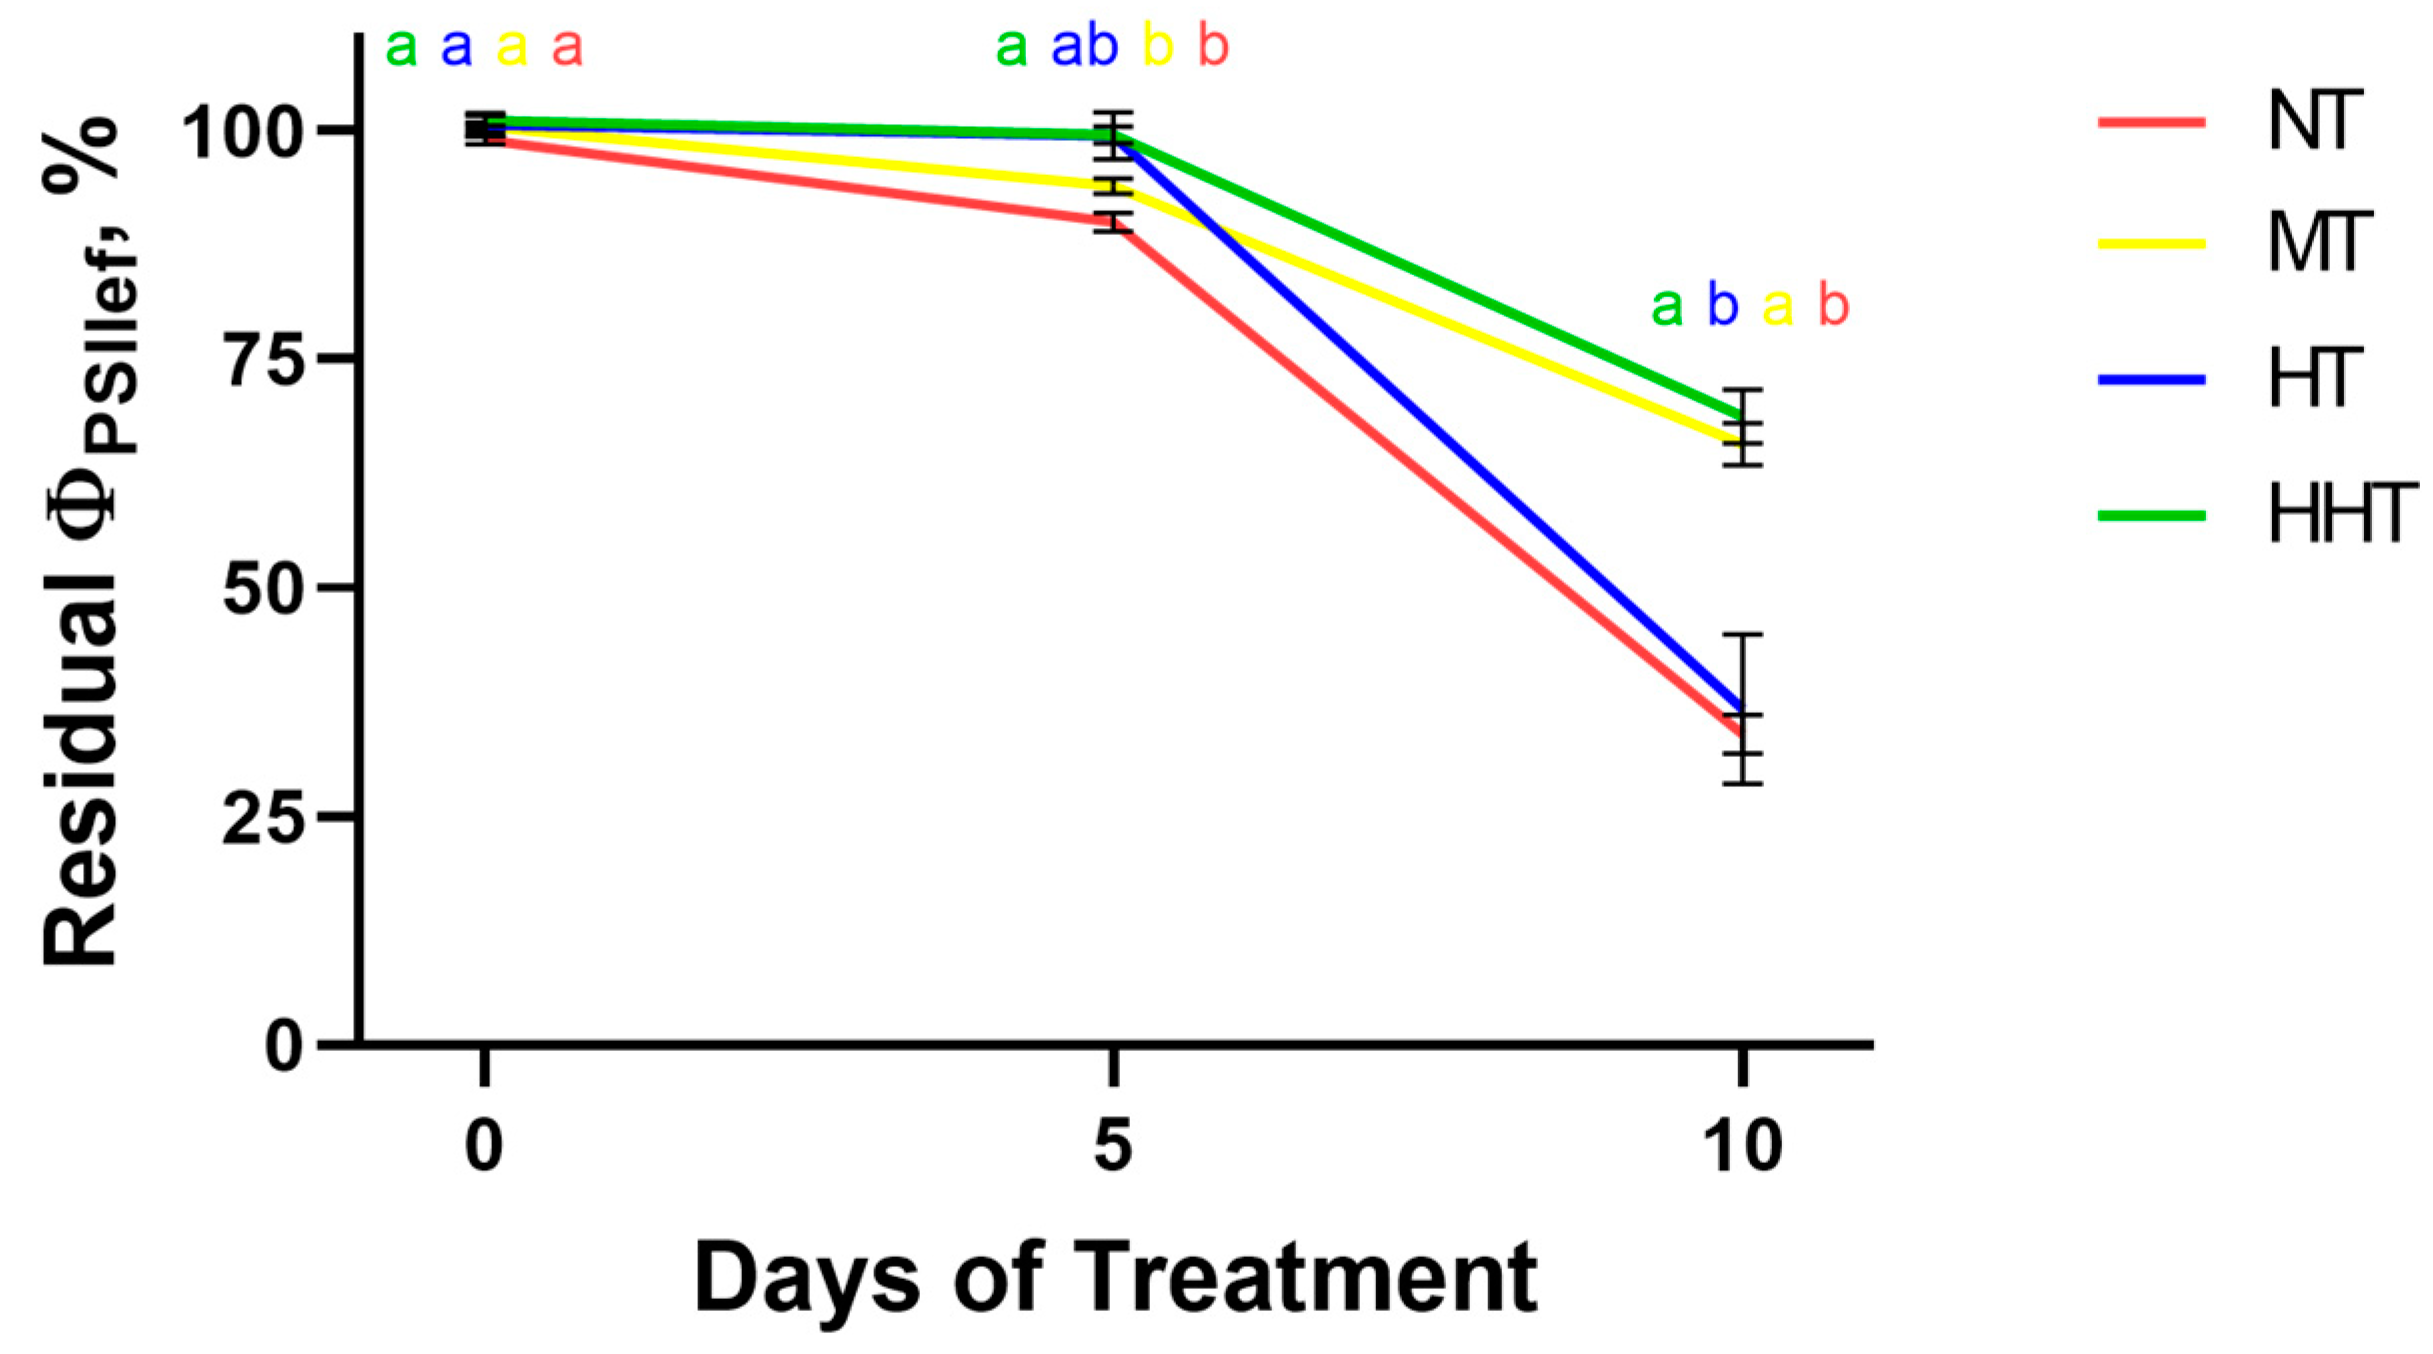
2.1.2. Photosynthetic Activity

A 10-day soil drought caused dramatic changes in photosynthetic activity parameters based on changes in ChlF (Figure 3 and Figure S1). To investigate the effect of drought on photosynthetic activity parameters (Fv/Fm, ΦPSII, the quantum yield of non-regulated non-photochemical energy loss in PSII (ΦNO), and ΦNPQ) in wheat seedlings, we analyzed the dynamics of their residual level (as a percentage of control), including values before the onset of drought (at the age of 14 days), as well as after 5 and 10 days of DS (at the ages of 19 and 24 days, respectively) (Figure 3 and Figure S2). The normalization of the values of the experimental plants to the control plants allows us to level out the contribution of age-related alterations in photosynthetic activity to the patterns of drought-induced changes. The studied cultivars showed a variety of strategies for response to the induction and development of soil drought. In particular, four types of dynamics of photosynthesis activity parameters were revealed. The first group of cultivars showed a pronounced decrease in photosynthetic activity at the fifth day of DS, manifested in ΦPSII decline and ΦNPQ growth; this decrease intensified with the development of water stress by the 10th day of treatment. It is worth noting that the suppression of photosynthesis at the early stage of stress development (the fifth day of DS) was manifested only in the fall of ΦPSII and rise of ΦNPQ; the pronounced changes of Fv/Fm and ΦNO were absent. This indicates that changes in the functioning of the PSA, not associated with damage to photosystem components, occurred at the fifth day of DS. Further drought development (10 days duration) was accompanied by significant changes in all studied parameters, including decreases in Fv/Fm and ΦPSII and increases in ΦNO and ΦNPQ. The second group of cultivars showed a different pattern of changes: at the early stage of drought development (day 5), no pronounced changes in photosynthetic activity parameters were observed; at the same time, at the 10th day, a strong photosynthetic suppression comparable to that observed in the first group was registered. The third pattern of changes in ChlF parameters: early (day 5 of drought stress) statistically significant drop in photosynthetic activity and maintenance of moderate photosynthetic activity at the 10th day (the greatest level of photosynthetic activity compared to the previous groups). The fourth pattern: no significant change in photosynthetic activity at the early DS stage and its moderate decline at the late stage, comparable to the third group.
Summarizing the patterns of changes in the four photosynthetic parameters, the described groups of cultivars can be classified as: (i) cultivars with low PSA tolerance (NT); (ii) cultivars capable of maintaining stable PSA functioning under short-term water deficit but not tolerant to long-term intensive drought (MT); (iii) cultivars with high PSA tolerance to DS, showing reduced photosynthetic activity under moderate drought and no dramatic suppression of photosynthetic processes under severe drought (HT); (iv) cultivars with high photosynthetic tolerance to DS, maintaining stable functioning of PSA under both short-term and longer-term drought (HHT).
All tested cultivars were divided into the four groups described above according to the dynamics of changes in ΦPSII, which is one of the key ChlF parameters reflecting the activity of photosynthetic processes: the NT group included cultivars C1, C3, C5, C12, C13, C14, C15, C16, C18, C23, and C24; MT—C2, C4, and C6; HT—C8, C19, C20, and C21; HHT—C7, C9, C10, C11, C17, and C22. The average dynamics of residual ΦPSII for each group were obtained by summarizing data from the respective cultivars (Figure 4). The analysis of the obtained dynamics showed good agreement with the characterized patterns of drought-induced changes, including their qualitative and quantitative characteristics.

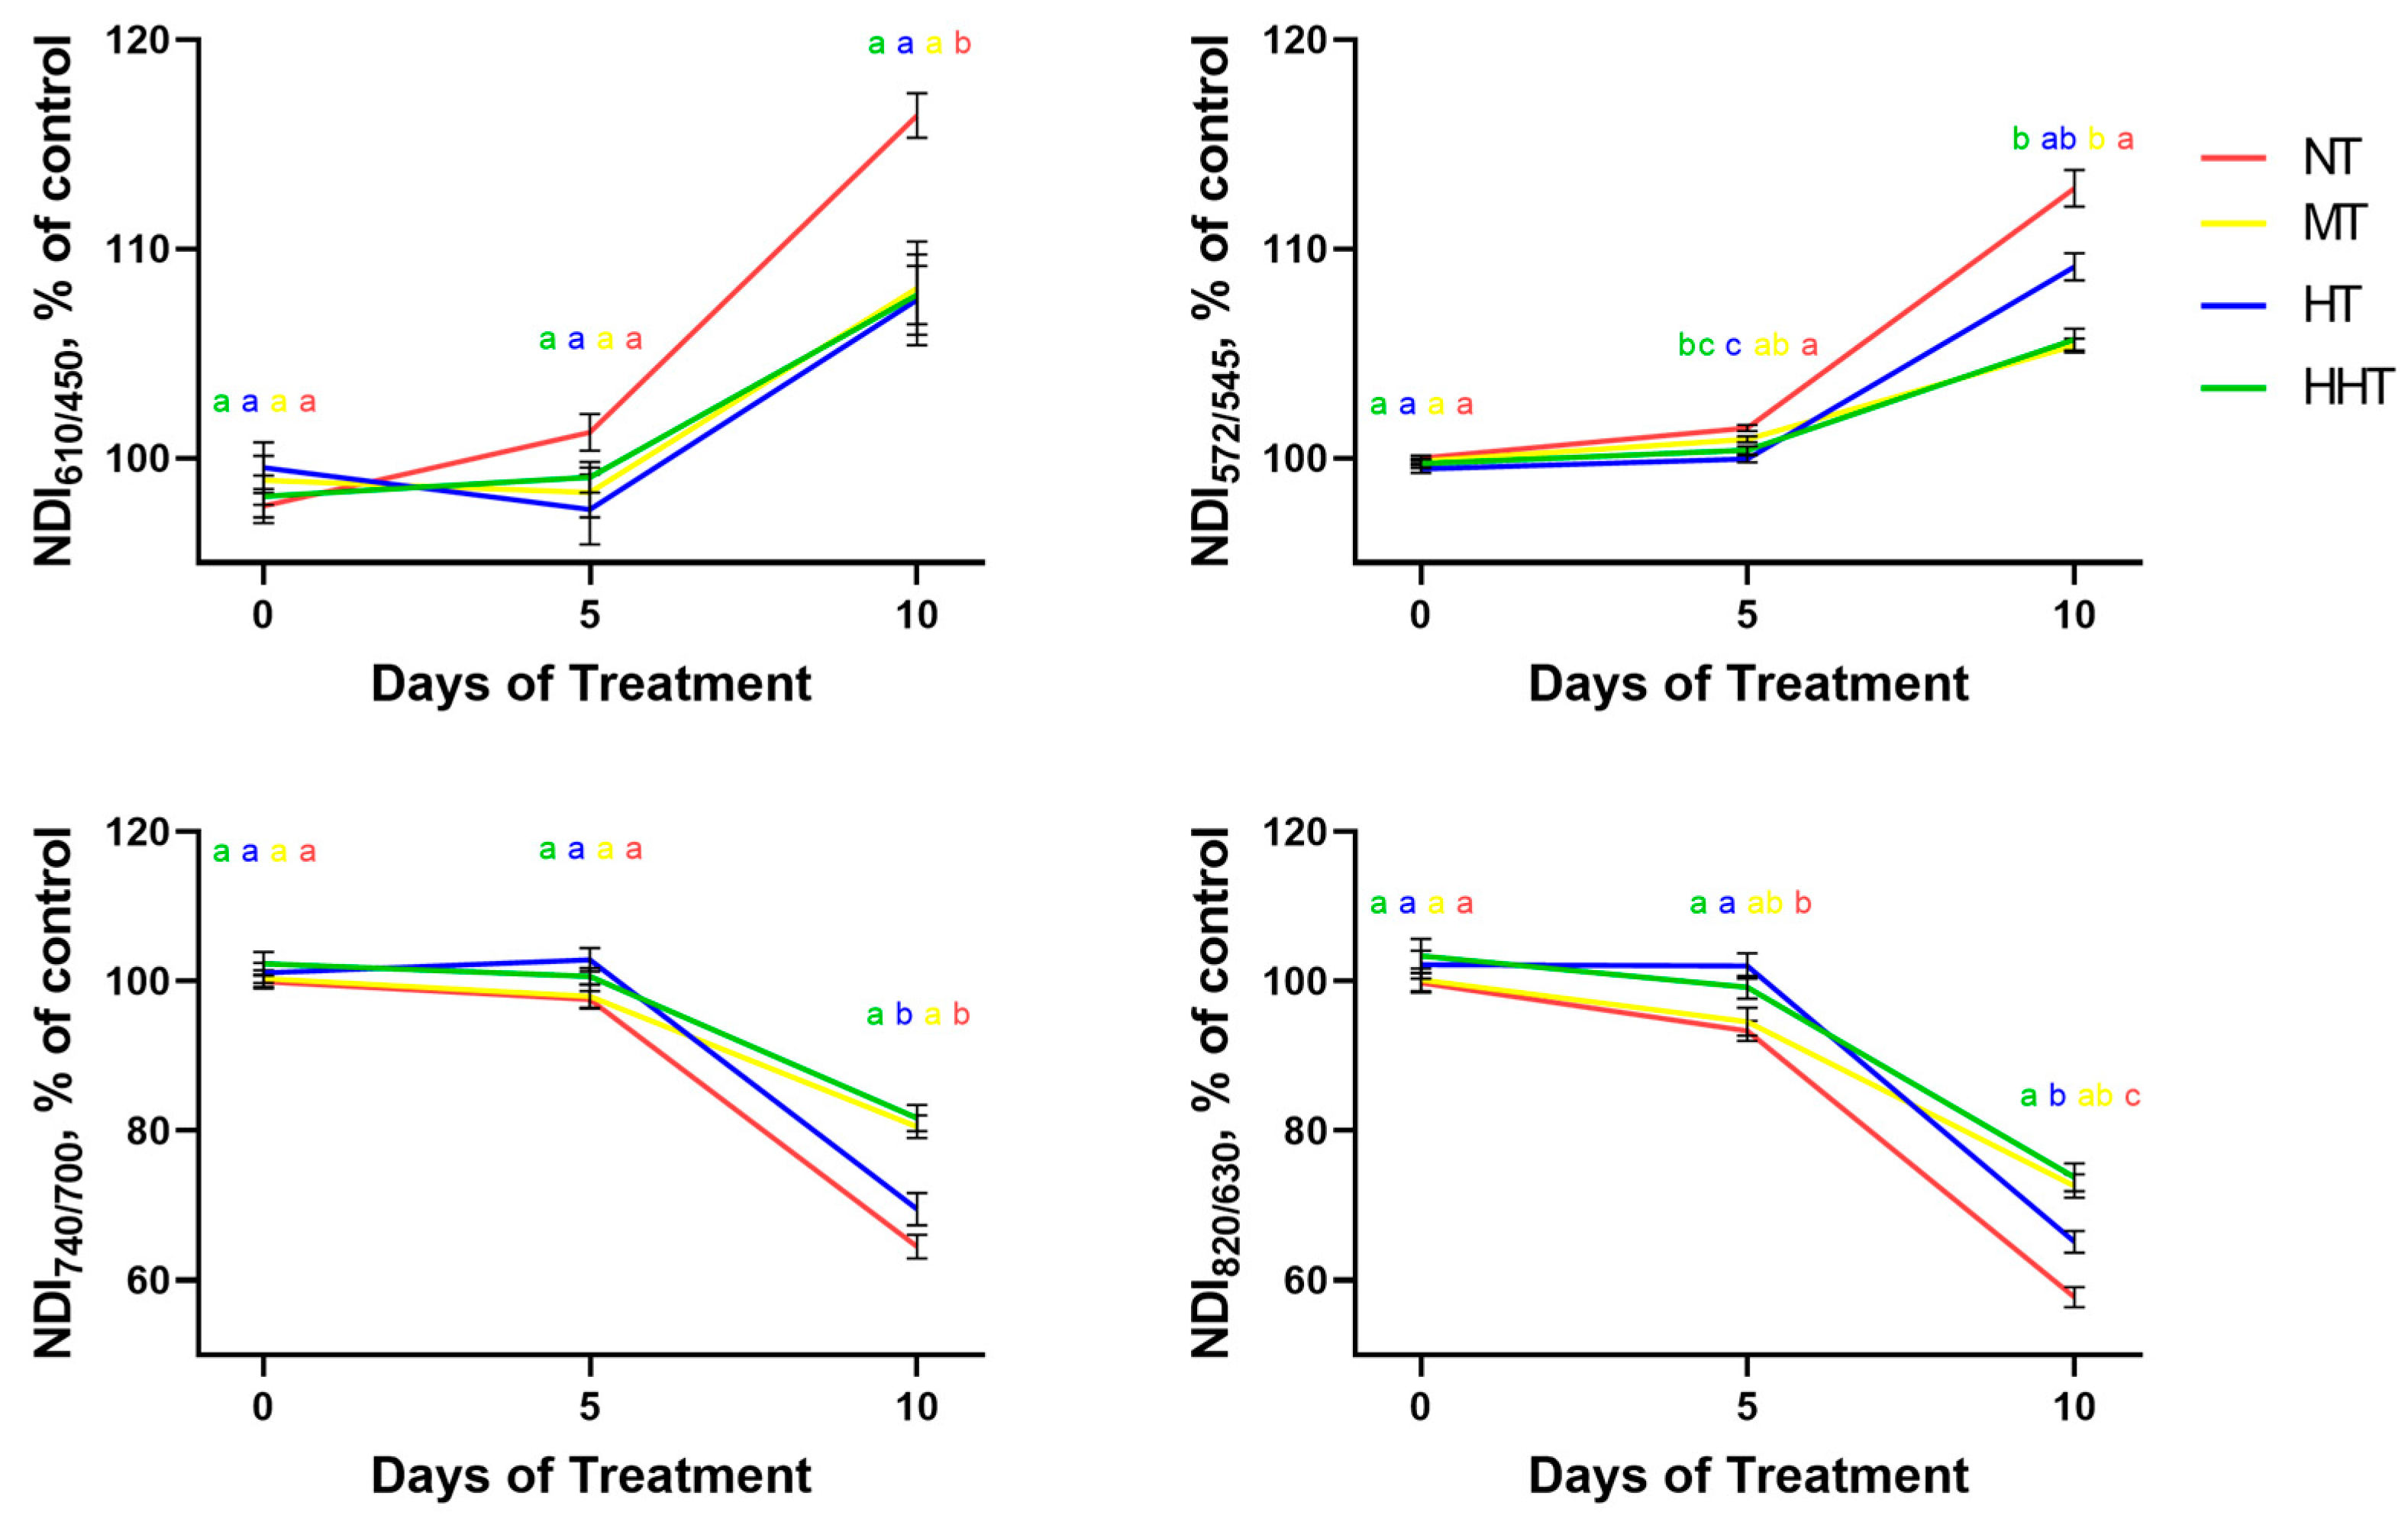
2.1.3. Reflectance Parameters

Reflectance spectra of shoots before the start of the drought and 3, 5, 7, 10, and 14 days after the cessation of irrigation (at the ages of 14, 17, 19, 21, 24, and 28 days, respectively) were obtained by analyzing hyperspectral images of CC (Figure 5A) and DS plants (Figure 5B).
Water deficit in the soil significantly affected the optical properties of shoots, which was manifested in the change in the shape of reflectance spectra, progressing with the development of drought stress (Figure 5B). In the VIS region, loss of the spectrum shape typical for green parts of the plant due to optical properties of photosynthetic pigments, mainly absorption of light by chlorophyll, is observed. The sharp change in the reflection coefficient in the region of the red edge (RE), characteristic for green shoots of unstressed plants, loses clear boundaries and sharpness. The reflectance intensity in the region following the red edge (from 780 to 1000 nm, NIR) also decreases. Analysis of the difference between CC and DS spectra showed that the greatest changes in the reflectance spectra of plants were observed in the ranges from 550 to 700 nm and from 730 to 1000 nm (Figure 5C). It is worth noting that the greatest differences between the response of the reflectance parameters of different genotypes appear on 3–10 days of drought (age 17–24 days); with further development of drought, these differences decrease due to fatal for most plants structural and functional changes.
The effect of drought stress on normalized difference indices (NDIs) was assessed by analyzing heat maps of NDIs calculated at all studied wavelengths in the spectrum range from 400 to 1000 nm (Figure 6). The regions on heat maps (NDIs sets) that responded the earliest to changes in plants induced by soil moisture deficit were identified. In particular, statistically significant differences between NDIs of CC and DS plants were observed in the ranges: λ1 510–600, λ2 400–500; λ1 490–660, λ2 550–590; λ1 700–720, λ2 400–680; λ1 810–1000, λ2 780–800. An increase in the duration of drought stress was accompanied by an increase in the magnitude of the differences and their statistical significance (Figure 6). In addition, the areas on the NDI heat map showing a significant response to water deficit increased with the development of drought stress; starting from the seventh day of drought treatment and later, they covered almost the entire range studied.

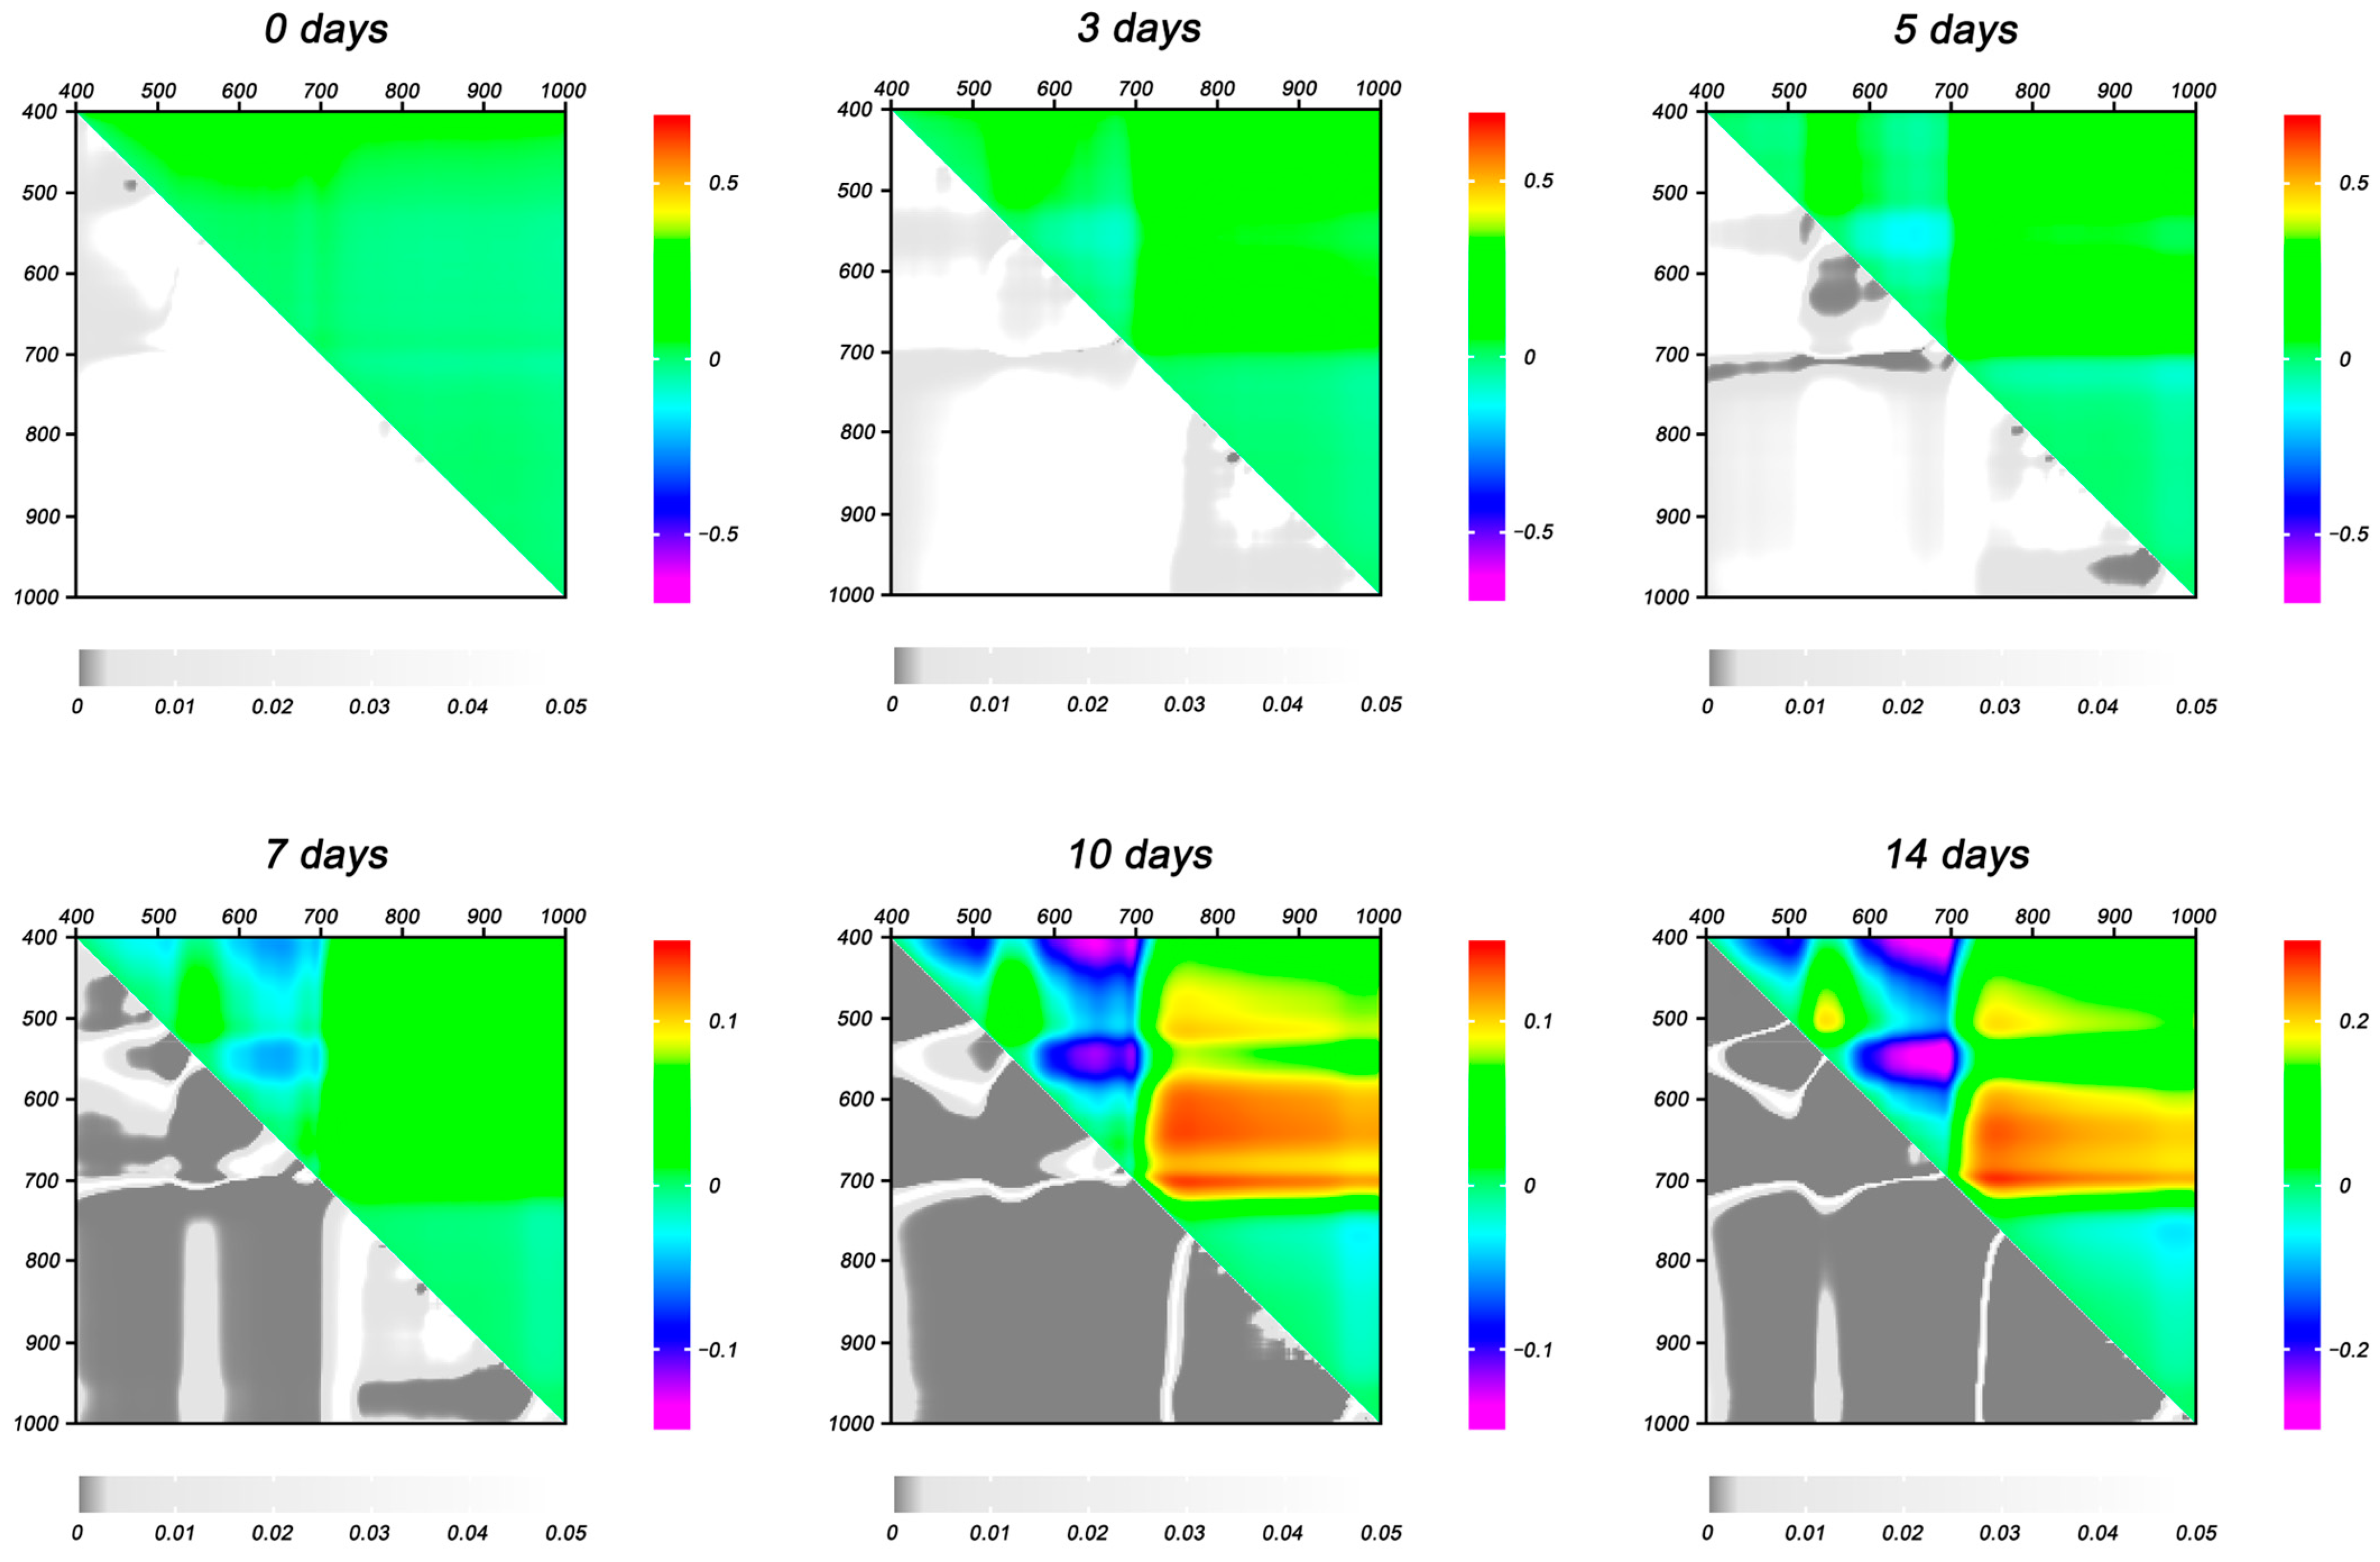
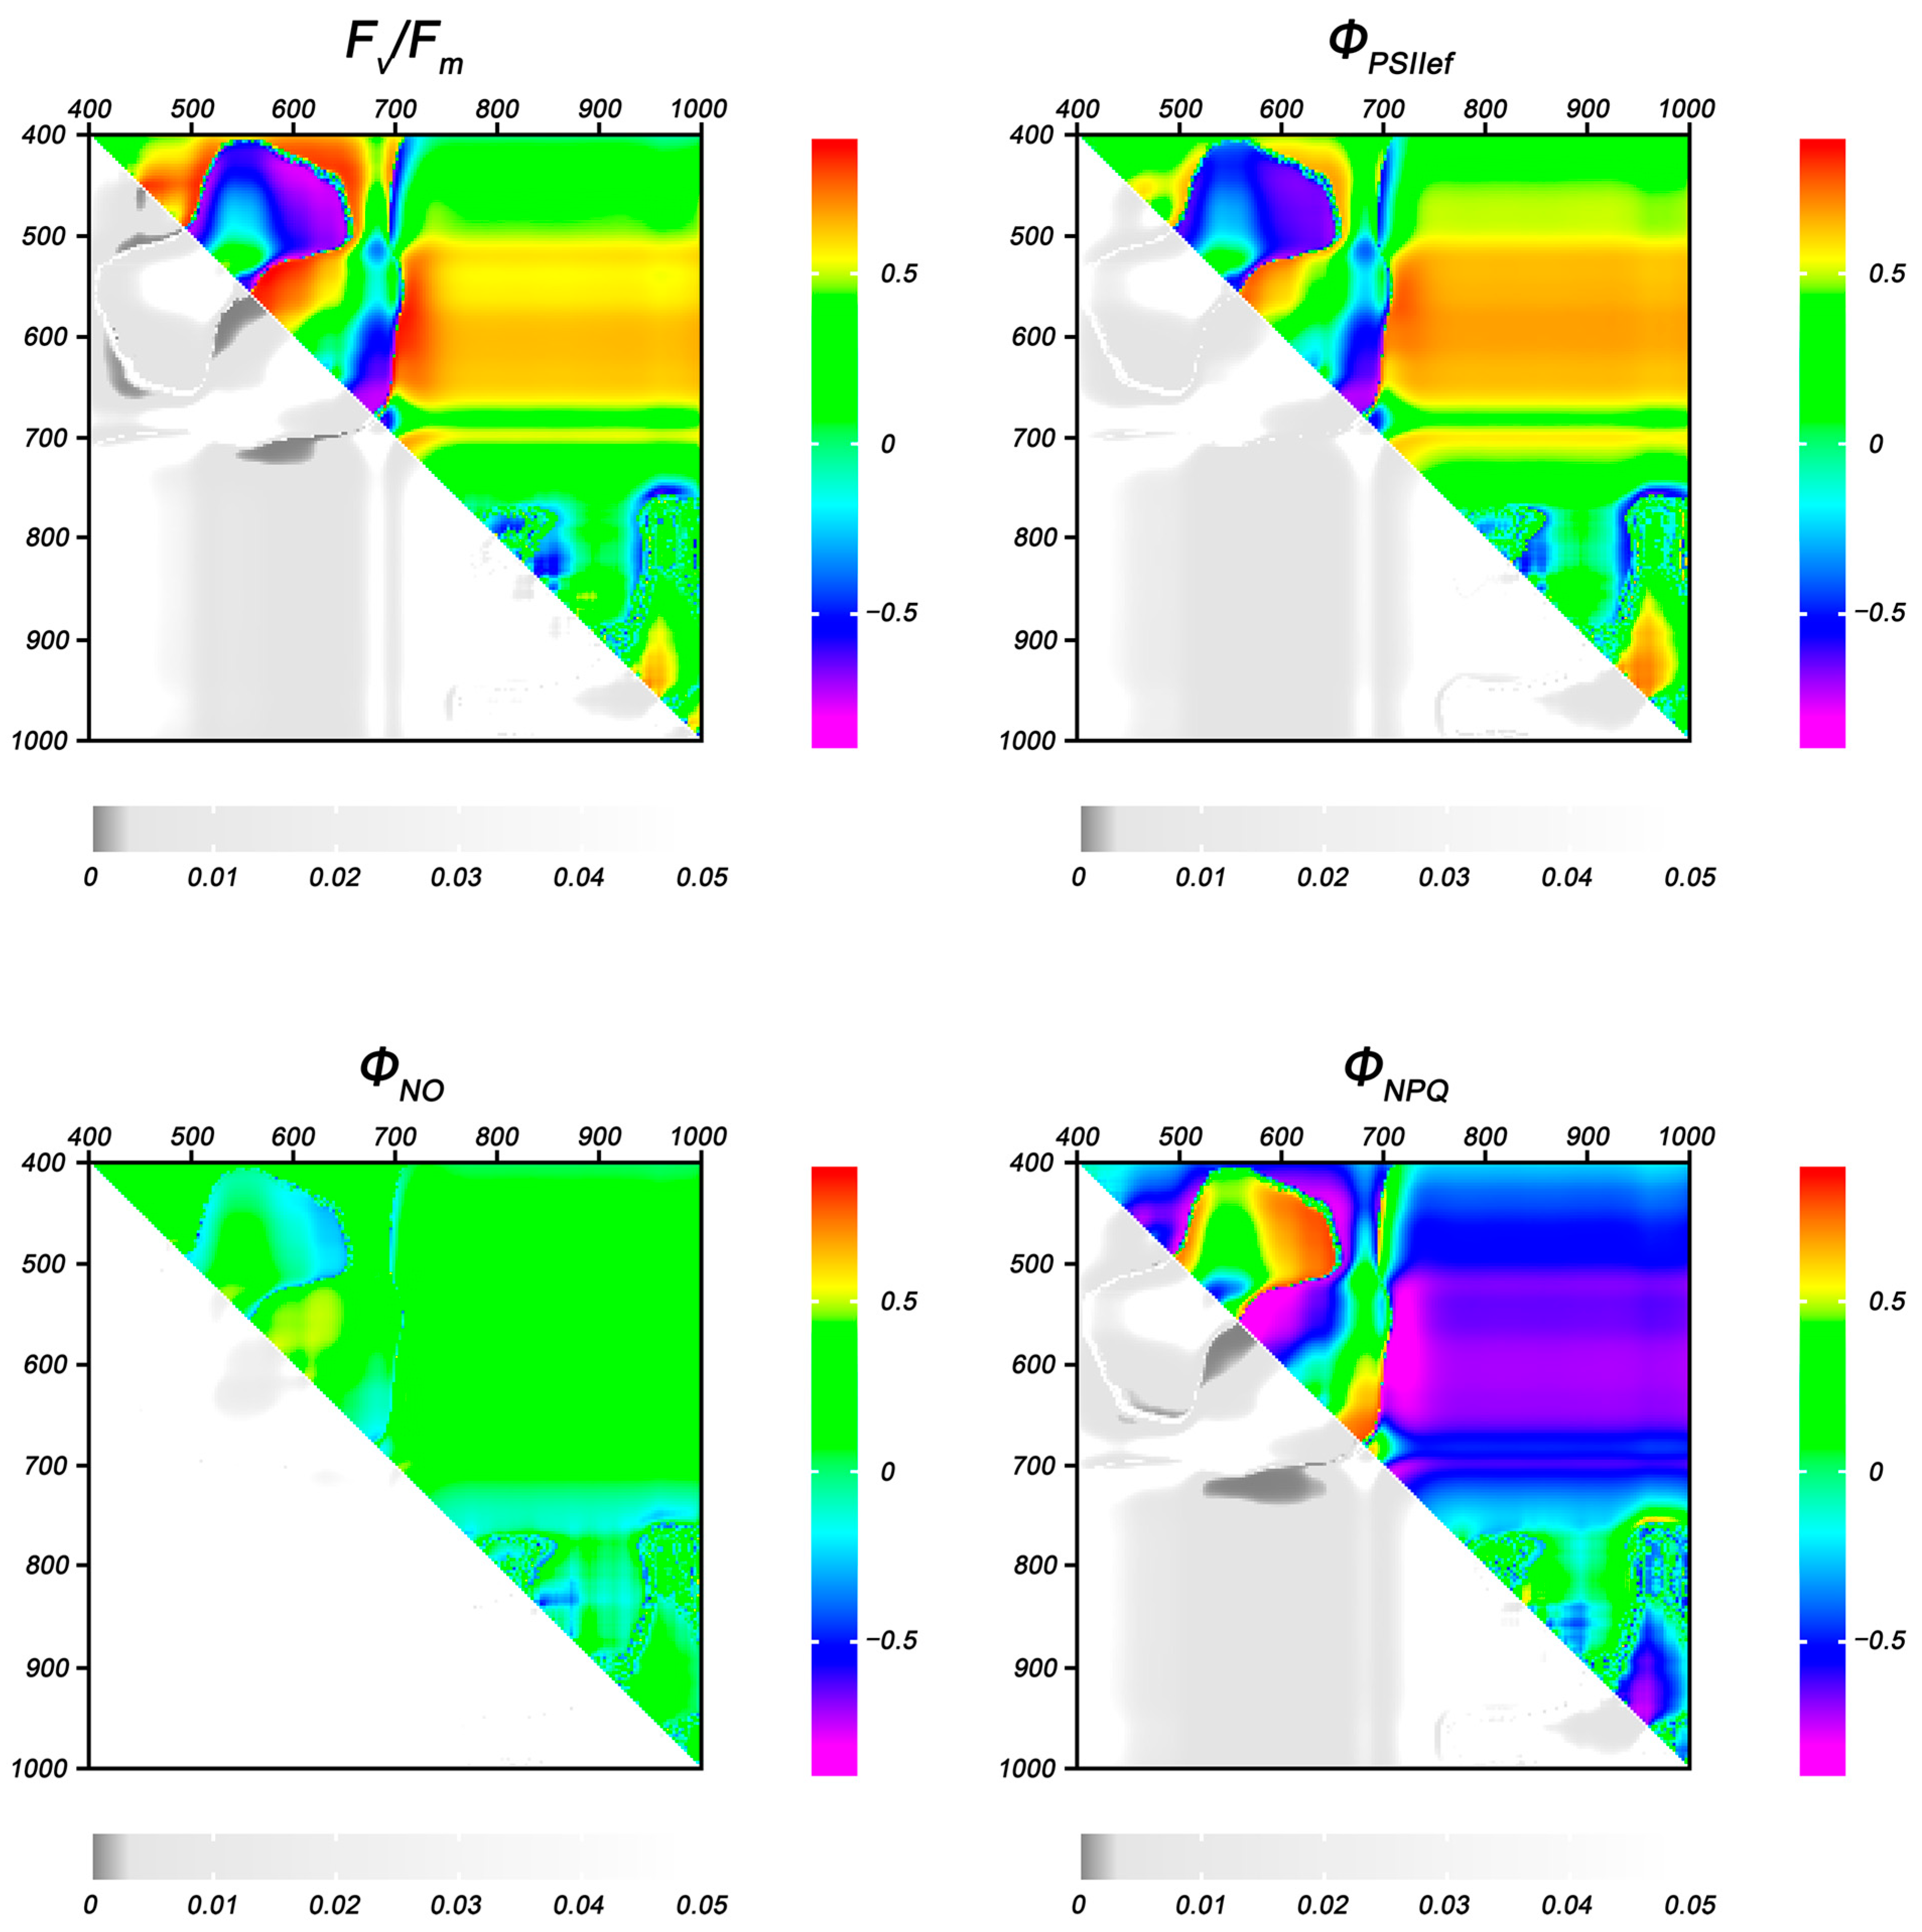
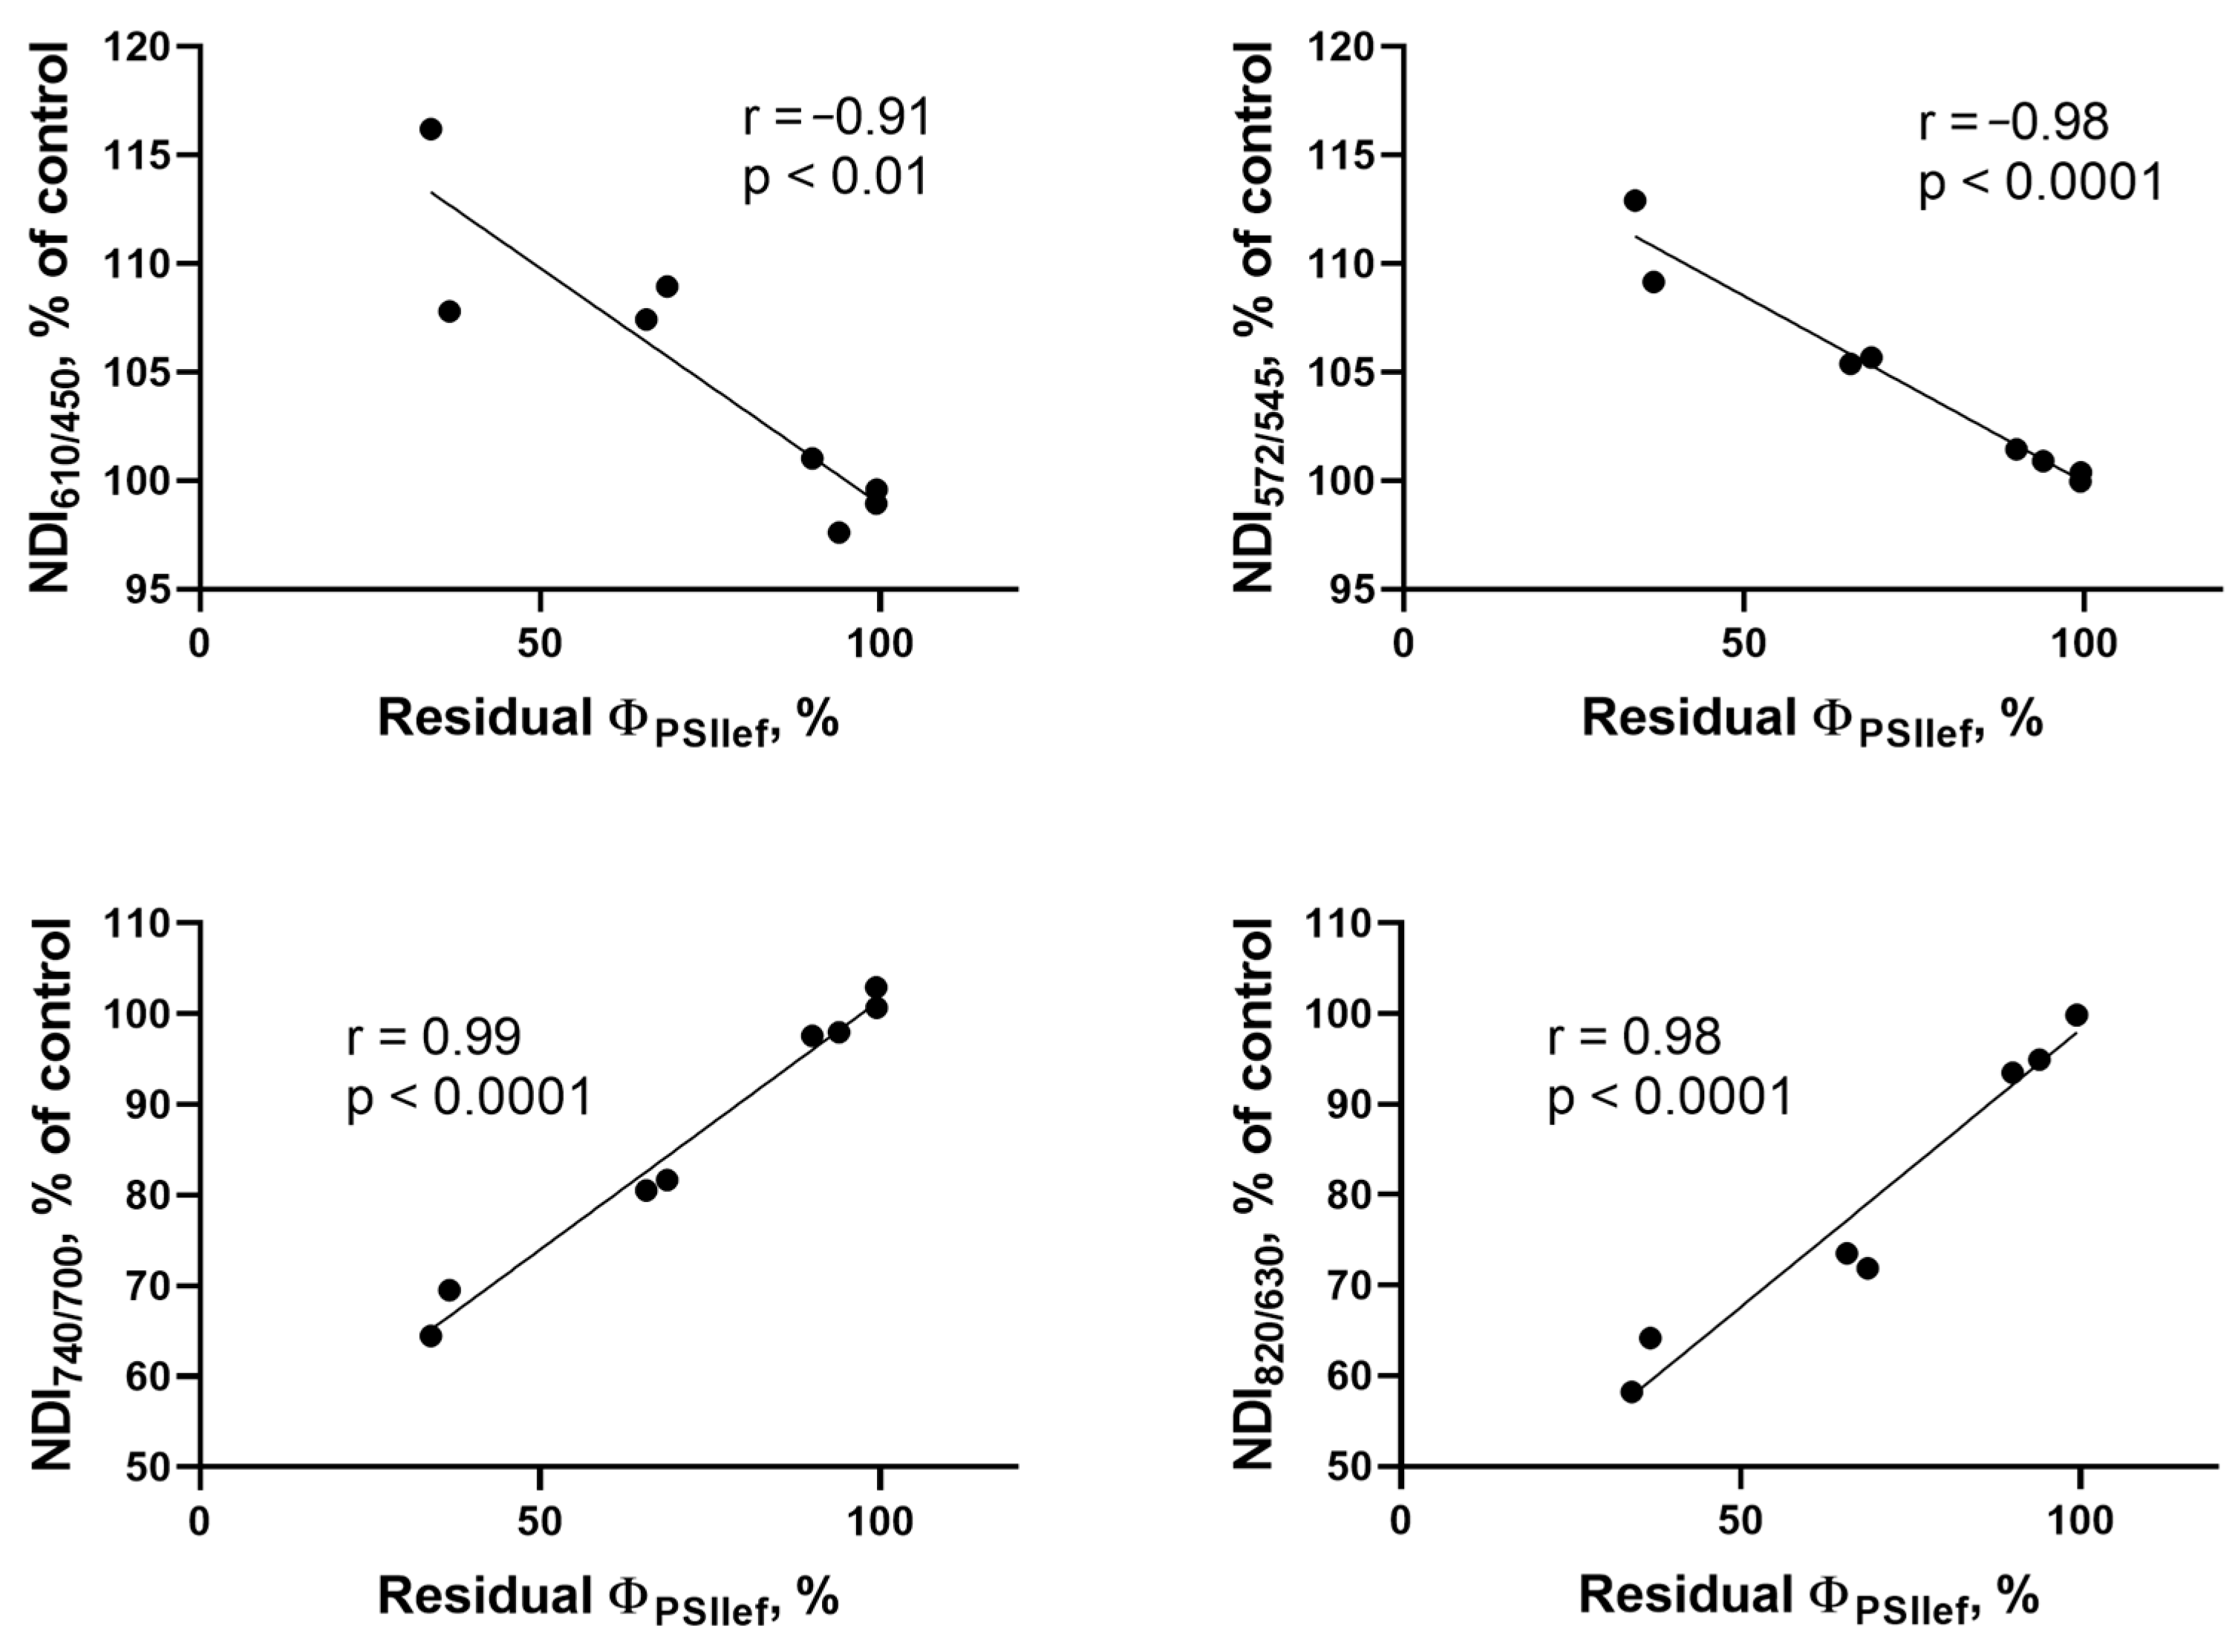
2.2. Search for NDIs Reflecting Photosynthetic Activity Under Drought Stress

A correlation analysis of the relationship between the residual levels of ChlF parameters and the values of NDIs in DS plants as a percentage of control was carried out to identify NDIs capable of serving as indicators of photosynthesis suppression under drought stress. Heat maps of the correlation coefficients of the indicated parameters at the fifth and 10th day of stress treatment are presented in Figure 7 and Figure 8.
It was shown that the widest areas on the NDI heat maps with statistically significant correlation were shown for Fv/Fm, ΦPSII, and ΦNPQ at the initial stage of drought (5 days of DS); the boundaries of these areas almost completely overlapped for the above ChlF parameters (Figure 7). The NDIs calculated at wavelengths λ1 580–640, λ2 440–500 nm showed the highest correlation coefficients (up to −0.77 for Fv/Fm, −0.69 for ΦPSII, and 0.80 for ΦNPQ); λ1 570–600, λ2 530–560 nm (up to 0.87 for Fv/Fm, 0.75 for ΦPSII, and −0.86 for ΦNPQ); λ1 665–690, λ2 580–660 nm (up to −0.74 for Fv/Fm, −0.75 for ΦPSII, and 0.76 for ΦNPQ); λ1 700–720, λ2 570–630 nm (to −0.85 for Fv/Fm, 0.77 for ΦPSII, and −0.87 for ΦNPQ). The residual level of ΦNO showed a statistically significant correlation in only one range of NDIs (λ1 575–640, λ2 530–570 nm); the maximum value of the correlation coefficient was 0.50.
With the increase in the duration of drought stress, the regions with statistically significant correlation expanded and covered a major part of the heat maps; the distribution patterns of these regions and their boundaries were close for all ChlF parameters (Figure 8). On the other hand, one of the regions showing a fairly high correlation with the residual values of ChlF parameters on the fifth day of DS (λ1 580–640, λ2 440–500 nm) partially lost significant relationship by the 10th day; the highest correlation coefficients were observed in the ranges λ1 585–610, λ2 440–460 nm and λ1 610–630, λ2 460–490 nm (−0.70, 0.60, and −0.75 for Fv/Fm, ΦPSII, and ΦNPQ, respectively). There was no statistically significant correlation with the residual levels of ΦNPQ in this range.
Given the distribution patterns of NDIs showing statistically significant correlation with residual ChlF parameters and the areas in the heat maps with the highest correlation coefficients, one NDI in each of the four areas described above was selected for further analysis: NDI610/450, NDI572/545, NDI740/700, and NDI820/630. The averaged drought-induced dynamics of these NDIs (in % of control) for each cultivar are shown in Figure S3.
At the next step, we analyzed the dynamics of NDI values of DS plants normalized to control values within the groups assigned according to the patterns of changes in photosynthetic activity (Figure 9). Analysis of the dynamics of changes in these NDIs showed that the greatest correspondence with the changes in current photosynthetic activity, estimated by the dynamics of the residual ΦPSII level, was revealed for NDI572/545; there was a clear separation between groups, similar to that for residual ΦPSII. For the majority of indices, multiple comparisons of quantitative characteristics of different groups showed less clear separation than for ΦPSII. NDI610/450 performed worse than other analyzed indices: the MT, HT, and HHT groups did not differ significantly from each other either at the fifth or at the 10th day of DS. At the same time, the patterns of changes of the other NDIs (NDI572/545, NDI740/700, and NDI820/630) during drought development correspond well to those for ΦPSII.
To quantitatively assess the applicability of DS plants’ NDIs normalized to control as indicators of the residual photosynthetic activity levels, correlation analyses of the relationships between these values were performed for the NT, MT, HT, and HHT groups on days 5 and 10 of drought (Figure 10). All NDIs showed high correlation with the residual ΦPSII; NDI610/450 showed the lowest degree of association with the residual ΦPSII (r = −0.91, p < 0.01 and NDI740/700 showed the highest (r = 0.99, p < 0.0001).
The next step was to analyze the possibility of using absolute values of NDIs of stressed plants to directly assess the current level of photosynthetic activity under drought stress. This approach eliminates the need for a control group of plants to perform the analysis (Figure 11). Correlation analysis of the relationship between absolute values of NDIs and ΦPSII of plants subjected to 5- and 10-day soil drought showed a strong statistically significant relationship of the studied values. The indices NDI572/545, NDI740/700, and NDI820/630 showed a high correlation with ΦPSII in DS conditions; however, no statistically significant relationship was shown in the case of NDI610/450 (r = −0.63, p > 0.05).

3. Discussion

3.1. Effect of Drought Stress on Morphophysiological Characteristics of Wheat

Water deficit causes changes in a number of morphophysiological characteristics in plants, leading to dramatic consequences under prolonged and/or high-intensity stress [28,29]. This effect is most pronounced at the stages of plant development characterized by intensive growth of vegetative parts [30,31]. It is worth noting that the sensitivity of wheat plants to water deficit changes during ontogenesis; the most critical developmental stages for survival and final productivity are tillering, booting, and flowering [30,31,32,33]. The rapid vegetative growth stage, which requires high water use intensity, is one of the most limiting stages during drought stress [30]. In the present work, studies were carried out at the stage of intensive vegetative growth of wheat plants for which acute rapid soil drought was the cause of a decrease in water content and biomass (dry matter) accumulation; the magnitude of changes in morphometric parameters varied among different genotypes.
One of the main reasons for the decrease in biomass accumulation is the suppression of photosynthetic activity [34], which was recorded in this study under soil moisture deficit conditions in all the wheat cultivars studied. ChlF parameters changed at different stages of drought development. In particular, a decrease in ΦPSII and an increase in ΦNPQ were observed 5 days after stopping irrigation. A longer and more intensive 10-day drought resulted, along with the changes described, in a fall in Fv/Fm and an increase in ΦNO. The directionality and dynamics of changes in ChlF parameters are consistent with the data described in other works [35,36,37,38,39,40,41]. A meta-analysis of the drought effects on wheat showed a decrease in ΦPSII and Fv/Fm; and the decrease in Fv/Fm was enhanced under more severe drought conditions [36]. The work [37] showed a decline in Fv/Fm on the fourth and fifth day and an increase in NPQ on the third, fourth, and fifth day of acute drought. In [38], a multiphase development of drought was shown; the increase in NPQ (days 13–17 after irrigation was stopped) was followed by a decrease in Fv/Fm and a greater decline in NPQ (days 18–24). It is worth noting that in most cases, as in our present study, ChlF parameters that characterize the rate of photosynthetic electron-transport chain activity (e.g., ΦPSII, NPQ, ΦNPQ, etc.) respond to drought stress earlier than parameters that characterize the functional integrity of the PSA (e.g., Fv/Fm) [42,43,44]. This effect is caused by the complex reaction of the plant to drought, one of the first stages of which is the closure of stomata and reduction in RuBisCO activity, which reduces the rate of the Calvin–Benson cycle and, as a consequence, causes suppression of linear electron transport in the PETC. In this case, a decrease in ΦPSII, qP, and ETR and an increase in NPQ, ΦNPQ, qN, etc., are observed. The increased production of ROS accompanying these events leads to damage to photosynthetic proteins and thylakoid membranes. Such changes significantly contribute to photosynthetic activity under intense and/or long-term drought stress and are detected together with a decrease in Fv/Fm and, in some cases, a decrease in NPQ [14].
In the present study, the choice of ΦPSII as the main parameter characterizing photosynthetic activity was based on two factors. Firstly, ΦPSII is an indicator of the efficiency of absorbed light energy use for the photosynthetic process; although it does not directly estimate the photosynthetic intensity, it shows a high correlation with CO2 assimilation [45]. Secondly, as mentioned above, ΦPSII as a parameter characterizing the rate of electron transport in PETC is one of the most stress-sensitive parameters responding in the early stages of drought stress and at moderate stress intensity.
Analysis of the dynamics of photosynthetic activity of individual genotypes during the progression of drought stress allowed us to identify four patterns of photosynthetic activity changes, according to which the studied genotypes were divided into four groups: a group with low photosynthetic tolerance (NT), a group with tolerance of PSA to moderate short-term drought stress (MT), a group with high photosynthetic tolerance to high-intensity drought stress due to early decrease in the rate of PETC (HT), and a group of genotypes maintaining high rate of photosynthetic reactions under both moderate and more intense drought (HHT). The identified patterns probably reflect different strategies of plant behavior under drought stress.
Drought stress tolerance is a complex parameter dependent on a number of crop traits [46,47]. In wheat, most of the stress tolerance traits are polygenic and hence difficult to understand at physiological and molecular levels [48]. Currently, no single trait can be used to fully and accurately assess drought tolerance in wheat [47]. In this case, an approach based on combined indicators is used for this purpose [10,47].
Examples of different response strategies of wheat photosynthetic activity to drought have been described in the literature [49,50,51,52,53,54,55,56]. In particular, two drought-tolerant genotypes (Drysdale and Hollis) performed different drought response strategies [54]. Drysdale relies more on NPQ mechanisms to maintain high photosynthetic rates under drought conditions; Hollis is more efficient in combating stress-related ROS and oxidative damage. Under progressive drought, ChlF parameters Fv/Fm and ΦPSII decreased in Hollis, but were not significantly affected in Drysdale. Also, NPQ values were significantly lower throughout the drought period in the Hollis genotype. Analysis of two NPQ components, high-energy quenching (qE) and photoinhibitory-dependent quenching (qI), showed similar qE values for both genotypes, but significantly higher qI values in Drysdale. Another example of different strategies is shown by the cultivars Othalom and Kobomugi: Kobomugi retains water in the tissues by rapid closure of the stomata, maintaining osmotic potential and photosynthetic activity of the leaves, while Othalom starts to recover turgor after a relatively long phase of intense water loss due to late closure of the stomata in response to drought [56]. A comparison of the photosynthetic activity of the tall cultivar Slomer and the modern high-yielding semi-dwarf cultivar Enola showed that the higher chlorophyll content of Slomer does not fully ensure high photosynthetic efficiency. In contrast, the reduced chlorophyll content of Enola probably represents an efficient strategy to protect photosynthesis from photoinhibition and oxidative damage under stress conditions. This contributes to avoiding excessive light energy absorption and increasing the quantum efficiency of PSII, thereby maintaining an optimal photosynthetic rate [53].
Among the causes of differences in the dynamics of changes in photosynthesis activity during the drought development, differences in the level of inactivation and damage of various cell components involved in the photosynthesis process can be assumed. They can be caused by genetic features of antioxidant and hormonal systems functioning, as well as by the rate of development and intensity of different NPQ components. Rapid damage to photosystems may be caused by excessive production of ROS [15]. NPQ, as a mechanism to protect the PETC from photodamage, can suppress photosynthetic activity and simultaneously reduce the excess load on photosystems under drought stress [11,57]. In addition, the production of stress phytohormones, especially abscisic acid, is one of the key mechanisms regulating the functioning of stomata, the aperture of which affects both water loss by transpiration and CO2 availability, directly affecting photosynthetic activity [58].
The study of the specificity of photosynthetic response of different wheat genotypes to drought stress is an important task in the development of new tolerant cultivars with optimal behavioral strategies for their successful cultivation in specific regions. It is worth noting that photosynthetic activity studies based on gas exchange or ChlF parameters recording have limitations for the mass screening of a large number of genotypes, especially under field conditions [19,59]. A more high-throughput method for assessing plant morphophysiological traits is spectral imaging [20,60].

3.2. Relationship Between Photosynthetic Activity Parameters and NDIs

Soil drought induced changes in the reflectance parameters of wheat seedlings, including absolute values of reflectance and NDIs calculated in the wavelength range from 400 to 1000 nm; these changes increased with the duration of stress exposure. The greatest alterations in the reflectance coefficients were observed in the 550–700 nm and 730–1000 nm ranges. The qualitative and quantitative characteristics of the reflectance spectrum in the first range are due to the optical properties of pigments, primarily chlorophyll [20,61], which indicates changes in the pigment composition of the studied plants as a result of drought stress. Reflectance in the second most sensitive range of the spectrum shown in this work is characterized by a dependence on the structural characteristics of leaf tissues, in particular the size of the cells and intercellular spaces in the mesophyll [62]. The drought-induced shifts in the shape of wheat reflectance spectra revealed in the present work are consistent with data from other studies [63,64] and confirm the effect of drought stress on the spectral parameters of green plant parts.
NDIs also showed sensitivity to water deficit: statistically significant changes in some areas in VIS and NIR ranges were detected already three days after irrigation was stopped. With increasing duration of stress, the drought-sensitive regions in the heat maps of NDIs expanded and covered almost the whole range under study seven days after stopping irrigation. The most sensitive regions identified in our work include indices described in the literature as promising for the detection of drought stress in wheat. In particular, the sensitive regions identified at the fifth day of drought included wavelength ranges that are used to calculate a number of reflectance indices for which applicability to early detection of drought stress in wheat has been shown: Photochemical Reflectance Index (PRI = (R31R570)/(R531 + R570)), Photosynthetic Vigor Ratio (PVR = (R550R650)/(R550 + R650)), Greenness Index (G = R554/R677) [26,37]. Indices detecting more long-term drought in other papers (Lichtenthaler Index 1 (LIC1 = (R800R680)/(R800 + R680)), Renormalized Difference Vegetation Index (RDVI = (R800R670)/(R800 + R670)), Normalized Difference Vegetation Index NDVI = (R780R670)/(R780 + R670), Water Index (WI = R900/R970), Plant Pigment Ratio (PPR = (R550R450)/(R550 + R450)) [26,27] also showed early changes (5 days after stopping irrigation) in response to water deficit in the present study.
Seven days after irrigation stopped, the sensitive zones expanded into the wavelength ranges used to calculate the following indices: Carter Index 1 (CTR1 = R695/R420), Normalized Pigment Chlorophyll Index (NPCI = (R680 − R430)/(R680 + R430)), Red-edge Normalized Difference Vegetation Index (RNDVI = (R750R705)/(R750 + R705)), Zarco-Tejada and Miller (ZM = R750/R710), Vogelmann Red Edge Index 1 (VOG1 = R740/R720), NIR Shoulder Region Spectral Ratio Index (NSRI = R890/R780), Simple Ratio Pigment Index (SRPI = R430/R680), Gitelson–Merzlak Index 1 (GM1 = R750/R550), and Normalized Phaeophytinization Index (NPQI = (R415R435)/(R415 + R435)). These indices showed a relationship with plant or soil water content, and allowed detection of the effects of water deficit in wheat plants in previous works [26,65,66,67].
All four NDIs analyzed in this study showed a strong relationship with photosynthetic activity estimated by the ΦPSII value. In addition, the groups of cultivars composed on the basis of the patterns of drought-induced ΦPSII changes showed similar patterns of changes of the selected indices, which suggests the good applicability of these indices for estimating photosynthetic activity parameters under drought stress. Among the four proposed indices, NDI572/545 and NDI820/630 combined high correlation with ΦPSII under drought and high sensitivity to stress: most of the cultivars showed statistically significant changes in these indices 3–5 days after stopping irrigation.
NDI610/450 is close to the index of PPR (550/450 nm). This index reflects pigment composition [68] and shows a relationship with the water status of the plant [26]. This relationship may be explained by the fact that chlorophylls and carotenoids show absorption peaks around 450 nm and changes in their concentration affect the intensity of reflectance in this region [69]. In the present study, the index NDI610/450 showed changes at drought stress duration comparable to the duration required to detect Fv/Fm and ΦNO shifts (10 days after stopping irrigation), which indirectly confirmed the association of changes in this index with drought-induced alterations in the pigment composition of wheat leaves.
NDI572/545 lies within the range of wavelengths used to calculate the normalized difference index PRI. High sensitivity to water stress as well as relationship with plant water content is shown for this index [37]. PRI reflects conversions in the violaxanthin cycle and is related to NPQ and photosynthetic efficiency [70]. It can also vary as a result of changes in leaf chlorophyll content [71]. The NDI572/545 used in the present work showed an increase, which corresponds to its decrease in the case if the wavelengths for the calculation were used in analogy with the PRI: λ1 545 nm, λ2 572 nm. In [37], the modified PRI calculated using wavelengths λ1 545 nm, λ2 570 nm declined in response to acute short-term drought in wheat seedlings, which is consistent with our results. The authors attributed this effect to fast-relaxing changes in PRI, which are probably related to alterations in light scattering in this range caused by chloroplast shrinkage. In our work, NDI572/545 detected drought stress at early stages of its development (starting 3–5 days after stopping irrigation for different genotypes) simultaneously with detecting changes in ChlF parameters ΦPSII and NPQ.
NDI740/700 is calculated using wavelengths close to the simple ratios ZM (750/710) and VOG1 (740/720), and to the normalized difference index RENDVI (750/705). In the literature, they are shown to be related to the water content in shoots, as well as to chlorophyll content [26,72]. Changes in these indices, as in the case of the NDI740/700 we studied, are associated with changes in reflectance in the edge–edge band, which is a very sensitive range to stress [63,64] and reflects the chlorophyll content in the plant [73,74]. Similar to NDI610/450, NDI740/700 showed pronounced changes 10 days after stopping the irrigation, which is comparable to the timing of drought-induced changes in ChlF parameters reflecting the structural and functional integrity of photosystems (Fv/Fm and ΦNO).
The fourth promising index NDI820/630 lies in the region of wavelengths used to find LIC1 (800/680), RDVI (800/670), and NDVI (780/670). All these indices have shown potential for drought detection and, in the case of NDVI, a relation to the water status of the plant [26,75]. In our work, NDI820/630 decreased in response to drought, which is consistent with the directionality of changes in the mentioned indices. Along with NDI572/545, NDI820/630 showed statistically significant changes earlier than the indices NDI610/450 and NDI740/700 (5 days after stopping irrigation), which, together with the high correlation between this index and ΦPSII under drought, makes it promising for use in screening genotypes for drought tolerance and the sensitivity of photosynthesis to water deficit.
At the present time, the idea of using spectral imaging techniques to estimate parameters related to photosynthesis activity in plants is widespread [76]. This is primarily based on the fact that spectral imaging methods have higher throughput than techniques for recording ChlF parameters [59,77,78]. This fact, together with the good agreement between NDIs and PAM parameters shown in this work, argues in favor of the promising potential of an approach based on the use of specific reflectance indices to estimate photosynthetic activity parameters when investigating the response of genotypes to drought stress during the breeding process.

4. Materials and Methods

4.1. Plant Material

The seedlings of twenty four cultivars of soft spring wheat (Triticum aestivum L.) were used in the research: Temp, Ekada 279, Karavayka, Modava, Pamyati Tyunina, L-III, SU Akhab, Traditsiya, Blesk, Zagadka, Ul’yanovskaya 105, Nitsa, Vestochka 17, Madam, Znamya, Katun’, Sviyaga, Iren’, Zlata, Happy, Zaural’skaya volna, Zaural’skiy yantar’, Astrid, Sudarynya (hereinafter, cultivars C1–C24, respectively). The genetic diversity of the cultivars used was expected to provide variability in the responses of plants of different genotypes to drought.

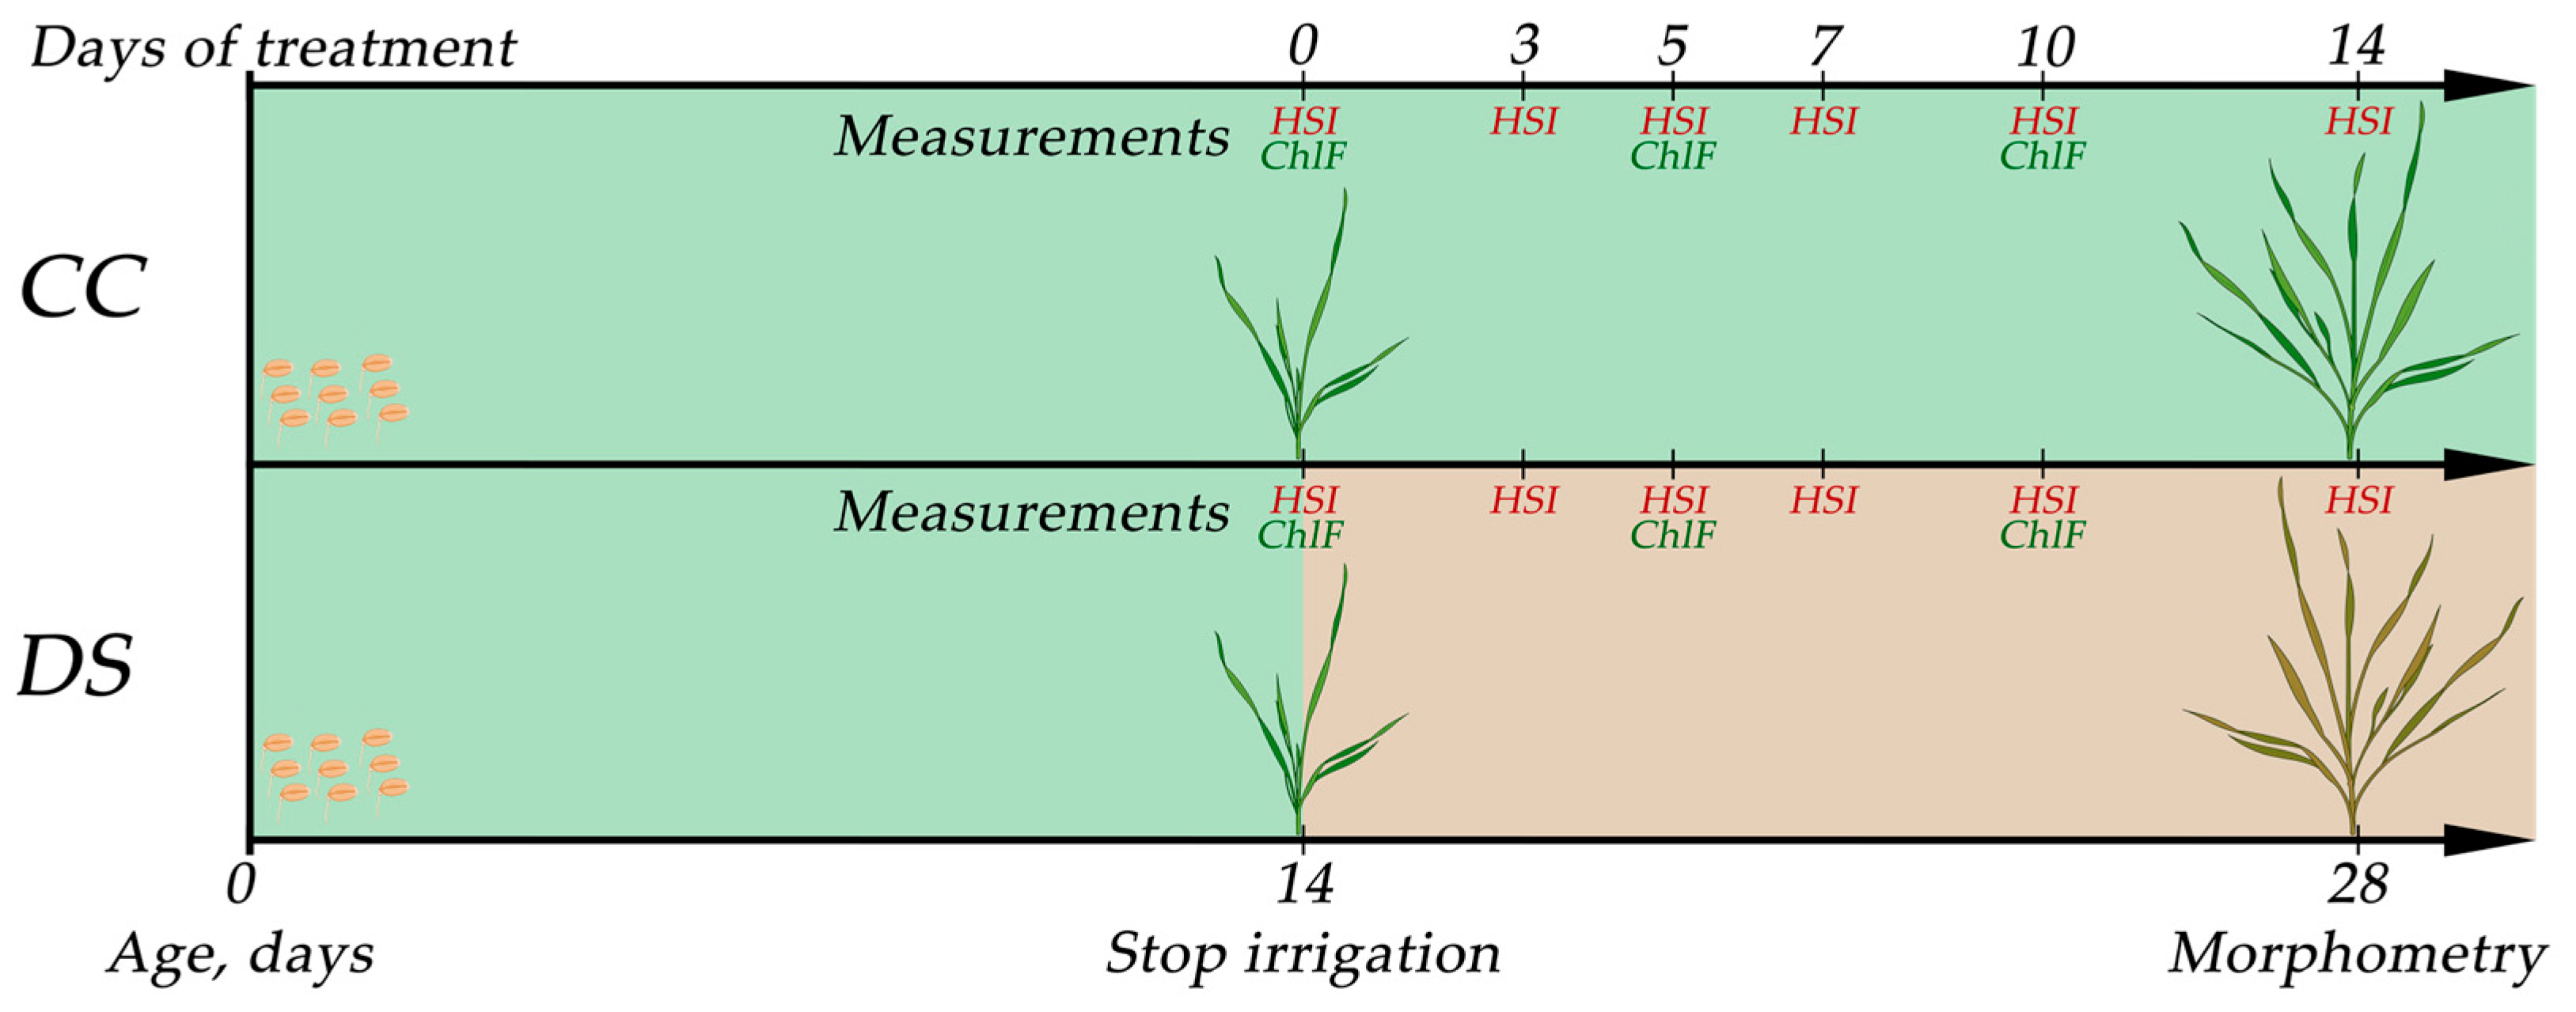
4.2. Experiment Design

Plants were grown in pots (7 cm × 7 cm × 7 cm (343 mL), 5 plants per pot) with commercial peat soil (Peter Peat Agro Black, Peter Peat, Moscow, Russia), where levels of NPK were 100 mg/l N, 80 mg/l P, 130 mg/l K, and pH was at least 5.5. A pot experiment was carried out under controlled conditions in a vegetation room at air temperature 24 °C, relative humidity of about 50%, and a photoperiod of 16/8 (light/dark) with LED light (LED Cool White/6500 K, 50 W, IEK, Moscow, Russia) with 220 μmol m−2 s−1 light intensity.
Plants of each cultivar were divided into two groups. In the control group (CC), plants were irrigated every 2 days throughout the entire experiment to maintain soil moisture at least 70%, calculated as:
WC soil = FW DW FW 100 % ;
in the drought-stressed group (DS), the irrigation of plants was stopped at the age of 14 days to create the soil drought conditions. The measurements of the reflectance parameters were conducted at the age of 14, 17, 19, 21, 24, and 28 days (before DS and after 3, 5, 7, 10, and 14 days of DS) for all experimental groups. The ChlF parameters were recorded at the age of 14, 19, and 24 days (before DS and after 5 and 10 days of DS) (Figure 12). Morphometric parameters were evaluated at the age of 28 days.

4.3. Morphometric Parameters

Fresh (FW) and dry (DW) weight of wheat plants were evaluated at the age of 28 days. Wheat plant were weighed using an analytical balance (Adventurer AX324, Ohaus, Parsippany, NJ, USA), then placed in the drying oven for 4 h at 100 °C; DW of the plants was then determined using the analytical balance.
The water content (WC) in wheat plants was calculated as:
WC plant = FW DW FW 100 % .

4.4. ChlF Parameters

Photosynthetic activity parameters were recorded using a ChlF-imaging system based on pulse-amplitude modulation (PAM) technology (Plant Explorer PRO+, PhenoVation, Netherlands). The dark ( F 0 ) and maximum ( F m ) fluorescence yields in were measured after 10 min of dark adaptation. Actinic light (AL, cool white light, 200 μmol m−2 s−1) was then switched on. The current ( F t ) fluorescence yield and the maximum fluorescence yield F m in the light-adapted state were determined 10 min after AL was switched on. The maximum fluorescence yields in the dark- and light-adapted state ( F m and F m , respectively) were measured using a saturating pulse (cool white light, 4000 μmol m−2 s−1, 800 ms duration, 6500 K).
The recorded values were used to calculate the following parameters of photosynthetic activity: the maximum quantum efficiency of PSII ( F v / F m ) , the effective photochemical quantum yield of PSII (ΦPSII), the quantum yield of regulated non-photochemical energy dissipation in PSII (ΦNPQ), and the quantum yield of non-regulated non-photochemical energy loss in PSII (ΦNO). The values of F v / F m , ΦPSII, ΦNPQ, and ΦNO were calculated by the software integrated into the registration system using the equations:
F v / F m = F m F 0 F m ,
Φ PSII = F m F t F m ,
Φ NPQ = F F m F F m ,
Φ NO = F t F m ,
where F 0 is the minimum ChlF level after dark adaptation, F m is the maximum ChlF yield after dark adaptation, F m is the maximum ChlF yield in the light-adapted state, and F t is the current ChlF level under the light [45,79].
To evaluate the effect of DS on photosynthetic activity of wheat plants, the residual values of the parameters F v / F m , ΦPSII, ΦNPQ, and ΦNO were calculated as a percentage of the control [35]:
Parameter resid = Parameter drought Parameter control 100 % .

4.5. Reflectance Parameters

The reflectance parameters of wheat plants were recorded using a hyperspectral camera (Specim IQ, Spectral Imaging Ltd., Oulu, Finland). Images were acquired under controlled lighting conditions using halogen light sources and then analyzed using software for hyperspectral data processing developed by the authors. To process the hyperspectral images, the background was excluded, then regions of interest (ROIs) were placed. Each ROI covered the entire aboveground part of plants of one pot (5 plants) above 3 cm from the soil. Thus, one reflectance spectrum was obtained from each ROI. The range of the analyzed reflectance spectra was from 400 to 1000 nm in 3 nm steps.
Normalized difference indices (NDIs) were calculated for each wavelength combination using the equation:
NDI = I λ 1   I λ 2 I λ 1 +   I λ 2 ,
where I λ 1 and I λ 2 are the values of the reflectance coefficient at the wavelengths λ1 and λ2, respectively.
To evaluate the effect of DS on the reflectance parameters, the values of NDIs were calculated as a percentage of the control:
NDI ,   % = NDI drought NDI control 100 % .

4.6. Statistics

GraphPad Prism 8 (GraphPad Software Inc., San Diego, CA, USA), Microsoft Excel (Microsoft Corporation, Redmond, WA, USA), and R (R Core Team (2022). R: A language and environment for statistical computing. R Foundation for Statistical Computing, Vienna, Austria. URL https://www.R-project.org/, accessed on 2 September 2024) software were used for the statistical processing of the results. The results of the analyses are presented as mean values with standard errors of the mean (SEM), averaged curves with SEM, averaged reflectance spectra, and heat maps of the difference in values between the CC and DS groups and Pearson correlation coefficients. Morphometric parameters were assessed integrally for a pot (5 plants) and calculated for an individual plant (n = 4 for each cultivar and treatment). The ChlF and reflectance parameters were assessed integrally for a pot (5 plants) (n = 4 for each cultivar and treatment). The Kolmogorov–Smirnov test was used to assess the normality of data distribution. Data were analyzed using one-way analysis of variance (ANOVA) followed by Tukey’s test. The t-test was used to evaluate the level of significance of differences between the parameters of the CC and DS groups. p < 0.05 was considered significant.

5. Conclusions

The present study has shown the prospects of using high-throughput spectral methods to estimate photosynthetic activity under drought. It was shown that soil drought causes a decrease in photosynthetic activity in wheat plants. Four patterns of drought-induced changes in photosynthesis were revealed depending on the time and severity of its suppression. In addition, it was shown that drought induces changes in reflectance parameters of wheat shoots, including reflectance coefficients and normalized difference indices (NDIs) calculated in the range from 400 to 1000 nm. It was found that NDIs calculated in specific wavelength ranges are related to the photosynthetic parameters during the development of drought stress and can be used to assess the photosynthetic activity of wheat plants under water deficit conditions. Among the identified promising indicators, we selected two NDIs that combined high sensitivity to soil drought at an early stage and high correlation with the intensity of photosynthetic processes.
At the same time, the issue of the physiological basis of the diagnostic potential of the proposed indices remains insufficiently investigated. Disclosure of the mechanisms underlying the relationship between the response of spectral parameters and the intensity of photosynthetic processes to drought requires a detailed analysis of other structural and functional parameters of plants that influence both spectral characteristics and photosynthetic activity.
The developed approach for identification of promising spectral indices for assessment of physiological features of plants can be included in agricultural practice and used for optimizing and accelerating large-scale screening of breeding material and assessing the specific features of the response of individual genotypes to drought development.

Supplementary Materials

The following supporting information can be downloaded at: https://www.mdpi.com/article/10.3390/plants14010091/s1, Figure S1: ChlF parameters of wheat seedlings of CC (shaded bars) and DS (solid bars) groups at different days after stopping the irrigation; Figure S2: The residual values of ChlF parameters of wheat seedlings at different days after stopping the irrigation; Figure S3: Drought-induced dynamics of NDIs of DS wheat plants (in % of control).

Author Contributions

Conceptualization, V.V. and O.S.; methodology, F.A. and O.S.; software, M.L.; investigation, F.A., D.C. and O.S.; data curation, O.S.; writing—original draft preparation, F.A., D.C., P.P. and O.S.; writing—review and editing, V.V. and O.S.; visualization, F.A., D.C. and O.S.; funding acquisition, O.S. All authors have read and agreed to the published version of the manuscript.

Funding

The research was funded by the Russian Science Foundation (project no. 23-26-00212).

Data Availability Statement

Data are contained within the article and Supplementary Materials.

Conflicts of Interest

The authors declare no conflicts of interest.

References

  1. Shiferaw, B.; Smale, M.; Braun, H.-J.; Duveiller, E.; Reynolds, M.; Muricho, G. Crops That Feed the World 10. Past Successes and Future Challenges to the Role Played by Wheat in Global Food Security. Food Secur. 2013, 5, 291–317. [Google Scholar] [CrossRef]
  2. Erenstein, O.; Jaleta, M.; Mottaleb, K.A.; Sonder, K.; Donovan, J.; Braun, H.-J. Global Trends in Wheat Production, Consumption and Trade. In Wheat Improvement; Springer International Publishing: Cham, Switzerland, 2022; pp. 47–66. ISBN 978-3-030-90672-6. [Google Scholar]
  3. Bohra, A.; Choudhary, M.; Bennett, D.; Joshi, R.; Mir, R.R.; Varshney, R.K. Drought-Tolerant Wheat for Enhancing Global Food Security. Funct. Integr. Genom. 2024, 24, 212. [Google Scholar] [CrossRef] [PubMed]
  4. Trnka, M.; Feng, S.; Semenov, M.A.; Olesen, J.E.; Kersebaum, K.C.; Rötter, R.P.; Semerádová, D.; Klem, K.; Huang, W.; Ruiz-Ramos, M.; et al. Mitigation Efforts Will Not Fully Alleviate the Increase in Water Scarcity Occurrence Probability in Wheat-Producing Areas. Sci. Adv. 2019, 5, eaau2406. [Google Scholar] [CrossRef]
  5. Mukhopadhyay, R.; Sarkar, B.; Jat, H.S.; Sharma, P.C.; Bolan, N.S. Soil Salinity under Climate Change: Challenges for Sustainable Agriculture and Food Security. J. Environ. Manag. 2021, 280, 111736. [Google Scholar] [CrossRef] [PubMed]
  6. Angon, P.B.; Tahjib-Ul-Arif, M.; Samin, S.I.; Habiba, U.; Hossain, M.A.; Brestic, M. How Do Plants Respond to Combined Drought and Salinity Stress?—A Systematic Review. Plants 2022, 11, 2884. [Google Scholar] [CrossRef] [PubMed]
  7. Tarolli, P.; Luo, J.; Park, E.; Barcaccia, G.; Masin, R. Soil Salinization in Agriculture: Mitigation and Adaptation Strategies Combining Nature-Based Solutions and Bioengineering. iScience 2024, 27, 108830. [Google Scholar] [CrossRef]
  8. Chaves, M.M.; Flexas, J.; Pinheiro, C. Photosynthesis under Drought and Salt Stress: Regulation Mechanisms from Whole Plant to Cell. Ann. Bot. 2009, 103, 551–560. [Google Scholar] [CrossRef]
  9. Pinheiro, C.; Chaves, M.M. Photosynthesis and Drought: Can We Make Metabolic Connections from Available Data? J. Exp. Bot. 2011, 62, 869–882. [Google Scholar] [CrossRef]
  10. Fang, Y.; Xiong, L. General Mechanisms of Drought Response and Their Application in Drought Resistance Improvement in Plants. Cell. Mol. Life Sci. 2015, 72, 673–689. [Google Scholar] [CrossRef] [PubMed]
  11. Qiao, M.; Hong, C.; Jiao, Y.; Hou, S.; Gao, H. Impacts of Drought on Photosynthesis in Major Food Crops and the Related Mechanisms of Plant Responses to Drought. Plants 2024, 13, 1808. [Google Scholar] [CrossRef]
  12. Dalal, V.K. Modulation of Photosynthesis and Other Proteins during Water–Stress. Mol. Biol. Rep. 2021, 48, 3681–3693. [Google Scholar] [CrossRef] [PubMed]
  13. Wang, J.; Zhang, X.; Han, Z.; Feng, H.; Wang, Y.; Kang, J.; Han, X.; Wang, L.; Wang, C.; Li, H.; et al. Analysis of Physiological Indicators Associated with Drought Tolerance in Wheat under Drought and Re-Watering Conditions. Antioxidants 2022, 11, 2266. [Google Scholar] [CrossRef]
  14. Abdullaev, F.; Pirogova, P.; Vodeneev, V.; Sherstneva, O. Chlorophyll Fluorescence in Wheat Breeding for Heat and Drought Tolerance. Plants 2024, 13, 2778. [Google Scholar] [CrossRef]
  15. Reddy, A.R.; Chaitanya, K.V.; Vivekanandan, M. Drought-Induced Responses of Photosynthesis and Antioxidant Metabolism in Higher Plants. J. Plant Physiol. 2004, 161, 1189–1202. [Google Scholar] [CrossRef] [PubMed]
  16. Bhat, J.A.; Deshmukh, R.; Zhao, T.; Patil, G.; Deokar, A.; Shinde, S.; Chaudhary, J. Harnessing High-Throughput Phenotyping and Genotyping for Enhanced Drought Tolerance in Crop Plants. J. Biotechnol. 2020, 324, 248–260. [Google Scholar] [CrossRef]
  17. Hossain, A.; Skalicky, M.; Brestic, M.; Maitra, S.; Ashraful Alam, M.; Syed, M.A.; Hossain, J.; Sarkar, S.; Saha, S.; Bhadra, P.; et al. Consequences and Mitigation Strategies of Abiotic Stresses in Wheat (Triticum aestivum L.) under the Changing Climate. Agronomy 2021, 11, 241. [Google Scholar] [CrossRef]
  18. Raj, S.R.G.; Nadarajah, K. QTL and Candidate Genes: Techniques and Advancement in Abiotic Stress Resistance Breeding of Major Cereals. Int. J. Mol. Sci. 2022, 24, 6. [Google Scholar] [CrossRef]
  19. Song, P.; Wang, J.; Guo, X.; Yang, W.; Zhao, C. High-Throughput Phenotyping: Breaking through the Bottleneck in Future Crop Breeding. Crop J. 2021, 9, 633–645. [Google Scholar] [CrossRef]
  20. Sarić, R.; Nguyen, V.D.; Burge, T.; Berkowitz, O.; Trtílek, M.; Whelan, J.; Lewsey, M.G.; Čustović, E. Applications of Hyperspectral Imaging in Plant Phenotyping. Trends Plant Sci. 2022, 27, 301–315. [Google Scholar] [CrossRef] [PubMed]
  21. Peng, Y.; Zeng, A.; Zhu, T.; Fang, S.; Gong, Y.; Tao, Y.; Zhou, Y.; Liu, K. Using Remotely Sensed Spectral Reflectance to Indicate Leaf Photosynthetic Efficiency Derived from Active Fluorescence Measurements. J. Appl. Remote Sens. 2017, 11, 026034. [Google Scholar] [CrossRef]
  22. El-Hendawy, S.E.; Hassan, W.M.; Al-Suhaibani, N.A.; Schmidhalter, U. Spectral Assessment of Drought Tolerance Indices and Grain Yield in Advanced Spring Wheat Lines Grown under Full and Limited Water Irrigation. Agric. Water Manag. 2017, 182, 1–12. [Google Scholar] [CrossRef]
  23. Sukhova, E.; Sukhov, V. Relation of Photochemical Reflectance Indices Based on Different Wavelengths to the Parameters of Light Reactions in Photosystems I and II in Pea Plants. Remote Sens. 2020, 12, 1312. [Google Scholar] [CrossRef]
  24. Sherstneva, O.; Abdullaev, F.; Kior, D.; Yudina, L.; Gromova, E.; Vodeneev, V. Prediction of Biomass Accumulation and Tolerance of Wheat Seedlings to Drought and Elevated Temperatures Using Hyperspectral Imaging. Front. Plant Sci. 2024, 15, 1344826. [Google Scholar] [CrossRef] [PubMed]
  25. Ihuoma, S.O.; Madramootoo, C.A. Recent Advances in Crop Water Stress Detection. Comput. Electron. Agric. 2017, 141, 267–275. [Google Scholar] [CrossRef]
  26. Peteinatos, G.; Korsaeth, A.; Berge, T.; Gerhards, R. Using Optical Sensors to Identify Water Deprivation, Nitrogen Shortage, Weed Presence and Fungal Infection in Wheat. Agriculture 2016, 6, 24. [Google Scholar] [CrossRef]
  27. Li, Q.; Gao, M.; Li, Z.-L. Ground Hyper-Spectral Remote-Sensing Monitoring of Wheat Water Stress during Different Growing Stages. Agronomy 2022, 12, 2267. [Google Scholar] [CrossRef]
  28. Mukarram, M.; Choudhary, S.; Kurjak, D.; Petek, A.; Khan, M.M.A. Drought: Sensing, Signalling, Effects and Tolerance in Higher Plants. Physiol. Plant. 2021, 172, 1291–1300. [Google Scholar] [CrossRef]
  29. Cao, Y.; Yang, W.; Ma, J.; Cheng, Z.; Zhang, X.; Liu, X.; Wu, X.; Zhang, J. An Integrated Framework for Drought Stress in Plants. Int. J. Mol. Sci. 2024, 25, 9347. [Google Scholar] [CrossRef] [PubMed]
  30. Eena, R.; Bharti, R.; Chaudhary, N. Drought Resistance in Wheat (Triticum aestivum L.): A Review. Int. J. Curr. Microbiol. Appl. Sci. 2019, 8, 1780–1792. [Google Scholar] [CrossRef]
  31. Steduto, P.; Hsiao, T.C.; Fereres, E.; Raes, D. Crop Yield Response to Water; FAO Irrigation and Drainage Paper; FAO: Rome, Italy, 2012; ISBN 978-92-5-107274-5. [Google Scholar]
  32. Ihsan, M.Z.; El-Nakhlawy, F.S.; Ismail, S.M.; Fahad, S.; Daur, I. Wheat Phenological Development and Growth Studies As Affected by Drought and Late Season High Temperature Stress under Arid Environment. Front. Plant Sci. 2016, 7, 795. [Google Scholar] [CrossRef] [PubMed]
  33. Monteleone, B.; Borzí, I.; Arosio, M.; Cesarini, L.; Bonaccorso, B.; Martina, M. Modelling the Response of Wheat Yield to Stage-Specific Water Stress in the Po Plain. Agric. Water Manag. 2023, 287, 108444. [Google Scholar] [CrossRef]
  34. Raines, C.A. Increasing Photosynthetic Carbon Assimilation in C3 Plants to Improve Crop Yield: Current and Future Strategies. Plant Physiol. 2011, 155, 36–42. [Google Scholar] [CrossRef] [PubMed]
  35. Sherstneva, O.; Khlopkov, A.; Gromova, E.; Yudina, L.; Vetrova, Y.; Pecherina, A.; Kuznetsova, D.; Krutova, E.; Sukhov, V.; Vodeneev, V. Analysis of Chlorophyll Fluorescence Parameters as Predictors of Biomass Accumulation and Tolerance to Heat and Drought Stress of Wheat (Triticum aestivum) plants. Funct. Plant Biol. 2021, 49, 155–169. [Google Scholar] [CrossRef] [PubMed]
  36. Wu, H.; Yang, Z. Effects of Drought Stress and Postdrought Rewatering on Winter Wheat: A Meta-Analysis. Agronomy 2024, 14, 298. [Google Scholar] [CrossRef]
  37. Sukhova, E.; Yudina, L.; Kior, A.; Kior, D.; Popova, A.; Zolin, Y.; Gromova, E.; Sukhov, V. Modified Photochemical Reflectance Indices as New Tool for Revealing Influence of Drought and Heat on Pea and Wheat Plants. Plants 2022, 11, 1308. [Google Scholar] [CrossRef]
  38. Grieco, M.; Roustan, V.; Dermendjiev, G.; Rantala, S.; Jain, A.; Leonardelli, M.; Neumann, K.; Berger, V.; Engelmeier, D.; Bachmann, G.; et al. Adjustment of Photosynthetic Activity to Drought and Fluctuating Light in Wheat. Plant Cell Environ. 2020, 43, 1484–1500. [Google Scholar] [CrossRef]
  39. Barboričová, M.; Filaček, A.; Mlynáriková Vysoká, D.; Gašparovič, K.; Živčák, M.; Brestič, M. Sensitivity of Fast Chlorophyll Fluorescence Parameters to Combined Heat and Drought Stress in Wheat Genotypes. Plant Soil Environ. 2022, 68, 309–316. [Google Scholar] [CrossRef]
  40. Javadipour, Z.; Balouchi, H.; Movahhedi Dehnavi, M.; Yadavi, A. Physiological Responses of Bread Wheat (Triticum aestivum) Cultivars to Drought Stress and Exogenous Methyl Jasmonate. J. Plant Growth Regul. 2022, 41, 3433–3448. [Google Scholar] [CrossRef]
  41. Yang, Q.; Li, P.; Zhang, D.; Lin, W.; Hao, X.; Zong, Y. Effects of Elevated CO2 on the Photosynthesis, Chlorophyll Fluorescence and Yield of Two Wheat Cultivars (Triticum aestivum L.) under Persistent Drought Stress. Sustainability 2023, 15, 1593. [Google Scholar] [CrossRef]
  42. Chen, Y.-E.; Cui, J.-M.; Su, Y.-Q.; Zhang, C.-M.; Ma, J.; Zhang, Z.-W.; Yuan, M.; Liu, W.-J.; Zhang, H.-Y.; Yuan, S. Comparison of Phosphorylation and Assembly of Photosystem Complexes and Redox Homeostasis in Two Wheat Cultivars with Different Drought Resistance. Sci. Rep. 2017, 7, 12718. [Google Scholar] [CrossRef]
  43. Tang, X.; Liu, H.; Zhang, W. Physiological Characteristics, Crop Growth and Grain Yield of Twelve Wheat Varieties Cultivated in the North China Plain. Agronomy 2023, 13, 3041. [Google Scholar] [CrossRef]
  44. Mshenskaya, N.S.; Grinberg, M.A.; Kalyasova, E.A.; Vodeneev, V.A.; Ilin, N.V.; Slyunyaev, N.N.; Mareev, E.A.; Sinitsyna, Y.V. The Effect of an Extremely Low-Frequency Electromagnetic Field on the Drought Sensitivity of Wheat Plants. Plants 2023, 12, 826. [Google Scholar] [CrossRef]
  45. Maxwell, K.; Johnson, G.N. Chlorophyll Fluorescence—A Practical Guide. J. Exp. Bot. 2000, 51, 659–668. [Google Scholar] [CrossRef] [PubMed]
  46. Nezhadahmadi, A.; Prodhan, Z.H.; Faruq, G. Drought Tolerance in Wheat. Sci. World J. 2013, 2013, 610721. [Google Scholar] [CrossRef] [PubMed]
  47. Bao, X.; Hou, X.; Duan, W.; Yin, B.; Ren, J.; Wang, Y.; Liu, X.; Gu, L.; Zhen, W. Screening and Evaluation of Drought Resistance Traits of Winter Wheat in the North China Plain. Front. Plant Sci. 2023, 14, 1194759. [Google Scholar] [CrossRef]
  48. Kulkarni, M.; Soolanayakanahally, R.; Ogawa, S.; Uga, Y.; Selvaraj, M.G.; Kagale, S. Drought Response in Wheat: Key Genes and Regulatory Mechanisms Controlling Root System Architecture and Transpiration Efficiency. Front. Chem. 2017, 5, 106. [Google Scholar] [CrossRef]
  49. Czövek, P.; Király, I.; Páldi, E.; Molnár, I.; Gáspár, L. Comparative Analysis of Stress Tolerance in Aegilops Accessions and Triticum Wheat Varieties to Detect Different Drought Tolerance Strategies. Acta Agron. Hung. 2006, 54, 49–60. [Google Scholar] [CrossRef]
  50. Nenova, V.R.; Kocheva, K.V.; Petrov, P.I.; Georgiev, G.I.; Karceva, T.V.; Börner, A.; Landjeva, S.P. Wheat Rht-B1 Dwarfs Exhibit Better Photosynthetic Response to Water Deficit at Seedling Stage Compared to the Wild Type. J. Agron. Crop Sci. 2014, 200, 434–443. [Google Scholar] [CrossRef]
  51. Wang, X.; Wang, L.; Shangguan, Z. Leaf Gas Exchange and Fluorescence of Two Winter Wheat Varieties in Response to Drought Stress and Nitrogen Supply. PLoS ONE 2016, 11, e0165733. [Google Scholar] [CrossRef]
  52. Mendanha, T.; Rosenqvist, E.; Nordentoft Hyldgaard, B.; Doonan, J.H.; Ottosen, C. Drought Priming Effects on Alleviating the Photosynthetic Limitations of Wheat Cultivars (Triticum aestivum L.) with Contrasting Tolerance to Abiotic Stresses. J. Agron. Crop Sci. 2020, 206, 651–664. [Google Scholar] [CrossRef]
  53. Kartseva, T.; Dobrikova, A.; Kocheva, K.; Alexandrov, V.; Georgiev, G.; Brestič, M.; Misheva, S. Optimal Nitrogen Supply Ameliorates the Performance of Wheat Seedlings under Osmotic Stress in Genotype-Specific Manner. Plants 2021, 10, 493. [Google Scholar] [CrossRef] [PubMed]
  54. Hickey, K.; Wood, M.; Sexton, T.; Sahin, Y.; Nazarov, T.; Fisher, J.; Sanguinet, K.A.; Cousins, A.; Kirchhoff, H.; Smertenko, A. Drought Tolerance Strategies and Autophagy in Resilient Wheat Genotypes. Cells 2022, 11, 1765. [Google Scholar] [CrossRef]
  55. Popova, A.V.; Mihailova, G.; Geneva, M.; Peeva, V.; Kirova, E.; Sichanova, M.; Dobrikova, A.; Georgieva, K. Different Responses to Water Deficit of Two Common Winter Wheat Varieties: Physiological and Biochemical Characteristics. Plants 2023, 12, 2239. [Google Scholar] [CrossRef]
  56. Gallé, Á.; Csiszár, J.; Tari, I.; Erdei, L. Changes in Water and Chlorophyll Fluorescence Parameters under Osmotic Stress in Wheat Cultivars. Acta Biol. Szeged. 2002, 46, 85–86. [Google Scholar]
  57. Goss, R.; Lepetit, B. Biodiversity of NPQ. J. Plant Physiol. 2015, 172, 13–32. [Google Scholar] [CrossRef]
  58. Liu, H.; Song, S.; Zhang, H.; Li, Y.; Niu, L.; Zhang, J.; Wang, W. Signaling Transduction of ABA, ROS, and Ca2+ in Plant Stomatal Closure in Response to Drought. Int. J. Mol. Sci. 2022, 23, 14824. [Google Scholar] [CrossRef] [PubMed]
  59. Fu, P.; Montes, C.M.; Siebers, M.H.; Gomez-Casanovas, N.; McGrath, J.M.; Ainsworth, E.A.; Bernacchi, C.J. Advances in Field-Based High-Throughput Photosynthetic Phenotyping. J. Exp. Bot. 2022, 73, 3157–3172. [Google Scholar] [CrossRef] [PubMed]
  60. Perez-Sanz, F.; Navarro, P.J.; Egea-Cortines, M. Plant Phenomics: An Overview of Image Acquisition Technologies and Image Data Analysis Algorithms. GigaScience 2017, 6, gix092. [Google Scholar] [CrossRef] [PubMed]
  61. Ollinger, S.V. Sources of Variability in Canopy Reflectance and the Convergent Properties of Plants. New Phytol. 2011, 189, 375–394. [Google Scholar] [CrossRef] [PubMed]
  62. Ustin, S.L.; Jacquemoud, S. How the Optical Properties of Leaves Modify the Absorption and Scattering of Energy and Enhance Leaf Functionality. In Remote Sensing of Plant Biodiversity; Cavender-Bares, J., Gamon, J.A., Townsend, P.A., Eds.; Springer International Publishing: Cham, Switzerland, 2020; pp. 349–384. ISBN 978-3-030-33156-6. [Google Scholar]
  63. Liu, L.; Wang, J.; Huang, W.; Zhao, C.; Zhang, B.; Tong, Q. Estimating Winter Wheat Plant Water Content Using Red Edge Parameters. Int. J. Remote Sens. 2004, 25, 3331–3342. [Google Scholar] [CrossRef]
  64. Peng, Z.; Lin, S.; Zhang, B.; Wei, Z.; Liu, L.; Han, N.; Cai, J.; Chen, H. Winter Wheat Canopy Water Content Monitoring Based on Spectral Transforms and “Three-Edge” Parameters. Agric. Water Manag. 2020, 240, 106306. [Google Scholar] [CrossRef]
  65. Klem, K.; Záhora, J.; Zemek, F.; Trunda, P.; Tůma, I.; Novotná, K.; Hodaňová, P.; Rapantová, B.; Hanuš, J.; Vavříková, J.; et al. Interactive Effects of Water Deficit and Nitrogen Nutrition on Winter Wheat. Remote Sensing Methods for Their Detection. Agric. Water Manag. 2018, 210, 171–184. [Google Scholar] [CrossRef]
  66. Sun, H.; Feng, M.; Xiao, L.; Yang, W.; Wang, C.; Jia, X.; Zhao, Y.; Zhao, C.; Muhammad, S.K.; Li, D. Assessment of Plant Water Status in Winter Wheat (Triticum aestivum L.) Based on Canopy Spectral Indices. PLoS ONE 2019, 14, e0216890. [Google Scholar] [CrossRef] [PubMed]
  67. Liu, L.; Zhang, S.; Zhang, B. Evaluation of Hyperspectral Indices for Retrieval of Canopy Equivalent Water Thickness and Gravimetric Water Content. Int. J. Remote Sens. 2016, 37, 3384–3399. [Google Scholar] [CrossRef]
  68. Metternicht, G. Vegetation Indices Derived from High-Resolution Airborne Videography for Precision Crop Management. Int. J. Remote Sens. 2003, 24, 2855–2877. [Google Scholar] [CrossRef]
  69. Verdebout, J.; Jacquemoud, S.; Schmuck, G. Optical Properties of Leaves: Modelling and Experimental Studies. In Imaging Spectrometry—A Tool for Environmental Observations; Hill, J., Mégier, J., Eds.; Eurocourses: Remote Sensing; Springer Netherlands: Dordrecht, The Netherlands, 1994; Volume 4, pp. 169–191. ISBN 978-0-7923-2965-7. [Google Scholar]
  70. Gamon, J.A.; Peñuelas, J.; Field, C.B. A Narrow-Waveband Spectral Index That Tracks Diurnal Changes in Photosynthetic Efficiency. Remote Sens. Environ. 1992, 41, 35–44. [Google Scholar] [CrossRef]
  71. Gamon, J.A.; Berry, J.A. Facultative and Constitutive Pigment Effects on the Photochemical Reflectance Index (PRI) in Sun and Shade Conifer Needles. Isr. J. Plant Sci. 2012, 60, 85–95. [Google Scholar] [CrossRef]
  72. Wang, X.; Zhao, C.; Guo, N.; Li, Y.; Jian, S.; Yu, K. Determining the Canopy Water Stress for Spring Wheat Using Canopy Hyperspectral Reflectance Data in Loess Plateau Semiarid Regions. Spectrosc. Lett. 2015, 48, 492–498. [Google Scholar] [CrossRef]
  73. Gitelson, A.A.; Merzlyak, M.N.; Lichtenthaler, H.K. Detection of Red Edge Position and Chlorophyll Content by Reflectance Measurements Near 700 Nm. J. Plant Physiol. 1996, 148, 501–508. [Google Scholar] [CrossRef]
  74. Clevers, J.G.P.W.; Kooistra, L. Using Hyperspectral Remote Sensing Data for Retrieving Canopy Chlorophyll and Nitrogen Content. IEEE J. Sel. Top. Appl. Earth Obs. Remote Sens. 2012, 5, 574–583. [Google Scholar] [CrossRef]
  75. Xiao, L.; Feng, M.; Yang, W.; Ding, G. Estimation of Water Content in Winter Wheat (Triticum aestivum L.) and Soil Based on Remote Sensing Data–Vegetation Index. Commun. Soil Sci. Plant Anal. 2015, 46, 1827–1839. [Google Scholar] [CrossRef]
  76. Ali, F.; Razzaq, A.; Tariq, W.; Hameed, A.; Rehman, A.; Razzaq, K.; Sarfraz, S.; Rajput, N.A.; Zaki, H.E.M.; Shahid, M.S.; et al. Spectral Intelligence: AI-Driven Hyperspectral Imaging for Agricultural and Ecosystem Applications. Agronomy 2024, 14, 2260. [Google Scholar] [CrossRef]
  77. Song, Q.; Zhu, X.-G. Techniques for Photosynthesis Phenomics: Gas Exchange, Fluorescence, and Reflectance Spectrums. Crop Environ. 2024, 3, 147–158. [Google Scholar] [CrossRef]
  78. Zhang, Q.; Luan, R.; Wang, M.; Zhang, J.; Yu, F.; Ping, Y.; Qiu, L. Research Progress of Spectral Imaging Techniques in Plant Phenotype Studies. Plants 2024, 13, 3088. [Google Scholar] [CrossRef] [PubMed]
  79. Klughammer, C.; Schreiber, U. Complementary PS II Quantum Yields Calculated Fromsimple Fluorescence Parameters Measured byPAM Fluorometry and the Saturation Pulse Method. PAM Appl. Notes 2008, 1, 27–35. [Google Scholar]
Figure 1. Dry weight of 28-day-old wheat seedlings of the CC (shaded bars) and DS (solid bars) groups. Data are presented as mean ± SEM. *, **, *** indicate significant differences between experimental and control groups (t-test, * p < 0.05; ** p < 0.01; *** p < 0.001).
Plants 14 00091 g001
Figure 2. WC in 28-day-old wheat seedlings of the CC (shaded bars) and DS (solid bars) groups. Data are presented as mean ± SEM. *** indicates significant differences between experimental and control groups (t-test, p < 0.001).
Plants 14 00091 g002
Figure 3. Dynamics of residual levels of ChlF parameters during drought development. Data are presented as mean ± SEM.
Plants 14 00091 g003
Figure 4. Drought-induced dynamics of residual ΦPSII level of four groups of cultivars classified according to the patterns of changes in photosynthetic activity during drought development. Data are presented as mean ± SEM. NT—group with low photosynthetic tolerance, MT—group with high photosynthetic tolerance to the short-term moderate DS but not tolerant to long-term intensive DS, HT—group showing reduced photosynthetic activity under short-term moderate DS and high photosynthetic tolerance to the long-term intensive DS, HHT—group with high photosynthetic tolerance to both short-term and longer-term DS. Significant differences between the groups are indicated by different letters (ANOVA followed by Tukey’s test, p < 0.05).
Plants 14 00091 g004
Figure 5. Reflectance spectra of CC (A) and DS (B) plants, and the difference spectra between CC and DS plants (C) at different days of drought. Data are presented as mean spectra for each cultivar.
Plants 14 00091 g005
Figure 6. Heat maps of NDI differences between CC and DS plants (∆NDIs) at different days of drought. Data are presented as mean ∆NDIs (top right) and p-values (bottom left).
Plants 14 00091 g006
Figure 7. Heat maps of Pearson correlation coefficients between NDIs (in % of control) and the residual values of ChlF parameters in wheat plants after 5 days of DS. Data are presented as correlation coefficients (top right) and p-values (bottom left).
Plants 14 00091 g007
Figure 8. Heat maps of Pearson correlation coefficients between NDIs (in % of control) and the residual values of ChlF parameters in wheat plants after 10 days of DS. Data are presented as correlation coefficients (top right) and p-values (bottom left).
Plants 14 00091 g008
Figure 9. Drought-induced dynamics of NDIs (in % of control) of four groups of cultivars classified according to the patterns of changes in photosynthetic activity during drought development. Data are presented as mean ± SEM. NT—group with low photosynthetic tolerance, MT—group with high photosynthetic tolerance to the short-term moderate DS but not tolerant to long-term intensive DS, HT—group showing reduced photosynthetic activity under short-term moderate DS and high photosynthetic tolerance to the long-term intensive DS, HHT—group with high photosynthetic tolerance to both short-term and longer-term DS. Significant differences between the groups are indicated by different letters (ANOVA followed by Tukey’s test, p < 0.05).
Plants 14 00091 g009
Figure 10. Correlation analysis of the relationship between NDIs (in % of control) and the residual value of ΦPSII in four groups of cultivars classified according to the patterns of changes in photosynthetic activity during drought development (after 5 and 10 days of DS). The charts show Pearson linear coefficients and the p-values (two-tailed).
Plants 14 00091 g010
Figure 11. Correlation analysis of the relationship between the absolute values of NDIs and ΦPSII in four groups of cultivars classified according to the patterns of changes in photosynthetic activity during drought development (after 5 and 10 days of DS). The charts show Pearson linear coefficients and the p-values (two-tailed).
Plants 14 00091 g011
Figure 12. Experiment design. CC—control group, DS—drought stress treatment, HSI—hyperspectral imaging, ChlF—chlorophyll fluorescence imaging.
Plants 14 00091 g012
Disclaimer/Publisher’s Note: The statements, opinions and data contained in all publications are solely those of the individual author(s) and contributor(s) and not of MDPI and/or the editor(s). MDPI and/or the editor(s) disclaim responsibility for any injury to people or property resulting from any ideas, methods, instructions or products referred to in the content.

