Abstract
The color of the rind is one of the most crucial agronomic characteristics of watermelon (Citrullus lanatus L.). Its genetic analysis was conducted to provide the identification of genes regulating rind color and improving the quality of watermelon appearance. In this study, a mapping population of 505 F2 plants, derived from a cross between green (CG058) and light-green (CG265) rinds, along with a high-density genetic linkage (average 0.9 cM distance between bin markers), was used to map and identify possible candidate genes. The green rind trait was determined to be regulated by a single Mendelian locus and was precisely located within a 110 kb genomic site on chromosome nine (Chr 9). In the respective region, two potential genes, Cla97C09G175170 and Cla97C09G175180, were substantially downregulated in the light-green rind in comparison to the green rind. Previous studies revealed that Cla97C09G175170, encoding a two-component response regulator-like protein (APRR2), is possibly involved in the green rind trait in watermelon. Virus-induced gene silencing (VIGS) assay confirmed that ClAPRR2 is a key gene responsible for green rind color. Moreover, qRT-PCR analysis revealed that the transcription levels of multiple key genes in the chlorophyll (Chl) biosynthesis pathway were downregulated in the light-green rind relative to the green rind. The current findings have the potential to clarify the regulatory mechanisms that underlie the color of the watermelon rind. These data would provide valuable insights for the targeted molecular design and development of watermelon rinds.
1. Introduction
Globally, watermelon (Citrullus lanatus L., 2n = 2x = 22) is an essential horticultural product that is cultivated extensively. It has been designated as a model crop for the study of fruit characteristics as a result of its vast diversity in fruit-related traits, including fruit size and shape, rind thickness and color, flesh flavor and texture, and seed size and color [1]. Among these characteristics, rind color is a crucial factor that directly affects consumer choice and market value, making it the focus of breeders [2].
The color of watermelon rinds varies from yellow to light green, dark green, and gray [3]. Green tissue coloration in plants is primarily due to chlorophyll (Chl), which captures light energy for photosynthesis [4]. The chlorophyll metabolism pathway in plants has been widely studied and comprises four distinct pathways [5]. The reactions described in the first phase are catalyzed by the enzyme in multiple stages, which begin with the conversion of 5-aminolevulinic acid (ALA) to protoporphyrin IX. In the second phase, the “Mg branch” is defined as the addition of Mg2+ into protoporphyrin IX for Chl a formation [6]. This phase synthesizes Chl a. The third phase comprises the “Chl cycle”, which promotes the interaction of Chl a and b [7]. In the final phase, the pheophorbide an oxygenase (PAO)/phyllobilin pathway is the mechanism by which Chl a is degraded to produce colorless, nonfluorescent Chl catabolites (NCCs) [8].
Several studies have investigated the genetic pattern and regulatory mechanism of watermelon rind color. The depth and background of the rind color have been shown to be determined by the D and Dgo gene loci [9]. In 1956, the go gene was reported for the first time. This gene has a single recessive pattern of inheritance for yellow rind. Along with the go gene, a 59.8 kb QTL locus on Chr 4 was mapped to the second yellow rind gene using BSA-seq and GWAS analyses [10]. Another yellow rind (Clyr) gene, responsible for the yellow rind trait, was precisely located within a 91.42 kb region on Chr 4. However, the transcription level of the candidate genes in this region remained unchanged between the parents [11]. A solid dark-green rind color has been reported to be qualitatively inherited. The light-green color of the rind was only observed when the g-1 and g-2 genes were in homozygous recessive form [12].
Recently published high-quality watermelon reference genomes have enabled significant advancements in the mapping of watermelon rind color genes [13,14]. Moreover, the ClCG08G017810 gene on Chr 8 has been recognized as a potential gene responsible for the color of the outer layer of watermelon [3]. Both Cla97C09G175170 and Cla97C09G175150 have been proposed as potential candidates for stripe and interstripe color [15]. The Cla97C06G125710 gene on Chr 6, which encodes a chlorophyll a-b binding (CAB) protein, has been reported to be responsible for the different shades of green rind color in watermelon [16]. Oren demonstrated that the two-component response regulator-like protein (APRR2) transcription factor is crucial for the variation in fruit coloration. Its allele resulted in a qualitative difference between green and light-green rinds in both plants [17].
Watermelon rinds have been observed to have different combinations of green colors. Several studies have examined the genes associated with the color of the rind, whether light green or green. Therefore, the current study was also designed to evaluate the inheritance of watermelon rind color in six generations of crosses derived from ‘CG058’ (green) and ‘CG265’ (light green). The genetic basis and the preliminary map of the F2 population for the green rind locus (6.9 Mb region) were determined via SNP-panel sequencing. Molecular markers were designed to analyze the recombinants and refine the initial region for precise localization. Finally, the candidate gene in the fine-mapping region was validated using qRT-PCR and VIGS assays. These results offer new perspectives into the candidate genes that function in green rinds and may expedite marker-assisted selection.
2. Results
2.1. Genetic Inheritance of Watermelon Rind Color
To investigate the genetic inheritance of rind color in watermelon, two parental lines were selected with distinguishable rind colors. CG058 showed a green rind color, while CG265 displayed a light-green or gray rind color. All F1 plants that were produced from the hybridization between these parental lines showed a green rind color without segregation, thereby confirming the dominant trait of green rind color (Figure 1). A total of 331 individuals in the F2 population displayed green rinds. In comparison, 101 individuals showed light-green rinds, with a 3:1 Mendelian ratio. All the individuals in the BC1P1 population revealed green rinds resembling the F1 plants, while 42 individuals out of the 79 plants in the BC1P2 population showed green rinds. In the BC1P1 population, the ratio of plants with green rinds to those with light-green rinds was approximately 1:1 (Table 1). The findings indicated that the green rind color was a dominant trait that was regulated by a single locus.
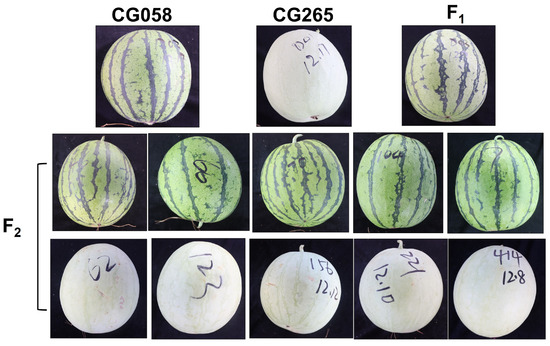
Figure 1.
Fruit images of CG058, CG265, and their F1 and F2 progenies.

Table 1.
Rind color segregation in 6 generations of crosses (CG058 × CG265).
2.2. Chloroplast Observation and Chlorophyll Measurement
To examine the variations in rind pigment content during fruit development, the total chlorophyll (Chl) content of the rind samples from the two parental lines was measured at various developmental phases (0, 5, 10, 16, 26, and 34 days after pollination (DAP)) (Figure 2a). The findings illustrated that the Chl content of the green rind parent (CG058) was substantially higher (1.7 to 2.2 fold) than that of the light-green rind parent (CG265) at all tested stages, except at 5 DAP, where there was no significant difference (Figure 2b). The visual observations were correlated with the Chl content measurements in the rinds of both parents. Further, the carotenoid content of the rinds of both parents demonstrated a similar trend to that observed in Chl content (Figure 2b).
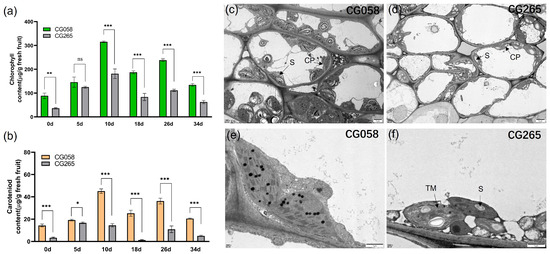
Figure 2.
Pigment content and cytological observations of the parental line rind. (a) Contents of Chl of the parental rind. (b) Contents of carotenoid of the parental rind. (c) Transmission electron microscopy (TEM) of chloroplasts in CG058. (d) Transmission electron microscopy (TEM) of chloroplasts in CG265. (e) Chloroplast ultrastructure in CG058. (f) Chloroplast ultrastructure in CG265. Data are illustrated as means ± SE. * = p < 0.05; ** = p < 0.01; *** = p < 0.001; ns = no significance. S: starch grains; chlorophyll (Chl); CP: chloroplast; TM: thylakoid membrane.
The fruit rinds at 30 DAP were collected and analyzed via transmission electron microscopy (TEM) to determine the quantity and ultrastructure of chloroplasts in the rinds of both parental lines (Figure 2c–f). Based on the findings, CG058 contained more chloroplasts than the CG265 rind. Moreover, the chloroplasts in the CG058 rind were tightly packed, whereas those in the CG265 rind were irregularly arranged (Figure 2c,d). Overall, the CG058 rind contained chloroplasts that were considerably larger than those in the CG265 rind (Figure 2e,f).
2.3. Detection of Candidate QTLs for Rind Color via SNP Panels
To identify the QTLs associated with rind color, an SNP panel with 213 SNP markers was used to detect the genotypic profile of the 505 F2 individuals. The green rind locus was mapped to a region (9.7–16.6 Mb) on Chr 9, which corresponded to the phenotype of the F2 individuals (Figure 3a).
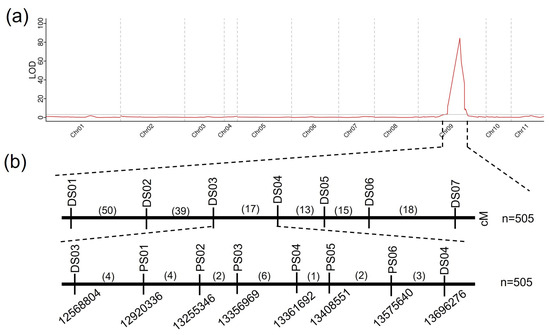
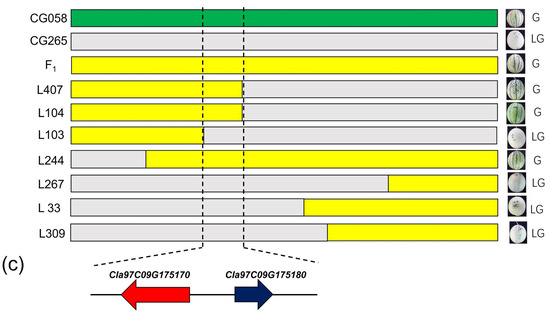
Figure 3.
Genetic mapping of the CG058 rind gene locus. (a) Initial mapping of the CG058 rind gene locus. (b) Fine mapping of the CG058 rind gene locus. (c) Genes in the candidate region. Green represents the homozygous CG058 segment, gray signifies the homozygous CG265 segment, and yellow denotes the heterozygous region. Numbers above the Chr represent recombinants between adjacent markers. The number of plants used for mapping is denoted by n.
Seven InDel markers were developed to further refine this region by identifying the genotypes of the 505 individuals for initial mapping via the sequence difference between the two parental lines. The green rind locus was confined to an area of 1.11 Mb between markers DS03 (12.56 Mb) and DS04 (13.69 Mb) (Figure 3b). Approximately 17 recombinants were identified among the 505 F2 individuals using the markers DS03 and DS04. Six new markers were developed in the region (12.56–13.69 Mb) to genotype the recombinants (Figure 3b). Finally, the gene responsible for determining the green rind color was identified in a 110-kb region between the PS02 and PS03 markers (Figure 3b).
2.4. Candidate Gene Sequencing and Expression
Cla97C09G175170 and Cla97C09G175180 are two possible genes that are present in the 110-kb region, as indicated by the annotation data of the reference genome 97103 (v2) (Figure 3c). A two-component response regulator-like protein, ClAPRR2, is encoded by Cla97C09G175170, whereas the function of Cla97C09G175180 is unknown.
Unexpectedly, the assembled genome resequencing data did not reveal any variation between both parental lines in the selected region. After that, the transcriptional pattern of both genes was analyzed in the parental lines (Figure 4). Importantly, Cla97C09G1750170 and Cla97C09G175180 showed no expression in light-green rinds. The expression of both genes gradually increased during the color accumulation stage and then decreased after reaching a peak in the green rind. The expression of Cla97C09G1750170 was the highest at 5 DAP, while Cla97C09G1750180 had the maximum expression at 10 DAP, which was nearly 30 times higher than that in the initial stage. Therefore, this study suggests that Cla97C09G1750170 and Cla97C09G175180 might be responsible for the rind color trait.
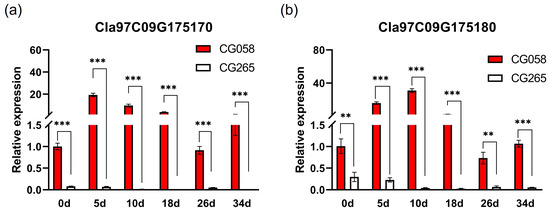
Figure 4.
Detection of the expressions of potential genes from the parents. (a) Relative expression of Cla97C09G175170. (b) Relative expression of Cla97C09G175180. The rinds are represented by 0, 5, 10, 18, 26, and 34 d on the x-axis, indicating the days after pollination. Data are illustrated as means ± SE. ** = p < 0.01; *** = p < 0.001.
2.5. VIGS Assay Validates ClAPRR2 as a Crucial Gene for Green Rind Color
Various fruits, including blueberry [18], banana [19], and loquat [20], have been extensively tested using the VIGS assay. The function of ClAPRR2 and Cla97C09G175180 (Cla180) was validated by inserting a 220-bp fragment from ClAPRR2 and a 224-bp fragment from Cla97C09G175180 into the cucumber green mottle mosaic virus vector (pV190) to produce pV190-ClAPRR2 and pV190-Cla180, respectively (Figure 5a). The negative control consisted of empty pV190-infected plants (pV190-control). ClAPRR2 silencing resulted in photobleaching of the fruit rind in pV190-ClAPRR2 around the infiltrated area (Figure 5b). However, the fruit rind color of pV190-Cla180 did not show a substantial change compared to the pV190-control. ClAPRR2 gene expression in pV190-ClAPRR2 was remarkably downregulated in qRT-PCR analysis (Figure 5c). These findings confirmed that ClAPRR2 is a crucial gene for the development of green rind color.
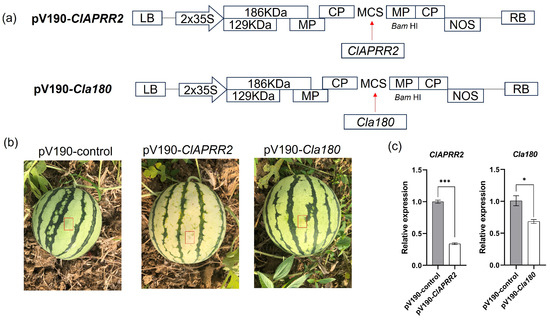
Figure 5.
Phenotypic and gene expression of watermelon fruits infiltrated with VIGS constructs. (a) Maps of the pV190-ClAPRR2 and pV190-Cla180 vectors. (b) Variations in the phenotypes of fruits that were infiltrated with various VIGS constructs at 25 DAP. Infiltrated positions are indicated by red arrows. (c) Expression of ClAPRR2 and Cla180 in VIGS-treated rinds. Data are illustrated as means ± SE. * = p < 0.05; *** = p < 0.001.
2.6. Downregulated Genes Associated with Chl Biosynthesis Pathway in Light-Green Rind
Glutamate 1-semialdehyde is the precursor to the tetrapyrrole pathway, which deviates at Proto IX. Therefore, the relative expression of glutamyl-tRNA reductase (HEMA1), which catalyzes the conversion of glutamyl-tRNA to glutamate 1-semialdehyde, was determined in the rind of the two parental lines (Figure 6). The expression of HEMA1 (Cla97C08G155040) in the CG058 rind was substantially higher than that in the CG265 rind at 5 DAP and 10 DAP. The branch leading to Chl accumulation, which was promoted by Mg-chelatases (GENOMES UNCOUPLED 4, GUN4, and Mg-chelatase subunit H, CHLH), was also investigated. The expression of GUN4 (Cla97C08G147680) and CHLH (Cla97C04G068530) was higher only in the CG058 rind relative to the CG265 rind at 10 DAP. Mg protoporphyrin IX methyltransferase (CHLM), Mg-protoporphyrinogen IX monomethylester cyclase (CRD1), and protochlorophyllide reductase (PORA) are responsible for converting Mg-Proto IX to chlide a. The gene levels of CHLM (Cla97C06G128140) and CRD1 (Cla97C04G071470) were similar to those of HEMA1, showing a higher expression level in the CG058 rind than in CG265 rind at 5 DAP and 10 DAP. The CG058 rind showed substantially higher levels of PORA (Cla97C11G224300) expression than the CG265 rind at all developmental phases. Chlorophyllide a oxygenase (CAO, Cla97C08G148460), which oxidizes chlorophyllide a to chlorophyllide b, had a similar expression pattern to that of CHLM and CRD1. Except for PORA, the expression of nearly all genes was higher in the CG265 rind than in the CG058 rind after 18 DAP. These results suggest that chlorophyll accumulation occurs in the early stage of green rind development.
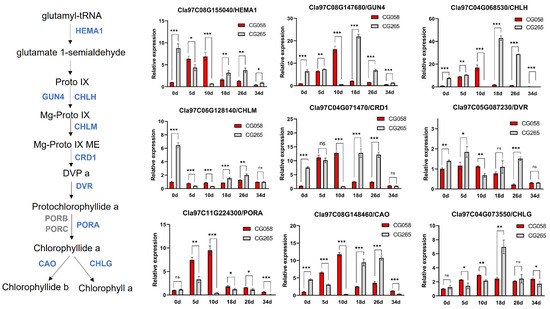
Figure 6.
Comparative expression of the Chl synthesis pathway genes in both rind parents. The rinds are represented by 0, 5, 10, 18, 26, and 34 d on the x-axis, indicating the days after pollination. Data are illustrated as means ± SE. * = p < 0.05; ** = p < 0.01; *** = p < 0.001; ns = no significance.
3. Discussion
The physical characteristics of watermelon, including its color, shape, and stripe pattern, are crucial factors that impact the purchasing decision of the consumer. A high-quality appearance can substantially increase the market demand for watermelon. Among these, rind color is more essential. Despite several studies on the inheritance of watermelon rind color, only a few candidate genes associated with this trait have been identified [3,10,11,15,16,17]. The complexity of the genetic patterns and developmental mechanisms of rind color arises from the ambiguous terms used to characterize them and the changes in gene expression depending on the genetic backgrounds used in different studies.
This study examined the genetic pattern of rind color by crossing two watermelon germplasms, CG058 and CG265. The results showed that CG058 rinds were more dominant than CG265 rinds. In a six-generation genetic population, further genetic analysis of the rind color trait demonstrated that the CG058 rind trait in watermelon is inherited as a single dominant gene. This result is in line with the genetic profiles of horticultural crops, including cucumber (Cucumis sativus L.) [21], wax gourd (Benincasa hispida) [22], eggplant (Solanum melongena L.) [4], and melon (Cucumis melo) [17]. Measurements of Chl and carotenoid contents in both parental plants revealed that the CG265 rind parent had lower Chl and carotenoid contents than the CG058 rind parent. Moreover, TEM analysis evidenced that the number of CPs in the CG265 rind parent was lower than that in the CG058 rind parent. These results are similar to those reported by Li et al. [3].
Moreover, pigment content and formation determine the color of leaves and peels [23]. In watermelon, the Chl content is the main factor affecting the CG058 rinds [3]. Transcription factors have been reported to regulate chlorophyll and carotenoid accumulation, resulting in different rind colors [15]. Recently, the Golden2-like (GLK2) transcription factor and APRR2-like genes have been established as critical transcription mediators in regulating plastid metabolism across various species. GLK has been reported to regulate Chl levels in pepper (Capsicum) [24]. Similarly, APRR2 has been identified as a regulator of pigment deposition in tomatoes and peppers, while its overexpression in tomatoes has been shown to increase the number of plastids and color intensity of fruits [25]. This gene has also been found to play a substantial role in determining white immature rind color (w) in cucumber [21], as well as in the coloration of muskmelons [17], watermelons [17], wax gourds [22], bottle gourds (Lagenaria siceraria) [26], and eggplant peels [4]. As expected, ClAPRR2 was located in the fine-mapping region, similar to previous research. The VIGS assay in watermelon rind validated that ClAPRR2 is critical for the green rind color. This study also investigated the transcription pattern of genes responsible for Chl biosynthesis. The CG058 rind parent showed higher expression of nearly all genes than the CG265 parent before 10 DAP, suggesting that Chl accumulation occurred at an initial phase.
It was reported that DNA methylation controls gene expression by either blocking the interaction of transcription factor(s) to DNA or recruiting suppressor proteins [27]. In Radish (Raphanus sativus), the hypermethylated CACTA transposon induced DNA methylation in the promoter region of RsMYB1, resulting in a white-fleshed phenotype [28]. In Chrysanthemum (Chrysanthemum morifolium), the methylation status of the CmMYB6 promoter was highly correlated with the flower color, and this methylation was heritable [29]. In the dominant waxless cabbage (Brassica oleracea L. var. capitata) mutant, the causative gene non-wax glossy (NWGL) was located in a 99 kb region at the end of cabbage Chr C08. However, this region did not yield any DNA variations in the potential gene (Bol018504). Moreover, the mutant phenotype was possibly due to lower expression and modified DNA methylation [30]. The yellow rind in watermelon may also have been affected by methylation in the WT4 cultivar [11]. This study suggests that the light-green feature of CG265 may also be a consequence of methylation. However, further research is necessary to determine its crucial molecular mechanism. Collectively, this study establishes a primary research line for further assessing the regulatory mechanisms of color genes in the fruit rinds of watermelon.
4. Materials and Methods
4.1. Plant Materials
CG058 (P1) and CG265 (P2) are germplasm obtained from the Industrial Crops Institute of Hubei Academy of Agricultural Sciences, with green and light-green rind colors, respectively. The F1 plant population was derived by crossing CG058 and CG265. The female flower of CG058 was pollinated with the male flower of CG265, and the seeds obtained from CG058 were the F1 progeny. The F2 population originated from the self-pollination of the F1 population. The backcross populations BC1P1 and BC1P2 were derived by crossing F1 with each parent. All plants were grown in an open field at the experimental base of the Hubei Academy of Agricultural Sciences in Hainan Province (Sanya, Hainan) in November 2021. The soil type is clayey. The daily temperature was maintained between 20 °C and 30 °C and the relative humidity was between 50% and 80%. Drip irrigation tape was used for irrigation. A total of 0.5 kg of commercial organic fertilizer and 0.06 kg of potassium sulfate compound fertilizer (N:P:K ratio of 15:15:15) per square meter was applied. As the fruit matured, the green and light-green rind phenotypes were visually observed. The rind phenotype of F2 was determined by comparison with the rinds of CG058, CG265, and their F1 progeny. In the F2/BC1 population, the segregation ratios of green/light-green rinds were analyzed via Chi-square tests (c2).
4.2. Pigment Content and Chloroplast Observation
The same method of pigment extraction was used as described previously [25]. The fruit rinds at different stages (0, 5, 10, 18, 26, and 34 DAP) were crushed into powder in liquid nitrogen and extracted with anhydrous ethanol for 24 h in the dark. The sample was centrifuged at 6000 rpm for 10 min, and the supernatant was measured at different 665, 649, and 470 nm wavelengths via a microplate reader (Infinite 2000, Tecan). The pigment content was calculated as mentioned previously [31]. The method of CP observation was described previously [3]. The fruit rinds at 30 DAP of both parents were collected, cut into 1 to 2 mm3 pieces, and fixed immediately in precooled fixative (2.5% glutaraldehyde). After fixation, dehydration, infiltration, and embedding steps, the sample was sectioned into 50 to 70 nm ultra-thin sections using an ultramicrotome (Leica UC7; Leica, Wetzlar, Germany) and observed under a Tecnai G2 20 TWIN (FEI, USA) TEM.
4.3. Genome Resequencing and Variant Calling
The procedure of genome resequencing and variant calling has been reported previously [32]. Briefly, genomic DNA was isolated with a CTAB method [33]. A DNA library was developed using the genomic DNA of CG058 and CG265 and then sequenced on the HiSeq 4000 (Illumina, San Diego, CA, USA) platform. Adapters and low-quality reads were removed via the Fastp software (v0.23.0) [34]. The average mass number was calculated using a sliding window of 4 bp, and all subsequent bases were removed if they were less than 15. The length of clean reads must be longer than 50 bp. The clean reads were mapped to the watermelon reference genome 97103 (v2) (http://cucurbitgenomics.org/organism/21, accessed on 27 June 2019) using the MEM algorithm of the Burrows–Wheeler Aligner (BWA, v0.7.15-r1140) software. The alignment results in SAM format were obtained. Then, the SAM format file was converted to BAM format using Samtools software (version 1.3.1), and the reads in the BAM file were sorted. The final BAM file was used for variant calling. The HaplotypeCaller module in the GATK (version 3.7) software package was used to generate GVCF files for each sample, and then the GenotypeGVCFs module was used to perform mutation detection on all samples together, including SNPs and InDel [35].
4.4. Marker Development and Genetic Mapping
An SNP panel containing 198 SNPs and 15 InDels was developed as a preliminary map of the green rind locus. Initially, the SNP panel was used to genotype the F2 population, which consisted of 505 individuals resulting from the cross between CG058 and CG265. Composite interval mapping (CIM) was used for QTL analysis on the F2 population, as indicated by their phenotypic characteristics, using the WinQTLCart2.5 software [36]. To narrow the mapping interval (Chr09:97.8 to 166.12 Mb), seven InDel markers (DS01-DS07) were designed for each 0.4–1.8 Mb interval, as per the SNP density, and used to genotype the 505 F2 individuals. The recombinant plants were genotyped using six SNP markers (PS01-PS06), each with an average interval of 100 kb, to fine-map the green rind locus. The TransStart® FastPfu PCR SuperMix (TransGen Biotech, Beijing, China) was used for PCR amplification under the following conditions: step 1, 98 °C for 1 min; step 2, 98 °C for 10 s, 55–60 °C for 5 s, 72 °C for 30 s, (30–35 cycles); and step 3, 72 °C for 1 min. For the CAPS markers, the PCR product was digested with appropriate restriction endonucleases and separated by 1.0% agarose gels. The PCR product was separated via 8% gel electrophoresis (PAGE) for InDel markers. The sequences of the used markers are listed in Table S1.
4.5. Gene Expression via qRT-PCR Analysis
Total RNA was isolated from the rind of two parental lines at different developmental stages (0, 5, 10, 18, 26, and 34 DAP) using a FastPure Universal Plant Total RNA Isolation Kit (RC411-01, Vazyme, Nanjing, China) according to the operating instructions. Further, cDNA was synthesized via the TransScript First-Strand cDNA Synthesis SuperMix (TransGen Biotech, China). qRT-PCR analysis was conducted using the PerfectStart Green qPCR SuperMix (TransGen Biotech, China) and the CFX384 system (Bio-Rad, Hercules, CA, USA).
To normalize the Ct values, the gene ClActin (Cla97C02G026960) was used as the internal control [32]. Each experiment was performed in three biological and three technical replicates. The expression was analyzed using the 2−ΔΔCt method [37]. The details of genes with primer sequences are provided in Table S2.
4.6. VIGS Vector Construction and Agrobacterium Infiltration
To analyze the candidate genes related to rind color in watermelon, a pV190-based VIGS [38,39] assay was conducted. Agrobacterium tumefaciens strain GV3101 was transformed by inserting the intact coding sequence (200–300 bp) of the desired gene into the Bam HI restriction site of the pV190 vector. The strains were freshly grown on lysogeny broth (LB) medium enriched with appropriate antibiotics and cultured overnight at 28 °C. To obtain an OD600 of 0.8–1, the bacteria were resuspended in an inducing buffer that contained (10 mmol/L MES, 10 mmol/L MgCl2, and 100 μmol/L acetosyringone). A 1.0 mL needleless syringe was used to infiltrate the cells into the rind of the watermelon after being kept at 25 °C for 3 h in the dark. The empty pV vector served as a negative control. The injected watermelon was bagged for 3 days. Each inoculation was repeated in triplicate. The transcription levels of the target genes were quantified by collecting the rind until the phenotype was observed. The primers used for the construction of the VIGS vector are provided in Table S3.
5. Conclusions
In the current study, we mapped the green rind color gene of watermelon to chromosome 9. The candidate gene Cla97C09G1750170 (ClAPRR2), which encodes a two-component response regulator-like protein, was validated to be a crucial gene for green rind color. Our study provides valuable insights into the targeted molecular design and development of watermelon rinds. Further research will be conducted into the regulatory mechanisms of ClAPRR2 in rind color.
Supplementary Materials
The following supporting information can be downloaded at: https://www.mdpi.com/article/10.3390/plants14010113/s1, Table S1: Molecular biomarkers for fine mapping; Table S2: Primer information used for qRT–PCR analysis; Table S3: Primers used for constructing VIGS vectors.
Author Contributions
Conceptualization, W.Z. and Z.D.; methodology, L.Y.; software, Y.W.; validation, H.W., Q.L. and N.W.; investigation, W.Z.; resources, Z.D.; writing—original draft preparation, W.Z.; writing—review and editing, W.Z. and Z.D.; visualization, L.Y.; supervision, W.Z.; project administration, W.Z.; funding acquisition, Z.D. All authors have read and agreed to the published version of the manuscript.
Funding
This study was funded by the China Agriculture Research System (CARS-25), funding projects for the high-quality development of the seed industry in Hubei Province (HBZY2023B004-5), the Young Foundation of Hubei Academy of Agricultural Sciences (2023NKYJJ08), the Natural Science Foundation of Hubei Province (2024AFC009), Open Fund of Hubei Key Laboratory of Vegetable Germplasm Enhancement and Genetic Improvement (2024HBSCSZ01), The Innovation Team Project of Hubei Agricultural Science and Technology Innovation Center (2024-620-000-001-007).
Data Availability Statement
The resequencing data of CG058 and CG265 are available on the NCBI website (https://www.ncbi.nlm.nih.gov/biosample/, accessed on 17 October 2021) under the accession numbers SAMN22357444 and SAMN22357441, respectively.
Acknowledgments
We thank QinSheng Gu of the Zhengzhou Fruit Research Institute, Chinese Academy of Agricultural Sciences, for supplying the pV190 plasmid.
Conflicts of Interest
The authors declare no conflicts of interest. The funders had no role in the design of the study; in the collection, analyses, or interpretation of data; in the writing of the manuscript; or in the decision to publish the results.
Abbreviations
The following abbreviations are used in this manuscript:
| bp | Base pair |
| cM | Centimorgan |
| SNP | Single nucleotide polymorphism |
| CAPS | Cleaved amplified polymorphic sequence |
| InDel | Insertion-deletion |
| LOD | Log-likelihood |
| DAP | Days after pollination |
| Chl | Chlorophyll |
| CP | Chloroplast |
| VIGS | Virus-induced gene silencing |
References
- Zhu, H.; Song, P.; Koo, D.H.; Guo, L.; Li, Y.; Sun, S.; Weng, Y.; Yang, L. Genome wide characterization of simple sequence repeats in watermelon genome and their application in comparative mapping and genetic diversity analysis. BMC Genom. 2016, 17, 557. [Google Scholar] [CrossRef] [PubMed]
- Tang, H.Y.; Dong, X.; Wang, J.K.; Xia, J.H.; Xie, F.; Zhang, Y.; Yao, X.; Xu, Y.J.; Wang, Z.J. Fine Mapping and Candidate Gene Prediction for White Immature Fruit Skin in Cucumber (Cucumis sativus L.). Int. J. Mol. Sci. 2018, 19, 1493. [Google Scholar] [CrossRef] [PubMed]
- Li, B.; Zhao, S.; Dou, J.; Ali, A.; Gebremeskel, H.; Gao, L.; He, N.; Lu, X.; Liu, W. Genetic mapping and development of molecular markers for a candidate gene locus controlling rind color in watermelon. Theor. Appl. Genet. 2019, 132, 2741–2753. [Google Scholar] [CrossRef] [PubMed]
- Fang, H.; Wang, P.; Wang, W.; Peng, J.; Zheng, J.; Zhu, G.; Zhong, C.; Yu, W. Fine mapping and identification of SmAPRR2 regulating rind color in Eggplant (Solanum melongena L.). Int. J. Mol. Sci. 2023, 24, 3059. [Google Scholar] [CrossRef] [PubMed]
- Masuda, T.; Fujita, Y. Regulation and evolution of chlorophyll metabolism. Photochem Photobiol Sci. 2008, 7, 1131–1149. [Google Scholar] [CrossRef] [PubMed]
- Walker, C.J.; Weinstein, J.D. The magnesium-insertion step of chlorophyll biosynthesis is a two-stage reaction. Biochem. J. 1994, 299 Pt 1, 277–284. [Google Scholar] [CrossRef]
- Tanaka, R.; Tanaka, A. Chlorophyll cycle regulates the construction and destruction of the light-harvesting complexes. Biochim. Biophys. Acta 2011, 1807, 968–976. [Google Scholar] [CrossRef] [PubMed]
- Wang, P.; Grimm, B. Connecting chlorophyll metabolism with accumulation of the photosynthetic apparatus. Trends Plant Sci. 2021, 26, 484–495. [Google Scholar] [CrossRef] [PubMed]
- Park, S.-w.; Kim, K.-T.; Kang, S.-C.; Yang, H.-B. Rapid and practical molecular marker development for rind traits in watermelon. Hortic. Environ. Biotechnol. 2016, 57, 385–391. [Google Scholar] [CrossRef]
- Dou, J.; Lu, X.; Ali, A.; Zhao, S.; Zhang, L.; He, N.; Liu, W. Genetic mapping reveals a marker for yellow skin in watermelon (Citrullus lanatus L.). PLoS One 2018, 13, e0200617. [Google Scholar] [CrossRef]
- Liu, D.; Yang, H.; Yuan, Y.; Zhu, H.; Zhang, M.; Wei, X.; Sun, D.; Wang, X.; Yang, S.; Yang, L. Comparative transcriptome analysis provides insights into yellow rind formation and preliminary mapping of the Clyr (Yellow Rind) gene in watermelon. Front. Plant Sci. 2020, 11, 192. [Google Scholar] [CrossRef]
- Kumar, R.; Wehner, T.C. Discovery of second gene for solid dark green versus light green rind pattern in watermelon. J. Hered. 2011, 102, 489–493. [Google Scholar] [CrossRef]
- Guo, S.; Zhang, J.; Sun, H.; Salse, J.; Lucas, W.J.; Zhang, H.; Zheng, Y.; Mao, L.; Ren, Y.; Wang, Z.; et al. The draft genome of watermelon (Citrullus lanatus) and resequencing of 20 diverse accessions. Nat. Genet. 2013, 45, 51–58. [Google Scholar] [CrossRef] [PubMed]
- Guo, S.; Zhao, S.; Sun, H.; Wang, X.; Wu, S.; Lin, T.; Ren, Y.; Gao, L.; Deng, Y.; Zhang, J.; et al. Resequencing of 414 cultivated and wild watermelon accessions identifies selection for fruit quality traits. Nat. Genet. 2019, 51, 1616–1623. [Google Scholar] [CrossRef] [PubMed]
- Maragal, S.; Nagesh, G.C.; Reddy, D.C.L.; Rao, E.S. QTL mapping identifies novel loci and putative candidate genes for rind traits in watermelon. 3 Biotech. 2022, 12, 46. [Google Scholar] [CrossRef]
- Lee, S.; Jang, G.; Choi, Y.; Park, G.; Park, S.; Kwon, G.; Je, B.; Park, Y. Identification of candidate genes for rind color and bloom formation in watermelon fruits based on a Quantitative Trait Locus-Seq. Plants 2022, 11, 2739. [Google Scholar] [CrossRef] [PubMed]
- Oren, E.; Tzuri, G.; Vexler, L.; Dafna, A.; Meir, A.; Faigenboim, A.; Kenigswald, M.; Portnoy, V.; Schaffer, A.A.; Levi, A.; et al. The multi-allelic APRR2 gene is associated with fruit pigment accumulation in melon and watermelon. J. Exp. Bot. 2019, 70, 3781–3794. [Google Scholar] [CrossRef]
- Tian, L.; Liu, L.; Jiang, Y.; Yang, Y.; Dong, G.; Yu, H. Tobacco rattle virus-induced VcANS gene silencing in blueberry fruit. Gene 2023, 852, 147054. [Google Scholar] [CrossRef] [PubMed]
- Wei, W.; Yang, Y.Y.; Lakshmanan, P.; Kuang, J.F.; Lu, W.J.; Pang, X.Q.; Chen, J.Y.; Shan, W. Proteasomal degradation of MaMYB60 mediated by the E3 ligase MaBAH1 causes high temperature-induced repression of chlorophyll catabolism and green ripening in banana. Plant Cell 2023, 35, 1408–1428. [Google Scholar] [CrossRef]
- Su, W.; Shao, Z.; Wang, M.; Gan, X.; Yang, X.; Lin, S. EjBZR1 represses fruit enlargement by binding to the EjCYP90 promoter in loquat. Hortic. Res. 2021, 8, 152. [Google Scholar] [CrossRef]
- Liu, H.; Meng, H.; Pan, Y.; Liang, X.; Jiao, J.; Li, Y.; Chen, S.; Cheng, Z. Fine genetic mapping of the white immature fruit color gene w to a 33.0-kb region in cucumber (Cucumis sativus L.). Theor. Appl. Genet. 2015, 128, 2375–2385. [Google Scholar] [CrossRef]
- Ma, L.; Liu, Z.; Cheng, Z.; Gou, J.; Chen, J.; Yu, W.; Wang, P. Identification and application of BhAPRR2 controlling peel colour in Wax Gourd (Benincasa hispida). Front. Plant Sci. 2021, 12, 716772. [Google Scholar] [CrossRef] [PubMed]
- Liu, W.; Fu, Y.; Hu, G.; Si, H.; Zhu, L.; Wu, C.; Sun, Z. Identification and fine mapping of a thermo-sensitive chlorophyll deficient mutant in rice (Oryza sativa L.). Planta 2007, 226, 785–795. [Google Scholar] [CrossRef]
- Brand, A.; Borovsky, Y.; Hill, T.; Rahman, K.A.; Bellalou, A.; Van Deynze, A.; Paran, I. CaGLK2 regulates natural variation of chlorophyll content and fruit color in pepper fruit. Theor. Appl. Genet. 2014, 127, 2139–2148. [Google Scholar] [CrossRef] [PubMed]
- Pan, Y.; Bradley, G.; Pyke, K.; Ball, G.; Lu, C.; Fray, R.; Marshall, A.; Jayasuta, S.; Baxter, C.; van Wijk, R.; et al. Network inference analysis identifies an APRR2-like gene linked to pigment accumulation in tomato and pepper fruits. Plant Physiol. 2013, 161, 1476–1485. [Google Scholar] [CrossRef]
- Huo, Y.; Zhang, G.; Yu, W.; Liu, Z.; Shen, M.; Zhao, R.; Hu, S.; Zheng, X.; Wang, P.; Yang, Y. Forward genetic studies reveal LsAPRR2 as a key gene in regulating the green color of pericarp in bottle gourd (Lagenaria siceraria). Front. Plant Sci. 2023, 14, 1130669. [Google Scholar] [CrossRef] [PubMed]
- Moore, L.D.; Le, T.; Fan, G. DNA methylation and its basic function. Neuropsychopharmacology 2013, 38, 23–38. [Google Scholar] [CrossRef]
- Wang, Q.; Wang, Y.; Sun, H.; Sun, L.; Zhang, L. Transposon-induced methylation of the RsMYB1 promoter disturbs anthocyanin accumulation in red-fleshed radish. J. Exp. Bot. 2020, 71, 2537–2550. [Google Scholar] [CrossRef] [PubMed]
- Tang, M.; Xue, W.; Li, X.; Wang, L.; Wang, M.; Wang, W.; Yin, X.; Chen, B.; Qu, X.; Li, J.; et al. Mitotically heritable epigenetic modifications of CmMYB6 control anthocyanin biosynthesis in chrysanthemum. New Phytol. 2022, 236, 1075–1088. [Google Scholar] [CrossRef]
- Zhu, X.; Tai, X.; Ren, Y.; Chen, J.; Bo, T. Genome-Wide Analysis of Coding and Long Non-Coding RNAs Involved in Cuticular Wax Biosynthesis in Cabbage (Brassica oleracea L. var. capitata). Int. J. Mol. Sci. 2019, 20, 2820. [Google Scholar] [CrossRef]
- Arnon, D.I. Copper enzymes in isolated chloroplasts. Polyphenoloxidase in Beta vulgaris. Plant Physiol. 1949, 24, 1–15. [Google Scholar] [CrossRef]
- Yi, L.; Zhou, W.; Zhang, Y.; Chen, Z.; Wu, N.; Wang, Y.; Dai, Z. Genetic mapping of a single nuclear locus determines the white flesh color in watermelon (Citrullus lanatus L.). Front. Plant Sci. 2023, 14, 1090009. [Google Scholar] [CrossRef] [PubMed]
- Porebski, S.; Bailey, L.G.; Baum, B.R. Modification of a CTAB DNA extraction protocol for plants containing high polysaccharide and polyphenol components. Plant Mol. Biol. Rep. 1997, 15, 8–15. [Google Scholar] [CrossRef]
- Chen, S.; Zhou, Y.; Chen, Y.; Gu, J. fastp: An ultra-fast all-in-one FASTQ preprocessor. Bioinformatics 2018, 34, i884–i890. [Google Scholar] [CrossRef] [PubMed]
- McKenna, A.; Hanna, M.; Banks, E.; Sivachenko, A.; Cibulskis, K.; Kernytsky, A.; Garimella, K.; Altshuler, D.; Gabriel, S.; Daly, M.; et al. The Genome Analysis Toolkit: A MapReduce framework for analyzing next-generation DNA sequencing data. Genome Res. 2010, 20, 1297–1303. [Google Scholar] [CrossRef] [PubMed]
- Li, H.; Ye, G.; Wang, J. A modified algorithm for the improvement of composite interval mapping. Genetics 2007, 175, 361–374. [Google Scholar] [CrossRef] [PubMed]
- Livak, K.J.; Schmittgen, T.D. Analysis of relative gene expression data using real-time quantitative PCR and the 2−ΔΔCT Method. Methods 2001, 25, 402–408. [Google Scholar] [CrossRef]
- Liu, M.; Liang, Z.; Aranda, M.A.; Hong, N.; Liu, L.; Kang, B.; Gu, Q. A cucumber green mottle mosaic virus vector for virus-induced gene silencing in cucurbit plants. Plant Methods 2020, 16, 9. [Google Scholar] [CrossRef]
- Ma, Y.; Wang, Y.; Zhou, Z.; Zhang, R.; Xie, Y.; Zhang, Y.; Bo, Y.; Lyu, X.; Yang, J.; Zhang, M.; et al. A large presence/absence variation in the promotor of the ClLOG gene determines trichome elongation in watermelon. Theor. Appl. Genet. 2024, 137, 98. [Google Scholar] [CrossRef] [PubMed]
Disclaimer/Publisher’s Note: The statements, opinions and data contained in all publications are solely those of the individual author(s) and contributor(s) and not of MDPI and/or the editor(s). MDPI and/or the editor(s) disclaim responsibility for any injury to people or property resulting from any ideas, methods, instructions or products referred to in the content. |
© 2025 by the authors. Licensee MDPI, Basel, Switzerland. This article is an open access article distributed under the terms and conditions of the Creative Commons Attribution (CC BY) license (https://creativecommons.org/licenses/by/4.0/).