Article

Straw Addition Enhances Crop Yield, Soil Aggregation, and Soil Microorganisms in a 14-Year Wheat–Rice Rotation System in Central China

1
Key Laboratory of Fertilization from Agricultural Wastes, Ministry of Agriculture and Rural Affairs, National Station for Qianjiang Agro-Environment, Institute of Plant Protection and Soil Fertilizer, Hubei Academy of Agricultural Sciences, Wuhan 430064, China
2
Tobacco Research Institute, Anhui Academy of Agricultural Sciences (AAAS), Hefei 230001, China
3
Microelement Research Center, College of Resources and Environment, Huazhong Agricultural University, Wuhan 430070, China
4
College of Resources and Environment, Zhongkai University of Agriculture and Engineering, Guangzhou 510225, China
*
Author to whom correspondence should be addressed.
These authors contributed equally to this work.
Plants 2024, 13(7), 985; https://doi.org/10.3390/plants13070985
Submission received: 22 January 2024 / Revised: 16 March 2024 / Accepted: 27 March 2024 / Published: 29 March 2024
(This article belongs to the Section Plant–Soil Interactions)

Abstract

:
Straw return utilizes waste resources to reduce the use of chemical fertilizers worldwide. However, information is still lacking on the relative impact of straw return on soil fertility, the nutrient composition of different soil aggregates, and soil microbial communities. Therefore, this study aimed to understand the effects of different management practices on the crop yield, soil fertility, and soil community composition in a 14-year wheat–rice rotation system. The treatments included a control (without fertilizer and straw addition), chemical fertilization (NPK), straw return without fertilizer (S), and straw addition with chemical fertilizer (NPKS). The results showed that NPKS improved the wheat and rice yield by 185.12% and 88.02%, respectively, compared to the CK treatment. Additionally, compared to the CK treatment, the N, P, and K contents of the wheat stem were increased by 39.02%, 125%, and 20.23% under the NPKS treatment. Compared to the CK treatment, SOM, TN, TP, AN, AP, AK, CEC, AFe, AMn, ACu, and AZn were increased by 49.12%, 32.62%, 35.06%, 22.89%, 129.36%, 48.34%, 13.40%, 133.95%, 58.98%, 18.26% and 33.33% under the NPKS treatment, respectively. Moreover, straw addition promoted the creation and stabilization of macro-aggregates in crop soils. The relative abundance of macro-aggregates (0.25–2 mm) increased from 37.49% to 52.97%. Straw addition was associated with a higher proportion of aromatic and carbonyl carbon groups in the soil, which, in turn, promoted the formation of macro-aggregates. Redundancy analysis showed that straw return significantly increased the microbial community diversity. These findings demonstrate that straw addition together with chemical fertilizer could increase the crop yield by improving soil fertility, soil aggregate stability, and the diversity of fungi.

1. Introduction

Soil aggregates can affect many physical and chemical processes in the soil, including the recycling of nutrients, soil properties, and soil erosion [1]. The stability of soil aggregates is influenced by soil properties such as the soil texture, organic carbon, and pH, which, in turn, contribute to the formation and stability of the soil structure [2,3]. In the topsoil, 90% of soil organic carbon (SOC) is stored in soil aggregates [4]. SOC is an important indicator of soil health, and its content can influence the soil aggregate composition and its long-term stability [2,5,6]. Soil aggregates also play a crucial role in regulating the decomposition of SOC [7], while soil aggregates generally promote soil carbon sequestration by providing a physical barrier between organic carbon and microbial decomposers [8,9]). Research has shown that soil aggregates are complex, and various environmental variables, including the soil CEC, porosity, moisture, and inorganic C content, influence the soil aggregate size and stability [10]. This is critical, as microorganisms in the soil directly impact nutrient turnover, especially in the decomposition of organic matter [11,12].
Globally, approximately 6.2 billion tons of straw are produced every year [13]. China alone produced 850 million tons of straw in 2017 [14]. Considerable research has been conducted to reuse the residues from this production, rather than simply burning straw waste [15]. Consequently, research has prioritized making full use of crop waste to reduce reliance on chemical fertilizers, improve soil fertility, and develop sustainable agriculture [16,17].
Crop straw residues contain a variety of nutrients that can indirectly release a large amount of nutrients into the soil and gradually change the soil environment [18]. Researchers have found that straw return to the field generally improves soil conditions by enhancing the soil structure, porosity, and bulk density [19]. Moreover, straw return can not only improve the soil environment but also affect the carbon cycle [20]. Wang and Zhang [15] found that the application of waste residues alters the soil C/N ratio, and increases soil organic carbon mineralization. The input of organic matter, such as straw, can promote the creation of macroaggregates and significantly enhance the relative SOC content [21,22]. Soil aggregates also provide a habitat for soil microbes, thus directly affecting the soil microbial biomass, microbial diversity, and community structure [23]. Microorganisms play a critical role in mineralizing and cycling soil nutrients, which is indispensable in the process of straw decomposition [24]. Microorganisms release organic matter, which can create aggregates [25]. Large aggregates are formed by fungi, particularly arbuscular mycorrhizal fungi, through the production of hyphae and root hairs [21]. Moreover, the easily decomposed carbohydrates and amines in straw can be utilized by microorganisms, influencing the structure and diversity of the microbe community [26].
Research has been conducted on the mineralization of SOC as a result of straw return [18]. However, little research has explored the effect of straw return on organic carbon, the structure of different soil aggregates, and the soil microbial community after long-term application. Therefore, we explored how long-term fertilization and straw return influence crop yield, soil fertility, soil microbial activity, and the soil aggregate composition. We aim to provide a theoretical basis for the connection between the management and stability of the soil organic carbon pool and carbon sequestration potential in long-term rice–wheat rotation operations.

2. Materials and Methods

2.1. Experimental Site

The field experiment was located in Qianjiang (112°37′15.4″ E, 30°22′55.1″ N), Hubei province, China (established in 2005 and harvested in 2019). The soil was flavor-aquic soil developed from the parent material of river alluvium with a pH of 7.10, a soil organic matter (SOM) content of 20.62 g kg−1, a total nitrogen (TN) content of 1.53 g kg−1, a total phosphorus (TP) content of 0.88 g kg−1, an available nitrogen (AN) content of 121.30 mg kg−1, an available phosphorus (AP) content of 19.16 mg kg−1, an available potassium (AK) content of 59.10 mg kg−1 and a bulk density of 1.20 g cm−3. The wheat straw was taken from fields and had total N, P, and K contents of 0.54%, 0.09%, and 1.25%, respectively, as reported in our previous study [18].

2.2. Field Fertilization Experiment Design

Four different treatments were used, i.e., a control (CK, without chemical fertilizer and straw); NPK (chemical fertilizer alone); S (straw return alone); and NPKS (chemical fertilizers with straw return). In the rice season, 150 kg·hm−2 of N, 39 kg·hm−2 of P, and 75 kg·hm−2 of K fertilizers were applied. In the wheat season, 120 kg·hm−2 of N, 33 kg·hm−2 of P, and 50 kg·hm−2 of K fertilizers were applied. In addition, 6000 kg hm−2 of crushed wheat straw was applied to the field by crushing and covering. Each treatment was replicated four times, for a total of 16. Each plot in the field experiments covered 20 m2 in rice/wheat rotation. Rice was transplanted in early June every year and harvested at the end of September. Wheat was sown in early October and harvested in early May.

2.3. Sample Collection and Determination

2.3.1. Soil Samples

In each plot, soil samples were collected from the topsoil (0–20 cm). The air-dried soil samples were sieved (20-mesh and 100-mesh) for the determination of the soil’s chemical properties. The soil pH was measured using a pH meter (2.5:1 water/soil ratio) and the SOC was determined using a potassium dichromate oxidation–external heating method. The soil’s total nitrogen (TN) and total phosphorus (TP) were measured with the Kjeldahl method and the molybdenum blue method, respectively. The available nitrogen (AN), available phosphorus (AP), and available potassium (AK) were determined using alkali hydrolysis diffusion, NaHCO3 extraction molybdenum–antimony colorimetry, and CH3COONH4 extraction–flame photometry, respectively. The soil exchange calcium (ExCa) and exchange magnesium (ExMg) were measured through ammonium acetate extraction–atomic absorption spectrophotometry. The available soil iron (AFe), manganese (AMn), copper (ACu), and zinc (AZn) were determined with inductively coupled plasma spectroscopy (ICP-OES).
The soil samples were separated by size using sieves (0.053, 0.25, 2 mm) and were shaken for 30 min (soil aggregate analyzer, DIK-2012, Daiki Rika Kogyo Co., Ltd., Akagidai, Japan) [27]. The ratios of each aggregate group, namely the >2, 0.25–2, 0.053–0.25, and <0.053 mm fractions, were analyzed.
The soil aggregate stability was described by the mean weight diameter (MWD), geometric mean diameter (GMD), number of aggregates >0.25 mm (R0.25), and fractal dimension index (D) [28]. The soil porosity was measured with the loop-knife method, as described by Liu et al. [29].
For 13C-NMR analysis, the soil samples were pretreated with HF (10%) to remove Fe3+ and Mn2+. During pretreatment, 5 g of dried soil sample was placed into a 100 mL tube containing 50 mL of 10% HF solution. Each sample was then rinsed 8 times with 10% HF. Finally, the soil samples were rinsed several times with distilled water and then dried at 60 °C and sieved with 60-mesh sieves before NMR measurements [30].
The soil microbial DNA was extracted with soil DNA kits (Omega Biotek, Norcross, GA, USA). We used a NanoDrop 2000 Spectrophotometer (NanoDrop Technologies, Wilmington, DE, USA) and 1% agarose gel electrophoresis to measure the DNA purity and concentration. All purified amplicons from all samples (V3–V4 region of bacteria; ITS region of fungi) were submitted to Majorbio BioPharm Technology Co., Ltd. (Shanghai, China) for paired-end sequencing on the Illumina HiSeq platform. The primers 515F (5′-GTGCCAGCMGCCGCGG-3′) and 806R (5′-GGACTACHVGGGTWTCTAAT-3′) were used to amplify bacteria. In addition, ITS1F (5′-CTTGGTCATTTAGAGGAAGTAA-3′) and ITS2R (5′-GCTGCGTTCTTCATCGATGC-3′) were used to amplify fungi. The PCR products were recovered and checked using gel electrophoresis and Axy Prep DNA Gel Extraction Kits (Axygen Biosciences, UnionCity, CA, USA).

2.3.2. Plant Samples

The rice variety (J-Liangyou 1377) and wheat variety (Zhengmai 9023) were used in this experiment. Wheat samples were taken in summer (May 2019) and rice was harvested in autumn (September 2019). The plant nutrient concentrations were measured using an H2SO4–H2O2 digestion. We used an automated continuous flow analyzer to determine the plant N and P concentrations (AA3, Bran and Luebbe, Norderstedt, Germany). The potassium (K) content of the plant sample was assessed using a flame photometer (Flame Photometer PFP7, JENWAY, Staffordshire, UK).

2.4. Data Analysis

All data were expressed as mean ± standard deviation and calculated using Microsoft Excel (Microsoft Office, 2016). Statistical significance was evaluated via a one-way ANOVA with Duncan test (p < 0.05) or a two-way analysis of variance with SPSS (version 19.0). The RDA (vegan package), Mantel test (ggcor package) and two-factor network analyses were conducted to explore the relationship between the soil microbes and chemical properties with R software (version 4.2.3).

3. Results

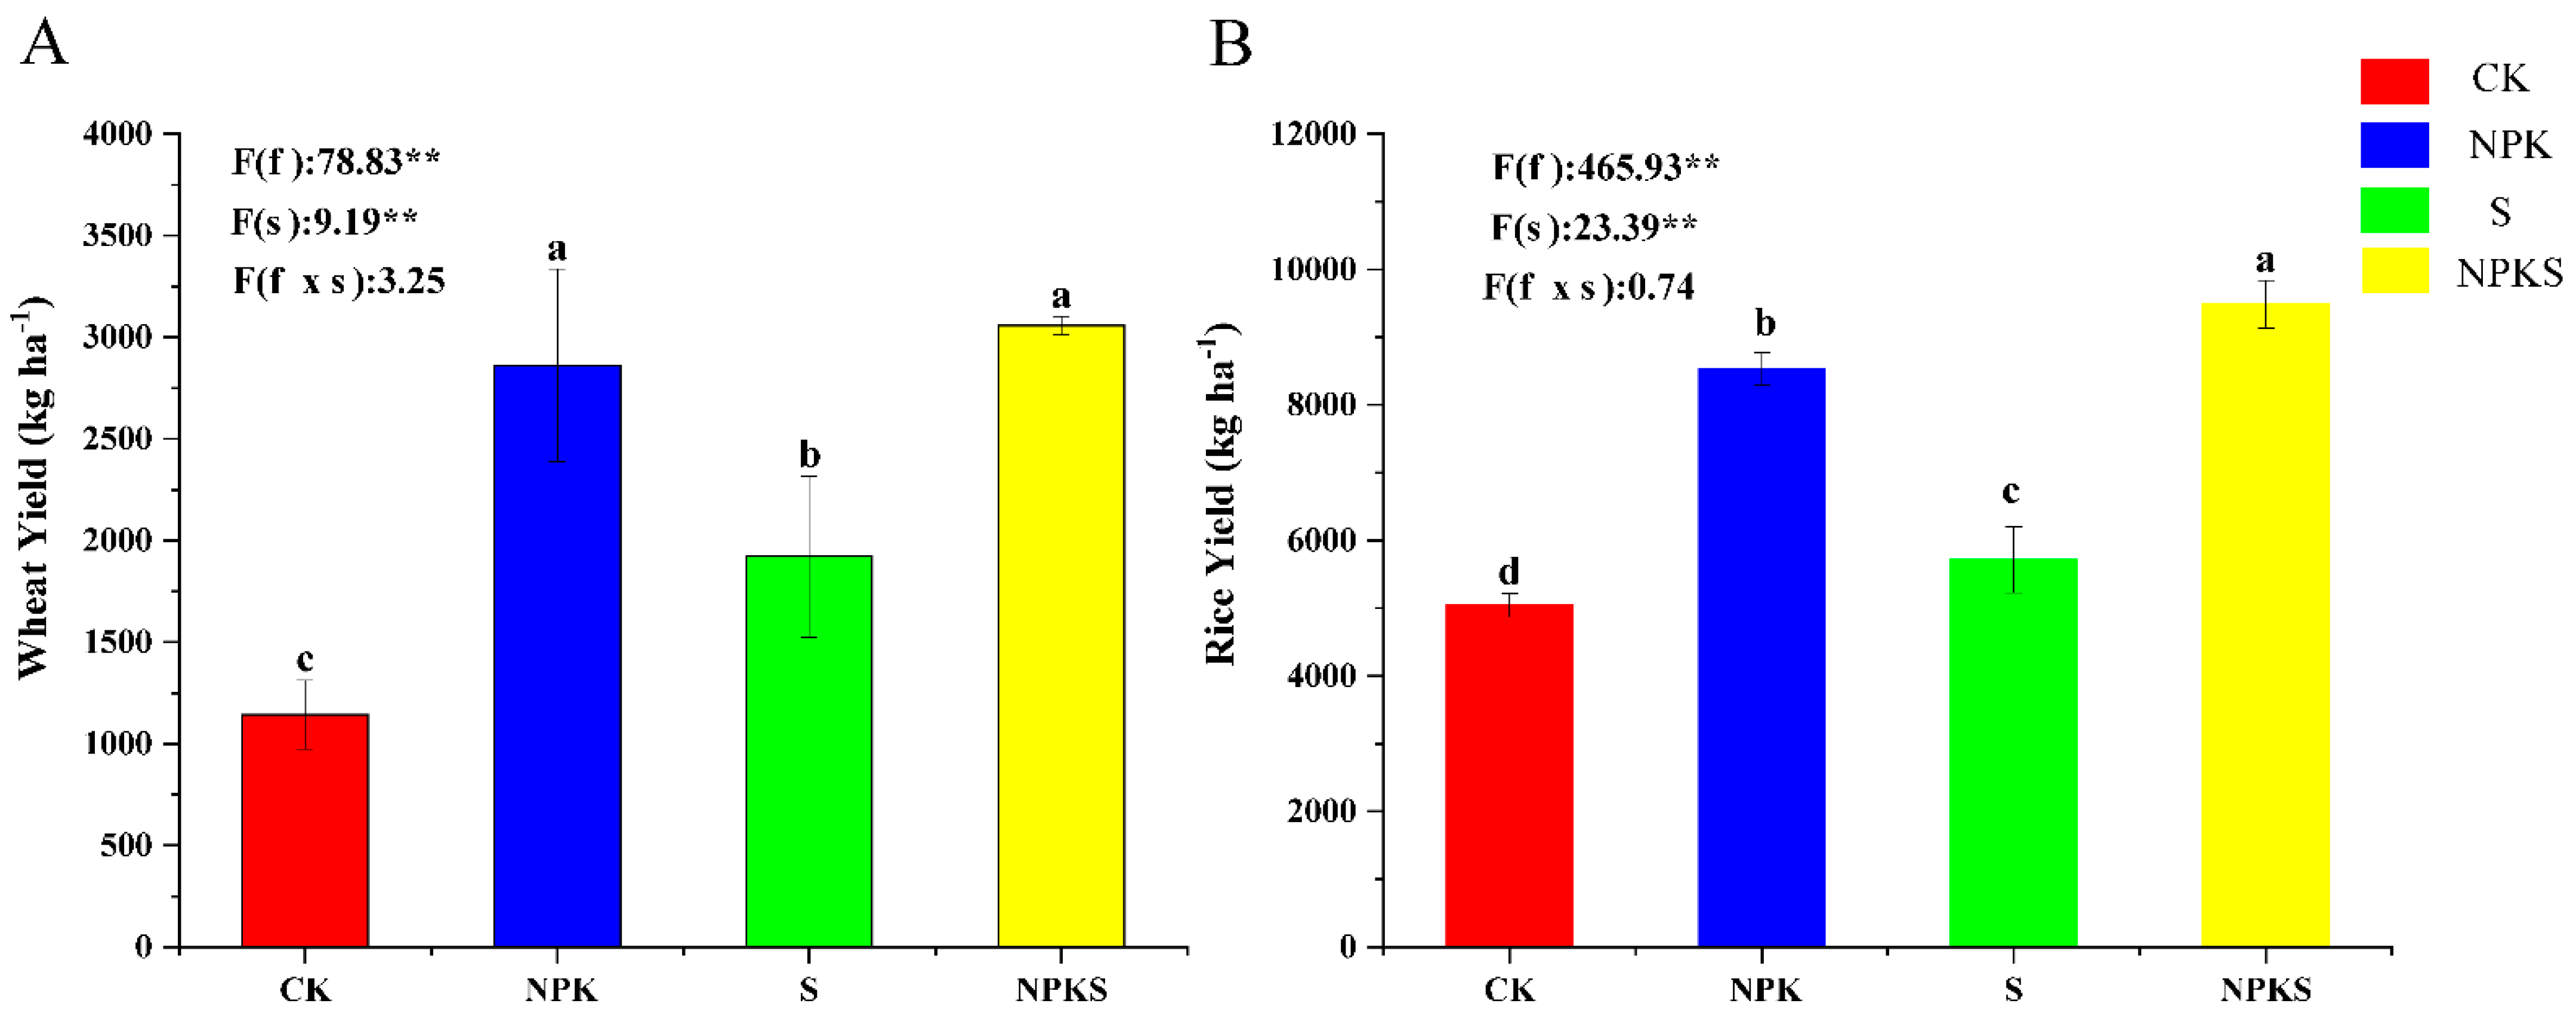
3.1. Effects of Straw Return and Fertilization on Crop Yield and Nutrient Absorption

The results showed that the wheat and rice yields increased under the NPKS treatment compared to CK. The yields of wheat and rice were increased from 1142.50 and 5045.45 kg ha−1 to 3057.50 and 9486.41 kg ha−1 under the NPKS treatment, representing an increase of 185.12% and 88.02%, respectively (Figure 1). In addition, it was found that the wheat and rice yields under the S treatment were significantly lower than those under the NPK treatment, representing a decrease of 32.87% and 33.01%, respectively (Figure 1). Two-factor ANOVA indicated that straw return and fertilization significantly affected the wheat and rice yield (p < 0.05) (Figure 1).
The N, P, and K contents in the crops were highest under the NPKS application in both wheat and rice, followed by the NPK, S, and CK treatment (Table 1). Compared to the CK treatment, the N, P, and K contents of the wheat stem were increased by 39.02%, 125%, and 20.23% under the NPKS treatment. However, the seed P content was significantly increased with straw return and the addition of fertilizer (Table 1). In addition, compared to the CK treatment, the N and K content of rice stems increased by 15.91% and 12.69%. Similarly, the K content of rice seed was significantly increased by 31.43% under the NPKS treatment (Table 1). Furthermore, the fertilization treatments significantly affected the N and P content of wheat (p < 0.05), and the straw return treatment significantly affected the K content of wheat and rice (Table 1).

3.2. Effects of Straw Return and Fertilization on Soil Fertility

The soil pH decreased by 0.26–0.48 units with chemical fertilizer (Table 2). Moreover, Table 2 shows that the SOM, TN, TP, AN, AP, AK, CEC, AFe, AMn, ACu, and AZn contents were increased by 49.12%, 32.62%, 35.06%, 22.89%, 129.36%, 48.34%, 13.40%, 133.95%, 58.98%, 18.26% and 33.33% under the NPKS treatment, respectively, compared to the CK treatment. Straw return influenced these metrics, and increased the SOM, TN, TP, AK, AMn, and AZn contents by 19.58%, 14.72%, 10.64%, 25.13%, 35.74%, and 27.66% with the NPKS treatment relative to chemical fertilizer alone (NPK) (Table 2). The main effects of straw had an obvious influence on soil fertility (p < 0.05) (Table 2).
Compared to the CK treatment, MBC (Microbial Biomass Carbon), MBN (Microbial Biomass Nitrogen) and MBP (Microbial Biomass Phosphorus) were increased by 82.16%, 91.17%, and 133.18% under the NPKS treatment (Figure 2A–C). Furthermore, compared to conventional fertilizer application (NPK treatment), MBC and MBN were significantly higher under straw return (NPKS) by 36.38, 56.59% (Figure 2A,B). In addition, the ratios of C:P and N:P were decreased by 25.37–33.20% and 19.30–40.17% with K fertilizer application (Figure 2D,E). Moreover, the straw return treatments affected the ratio of C:P and N:P (Figure 2D,E).

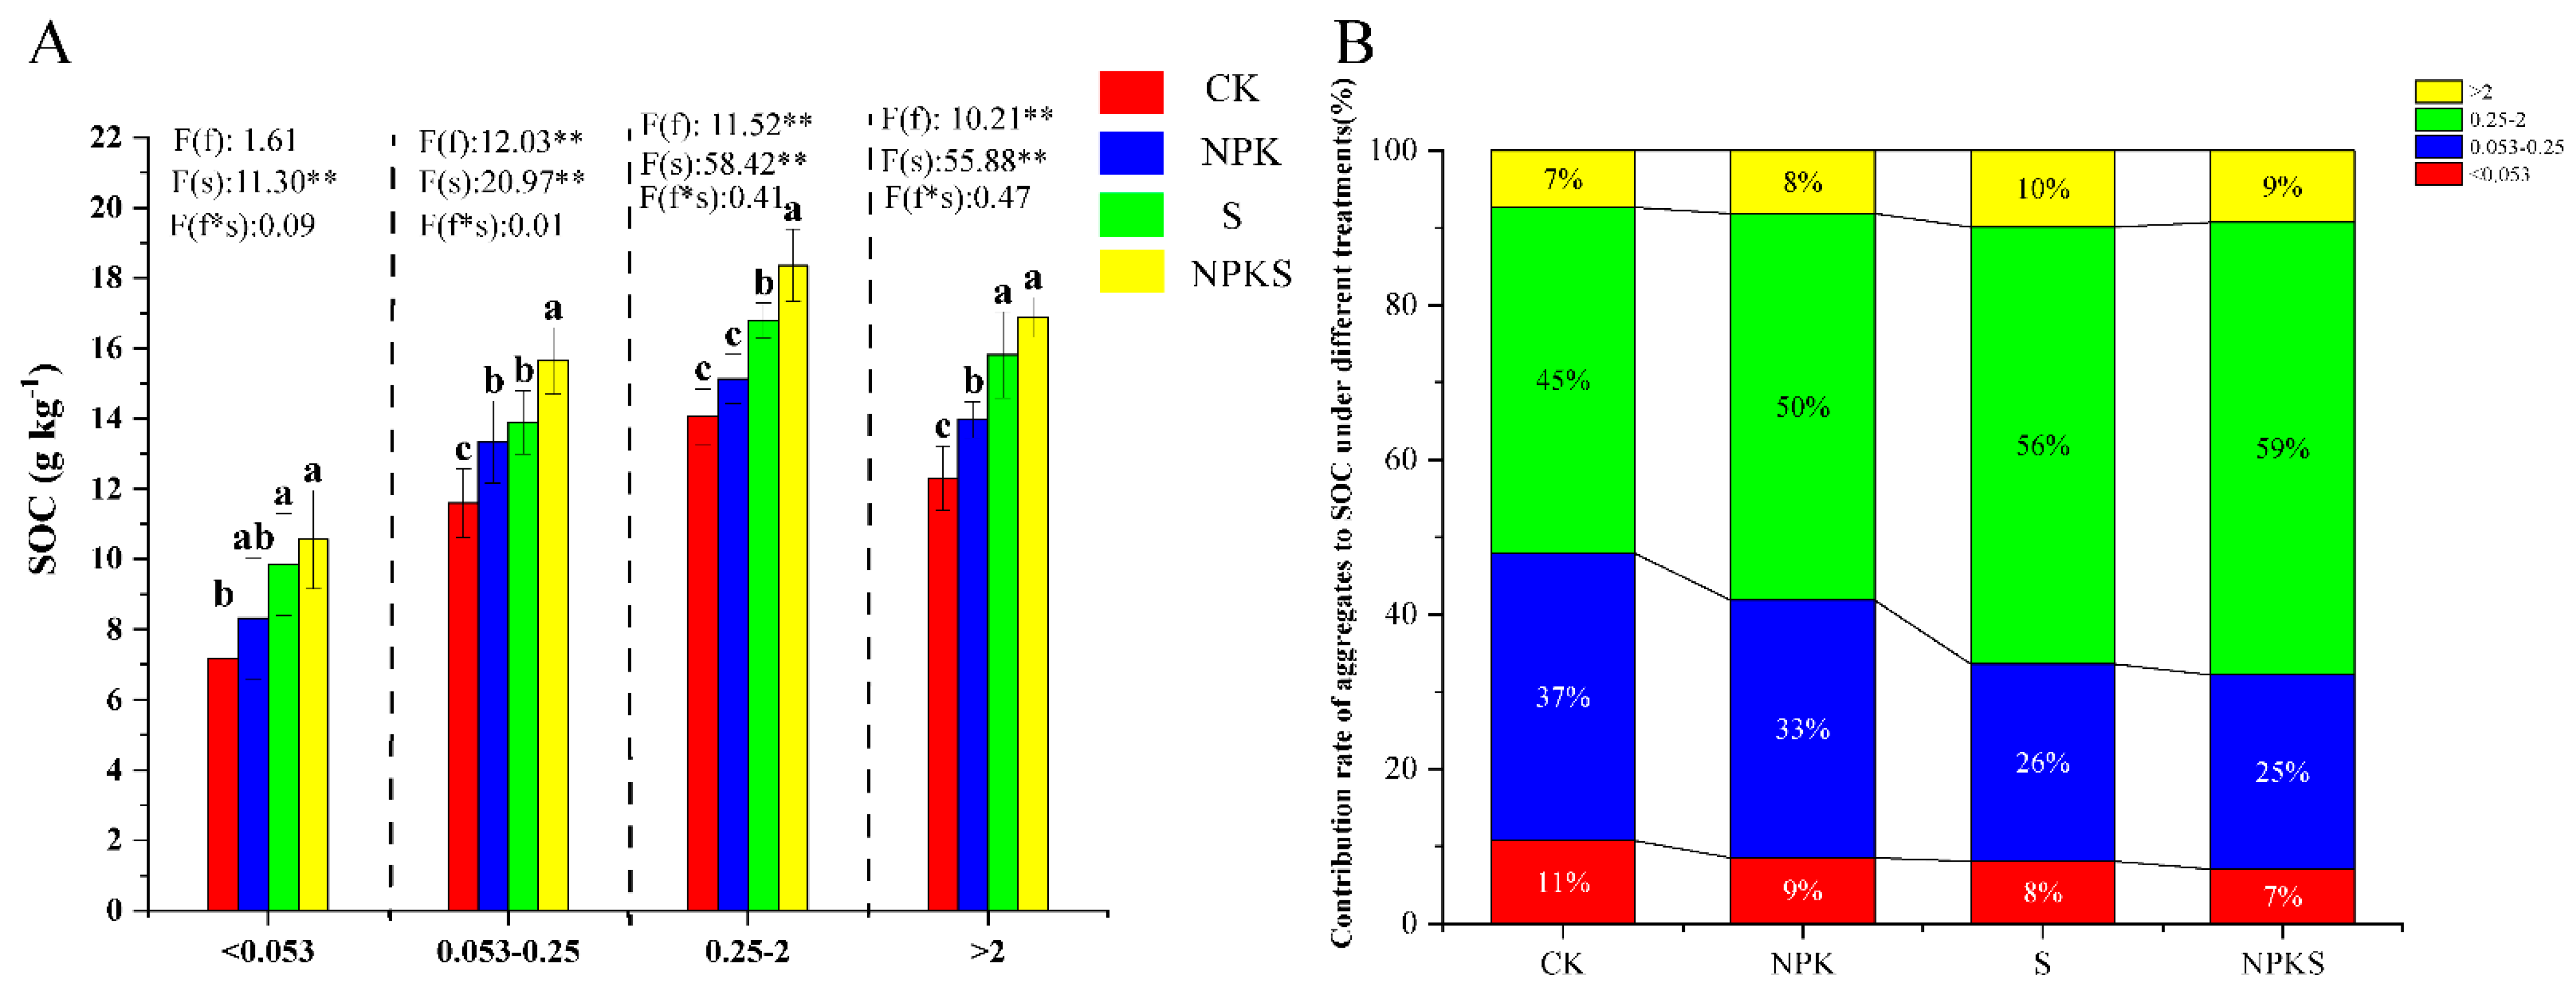
3.3. Effects of Straw Return and Fertilization on Soil Aggregates

Fertilizer and straw return application impacted the distribution and relative abundance of soil aggregates (Figure 3A). The 0.25–2 mm aggregates were the main component, followed by 0.053–0.25, <0.053 and >2 mm accounting for 26.68–37.78%, 11.20–17.62%, and 7.11–9.95%, respectively (Figure 3A). Interestingly, the relative proportion of 0.25–2 mm aggregates increased with the addition of chemical fertilizer and straw. The size of 0.25–2 mm aggregates was increased from 37.49% to 52.97% under the NPKS treatment (Figure 3B). A reduction in aggregate size was observed in the 0.053–0.25 mm and <0.053 mm aggregates, decreasing from 33.78% and 17.62% (CK) to 26.68% and 11.20% in the NPKS treatment, respectively (Figure 3B). Straw return had a significant effect on four sizes of soil aggregates (Figure 3B). The results of the soil aggregate stability are shown in Figure S1. Compared to the CK treatment, NPKS addition increased the MWD, GMD, and R0.25 with fertilizer and straw return (Figure S1). The results showed that straw return and fertilizer application had a positive influence on the soil aggregate stability (Figure S1). NPKS addition reduced soil bulk by 6.40–12% compared to the CK treatment, though the soil capillary porosity increased by 10.02% under the NPKS treatment (Table S1).

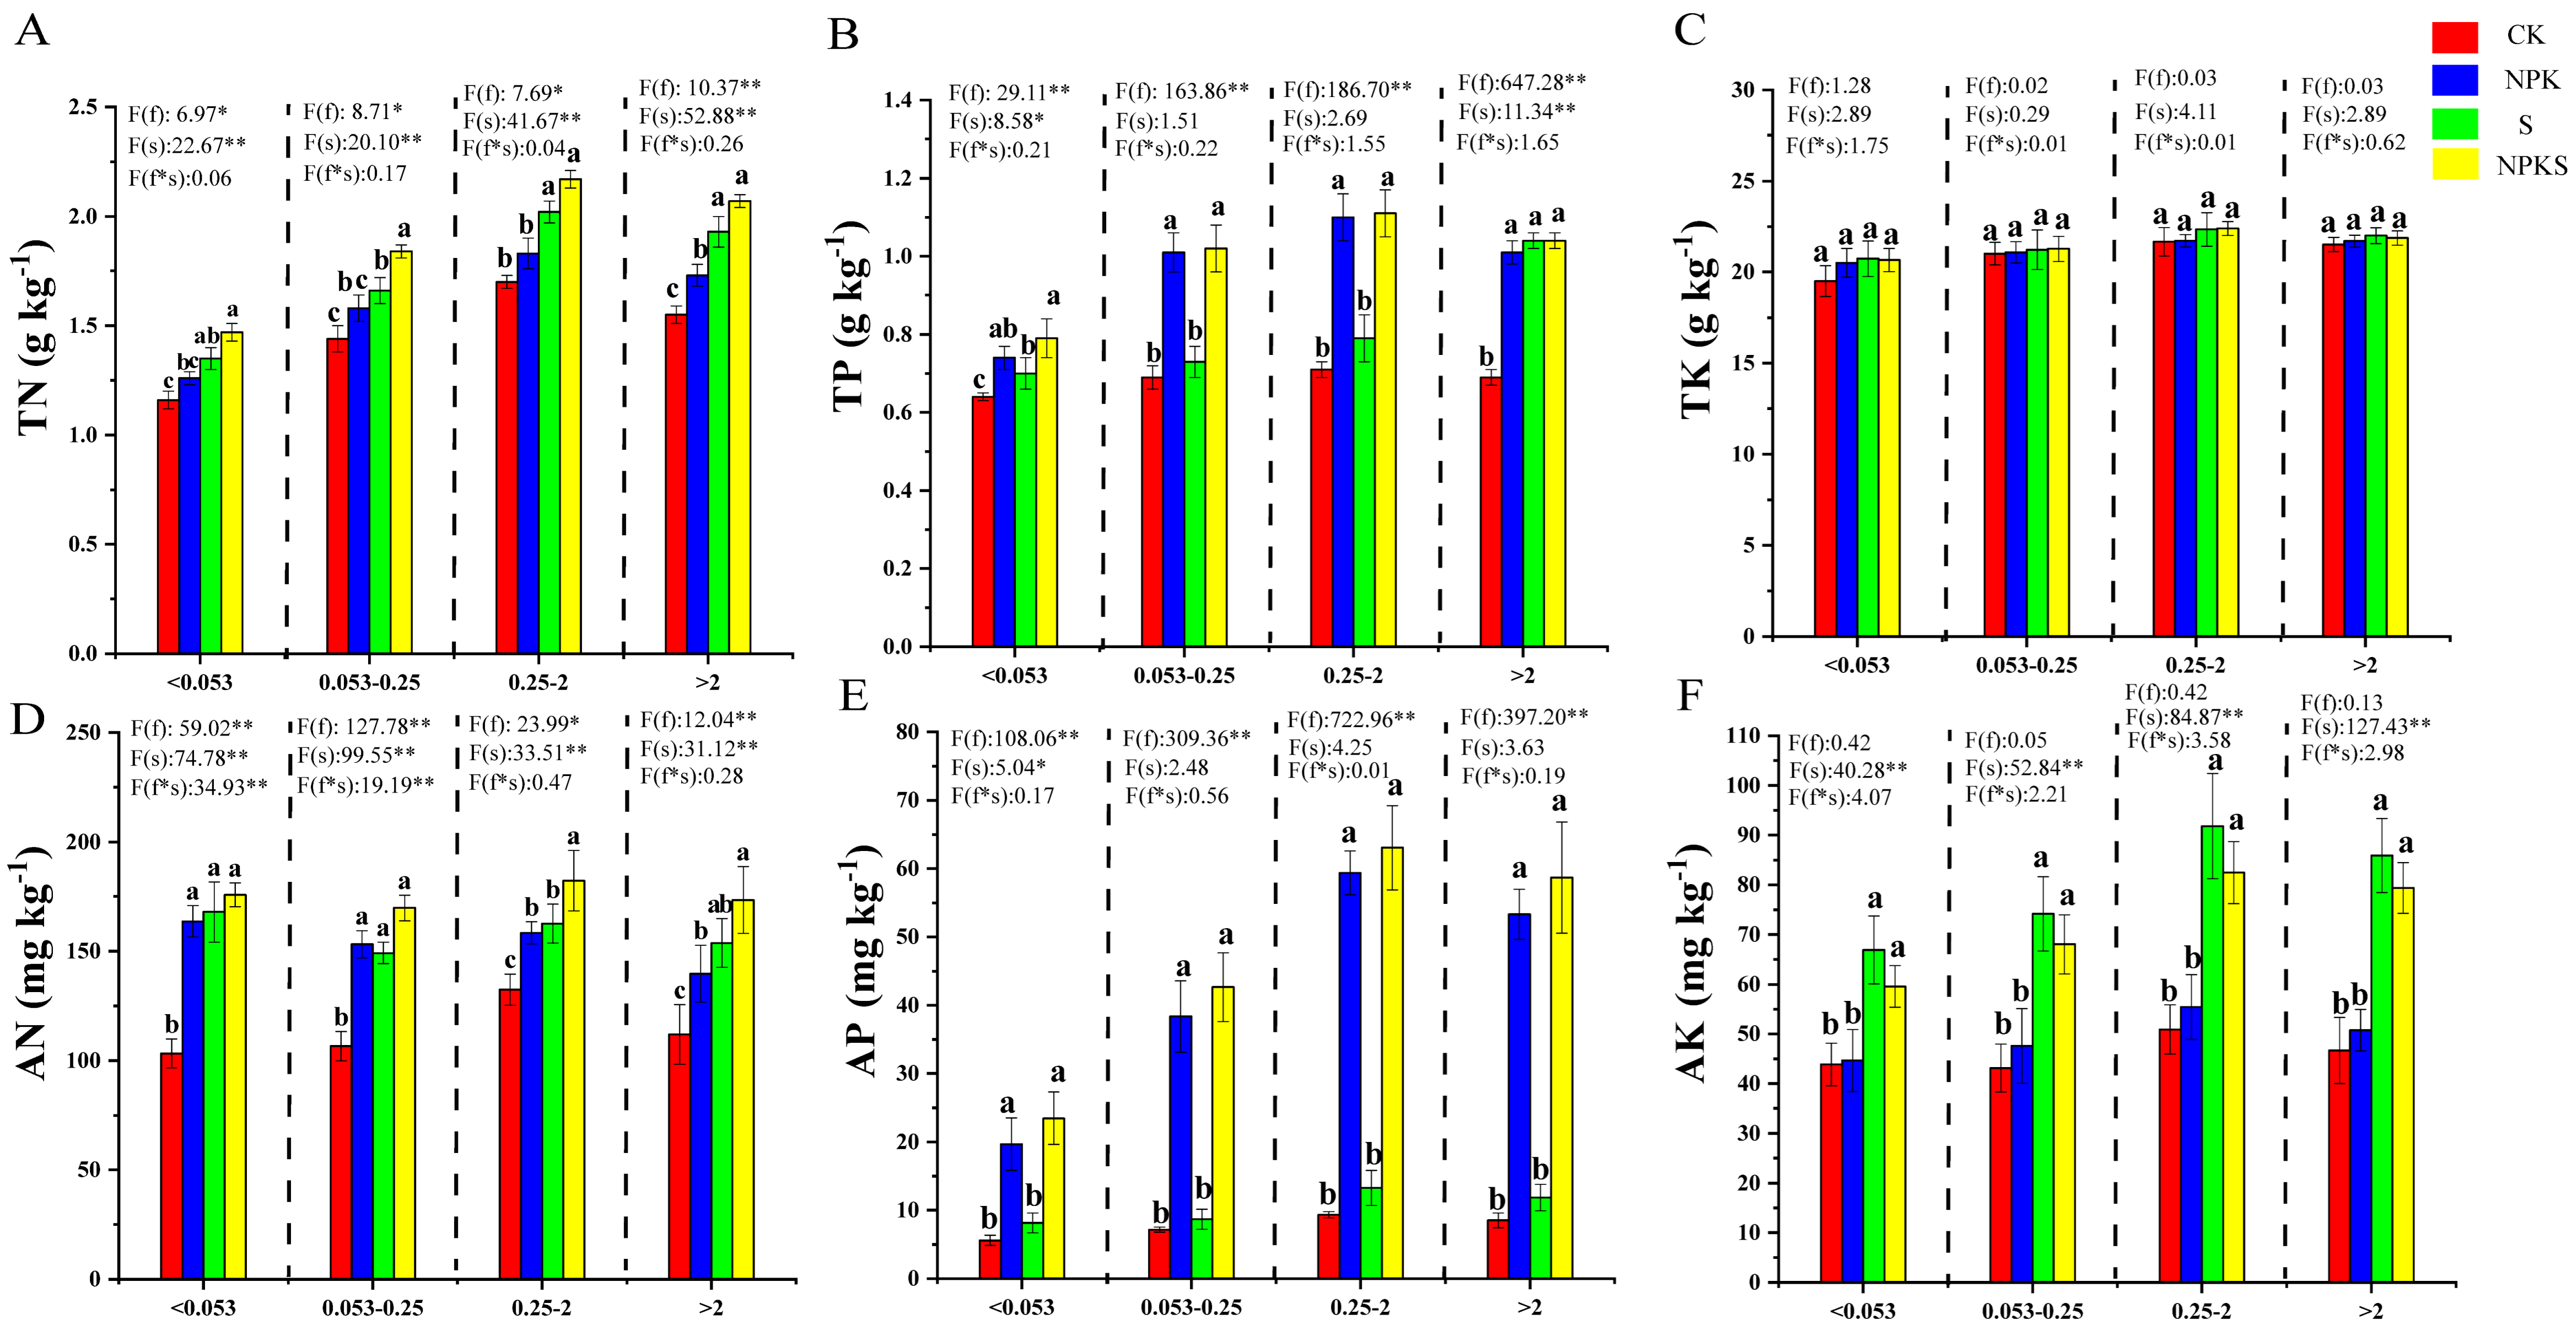
3.4. Effects of Straw Return and Fertilizer Application on the Nutrients of Soil Aggregates

The SOC content was highest in the NPKS treatment, followed by the S and NPK treatments, and CK soils contained the least SOC (Figure 4). The SOC content of differently sized aggregates (<0.053 mm, 0.053–0.25 mm, 0.25–2 mm, >2 mm) was significantly increased under NPKS by 47.28, 34.83, 30.58 and 37.12, respectively, when compared to CK. Straw addition influenced the SOC content of 0.053–0.25, 0.25–2, and >2 mm soil aggregates, and the SOC was 17.33, 21.35, and 20.83% higher when comparing the NPKS and NPK treatment (Figure 4A). The study found that the highest contribution rate of soil organic carbon (SOC) was observed in the 0.25–2 mm aggregates (45–59%) across all treatments. This was followed by the 0.053–0.25 mm aggregates and the 2 mm aggregate soils showing the lowest SOC contribution rate (7–10%) (Figure 4B). Additionally, the SOC contribution rate in the 0.25–2 mm aggregates increased with the addition of straw and fertilizer, while the other three sizes of soil aggregates showed a decrease (Figure 4B).
Alkyl-C and O-alkyl-C were the main functional groups of SOC in the soil (Table 3). A detailed analysis revealed that different soil aggregates had different responses to straw addition (Table 3). For soil aggregates > 2 mm in size, the relative percent of alkyl-C and carbonyl C was increased, while the O-alkyl C was decreased (Table 3). However, the ratio of alkyl-C and O-alkyl C was decreased, while the aromatic C and carbonyl C content was promoted in other soil aggregates (Table 3).
Compared to the CK treatment, the content of TN, TP, AN and AP increased under the NPKS treatment to different degrees in different soil aggregates (Figure 5). It was found that the fertilizer treatment significantly affected the soil P levels in different soil aggregates, whereas straw return had no significant effect on the soil P levels (except in the smallest and largest size fractions on TP level) (Figure 5B,E). It is noteworthy that the content of TK had no significant differences in the different soil aggregates among all treatments (Figure 5C). However, the soil AK was increased by 35.79%, 57.77%, 61.99%, and 70.04% in different soil aggregates under the NPKS treatment compared to the CK treatment (Figure 5E). Among all soil aggregates, the <0.053 mm aggregate had poor connections with soil nutrients compared to the other sizes of soil aggregate (Figure S2).

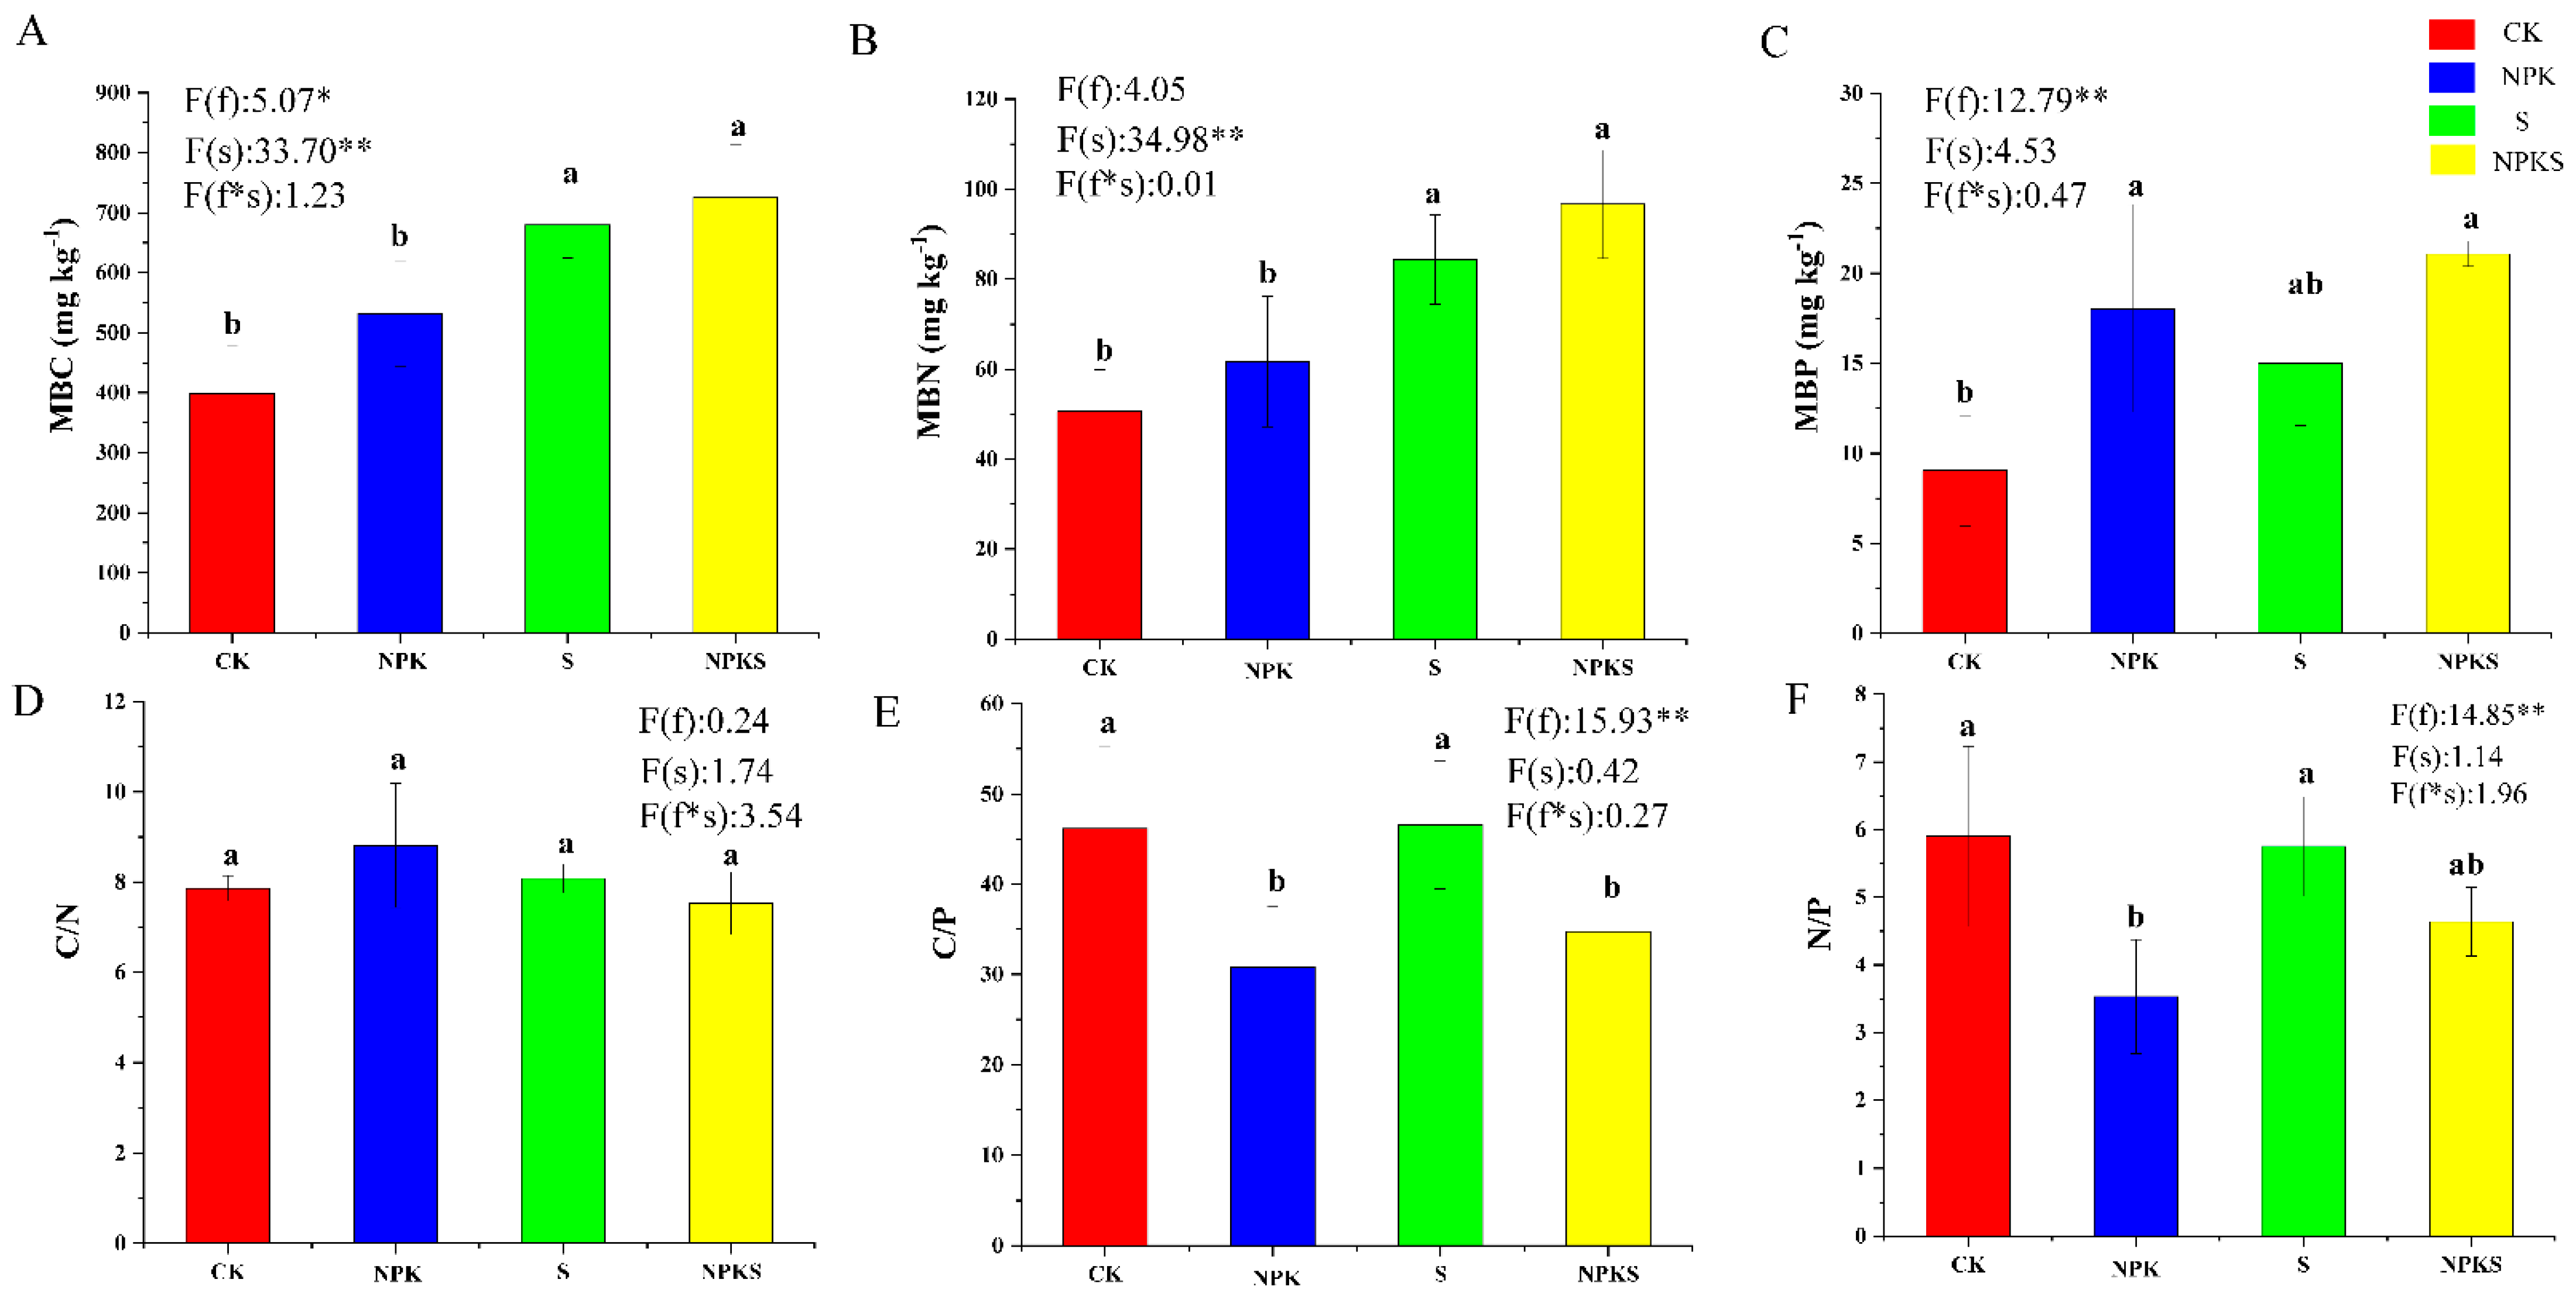
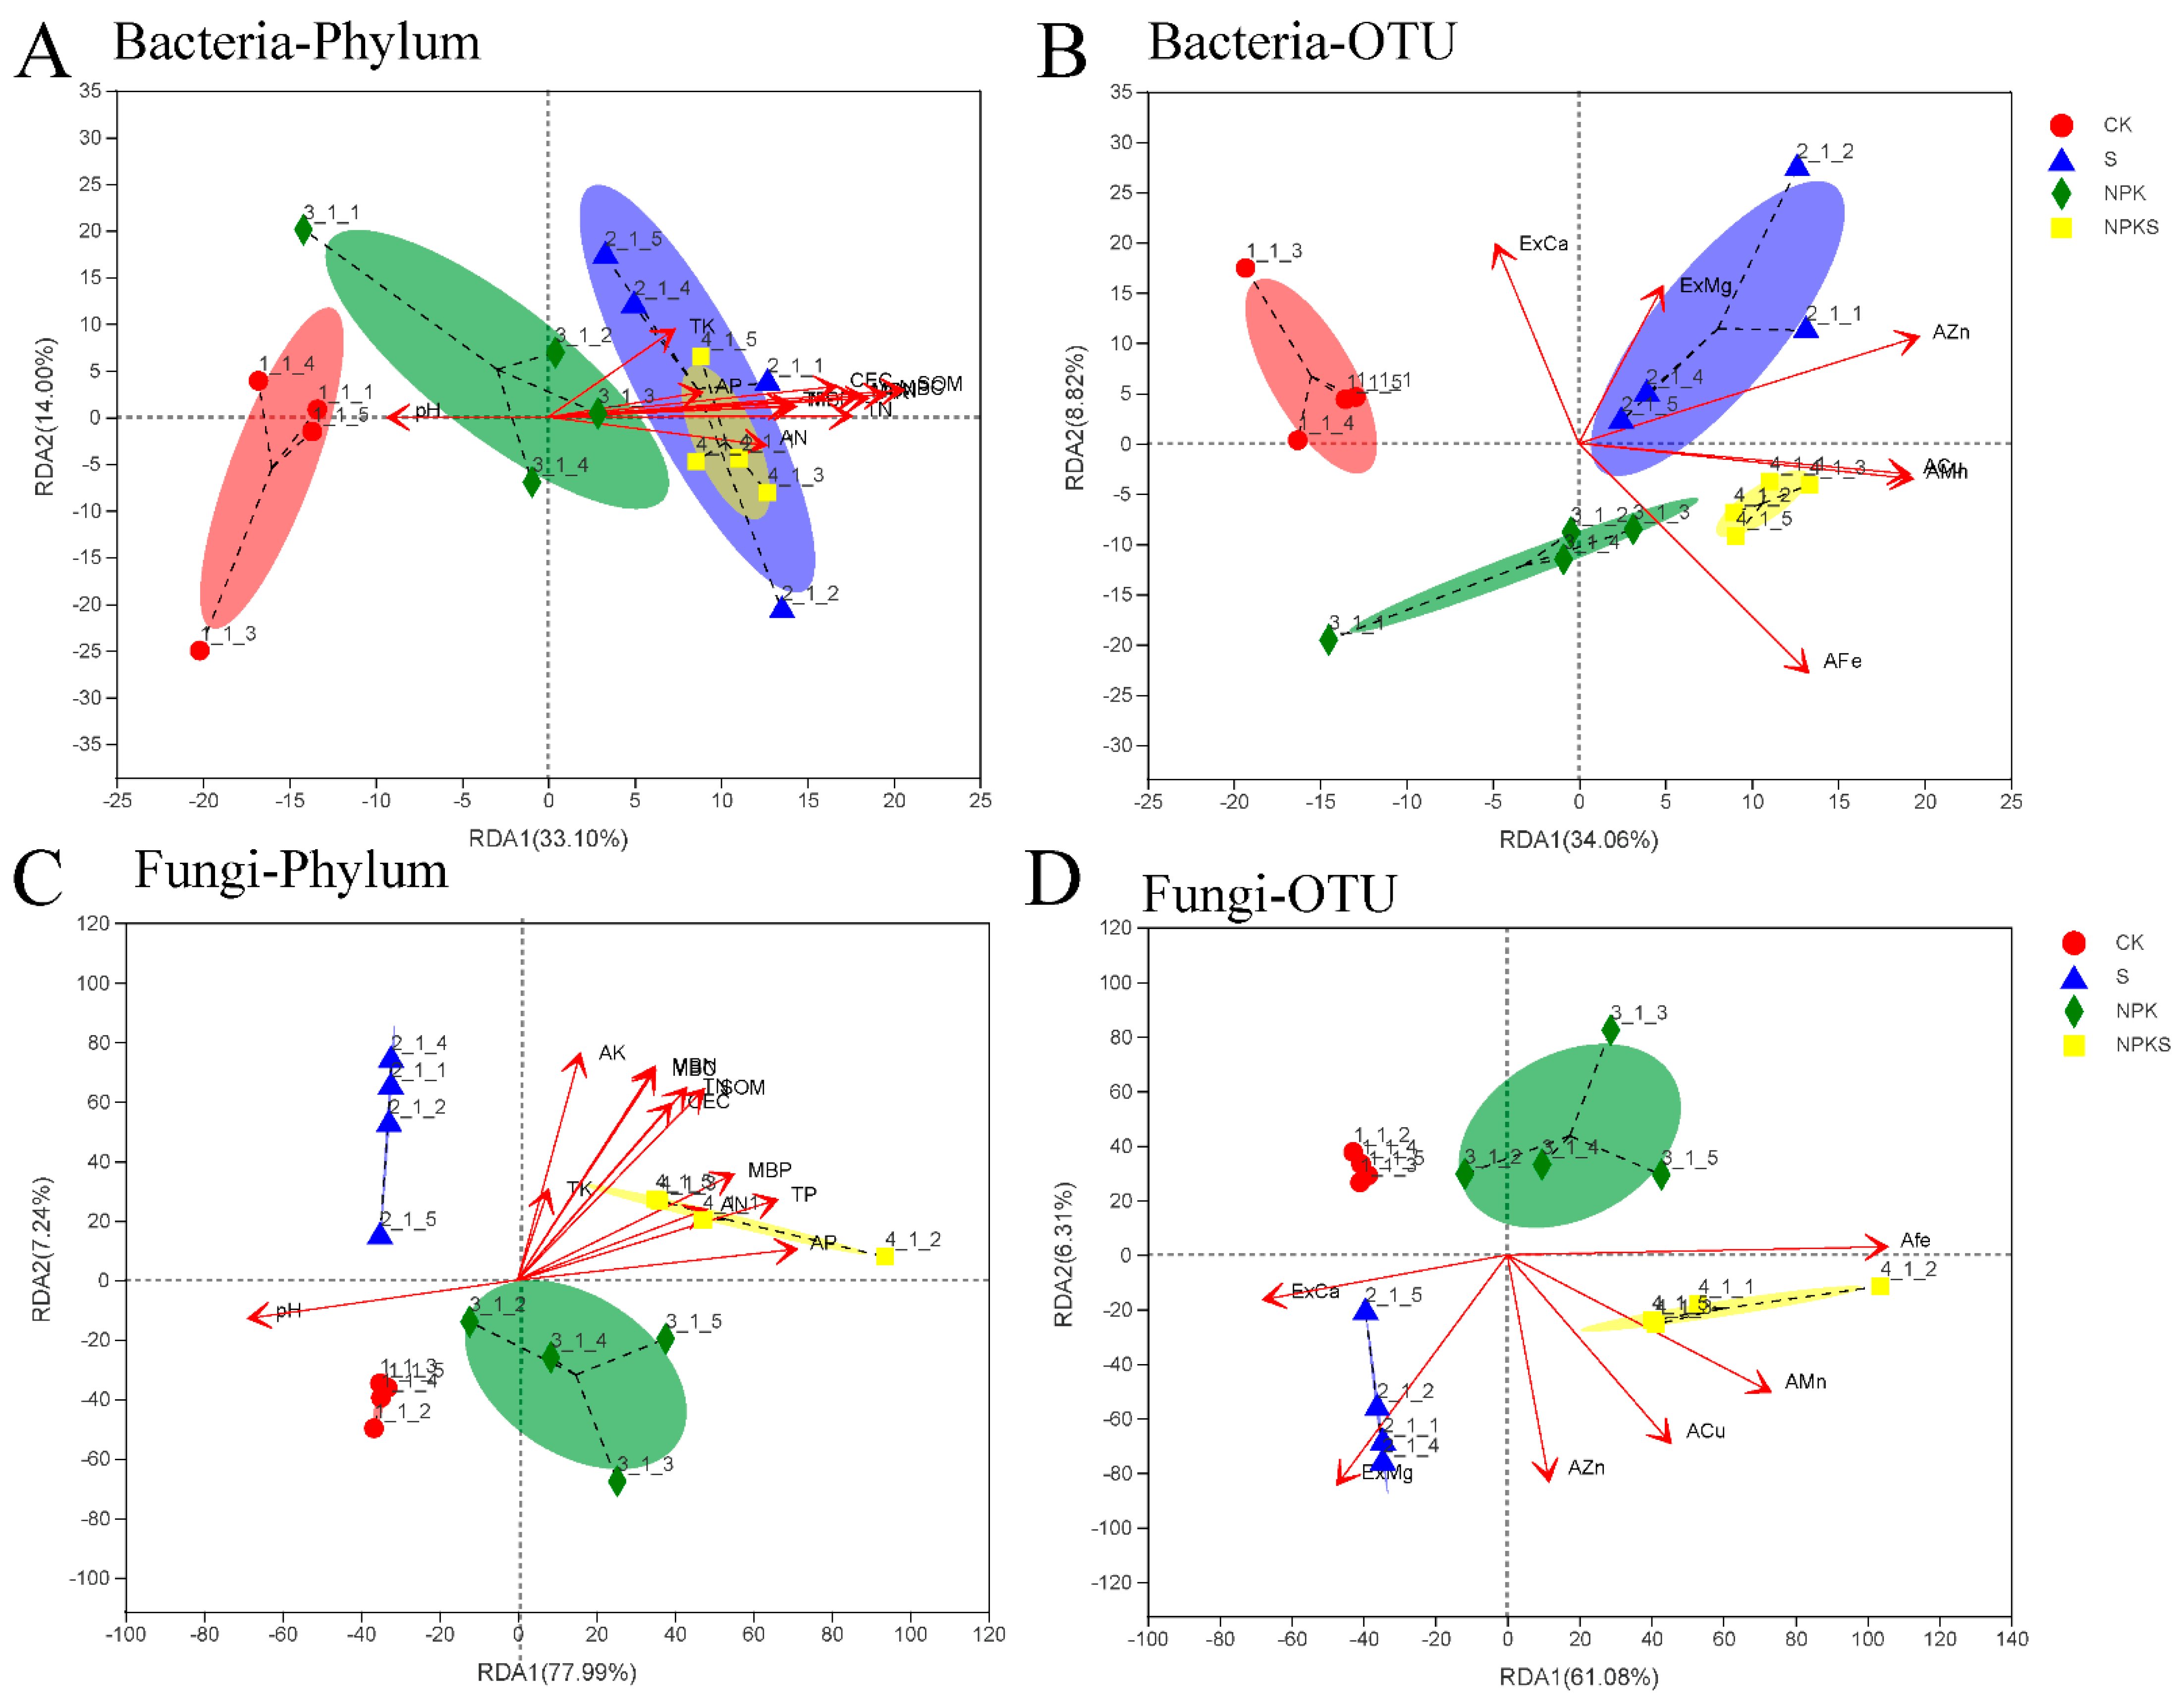
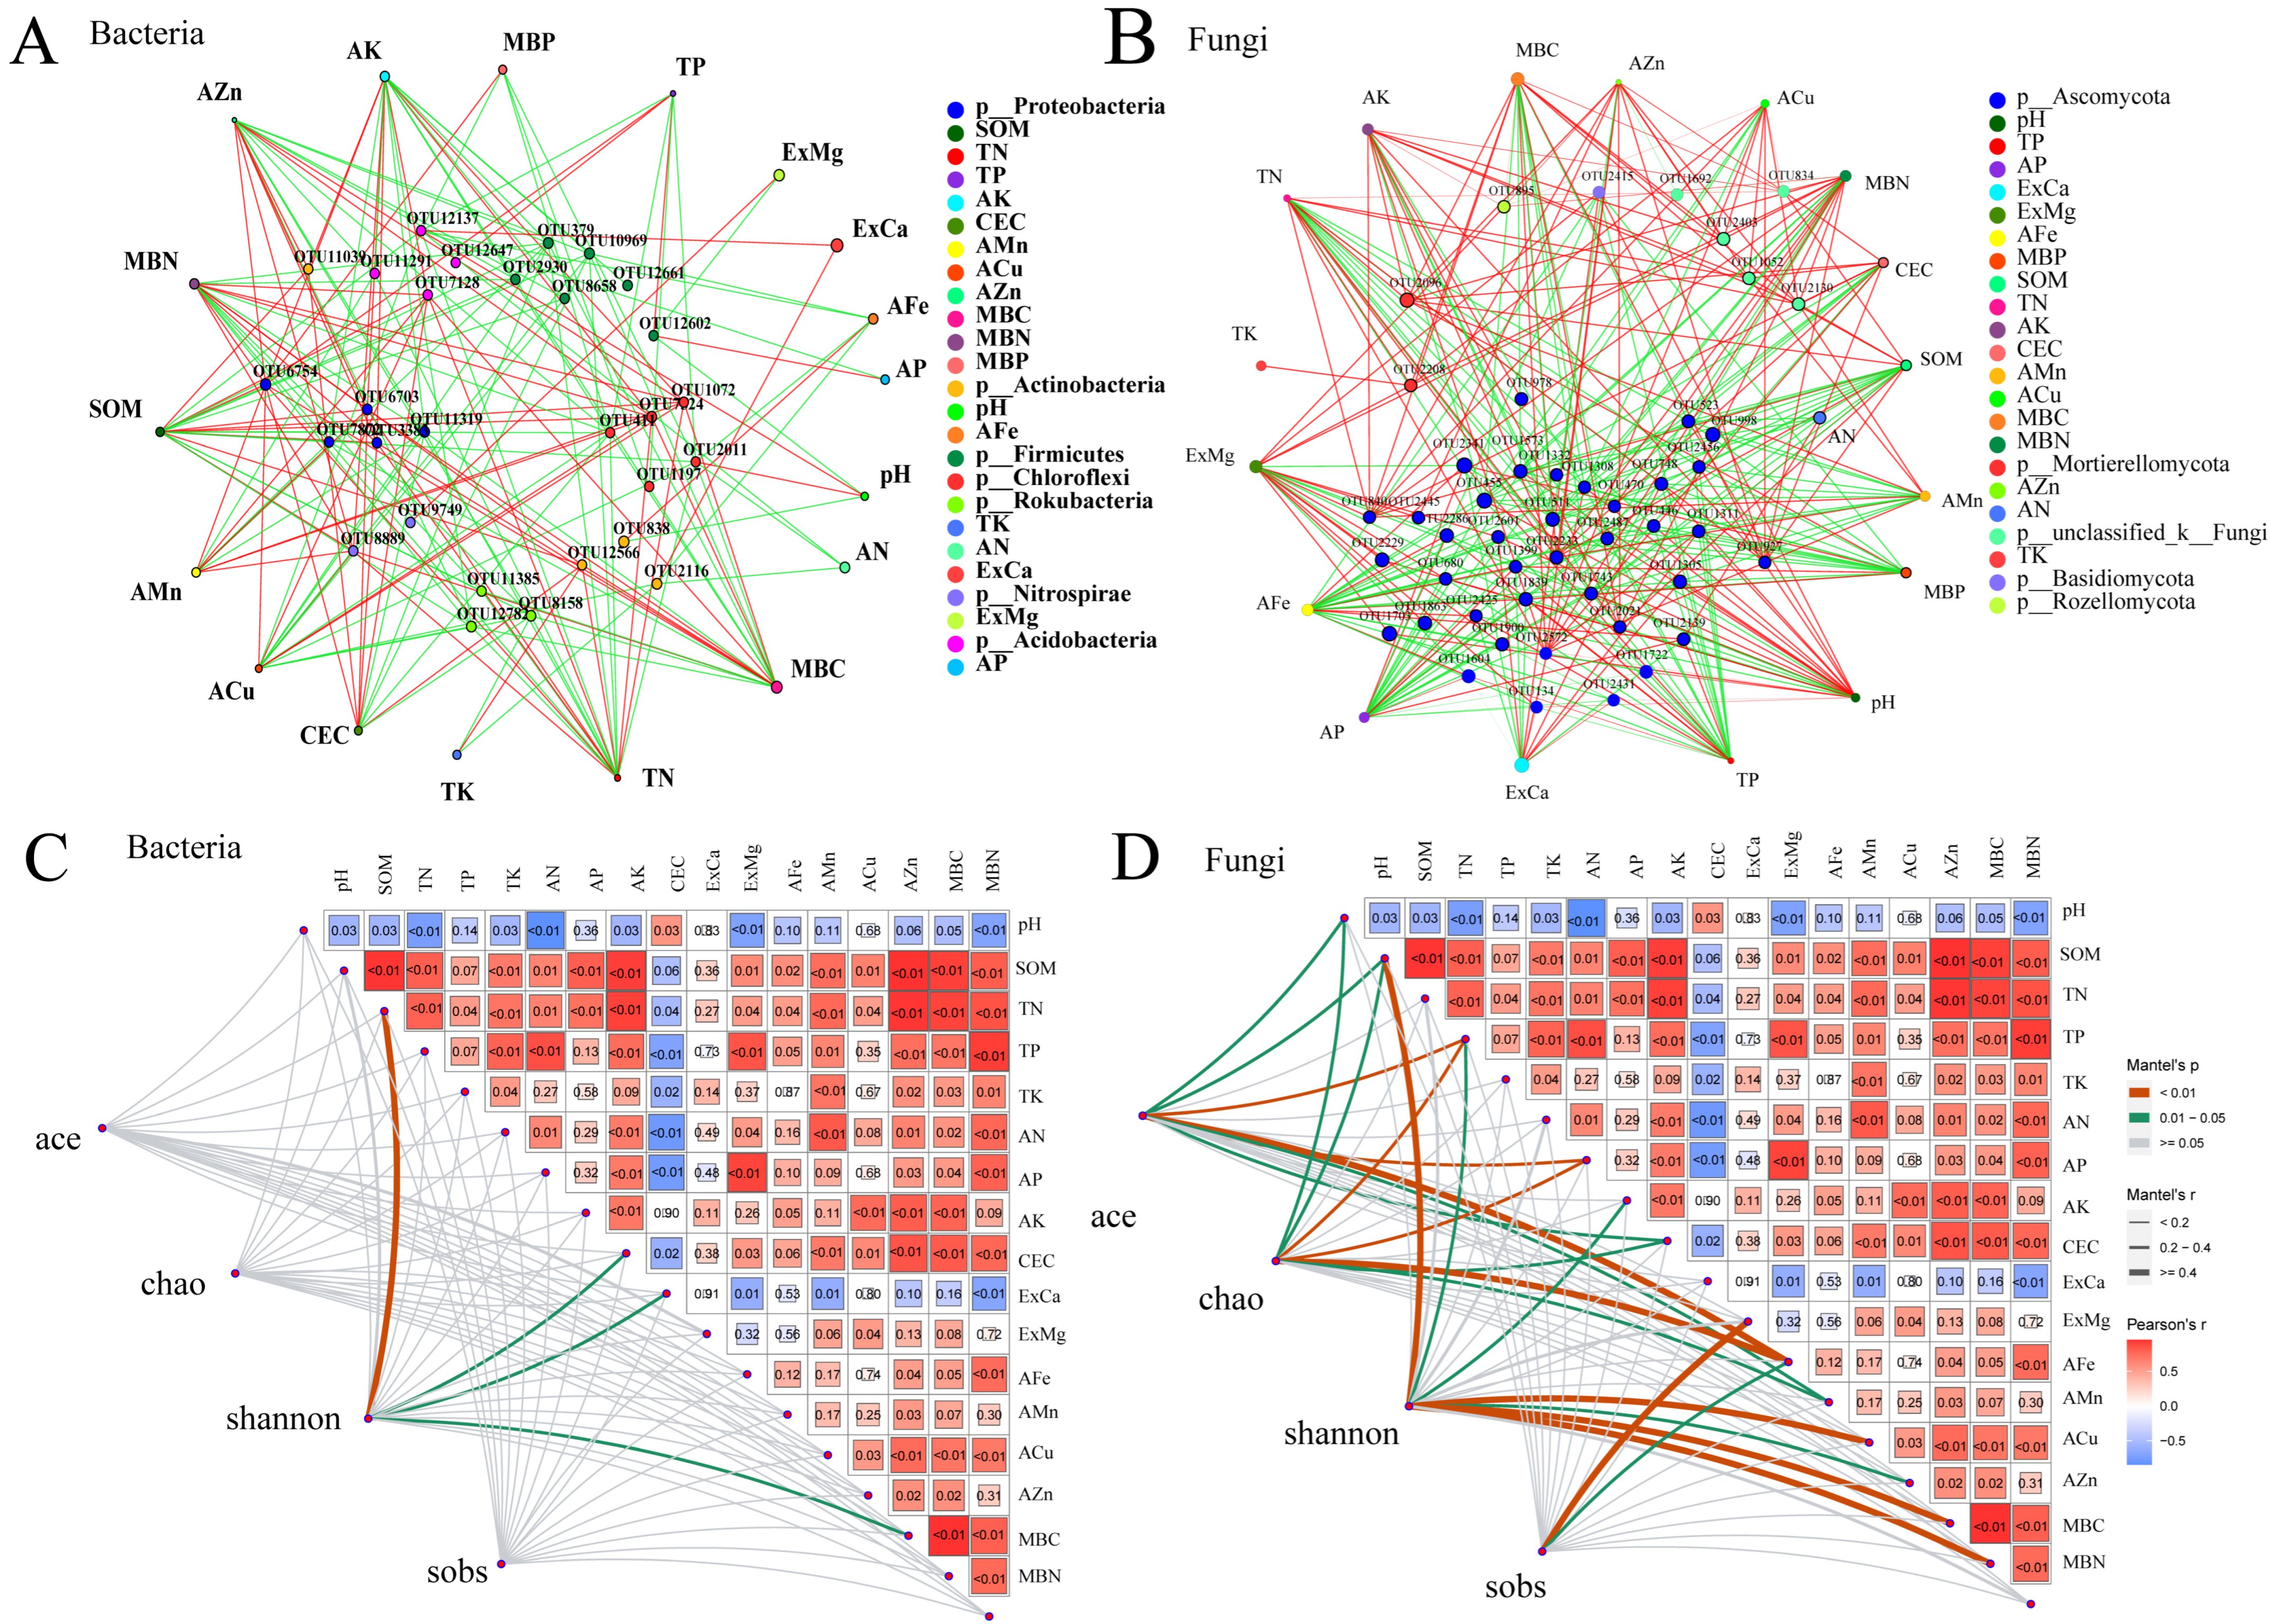
3.5. Effects of Straw Return and Fertilization on Soil Microorganisms

The α diversity of bacteria was not affected by NPKS, although the α diversity of fungi was affected by the NPKS treatment compared to the CK treatment (Table S2). In addition, the community composition of bacteria on the phylum and the OTU level under the CK treatment were distinctly different from other treatments (straw and fertilizer) (Figure 6A,B). These differences in the community composition were more exaggerated in fungi than bacteria (Figure 6C,D). Moreover, the community composition of fungi was more sensitive to the changes in the soil environment, and soil had a stronger influence on soil fungi (Table S3).
The effects of environmental factors on soil microorganisms were identified through a two-way network analysis (Figure 7A,B). In addition, the p_Proteobacteria, p_Actinobacteria, p_Firmicutes, p_Chloroflexi, p_Rokubacteria, p_Nitrospirae and p_Acidobacteria were sensitive bacteria to the soil environment (Figure 7A). The p_Ascomycota, p_Mortierellomycota, p_Basidiomycota, and p_Rozellomycota were important fungal microorganisms under different treatments (Figure 7B). There was a closer correlation between the fungal community and soil characteristics than the influence of soil on bacterial communities (Figure 7C,D). The bacterial alpha diversity indices (except for the Shannon index) were not closely related to soil properties (p > 0.05) (Figure 7C).

4. Discussion

4.1. Effects of Straw Return and Fertilization on the Growth of Crops

Many studies have shown that the addition of straw to soil can promote crop yields and improve nutrient uptake [31,32]. In our study, chemical fertilizer addition with straw return treatment was the best management strategy to improve crop yields (Figure 1). This could be a result of straw decomposition, which may increase soil nutrients [18,33]. In addition, straw mulching may improve soil water retention, potentially improving crop yields in arid and semi-arid farming areas [34,35]. Compared to conventional fertilization, straw mulching has increased wheat and rice yields (Figure 1) [36,37]. Straw application has increased the K content of wheat and rice, suggesting that K is easily released from straw as it decomposes [38]. In addition, the improvement effect of straw mulching is affected by many factors, such as the average annual temperature, soil nutrient status, period, and fertilization [39,40].

4.2. Effects of Straw Return and Fertilization on the Soil Physical Properties

Soil fertility reflects the soil’s capacity to supply nutrients for the growth of plants [41]. Many studies have reported that straw return improves soil fertility by promoting soil aggregation and the soil water retention capacity [42]. However, some studies have found that straw return decreases the amount of available N due to the high ratio of C/N [43]. Straw return application may also have effects on soil fertility [44,45]. In our study, the long-term application of straw return alone significantly improved soil fertility (Table 2). Several reasons support this finding. (1) Straw contains a variety of nutrients and improves soil fertility through decomposition, during which these nutrients are released and become available to plants [46]. (2) The input of straw provides C and N nutrients for soil microbial growth and reproduction, thus increasing the microbial community composition and diversity [47,48,49]. (3) Straw addition could influence the soil temperature and soil water retention capacity, thereby influencing the capacity for soil nutrient supply [50,51].
Soil aggregates can promote crop nutrient absorption, the diversity of biological communities, and reduce soil erosion by increasing the average size of aggregates [52,53,54,55]. Firstly, this could be due to a large aggregate turnover controlling the organic carbon stability in microaggregates [8]. Secondly, large aggregates have a high rate of organic carbon cycling and fresher organic carbon [56]. Finally, the higher organic carbon content within the macroaggregate protects and slows down the decomposition of organic carbon [57]. Our findings provide evidence that straw and fertilizer application could increase the proportion of soil aggregates (0.25–2 mm and >2 mm), while decreasing the proportion of other soil aggregates (0.053–0.025 mm and <0.053 mm) (Figure 3). There are several possible explanations for this result: (1) It could be that organic particles or colloids are generated by the application of straw to the field, which combines with the mineral particles in the soil to form micro-aggregates, and in turn provides a material basis for the formation of larger-sized aggregates [45]; (2) straw return may increase the activity of soil microorganisms, which secrete organic cementing substances or cement soil clay particles through the mycelium, thereby promoting the formation of aggregates [25]; and (3) during the process of straw decomposition, macromolecular mucopolysaccharides are produced, which strongly adhere to soil particles [58]. Therefore, straw application to the field can not only promote the formation of aggregates through direct action, but also indirectly by affecting microorganisms.
SOC is a significant indicator of soil fertility and productivity [59]. The creation of aggregates is an important mechanism for the physical protection of the SOC [21]. In our study, the SOC of all soil aggregates increased under the NPKS treatment (Figure 4). Zhang et al. [60] found that straw return was decomposed by soil microorganisms, which increased the content of various forms of carbon in the soil. Straw addition can promote the relative amount of aromatic C and carbonyl C groups (Table 3). Moreover, our results suggest that straw addition improved the soil capillary porosity (Table S2). This result is consistent with the work reported by Deng et al. [61]. The contribution rate of SOC in macro-aggregates increased while decreasing in micro-aggregates (Figure 4B). Based on a previous study, fertilizers can directly increase soil fertility [62]. Straw addition increased the nutrient concentrations of several different soil aggregates, particularly TN, AN, and AK (Figure 5). There were several reasons for these observations: (1) Straw addition may reduce soil N loss by improving soil water retention and soil texture [63]; and (2) straw addition is an important direct source of soil N and K [64] In our study, the straw had total N, P, and K contents of 0.54%, 0.09%, and 1.25%, respectively. Soil microbes can degrade organic compounds and alter inorganic products, especially contributing to the mineralization of nutrients [65]. Thus, straw addition may provide a food source for a variety of microorganisms that contribute to an overall ‘healthier’ environment [66]. Consequently, our results suggest that the combined application of straw and conventional fertilization could improve soil fertility and aggregate stability (Figure S1).

4.3. Effects of Straw Return and Fertilization on the Soil Microorganisms

Microorganisms are an important part of the soil environment, which can regulate the physical, chemical, and biological processes between soil and plants [67,68]. Different management measures affect the soil’s chemical properties and the microbial communities influenced [62,69]. For example, research has found that the soil pH, organic matter, and nutrient content all increase significantly after biochar application, which is considered to affect the soil microbial community structure [70]. Zhang et al. [71] found that the amounts of nitrifying bacteria, ammonizing bacteria and phosphorus-dissolving bacteria were increased with straw addition. Zhang et al. [72] found that the application of organic material could increase the amount of p_Azotobacter and p_Pseudomonas, which can improve K uptake. Moreover, straw addition increased the diversity and richness of microbial communities and changed the community composition (Figure 6). Straw has a positive impact on fungi, with the fungi community structure being more responsive to the addition of straw and fertilizer compared to the bacteria community (Figure 7; Table S2). When straw is incorporated into the field, fungi play an important role in decomposing recalcitrant fibers, which can be further decomposed into polysaccharides [73]. The initial decomposition of straw is mainly dominated by fungi and gram-negative bacteria, which influence soil microbial activity and nutrient cycling. Consequently, straw addition to the field is conducive to the accumulation of soil organic carbon and improving the abundance and activity of soil microbes [74]. Our study showed that a few microbial groups were particularly strongly associated with soil fertility, namely p_Proteobacteria, p_Actinobacteria, p_Firmicutes p_Chloroflexi and p_Ascomycota (Figure 7) [75,76].

5. Conclusions

In this study, wheat and rice yields significantly increased under NPKS addition after 14 years of rice–wheat rotation. Moreover, increases in the soil fertility of the soil (SOM, AN, AK) were largely attributed to straw addition. In addition, straw addition affected soil aggregation, particularly the formation of macro-aggregates (0.25–2 mm). Straw return also increased the content of SOC in several different sizes of soil aggregates. Furthermore, straw addition improved the soil nutrient content, particularly the soil SOC, TN, AN, and AK. The community structure of fungi was more susceptible to straw and fertilizer supplementation than soil bacteria. Thus, our present study suggested that straw addition could increase the soil fertility, soil aggregate stability, and crop yield, which become critical measures for increasing the utilization rate of agricultural waste for sustainable agricultural development.

Supplementary Materials

The following supporting information can be downloaded at: https://www.mdpi.com/article/10.3390/plants13070985/s1, Figure S1: The stability of soil aggregates under different treatments.; Figure S2: The relationship between soil fertility and soil nutrients of different aggregate. (A–D): represented the different soil aggregate (<0.053 mm; 0.053–0.25 mm; 0.25–2 mm; >2 mm); Table S1: The bulk density and soil porosity under different treatments; Table S2: The α diversity of soil bacterial and fungal community under different treatments; Table S3: The datasheet for environmental factors in RDA.

Author Contributions

B.L. and X.X.: assisting in the design and supervision of this work; H.X.: writing—the original draft, maintaining the experiment process, and finding soil physicochemical parameters; M.W., Z.Z., X.D., X.F., Y.C. and L.Y.: validation, review and editing, C.J. (Chaoqiang Jiang), C.J. (Cuncang Jiang) and M.R.: reviewed the article. All authors have read and agreed to the published version of the manuscript.

Funding

This study was supported by The National Key Research and Development Program of China (2021YFD1901205), Hubei Academy of Agricultural Sciences Major Achievements Cultivation Project (2017CGPY01), Youth Foundation of Hubei Academy of Agricultural Sciences (2022NKYJJ07) and Youth Foundation of Institute of Plant Protection and Soil Fertilizer, Hubei Academy of Agricultural Sciences (2021ZTSQJ14).

Data Availability Statement

Data are contained within the article and supplementary materials.

Conflicts of Interest

The authors declare no conflict of interest.

References

  1. Wang, Q.; Wang, D.; Wen, X.; Yu, G.; He, N.; Wang, R. Differences in SOM decomposition and temperature sensitivity among soil aggregate size classes in a temperate grasslands. PLoS ONE 2015, 10, e0117033. [Google Scholar] [CrossRef] [PubMed]
  2. Regelink, I.C.; Stoof, C.R.; Rousseva, S. Linkage between aggregate formation, porosity and soil chemical properties. Geoderma 2015, 247–248, 24–37. [Google Scholar] [CrossRef]
  3. Zhang, M.; Riaz, M.; Zhang, L.; Xia, H.; El-Desouki, Z.; Jiang, C.C. Response of fungal communities in different soils to biochar and chemical fertilizers under simulated rainfall conditions. Sci. Total Environ. 2019, 691, 654–663. [Google Scholar] [CrossRef] [PubMed]
  4. Mikha, M.M.; Rice, C.W.; Milliken, G.A. Carbon and nitrogen mineralization as affected by drying and wetting cycles. Soil Biol. Biochem. 2005, 37, 339–347. [Google Scholar] [CrossRef]
  5. Kushwaha, C.P.; Tripathi, S.K.; Sigh, K.P. Soil organic matter and water-stable aggregates under different tillage and residue conditions in a tropical dryland agroecosystem. Appl. Soil Ecol. 2001, 16, 229–241. [Google Scholar] [CrossRef]
  6. Chen, J.S.; Chiu, C.Y. Characterization of soil organic matter in different particle-size fractions in humid subalpine soils by CP/MAS 13c nmr. Geoderma 2003, 117, 129–141. [Google Scholar] [CrossRef]
  7. Liu, Z.L.; Yu, W.T. Review of researches on soil aggregate and soil organic carbon. Chin. J. Eco-Agric. 2011, 19, 447–455. [Google Scholar] [CrossRef]
  8. Six, J.; Elliott, E.T.; Paustian, K. Soil macroaggregate turnover and microaggregate formation: A mechanism for C sequestration under no-tillage agriculture. Soil Biol. Biochem. 2014, 32, 2099–2103. [Google Scholar] [CrossRef]
  9. Ghosh, B.N.; Meena, V.S.; Singh, R.J.; Alam, N.M.; Patra, S.; Bhattacharyya, R.; Sharma, N.K.; Dadhwal, K.S.; Mishra, P.K. Effects of fertilization on soil aggregation, carbon distribution and carbon management index of maize-wheat rotation in the north-western Indian Himalayas. Ecol. Indic. 2019, 105, 415–424. [Google Scholar] [CrossRef]
  10. Bronick, C.J.; Lal, R. Soil structure and management: A review. Geoderma 2005, 124, 3–22. [Google Scholar] [CrossRef]
  11. Liang, C.; Schimel, J.P.; Jastrow, J.D. The importance of anabolism in microbial control over soil carbon storage. Nat. Microbiol. 2017, 2, 17105. [Google Scholar] [CrossRef]
  12. Garau, G.; Morillas, L.; Roales, J.; Castaldi, P.; Mangia, N.P.; Spano, D.; Mereu, S. Effect of monospecific and mixed Mediterranean tree plantations on soil microbial community and biochemical functioning. Appl. Soil Ecol. 2019, 140, 78–88. [Google Scholar] [CrossRef]
  13. Zhu, H.; Ao, Y.; Xu, H.; Zhou, Z.; Wang, Y.; Yang, L. Determinants of Farmers’ Intention of Straw Recycling: A Comparison Analysis Based on Different Pro-Environmental Publicity Modes. Int. J. Environ. Res. Public Health 2021, 18, 11304. [Google Scholar] [CrossRef] [PubMed]
  14. Li, Y.; Wang, Q.B. Study on potential of straw resource nutrient return to field and application technology in China. Soil Fertil. Sci. China 2020, 1, 119–126. (In Chinese) [Google Scholar]
  15. Wang, C.; Zhang, Y.X. Implementation Pathway and Policy System of Carbon Neutrality Vision. Chin. J. Environ. Manag. 2020, 12, 58–64. (In Chinese) [Google Scholar] [CrossRef] [PubMed]
  16. Chen, J.M.; Li, C.L.; Ristovski, Z.; Milic, A.; Gu, Y.T.; Islam, M.S.; Wang, S.X.; Hao, J.M.; Zhang, H.F.; He, C.R.; et al. A review of biomass burning: Emissions and impacts on air quality, health and climate in China. Sci. Total Environ. 2017, 579, 1000–1034. [Google Scholar] [CrossRef] [PubMed]
  17. Chen, Z.M.; Wang, H.Y.; Liu, X.W.; Zhao, X.L.; Lu, D.J.; Zhou, J.M.; Li, C.Z. Changes in soil microbial community and organic carbon fractions under short-term straw return in a rice-wheat cropping system. Soil Tillage Res. 2017, 165, 121–127. [Google Scholar] [CrossRef]
  18. Liu, B.; Xia, H.; Jiang, C.C.; Riaz, M.; Yang, L.; Chen, Y.F.; Fan, X.P.; Xia, X.G. 14 year applications of chemical fertilizers and crop straw effects on soil labile organic carbon fractions, enzyme activities and microbial community in rice-wheat rotation of middle China. Sci. Total Environ. 2022, 841, 156608. [Google Scholar] [CrossRef]
  19. Zhang, J.B.; Song, C.C.; Yang, W.Y. Influence of land-use type on soil dissolved organic carbon in the Sanjiang Plain. China Environ. Sci. 2005, 25, 343–347. (In Chinese) [Google Scholar]
  20. Xia, H.Y.; Wang, K.R.; Zhao, Q.L.; Zhang, Z. Effects of straw addition on decomposition, transformation and composition of soil organic carbon pool. Chin. J. Eco-Agric. 2014, 22, 386–393. (In Chinese) [Google Scholar]
  21. Six, J.; Bossuyt, H.; Degryze, S.; Denef, K. A history of research on the link between (micro) aggregates, soil biota, and soil organic matter dynamics. Soil Tillage Res. 2004, 79, 7–31. [Google Scholar] [CrossRef]
  22. Wang, M.; Cheng, G.; Feng, H. Effects of straw and biochar amendments on aggregate stability, soil organic carbon, and enzyme activities in the Loess Plateau, China. Environ. Sci. Pollut. Res. 2017, 24, 10108–10120. [Google Scholar]
  23. Luo, L.; Meng, H.; Gu, J.D. Microbial extracellular enzymes in biogeochemical cycling of ecosystems. J. Environ. Manag. 2017, 197, 539–549. [Google Scholar] [CrossRef]
  24. Reddy, A.P.; Simmons, C.W. Discovery ofmicroorganisms and enzymes involved in high-solids decomposition of rice straw using metagenomic analyses. PLoS ONE 2013, 8, e77985. [Google Scholar] [CrossRef] [PubMed]
  25. Liu, S.; Yan, C.R.; He, W.Q.; Chen, B.Q.; Zhang, Y.Q.; Liu, Q.; Liu, E.K. Effects of different tillage practices on soil water-stable aggregation and organic carbo distribution in dryland farming in Northern China. Acta Ecol. Sin. 2015, 35, 65–69. [Google Scholar] [CrossRef]
  26. Guo, T.; Zhang, Q.; Ai, C. Nitrogen enrichment regulates straw decomposition and its associated microbial community in a double rice cropping system. Sci. Rep. 2018, 8, 1847. [Google Scholar] [CrossRef] [PubMed]
  27. Elliott, E.T. Aggregate structure and carbon, nitrogen, and phosphorus in native and cultivated soils. Soil Sci. Soc. Am. J. 1986, 50, 627–633. [Google Scholar] [CrossRef]
  28. Barreto, R.C.; Madari, B.E.; Machado, P.; Maddock, J.; Costa, A.R. The impact of soil management on aggregation, carbon stabilization and carbon loss as CO2 in the surface layer of a rhodic ferralsol in southern brazil. Agric. Ecosyst. Environ. 2019, 132, 243–251. [Google Scholar] [CrossRef]
  29. Liu, Z.P.; Xu, J.N.; She, D.L.; Li, X.L.; Wang, J.F. Effects of Biochar Addition on Thermal Properties of Loamy Soil. Acta Pedol. Sin. 2018, 55, 933–944. (In Chinese) [Google Scholar]
  30. Huang, R.L.; Crowther, T.W.; Sui, Y.Y.; Sun, B. High stability and metabolic capacity of bacterial community promote the rapid reduction of easily decomposing carbon in soil. Commun. Biol. 2021, 4, 1376. [Google Scholar] [CrossRef]
  31. Choudhury, S.G.; Srivastava, S.; Singh, R.; Chaudhari, S.K.; Sarkar, D. Tillage and residue management effects on soil aggregation, organic carbon dynamics and yield attribute in rice–wheat cropping system under reclaimed sodic soil. Soil Tillage Res. 2014, 136, 76–83. [Google Scholar] [CrossRef]
  32. Jing, X.A.; Hha, B.; Tn, A.; Zl, A.; Rl, B. Long-term effects of tillage and straw management on soil organic carbon, crop yield, and yield stability in a wheat-maize system. Field Crops Res. 2019, 233, 33–40. [Google Scholar]
  33. Bu, R.; Ren, T.; Lei, M.; Liu, B.; Lu, J. Tillage and straw-returning practices effect on soil dissolved organic matter, aggregate fraction and bacteria community under rice-rice-rapeseed rotation system. Agric. Ecosyst. Environ. 2020, 287, 106681. [Google Scholar] [CrossRef]
  34. Wang, X.; Wu, H.; Dai, K.; Zhang, D.; Feng, Z.; Zhao, Q. Tillage and crop residue effects on rainfed wheat and maize production in northern China. Field Crops Res. 2012, 132, 106–116. [Google Scholar] [CrossRef]
  35. Yin, Y.F.; He, X.H.; Ma, H.L.; Yang, Y.S. Effects of rice straw and its biochar addition on soil labile carbon and soil organic carbon. J. Integr. Agric. 2014, 13, 491–498. [Google Scholar] [CrossRef]
  36. Xu, S.Q.; Cui, S.Y.; Chen, F.; Xiao, X.P.; Zhang, H.L. Effect of tillage on content of density fractions of paddy soil organic carbon and its spatial distribution. J. Agro-Environ. Sci. 2011, 30, 127–132. (In Chinese) [Google Scholar]
  37. Liu, D.B.; Xia, X.G.; Fan, X.P.; Yang, L.; Zhang, F.L.; Xia, Y. Effect of long-term application of straw to soil on crop yield and nutrients absorption in rice-wheat rotation system. Hubei Agric. Sci. 2017, 56, 4731–4736. (In Chinese) [Google Scholar]
  38. Dai, Z.G.; Lu, J.W.; Li, X.K.; Lu, M.X.; Yang, W.B.; Gao, X.Z. Nutrient release characteristics of different crop straws manure. Trans. Chin. Soc. Agric. Eng. 2010, 26, 272–276. (In Chinese) [Google Scholar]
  39. Takahashi, S.; Uenosono, S.; Ono, S. Short- and long-term effects of rice straw application on nitrogen uptake by crops and nitrogen mineralization under flooded and upland conditions. Plant Soil 2003, 251, 291–301. [Google Scholar] [CrossRef]
  40. Huang, S.; Zeng, Y.; Wu, J.; Shi, Q.; Pan, X. Effect of crop residue retention on rice yield in China: A meta-analysis. Field Crops Res. 2013, 154, 188–194. [Google Scholar] [CrossRef]
  41. Karami, A.; Homaee, M.; Afzalinia, S.; Ruhipour, H.; Basirat, S. Organic resource management: Impacts on soil aggregate stability and other soil physico-chemical properties. Agric. Ecosyst. Environ. 2012, 148, 22–28. [Google Scholar] [CrossRef]
  42. Yemadje, P.L.; Chevallier, T.; Guibert, H.; Bertrand, I.; Bernoux, M. Wetting-drying cycles do not increase organic carbon and nitrogen mineralization in soils with straw mendment. Geoderma 2016, 304, 68–75. [Google Scholar] [CrossRef]
  43. Shindo, H.; Nishio, T. Immobilization and remineralization of n following addition of wheat straw into soil: Determination of gross n transformation rates by 15n-ammonium isotope dilution technique. Soil Biol. Biochem. 2005, 37, 425–432. [Google Scholar] [CrossRef]
  44. Zhang, P.; Chen, X.L.; Wei, T.; Yang, Z.; Jia, Z.K.; Yang, B.P.; Han, Q.F.; Ren, X.L. Effects of straw incorporation on the soil nutrient contents, enzyme activities, and crop yield in a semiarid region of china. Soil Tillage Res. 2016, 160, 65–72. [Google Scholar] [CrossRef]
  45. Song, D.; Xi, X.; Zheng, Q.; Liang, G.; Zhou, W.; Wang, X. Soil nutrient and microbial activity responses to two years after maize straw biochar application in a calcareous soil. Ecotoxicol. Environ. Saf. 2019, 180, 348–356. [Google Scholar] [CrossRef]
  46. Chavarria, D.N.; Perez-Brandan, C.; Serri, D.L.; Merile, J.M. Response of soil microbial communities to agroecological versus conventional systems of extensive agriculture. Agric. Ecosyst. Environ. 2018, 265, 1–8. [Google Scholar] [CrossRef]
  47. Bastida, F.; Kandeler, E.; Hernandez, T.; Garcia, C. Long-term effect of municipal solid waste amendment on microbial abundance and humus-associated enzyme activities under semiarid conditions. Microb. Ecol. 2008, 55, 651–661. [Google Scholar] [CrossRef] [PubMed]
  48. Hao, M.; Hu, H.; Liu, Z.; Dong, Q.; Sun, K.; Feng, Y. Shifts in microbial community and carbon sequestration in farmland soil under long-term conservation tillage and straw returning. Appl. Soil Ecol. 2018, 136, 43–54. [Google Scholar] [CrossRef]
  49. Su, Y.; Lv, J.L.; Yu, M.; Ma, Z.H.; Xi, H.; Kou, C.L. Long-term decomposed straw return positively affects the soil microbial community. J. Appl. Microbiol. 2020, 128, 138–150. [Google Scholar] [CrossRef] [PubMed]
  50. Ramakrishna, A.; Tam, H.M.; Wani, S.P.; Long, T.D. Effect of mulch on soil temperature, moisture, weed infestation and yield of groundnut in northern vietnam. Field Crops Res. 2006, 95, 115–125. [Google Scholar] [CrossRef]
  51. Kader, M.A.; Nakamura, K.; Senge, M.; Mojid, M.A.; Kawashima, S. Numerical simulation of water- and heat-flow regimes of mulched soil in rain-fed soybean field in central Japan. Soil Tillage Res. 2019, 191, 142–155. [Google Scholar] [CrossRef]
  52. Banwart, S. Save our soils. Nature 2011, 474, 151–152. [Google Scholar] [CrossRef]
  53. Zheng, H.; Liu, W.; Zheng, J.; Luo, Y.; Li, R.; Wang, H.; Qi, H. Effect of long-term tillage on soil aggregates and aggregate-associated carbon in black soil of Northeast China. PLoS ONE 2018, 13, e0199523. [Google Scholar] [CrossRef] [PubMed]
  54. Kan, Z.R.; Ma, S.T.; Liu, Q.Y.; Liu, B.Y.; Virk, A.L.; Qi, J.Y.; Zhao, X.; Lal, R.; Zhang, H.L. Carbon sequestration and mineralization in soil aggregates under long-term conservation tillage in the North China Plain. Catena 2020, 188, 104428. [Google Scholar] [CrossRef]
  55. Piazza, G.; Pellegrino, E.; Moscatelli, M.C.; Ercoli, L. Long-term conservation tillage and nitrogen fertilization effects on soil aggregate distribution, nutrient stocks and enzymatic activities in bulk soil and occluded microaggregates. Soil Tillage Res. 2020, 196, 104482. [Google Scholar] [CrossRef]
  56. Yan, Y.; Tian, J.; Fan, M.; Zhang, F.; Li, X.; Christie, P.; Chen, H.; Lee, J.; Kuzyakov, Y.; Six, J. Soil organic carbon and total nitrogen in intensively managed arable soils. Agric. Ecosyst. Environ. 2012, 150, 102–110. [Google Scholar] [CrossRef]
  57. Zhang, Y.; Li, X.; Gregorich, E.G.; McLaughlin, N.B.; Zhang, X.; Guo, Y.; Liang, A.; Fan, R.; Sun, B. No-tillage with continuous maize cropping enhances soil aggregation and organic carbon storage in Northeast China. Geoderma 2018, 330, 204–211. [Google Scholar] [CrossRef]
  58. Li, Z.Q.; Li, D.D.; Zhao, B.X.; Zhang, J.B. Effects of straw application and crop planting on soil aggregates and microbial community composition. J. Agro-Environ. Sci. 2017, 36, 1557–1565. (In Chinese) [Google Scholar]
  59. Tao, F.; Taru, P.; Elena, V.; Raisa, M. Cropland soils in China have a large potential for carbon sequestration based on literature survey. Soil Tillage Res. 2019, 186, 70–78. [Google Scholar] [CrossRef]
  60. Zhang, L.; Zhang, W.J.; Xu, M.G.; Cai, Z.J.; Peng, C.; Wang, B.R. Effects of Long-Term Fertilization on Change of Labile Organic Carbon in Three Typical Upland Soils of China. Sci. Agric. Sin. 2009, 42, 10. (In Chinese) [Google Scholar]
  61. Deng, Y.S.; Ding, S.W.; Cai, C.F.; Lv, G.A.; Xia, D.; Zhu, Y. Spatial Distribution of the Collapsing Alluvial Soil Physical Properties in Southeastern Hubei. Sci. Agric. Sin. 2014, 47, 4850–4857. (In Chinese) [Google Scholar]
  62. Xu, Y.; Wang, T.; Li, H.; Ren, C.; Chen, J.; Yang, G.; Han, X.; Feng, Y.; Ren, G.; Wang, X. Variations of soil nitrogen-fixing microorganism communities and nitrogen fractions in a Robinia pseudoacacia chronosequence on the Loess Plateau of China. Catena 2019, 174, 316–323. [Google Scholar] [CrossRef]
  63. Akhtar, K.; Wang, W.; Ren, G.; Khan, A.; Wang, H. Integrated use of straw mulch with nitrogen fertilizer improves soil functionality and soybean production. Environ. Int. 2019, 132, 105092. [Google Scholar] [CrossRef] [PubMed]
  64. Zhang, Z.; Liu, D.; Wu, M.; Xia, Y.; Zhang, F.; Fan, X. Long-term straw returning improve soil k balance and potassium supplying ability under rice and wheat cultivation. Sci. Rep. 2021, 11, 22260. [Google Scholar] [CrossRef] [PubMed]
  65. Ley, R.E.; Schmidt, S.K. Fungal and bacterial responses to phenolic compounds and amino acids in high altitude barren soils. Soil Biol. Biochem. 2002, 34, 989–995. [Google Scholar] [CrossRef]
  66. Lucas, R.W.; Casper, B.B.; Jackson, J.K.; Balser, T.C. Soil microbial communities and extracellular enzyme activity in the new jersey pinelands. Soil Biol. Biochem. 2007, 39, 2508–2519. [Google Scholar] [CrossRef]
  67. Bhme, L.; Langer, U.; Bhme, F. Microbial biomass, enzyme activities and microbial community structure in two european long-term field experiments. Agric. Ecosyst. Environ. 2005, 109, 141–152. [Google Scholar] [CrossRef]
  68. Zhang, J.; Chi, F.; Wei, D.; Zhou, B.; Cai, S.; Li, Y.; Kuang, E.; Sun, L.; Li, L.J. Impacts of Long-term Fertilization on the Molecular Structure of Humic Acid and Organic Carbon Content in Soil Aggregates in Black Soil. Sci. Rep. 2019, 9, 11908. [Google Scholar] [CrossRef] [PubMed]
  69. Ceja-Navarro, J.A.; Rivera-Orduna, F.N.; Patino-Zuniga, L.; Vila-Sanjurjo, A.; Crossa, J.; Govaerts, B. Phylogenetic and multivariate analyses to determine the effects of different tillage and residue management practices on soil bacterial communities. Appl. Environ. Microb. 2010, 76, 3685–3691. [Google Scholar] [CrossRef]
  70. Quilliam, R.S.; Glanville, H.C.; Wade, S.C.; Jones, D.L. Life in the ‘charosphere’-Does biochar in agricultural soil provide a significant habitat for microorganisms? Soil Biol. Biochem. 2013, 65, 287–293. [Google Scholar] [CrossRef]
  71. Zhang, X.Q.; Chen, H.; Zhao, Z.; Li Wei Du, S.Z.; Qiao, Y.Q.; Cao, C.F. Effects of Different Straw Mulching Levels on Biological Characteristics of Lime Concretion Black Soil. Ecol. Environ. Sci. 2015, 24, 610–616. (In Chinese) [Google Scholar]
  72. Zhang, M.Y.; Riaz, M.; Liu, B.; Xia, H.; Jiang, C.C. Two-year study of biochar: Achieving excellent capability of potassium supply via alter clay mineral composition and potassium-dissolving bacteria activity. Sci. Total Environ. 2020, 717, 137286. [Google Scholar] [CrossRef] [PubMed]
  73. Nie, S.; Lei, X.; Zhao, L.; Brookes, P.C.; Fei, W.; Chen, C. Fungal communities and functions response to long-term fertilization in paddy soils. Appl. Soil Ecol. 2018, 130, 251–258. [Google Scholar] [CrossRef]
  74. Debosz, K.; Rasmussen, P.H.; Pedersen, A.R. Corrigendum to “temporal variations in microbial biomass c and cellulolytic enzyme activity in arable soils: Effects of organic matter input”. Appl. Soil Ecol. 2000, 14, 81–82. [Google Scholar] [CrossRef]
  75. Zhang, M.; Riaz, M.; Xia, H.; Li, Y.X.; Wang, X.L.; Jiang, C.C. Four-year biochar study: Positive response of acidic soil microenvironment and citrus growth to biochar under potassium deficiency conditions. Sci. Total Environ. 2022, 813, 152515. [Google Scholar] [CrossRef]
  76. Ryan, M.; Terry, J.; Thomas, W. Bacterial metataxonomic profile and putative functional behavior associated with C and N cycle processes remain altered for decades after forest harvest. Soil Biol. Biochem. 2018, 119, 184–193. [Google Scholar]
Figure 1. Wheat (A) and rice (B) crop yields across treatments. f: the main effect of fertilizer treatment; s: the main effect of straw treatment; f × s: the interaction effect of fertilizer and straw treatment. * Indicates significant difference at different levels (** p < 0.01). Different lowercase letter indicates significant differences according to Duncan’s test (p < 0.05).
Plants 13 00985 g001
Figure 2. Microbial carbon (MBC), microbial nitrogen (MBN) and microbial phosphorus (MBP) under different treatments. (AC): represent soil MBC, MBN and MBP, respectively; (DF): represent the ratio of MBC/MBC, MBC/MBP and MBN/MBP. f: the main effect of fertilizer treatment; s: the main effect of straw treatment; f*s: the interaction effect of fertilizer and straw treatment. * Indicates significant difference at different levels (* p < 0.05, ** p < 0.01). Different lowercase letter indicates significant differences according to Duncan’s test (p < 0.05).
Plants 13 00985 g002
Figure 3. The content of soil aggregate under different treatments (A) and the composition of soil aggregate under different treatments (B). f: the main effect of fertilizer treatment; s: the main effect of straw treatment; f∗s: the interaction effect of fertilizer and straw treatment. * Indicates significant difference at different levels (** p < 0.01). Different lowercase letter indicates significant differences according to Duncan’s test (p < 0.05).
Plants 13 00985 g003
Figure 4. Soil organic carbon (SOC) in different soil aggregates under different treatments (A) and the relative contribution of each soil aggregate grouping to the total SOC under different treatments (B). f: the main effect of fertilizer treatment; s: the main effect of straw treatment; f*s: the interaction effect of fertilizer and straw treatments. * Indicates significant difference at different levels (** p < 0.01). Different lowercase letter indicates significant differences according to Duncan’s test (p < 0.05).
Plants 13 00985 g004
Figure 5. The relative contribution of each soil aggregate group to the total soil nutrient composition across treatments. (AF): represents soil total nitrogen, total phosphorus, total potassium, available nitrogen, available phosphorus and available potassium. f: the main effect of fertilizer treatment; s: the main effect of straw treatment; f*s: the interaction effect of fertilizer and straw treatment. * Indicates significant difference at different levels (* p < 0.05, ** p < 0.01). Different lowercase letter indicates significant differences according to Duncan’s test (p < 0.05).
Plants 13 00985 g005
Figure 6. Reduction in RDA dimension for analyzing the microbial community structure across treatment types. (A,B): Phylum and OTU level of soil bacteria; (C,D): Phylum and OTU level of soil fungi.
Plants 13 00985 g006
Figure 7. The two-factor network analysis (A,B) between soil microbes and chemical properties. (A,B): represents bacteria and fungi; the Mantel test (C,D) between soil microbes and chemical properties. (C,D): represents bacterial and fungi.
Plants 13 00985 g007
Table 1. The nutrients of wheat and rice under different treatments.
TreatmentWheatRice
N (%)P (%)K (%)N (%)P (%)K (%)
StemSeedStemSeedStemSeedStemSeedStemSeedStemSeed
CK0.41 ± 0.04 b1.53 ± 0.09 a0.04 ± 0.01 b0.28 ± 0.02 b0.84 ± 0.08 c0.37 ± 0.02 b0.44 ± 0.04 b1.02 ± 0.09 ab0.10 ± 0.01 a0.29 ± 0.03 a2.52 ± 0.09 b0.35 ± 0.06 b
NPK0.59 ± 0.09 a1.61 ± 0.04 a0.10 ± 0.02 a0.37 ± 0.02 a0.87 ± 0.04 bc0.43 ± 0.03 a0.45 ± 0.05 b1.03 ± 0.06 ab0.10 ± 0.01 a0.29 ± 0.03 a2.66 ± 0.08 ab0.39 ± 0.0 3 ab
S0.38 ± 0.07 b1.49 ± 0.09 a0.06 ± 0.01 b0.35 ± 0.03 a0.95 ± 0.08 ab0.42 ± 0.03 ab0.43 ± 0.03 b1.00 ± 0.07 b0.10 ± 0.01 a0.31 ± 0.02 a2.63 ± 0.09 b0.42 ± 0.06 ab
NPKS0.57 ± 0.16 a1.59 ± 0.05 a0.09 ± 0.02 a0.35 ± 0.03 a1.01 ± 0.03 a0.41 ± 0.03 ab0.51 ± 0.03 a1.13 ± 0.06 a0.11 ± 0.01 a0.30 ± 0.02 a2.84 ± 0.19 a0.46 ± 0.08 a
f12.92 **5.98 *35.36 **10.42 **2.22.624.644.010.120.249.02 *2.12
s0.240.700.173.0714.38 **0.772.211.441.270.975.58 *4.74 *
f × s0.010.025.86 *13.78 **0.314.82 *2.832.861.340.010.440.01
Note: Mean ± Sd (n = 4). Different lowercase letters in a column indicate differences among treatments (p < 0.05). f: the main effect of fertilizer treatment; s: the main effect of straw treatment; f × s: the interaction effect of fertilizer and straw treatment. * Indicates significant difference at different levels (* p < 0.05, ** p < 0.01).
Table 2. The soil fertility under different treatments.
TreatmentpHSOM
(g kg−1)
TN
(g kg−1)
TP
(g kg−1)
TK
(g kg−1)
AN
(mg kg−1)
AP
(mg kg−1)
AK
(mg kg−1)
CEC
(cmol kg−1)
Exch. Ca
(mg kg−1)
Exch. Mg
(mg kg−1)
Avail. Fe
(mg kg−1)
Avail. Mn
(mg kg−1)
Avail. Cu
(mg kg−1)
Avail. Zn
(mg kg−1)
CK7.15 ± 0.10 a17.69 ± 1.39 c1.41 ± 0.17 c0.77 ± 0.04 c20.35 ± 0.27 a119.17 ± 15.48 b15.63 ± 3.37 b56.89 ± 6.55 b11.87 ± 0.54 b3617.62 ± 599.62 a315.31 ± 6.23 a49.98 ± 10.60 b21.38 ± 0.99 b3.67 ± 0.31 b0.45 ± 0.08 b
NPK6.89 ± 0.28 ab22.06 ± 0.53 b1.63 ± 0.12 b0.94 ± 0.05 b20.56 ± 0.45 a133.35 ± 13.81 ab31.99 ± 7.53 a67.44 ± 7.42 b12.93 ± 0.46 a2904.56 ± 328.21 a297.09 ± 13.78 b108.22 ± 16.31 a25.04 ± 4.08 b3.84 ± 0.38 ab0.47 ± 0.08 b
S7.11 ± 0.18 a24.35 ± 1.55 a1.76 ± 0.13 ab0.84 ± 0.04 c21.07 ± 0.61 a130.22 ± 8.25 ab19.59 ± 3.17 b92.06 ± 9.98 a13.21 ± 0.43 a3510.14 ± 590.66 a328.91 ± 10.36 a67.92 ± 8.83 b27.67 ± 4.76 ab4.18 ± 0.27 ab0.65 ± 0.09 a
NPKS6.63 ± 0.20 b26.38 ± 1.64 a1.87 ± 0.12 a1.04 ± 0.08 a20.99 ± 0.59 a146.45 ± 14.88 a35.85 ± 4.91 a84.39 ± 6.80 a13.46 ± 0.21 a2881.99 ± 332.69 a314.38 ± 9.55 a116.93 ± 16.57 a33.99 ± 6.81 a4.34 ± 0.36 a0.60 ± 0.06 a
f13.80 **22.29 **5.60 *44.17 **0.155.13 *41.62 **0.139.10 *7.76 *10.05 **62.94 **4.58 **0.940.11
s2.2765.91 **18.08 **9.99 **0.983.242.3944.55 **19.08 **0.078.93 *3.8810.72 **9.21 *19.23 **
f × s1.223.000.770.150.070.020.015.44 *3.610.030.130.470.330.010.69
Note: Mean ± Sd (n = 4) for a series of fertility measurements. Different lowercase letters in a column indicate differences among treatments (p < 0.05), f: the main effect of fertilizer treatment; s: the main effect of straw treatment; f × s: the interaction effect of fertilizer and straw treatment. * Indicates significant difference at different levels (* p < 0.05, ** p < 0.01). The SOM, TN, TP, TK, AN, AP, AK, CEC, exchangeable Ca, exchangeable Mg, available Fe, available Mn, available Cu and available Zn: soil organic matter, total nitrogen, total phosphorus, total Potassium, available nitrogen, available phosphorus, available potassium, exchangeable cation, exchangeable calcium, exchangeable magnesium, available iron, available manganese, available copper and available zinc.
Table 3. Relative content of organic carbon components in soil aggregates under different treatments.
TreatmentAlkyl CO-Alkyl CAromatic CCarbonyl C
0–45 ppm45–60 ppm60–95 ppm95–110 ppmTotal110–160 ppm160–220 ppm
CH3/CH2OCH3/NCHCarbohydrateO-C-OC=O/ArylCOO/NC=O
>2CK23.4619.5951.753.3874.711.770.05
NPK23.6110.5445.2310.9066.689.710.01
S36.7816.8335.856.6759.353.080.79
NPKS37.0316.6439.325.1261.081.460.42
0.25–2CK25.5713.6434.007.3655.0011.797.64
NPK28.8016.7641.734.9663.443.334.42
S23.2511.0833.676.7551.5017.008.25
NPKS23.0012.0030.107.1049.2017.4010.40
0.05–0.25CK26.9511.2131.896.8749.9714.148.94
NPK24.6711.8735.476.9354.2714.136.93
S22.6912.3832.927.3852.6916.008.62
NPKS20.5811.3932.277.6951.3516.7811.29
<0.05CK30.6513.8531.655.4250.929.329.11
NPK34.6713.7627.144.8645.7610.009.57
S21.529.6831.366.9948.0416.6013.84
NPKS25.1311.0034.006.8751.8712.4710.53
Note: Colored cells denote ‘heatmap’ visualization of the differences between treatments with column means, where green indicates values below the respective means and red indicates values above the respective means.
Disclaimer/Publisher’s Note: The statements, opinions and data contained in all publications are solely those of the individual author(s) and contributor(s) and not of MDPI and/or the editor(s). MDPI and/or the editor(s) disclaim responsibility for any injury to people or property resulting from any ideas, methods, instructions or products referred to in the content.

