Abstract
TCP transcription factors play a key role in regulating various developmental processes, particularly in shoot branching, flower development, and leaf development, and these factors are exclusively found in plants. However, comprehensive studies investigating TCP transcription factors in pepper (Capsicum annuum L.) are lacking. In this study, we identified 27 CaTCP members in the pepper genome, which were classified into Class I and Class II through phylogenetic analysis. The motif analysis revealed that CaTCPs in the same class exhibit similar numbers and distributions of motifs. We predicted that 37 previously reported miRNAs target 19 CaTCPs. The expression levels of CaTCPs varied in various tissues and growth stages. Specifically, CaTCP16, a member of Class II (CIN), exhibited significantly high expression in flowers. Class I CaTCPs exhibited high expression levels in leaves, while Class II CaTCPs showed high expression in lateral branches, especially in the CYC/TB1 subclass. The expression profile suggests that CaTCPs play specific roles in the developmental processes of pepper. We provide a theoretical basis that will assist in further functional validation of the CaTCPs.
1. Introduction
The transcription factor (TF) is an essential protein that can bind to specific DNA sites, playing a pivotal role in regulating gene expression levels [1], including plant morphogenesis [2], the cellular life cycle [3], and responding to abiotic stresses [4]. The TCP gene family is named after the initials of its three members, TEOSINTE BRANCHED1 (TB1), CYCLOIDEA (CYC), and PROLIFERATING CELL FACTORS 1 and 2 (PCF1 and PCF2). TB1 is involved in maintaining apical dominance in maize (Zea mays) [5], CYC regulates floral symmetry in snapdragon (Antirrhinum majus) [6], and PCF functions in the cell cycle of rice (Oryza sativa) [7].
TCPs share a highly conserved non-canonical structure known as the basic-helix-loop-helix (bHLH) motif, which consists of 59 amino acids at the N-terminus. The special structure was called the TCP domain [2]. The functions of the domain include binding to DNA sites and participating in various protein interactions [8]. The TCP family is composed of two classes: Class I, which contains the PCF class [9,10], and Class II, which is further classified into two subclasses, CYC/TB1 and CIN, based on the dissimilarity of the TCP domain [11,12,13]. Additionally, members of Class II contain an arginine-enriched motif consisting of 18–20 amino acid residues. This motif is called the R domain, and it may arise from specific secondary structural proteins, resulting in participation in protein interactions [7].
Previous studies have confirmed that TCPs regulate various growth and development processes in plants, including embryonic growth [14], branching growth [15], floral symmetry [16], internode length [17], and leaf development [18,19]. The mechanism of TCPs responding to various hormones and abiotic stresses has been explored. For instance, in Arabidopsis, TCP9 and TCP19 have been shown to promote leaf senescence in response to treatment with jasmonic acid (JA). TCP14 promotes the process of Arabidopsis seed germination by responding to abscisic acid (ABA) signaling [20]. In Arabidopsis flowers, gynoecium and silique developmental processes are modulated by TCP15 through regulating auxin biosynthesis [21]. Furthermore, TCPs play key roles in regulating various phytohormone signaling, including salicylic acid (SA), brassinosteroids (BRs), strigolactones (SLs), and gibberellic acid (GA) [22]. OsTCP19 responds to abiotic stresses by regulating the expression level of ABI4 [23], and the overexpression of OsTCP14 contributes to enhancing rice cold tolerance [24]. In cotton, the expression of GhTCPs was significantly upregulated in responding to drought, heat, and salt stresses [25]. TCPs exhibit varying expression levels in different organs, and many TCPs have been found to show widespread and less tissue-specific expression profiling, such as in flowers, leaves, buds, and fruits in grapevine [26] and cassava [27]. In a nutshell, TCPs responded to abiotic stress and hormone signaling, and participated in various growth and developmental processes with diverse biological functions [11].
With the advancement of genome technologies, the number of plant species in which the TCP gene family has been identified is gradually increasing. For example, 22 TCPs in Oryza sativa [28], 24 TCPs in Arabidopsis, 38 TCPs in Gossypium raimondii L. [29], 73 TCPs in allotetraploid cotton (Gossypium barbadense L.) [25], 30 TCPs in tomato (Solanum lycopersicum) [30], and 31 TCPs in potato (Solanum tuberosum L.) had been analyzed [31]. Pepper (Capsicum annuum L.), a major worldwide spice crop of the Solanaceous, possesses great economic value as an ingredient for seasoning and medicine [32]. However, its growth, development, and productivity are sensitive to abiotic stress and various plant hormones [33,34]. The pepper genome was reported in 2014 [32,35]. However, the identification of TCP gene family members in pepper (Capsicum annuum L.) has not yet been conducted. To gain further insights into TCPs in pepper, we conducted detailed analyses in the current research, including phylogenetic relationships, gene classification, synteny analysis, GO annotation, conservation motif studies, cis-element analysis, predictions of miRNA targeting sites, and the three-dimensional structure of TCPs. Furthermore, we assessed the expression profiling of TCPs in different organs and their response to various hormone signaling and abiotic stress. This research provides a theoretical foundation for further studies on the biological functions of TCPs in pepper.
2. Results
2.1. Identification and Characterization of TCP Family Members in Pepper
We performed a BlastP search against the pepper genome using known TCP protein sequences from model plants (Arabidopsis and rice) and closely related species of pepper (tomato and potato). The obtained sequences were further verified with HMMER search using Pfam domains: PF03634. Finally, we identified a total of 27 TCPs that contain the TCP domain in the pepper genome (Table S1). The distribution of CaTCPs varied across different chromosomes. Chromosome 2 contained six CaTCPs, while chromosome 3 and chromosome 6 each had four CaTCPs. The remaining CaTCPs were distributed across chromosome 1, chromosome 5, chromosome 7, chromosome 8, chromosome 9, and chromosome 11 (Table S1). The nucleotide lengths of the 27 CaTCPs ranged from 614 bp (CaTCP24) to 1649 bp (CaTCP27), while the amino acid lengths ranged from 204 (CaTCP24) to 549 aa (CaTCP27) (Table S1). Out of the 27 CaTCP proteins, 26 were predicted to be located in the nucleus, while one CaTCP protein was found in the cytoplasm (Table S1).
2.2. Phylogenetic Analysis and Classification of CaTCPs
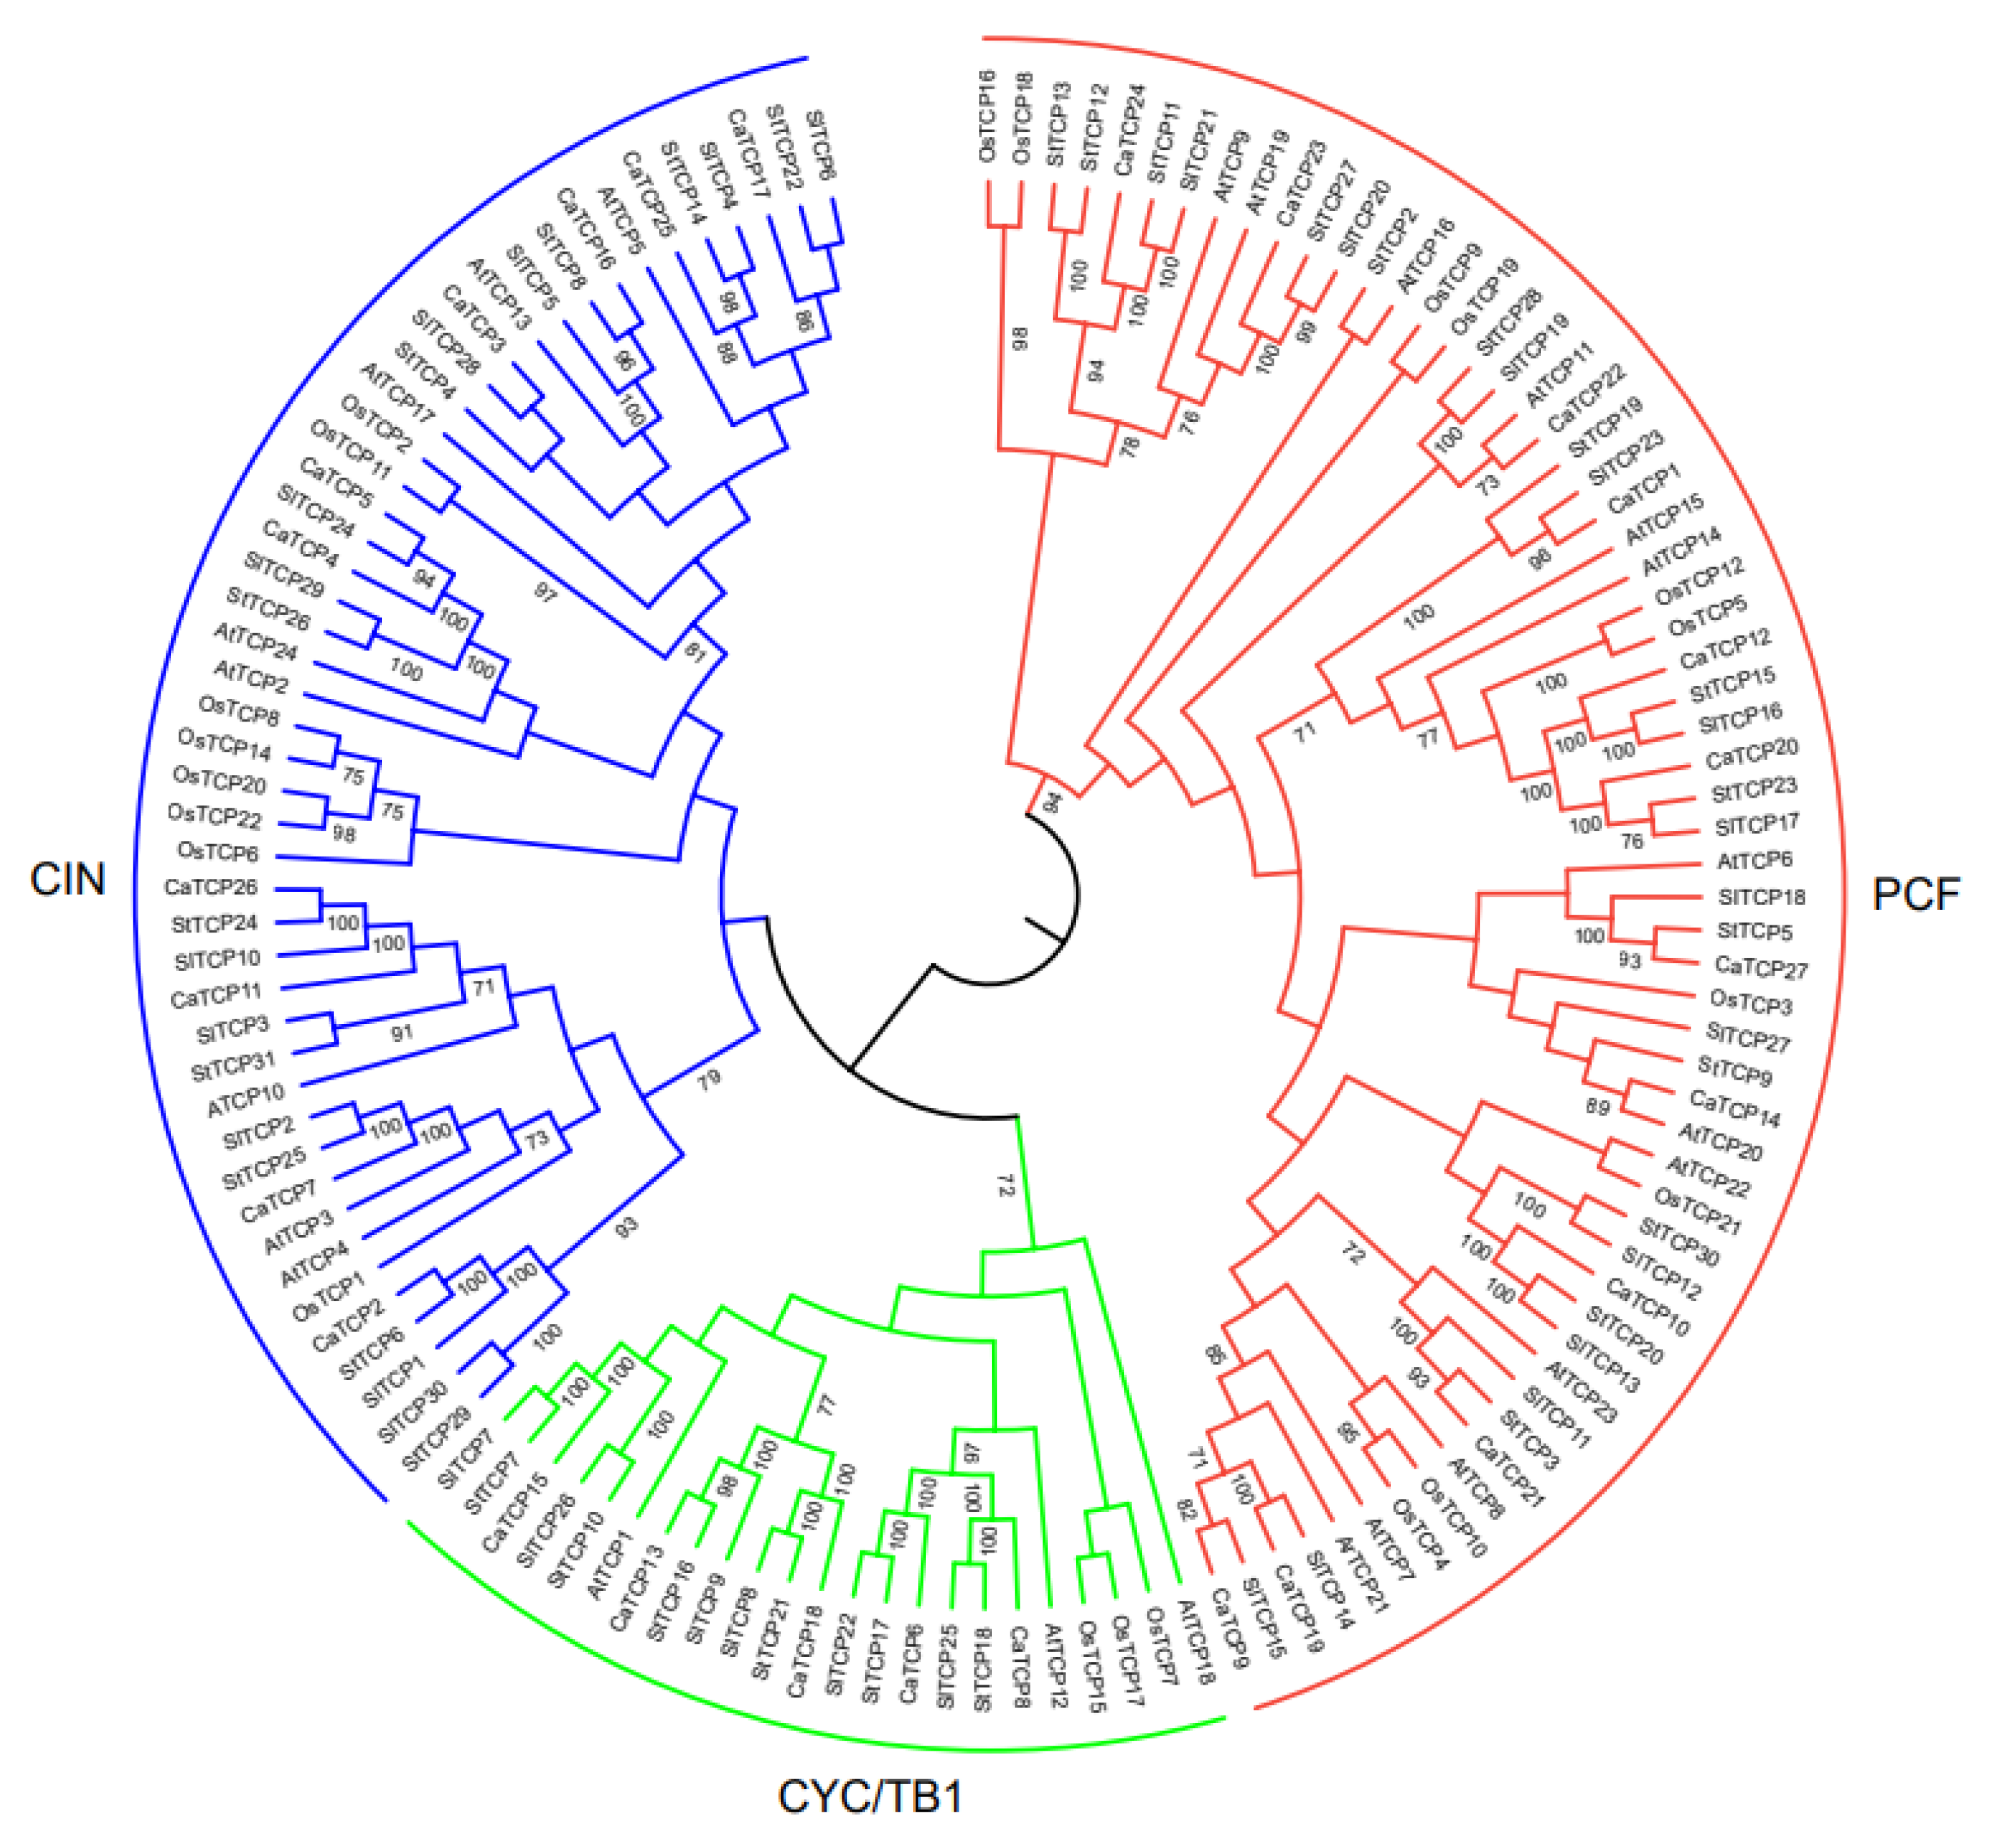
We constructed an unrooted phylogenetic tree (Figure 1) using 134 TCP proteins from Capsicum annuum, Arabidopsis thaliana, Oryza sativa, Solanum tuberosum, and Solanum lycopersicum to explore the evolutionary and phylogenetic relationships among these species. Following the standard classification in Arabidopsis thaliana [28], the 134 TCP members were divided into Class I (PCF) and Class II. Class I (PCF) comprises 62 TCP members (12 CaTCPs, 12 AtTCPs, 10 OsTCPs, 14 StTCPs, and 13 SlTCPs). Class II, which consists of 72 TCPs, was further divided into two subclasses: CYC/TB1 and CIN. Subclass CYC/TB1 includes 25 TCPs (5 CaTCPs, 3 AtTCPs, 4 OsTCPs, 7 StTCPs, and 6 SlTCPs), and CIN includes 47 TCPs (10 CaTCPs, 8 AtTCPs, 8 OsTCPs, 10 StTCPs, and 11 SlTCPs) (Figure 1). The tree revealed that most CaTCPs were phylogenetically closer to StTCPs and SlTCPs than to members from other species. The number of CaTCPs distributed in both subclasses is similar to the scattered distribution pattern of other species (Figure 1; Table S2).
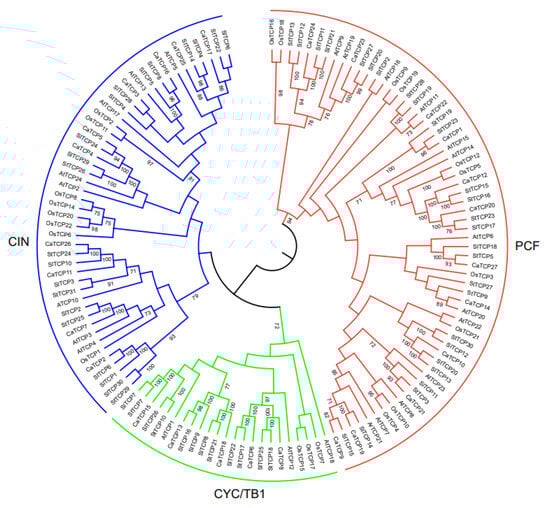
Figure 1.
Phylogenetic relationship among TCP transcription factor families in Capsicum annuum (CaTCP), Arabidopsis thaliana (AtTCP), Oryza sativa (OsTCP), Solanum tuberosum (StTCP), and Solanum lycopersicum (SlTCP). The phylogenetic tree was constructed using the Neighbor-Joining method based on 134 full-length protein sequences from 27 CaTCPs, 24 AtTCPs, 22 OsTCPs, 31 StTCPs, and 30 SlTCPs. These TCP protein sequences were clustered into two major classes, Class I (red) and Class II (green, blue).
To determine the characteristic features of each class and subclass, we conducted an alignment analysis. We found 27 genes with highly shared TCP protein domains in pepper (Figure 2A). The 27 CaTCP protein sequences could be divided into 12 Class I (PCF) members and 15 Class II members, which include 5 CYC/TB1 subclass members and 10 CIN subclass members. In the basic motif, most members of Class I show a loss of four amino acids compared to Class II (Figure 2A). Within Class II, the Helix II motif of CYC/TB1 subclades lacks the amino acid “A” compared to the CIN subclass (Figure 2A). We observed that three members of Class II possess an R domain. These three members include two CIN members (CaTCP5 and CaTCP11) and one CYC/TB1 member (CaTCP15) (Figure 2B). These findings are consistent with the results of previous phylogenetic analyses.
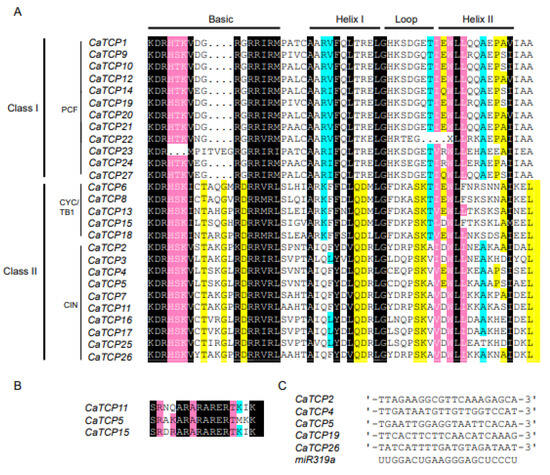
Figure 2.
Multiple sequence alignment of two classes of CaTCP proteins. Conserved nucleotides are colored as follows: black, 100%; pink, 90–99%; cyan, 60–89%; and yellow, 50–59%. (A) The putative TCP domain for CaTCP proteins. (B) The putative R-domain for Class II subfamily members of CaTCP proteins. (C) Alignment of predicted target regions for miR319 complementary sequences.
2.3. Chromosomal Location and Synteny Evaluation of TCP Genes
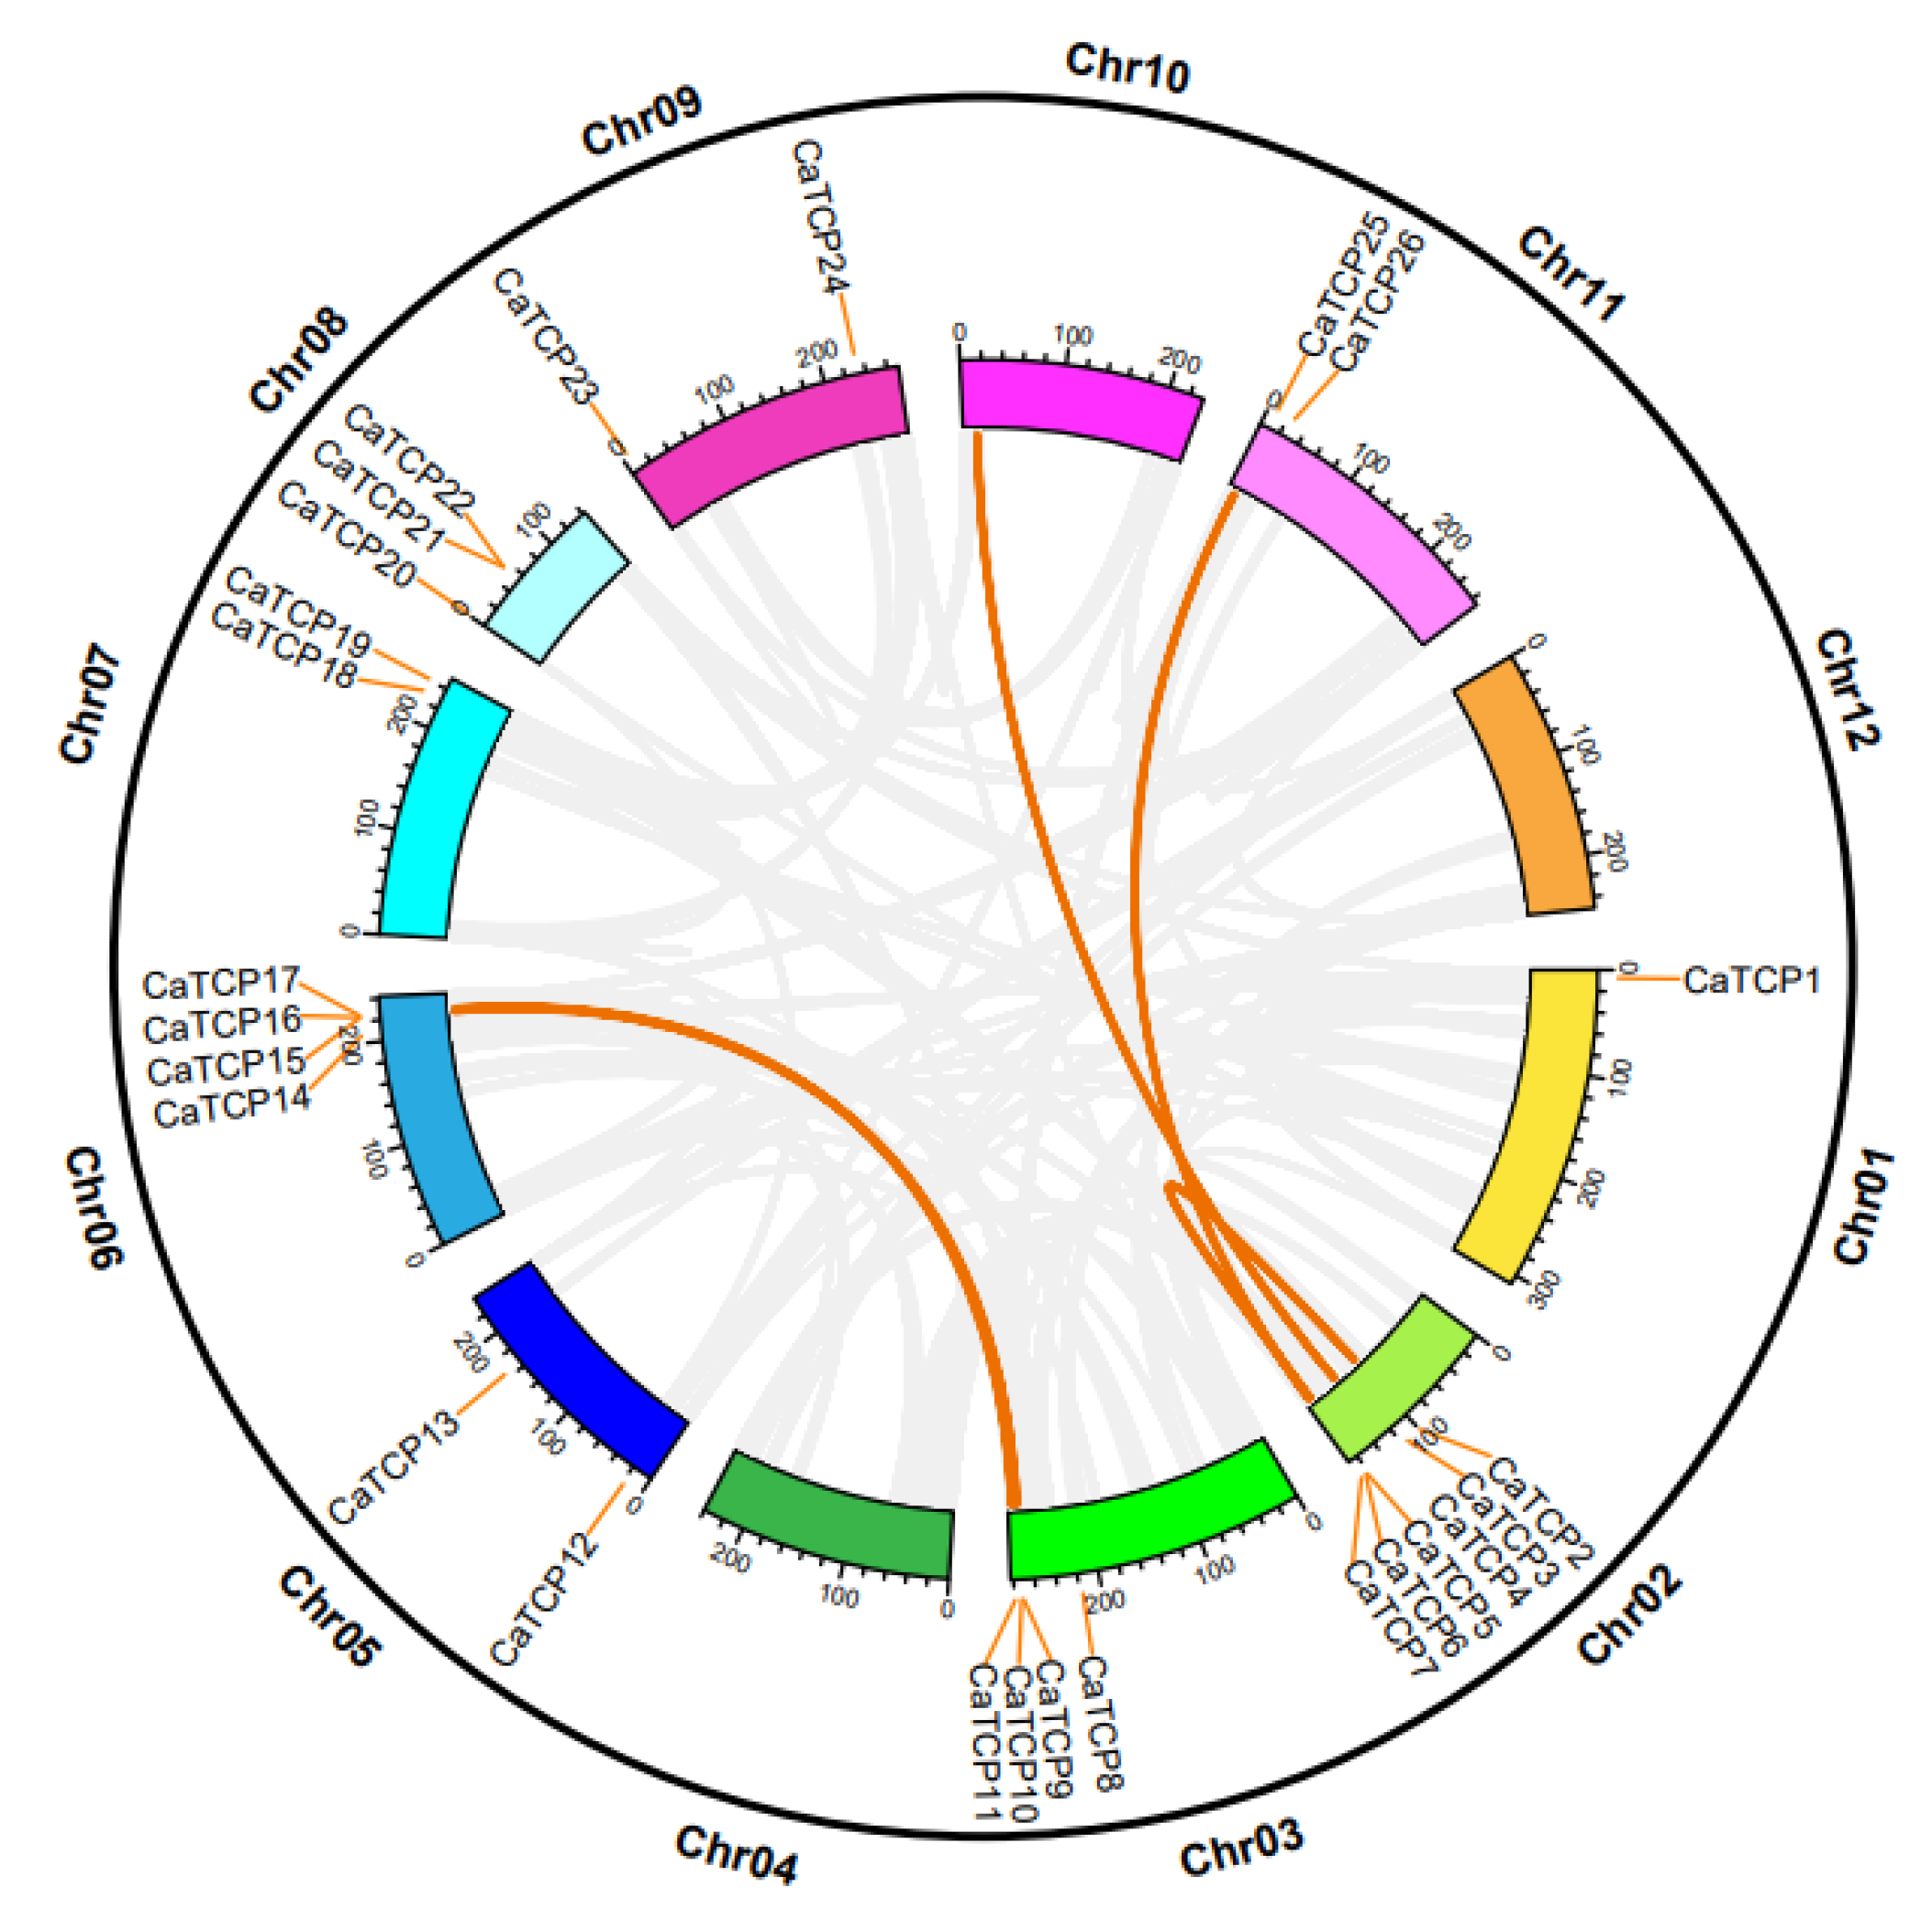
The pepper genome analysis revealed that 27 CaTCPs were unevenly distributed among 9 out of 11 pepper chromosomes (Figure 3). Chromosomes 2, 3, 6, and 8 exhibited a higher number of CaTCPs, with 6, 4, 4, and 3 genes, respectively, in contrast to chromosomes 1, 5, 7, 9, and 11, which harbored CaTCPs 1, 2, 2, 2, and 2, respectively. Chromosomes 4, 10, and 12 were devoid of CaTCPs (Figure 3). Remarkably, chromosomes 2 and 3 exhibited an enrichment in CaTCPs, with over 40% of TCP clusters on chromosomes 2 and 3. Despite accounting for only 5.81% (169.55 M) of the reference genome (2.85 G), chromosome 2 harbors 22.2% of the CaTCPs. Chromosome 3, which represents only 9.68% (282.78 M) of the pepper genome, contains 14.8% of the CaTCPs. Analysis of duplication events revealed the classification of CaTCPs into whole-genome duplication and tandem duplication (Table S3). The analysis identified four putative paralog pairs of segmental duplication and two putative paralog pairs of tandem duplication (Figure 3). What can be seen in these results is that large-scale genome duplication events had a significant effect on the evolution of the TCP family in pepper.
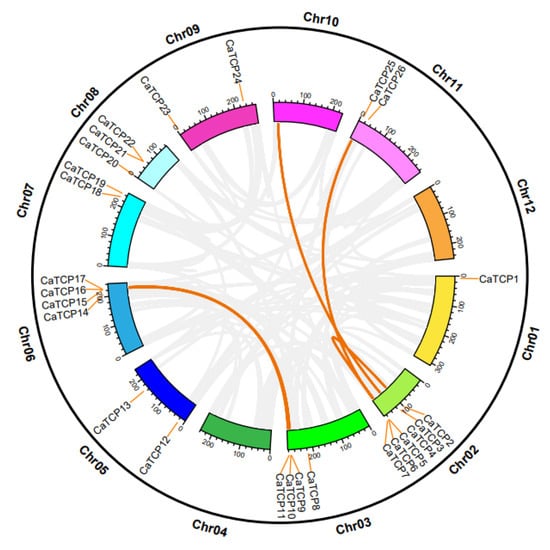
Figure 3.
Chromosomal distribution and inter-chromosomal relation of the CaTCPs. Orange lines denote syntenic CaTCP gene pair blocks. All syntenic relationships in the pepper genome are indicated in gray.
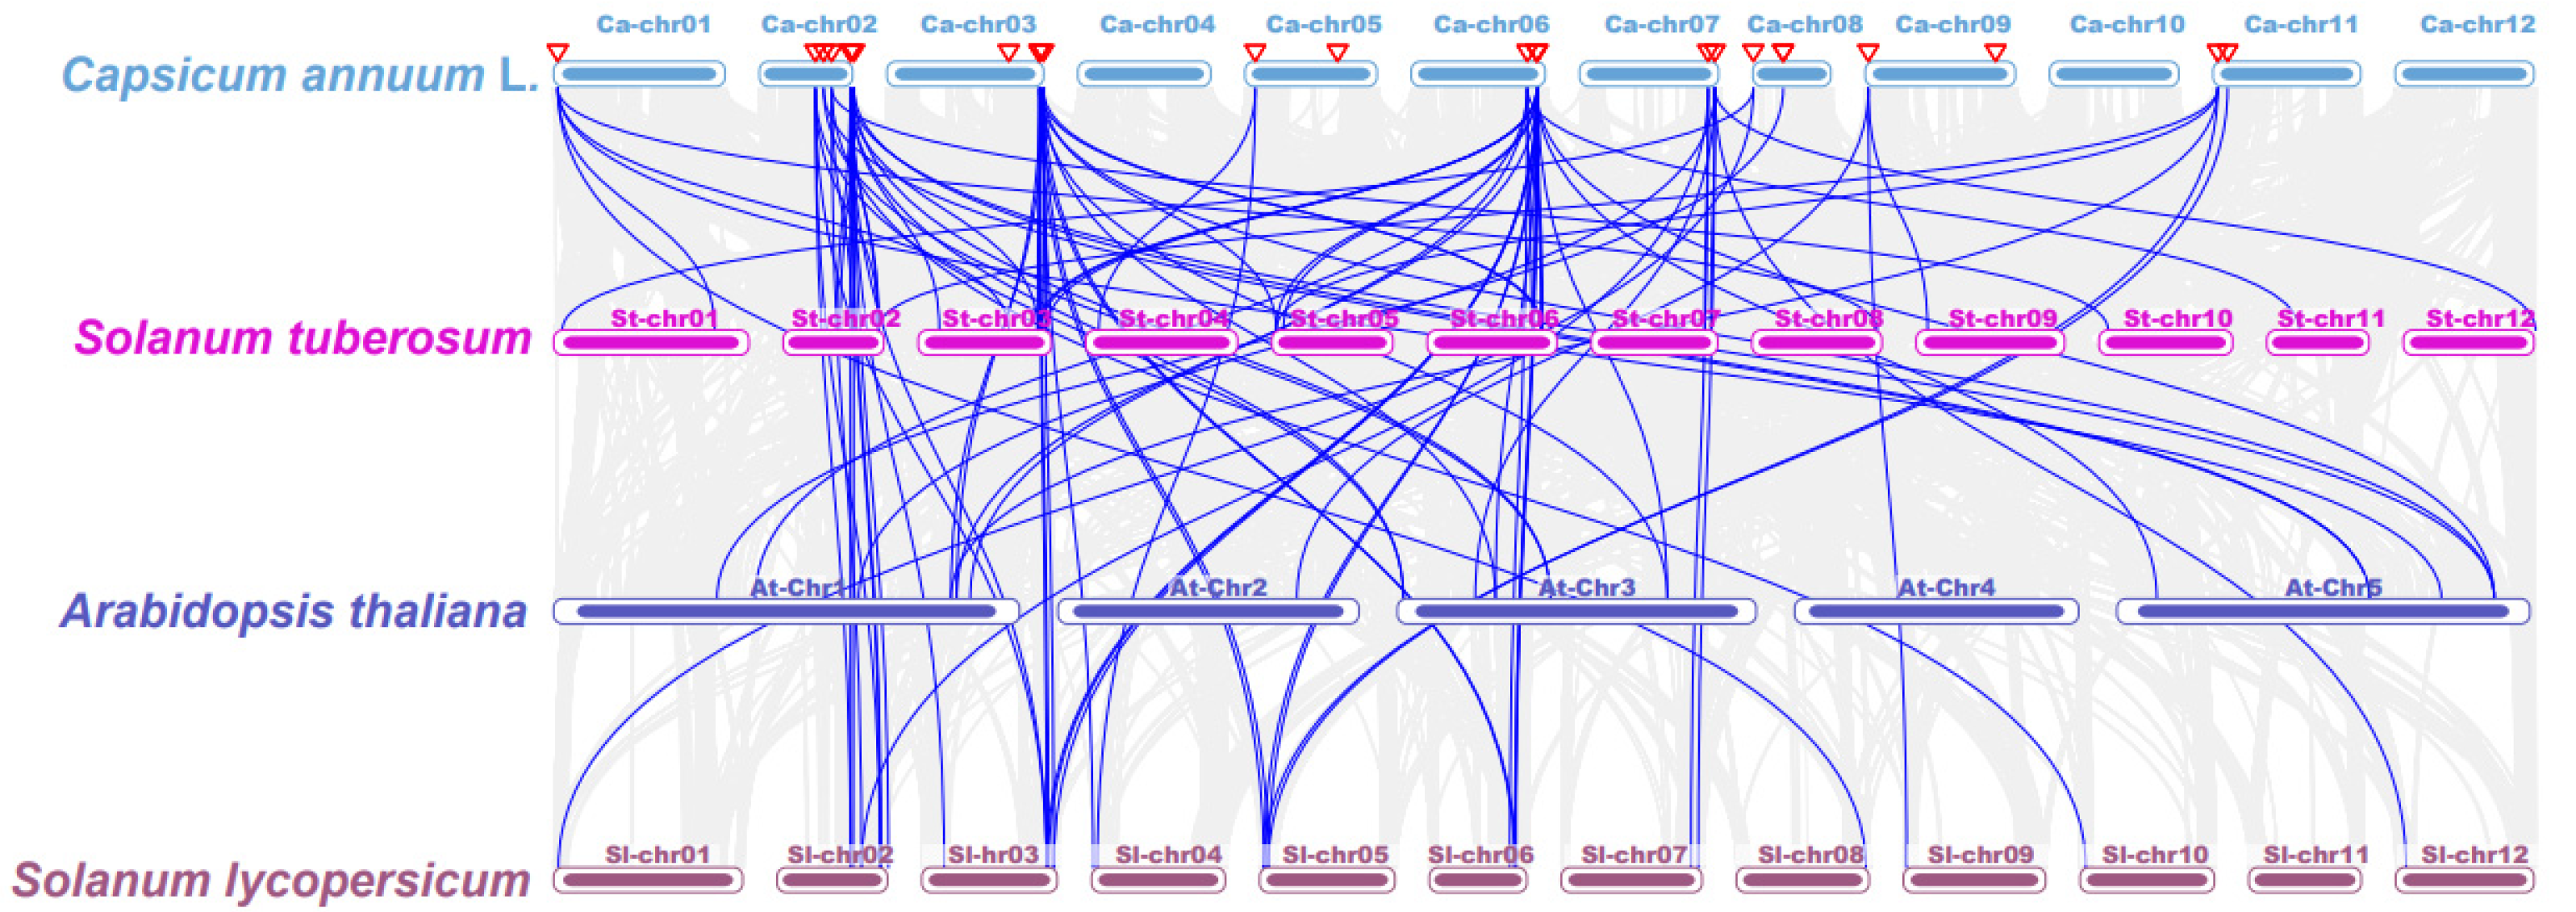
Collinearity analysis was performed to uncover the evolutionary relationship among TCPs in different species (Figure 4; Table S3). Chromosome 2 showed syntenic associations between 5 CaTCPs, 12 StTCPs, and 9 SlTCPs. Similarly, chromosome 3 exhibited syntenic relationships between 3 CaTCPs and 6 StTCPs, as well as 8 SlTCPs. (Figure 4; Table S3). The results of collinearity analysis show that the evolutionary relationship of the TCPs in Solanaceae is complex, especially in chromosome 2 and chromosome 3. On the other hand, the complex syntenic relationship between Solanaceae species shows that segmental or tandem duplication was an important factor of CaTCP expansion in the pepper genome (Figure 4; Table S3).

Figure 4.
Synteny analysis of TCP genes between pepper, Arabidopsis thaliana, Oryza sativa, Solanum tuberosum, and Solanum lycopersicum. Grey lines present gene blocks that are orthologous to the other genomes. Blue lines indicate the syntenic TCP gene pairs. Red triangles indicate CaTCPs.
The Ka/Ks ratio is commonly employed to investigate the selection pressures acting on sequences. Generally, Ka/Ks > 1 indicates that the gene is under strong positive selection during the process of evolution, On the contrary, Ka/Ks < 1 indicates that the gene is under purifying selection. Consequently, Ka/Ks ratios of TCP genes were calculated among the four species to explore the evolutionary processes of CaTCPs (Table S3). The results show that the Ka/Ks ratio of the duplicated CaTCPs pairs is less than 1 (Table S3), indicating that some CaTCPs may be lost owing to selective pressure (Table S3). The selection pressure analysis results were consistent among Arabidopsis thaliana, Oryza sativa, Solanum tuberosum, and Solanum lycopersicum (Table S3).
2.4. Assessment of Gene Structures and Conserved Motifs, and Recognition Sequence of miR319
Analysis of the exon/intron structure and configuration of CaTCPs was conducted to gain deeper insights into the diversification of CaTCPs (Figure 5C). The gene structure of CaTCPs was analyzed by aligning the coding sequence (CDS) of each CaTCP gene with the corresponding pepper genomic sequences. The results revealed that four out of twelve CaTCPs in Class I (PCF) contained introns. The CIN subclass of CaTCPs exhibited a conserved gene structure, with nine out of ten CaTCPs lacking introns, while CaTCP3 possessed a single intron (Figure 5C). Within the CYC/TB1 subclass, three out of five CaTCPs contained introns (Figure 5C). The exon–intron arrangement of TCP genes was comparatively constant, especially CaTCPs of the same class, which retained highly consistent gene structures (Figure 5C).
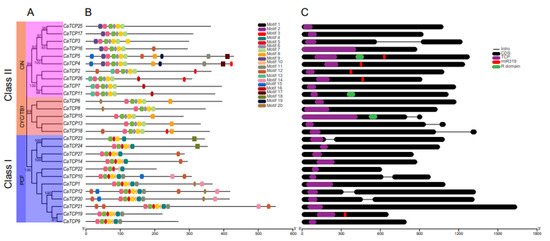
Figure 5.
Phylogenetic tree, gene structure, and motif composition of CaTCPs. (A) Phylogenetic tree of CaTCP proteins. (B) Conserved motif compositions in CaTCP proteins. Each specific color has a distinct motif. (C) Exon and intron structure of CaTCPs. Exons and introns are shown by black rounded rectangles and black lines, respectively. Purple, red, and green rounded rectangles represent the TCP domain, miR319 recognition site, and R domain. The lengths of CaTCPs are indicated by the scale.
The motifs of CaTCPs were analyzed by identifying conserved regions within their protein sequences, providing a deeper understanding of the evolutionary relationship among CaTCPs (Figure 5B). In total, we predicted 20 motifs (Table S4). The number of conserved motifs among the CaTCPs ranged from 5 to 13 (Table S5). As expected, all 27 CaTCPs exhibited a highly conserved TCP domain. Motifs 1, 2, and 3 were present and conserved in all CaTCPs. Motifs 17 and 19 were only present in Class I. In short, motif structures and the distribution of CaTCP proteins were consistent with the classification of the class, suggesting that TCPs within the same subclass may share similar biological functions.
In Arabidopsis, miR319a controls leaf senescence and JA biosynthesis by binding to TCP transcription factors. The TCPs that can be combined by AtmiR319 include AtTCP2, AtTCP3, AtTCP4, AtTCP10, and AtTCP24 which belong to Class II [18]. In Capsicum annuum, the evolutionarily closest homologs of the Arabidopsis genes are CaTCP2, CaTCP4, CaTCP5, CaTCP19, and CaTCP26, which can be bound by miR319. These homologs show closer proximity to the AtTCPs in the phylogenetic tree (Figure 1 and Figure 2B). The results suggest that miR319 probably plays a key role in regulating pepper development by binding to these CaTCPs (Figure 5C; Table S6).
2.5. Genome-Wide Prediction of miRNA Targeting CaTCPs
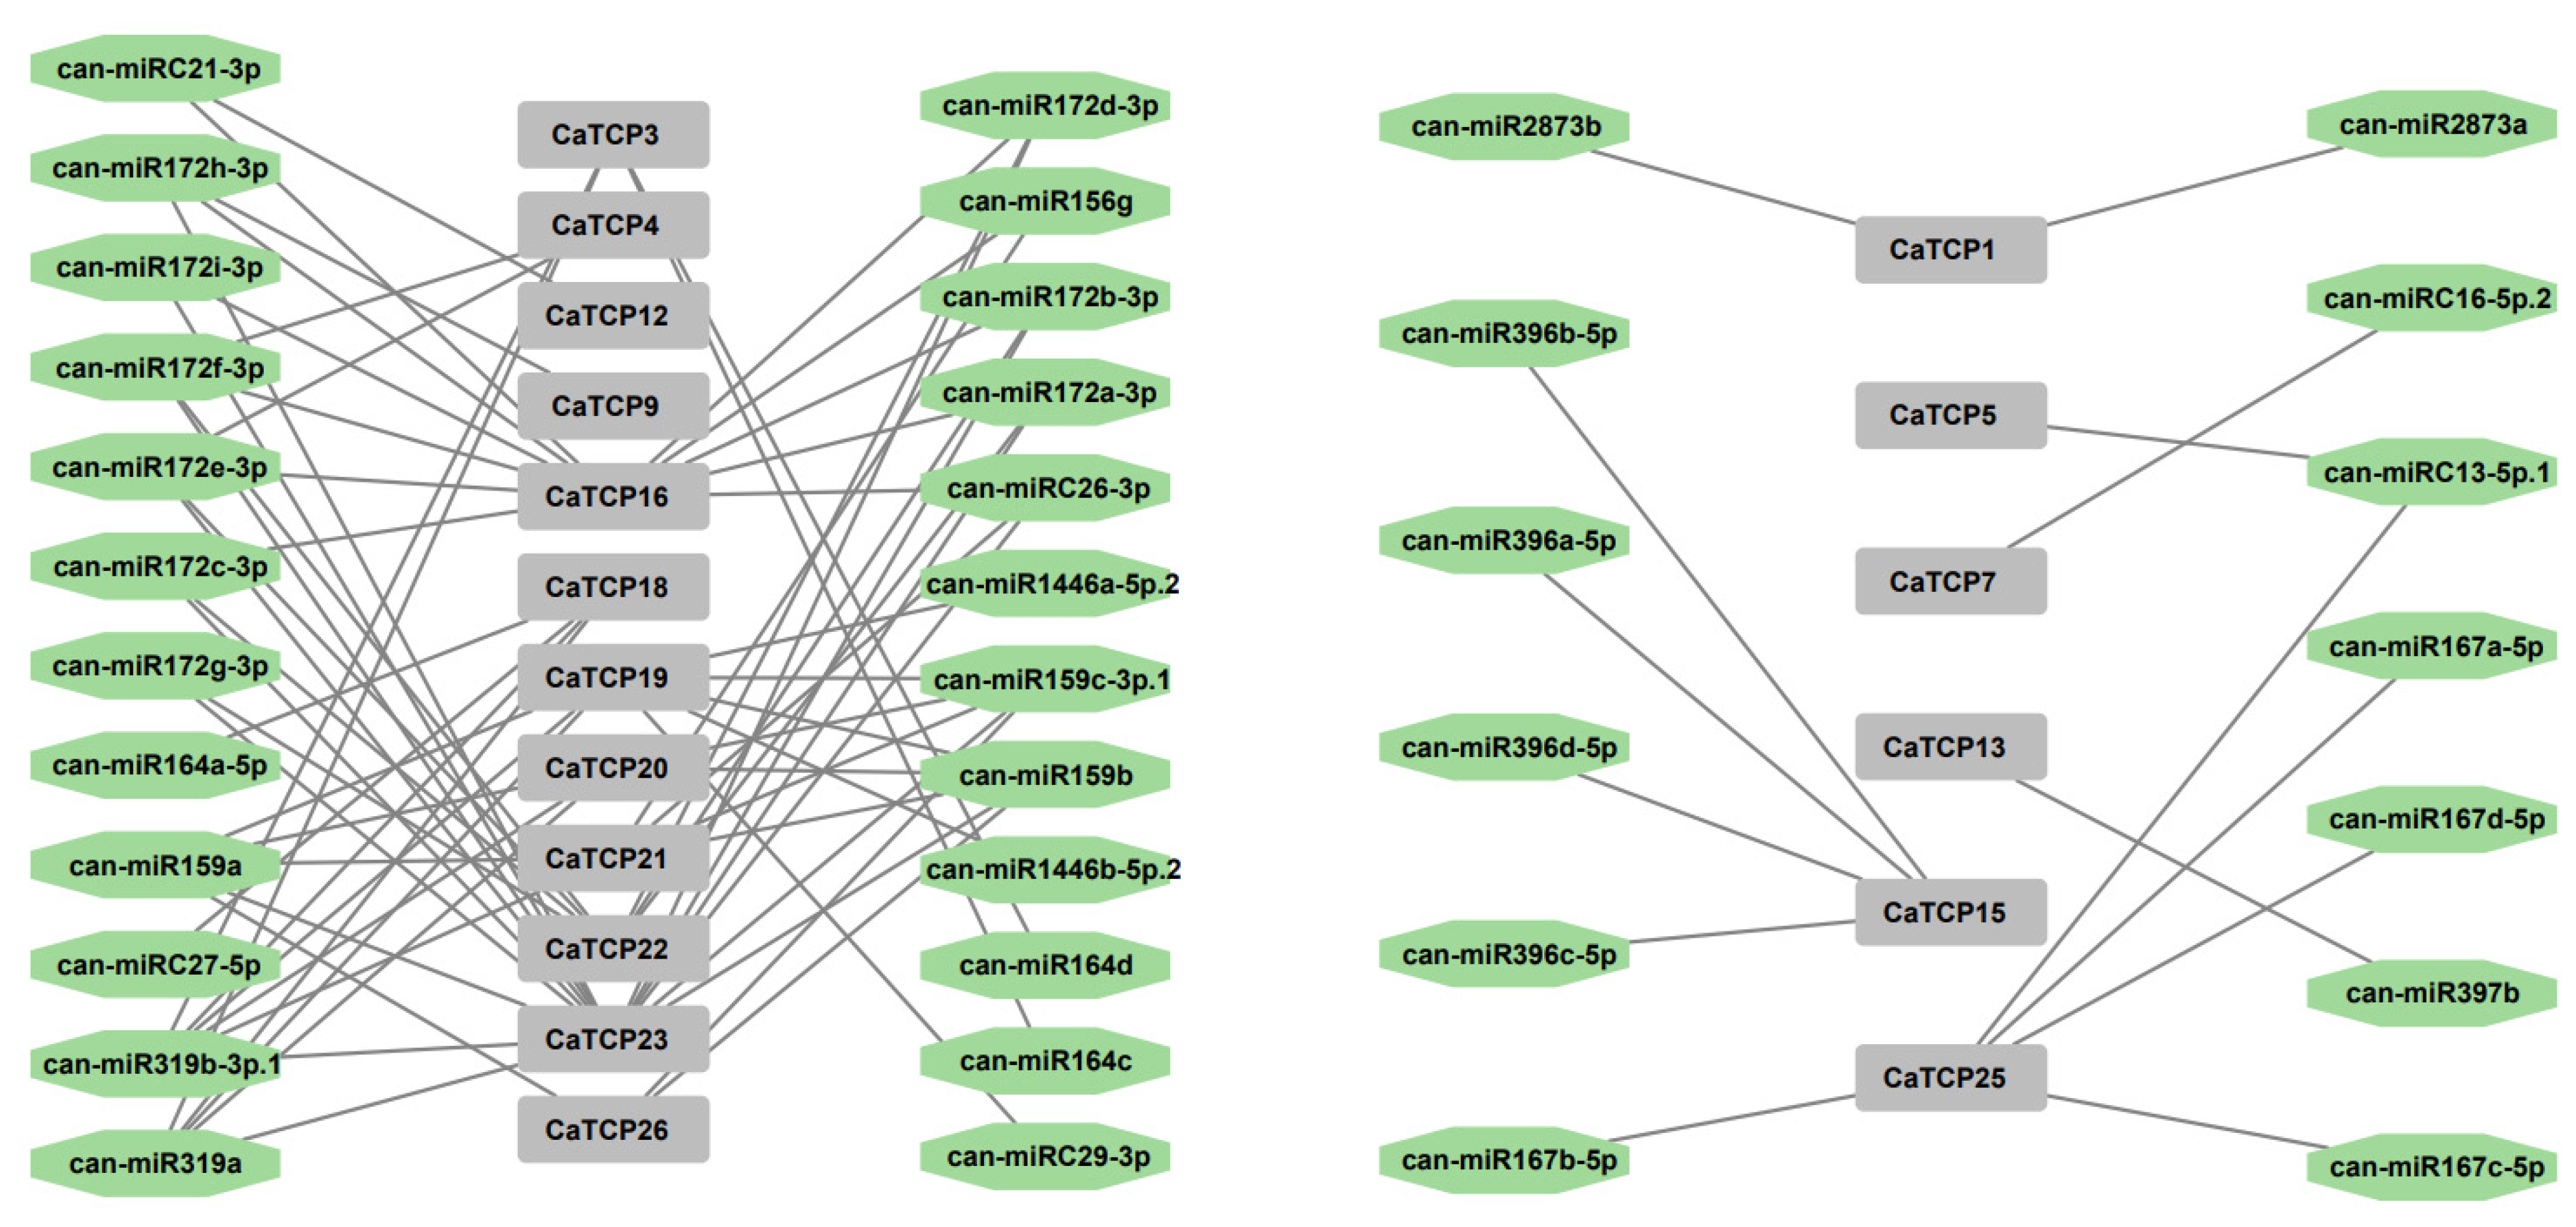
Over the past decade, an increasing body of literature has emphasized the involvement of miRNA binding to target genes in abiotic and biotic stress responses. Hence, to boost our understanding of miRNAs linked to the regulation of CaTCPs, we predicted 37 miRNAs targeting 19 CaTCPs (Figure 6; Table S6). CaTCP23, CaTCP16, and CaTCP19 were forecasted to be regulated by a larger number (respectively, 15, 11, 8) of miRNAs (Figure 6; Table S6). It is interesting that both miR319 and miR159 can target five CaTCPs (Table S6). To explore the biological function of the miRNAs and targeted CaTCPs, additional research validating their expression profiling is required.
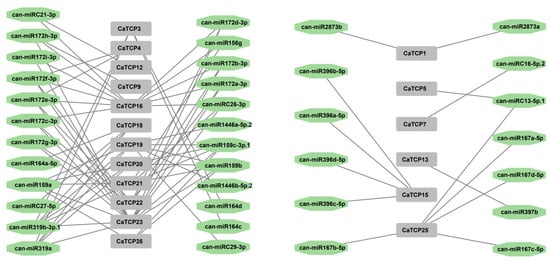
Figure 6.
Network diagram of the regulatory linkages among the anticipated miRNAs and putative CaTCPs. Green octagon colors correspond to miRNAs, and gray rectangles represent CaTCPs.
2.6. GO Annotation and Enrichment Analysis of CaTCPs
GO annotation and enrichment analysis was used to further study the biological functions of CaTCPs. The analysis included biological process (BP), molecular function (MF), and cellular component (CC) classes. Several suggestively enriched terms were identified and presented (Table S7). For example, in the BP enrichment analysis class, 19 principally enriched terms were uncovered, involving the regulation of macromolecule metabolic processes (GO:0060255), metabolic processes (GO:0019222), and cellular processes (GO:0050794) (Table S7). In the CC enrichment analysis, we identified ten primarily enriched terms, involving intracellular membrane-bound organelles (GO:0043231), obsolete cell parts (GO:0044464), membrane-bound organelles (GO:0043227), and obsolete cells (GO:0005623) (Table S6). Outcomes of the MF class distinguished eight highly enriched terms linking with molecular function (GO:0003674), and organic cyclic compound binding (GO:0097159) (Table S7). In short, the GO enrichment analysis confirmed the involvement of CaTCPs in DNA-templated transcription, heterocyclic compound binding, and the transcriptional regulation of pepper growth and development stages.
2.7. Expression Profiling of CaTCPs in Different Organs and Development Stages
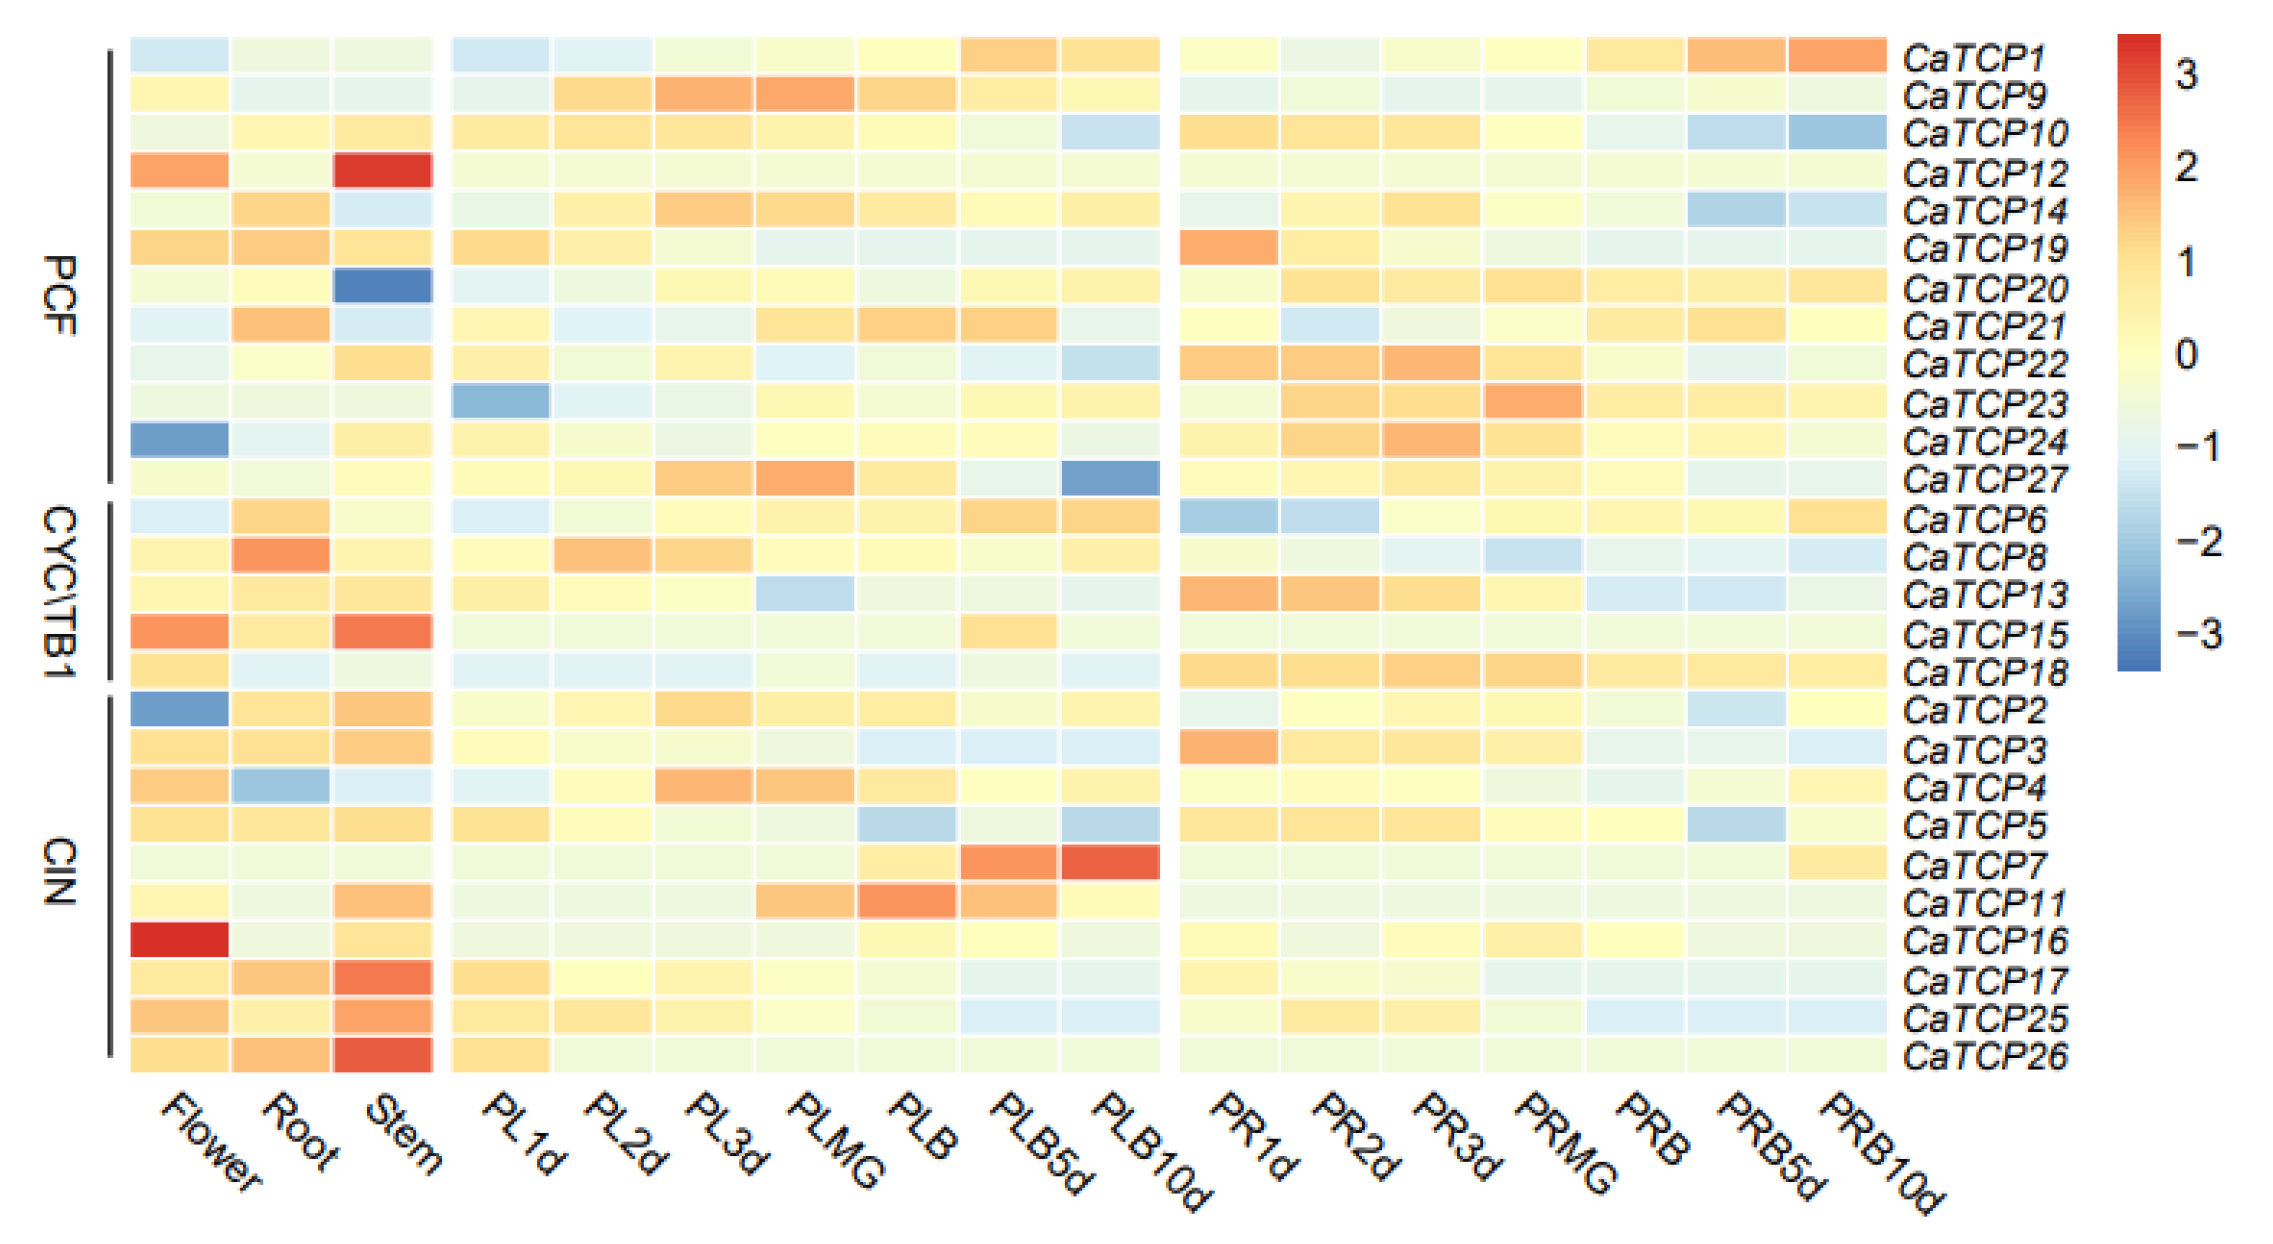
We determined the tissue-specific expression levels of CaTCPs in five major tissues: root, stem, leaf, placenta, and pericarp (Figure 7). The relative transcript abundance of CaTCPs revealed distinct expression patterns for each gene across different tissues and developmental stages. For instance, CaTCP16 exhibited higher expression levels in flowers but lower expression levels in roots and stems (Figure 7). The expression levels of the genes varied across developmental stages. For instance, in the placenta, the expression of CaTCP7 gradually increased over the development period, while the expression of CaTCP25 gradually decreased (Figure 7). In the pericarp, the expression of CaTCP1 gradually increased over the development period, whereas the expression of CaTCP10 gradually decreased (Figure 7). These results suggest that certain genes exhibit unique expression profiles during different developmental stages. In conclusion, the RNA-seq data indicate that certain CaTCPs are likely involved in important biological functions that contribute to the growth and development of pepper.
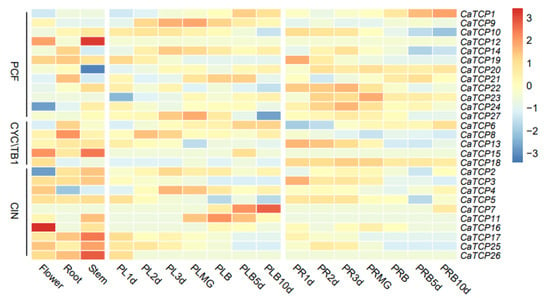
Figure 7.
Expression pattern of CaTCPs in various tissues at different developmental stages. The different tissues of flower, root, stem, placenta, and pericarp. PL, PLMG, PLB, PR, and PRB tags represent the placenta, placenta green mature, placenta breaker, pericarp, and pericarp breaker stages of fruit development, respectively. The 1 d, 2 d, 3 d, 5 d, 10 d labels indicate the time points (days) at which the tissues were collected. High expression levels are indicated by the red color and low expression levels are indicated by the blue color. The vertical bar on the right shows the three groups of CaTCPs.
To investigate the importance of CaTCPs in controlling leaf development and shoot branching, expression profiles were analyzed in stem leaves, branch leaves, flower buds, and lateral buds using qRT-PCR. All CaTCPs were expressed in the four tissues, but expression patterns varied between subclasses (Figure S1; Table S8). Compared to Class II, most members of Class I had a special high expression in stem and branch leaves (Figure S1; Table S8), especially with the high expression in branch leaves, indicating that Class I CaTCPs play a key role in controlling leaf development in pepper. In contrast, most CaTCPs belonging to Class II showed high expression in lateral branches, such as CaTCP6, CaTCP8, and CaTCP17 (Figure S1B,C; Table S8). The results imply that Class II CaTCPs may play a key role in regulating shoot branching. Almost all members are expressed in flower organs, indicating that CaTCPs may have important regulatory functions in flower development. It was further determined that CaTCPs play specific roles in various aspects of pepper development and growth, especially in leaf growth and shoot branching. The results are based on the mining of publicly available transcriptome sequencing data, BioProject ID: PRJNA223222.
2.8. Expression Profiling Analysis of CaTCPs under Phytohormones and Abiotic Stress Conditions
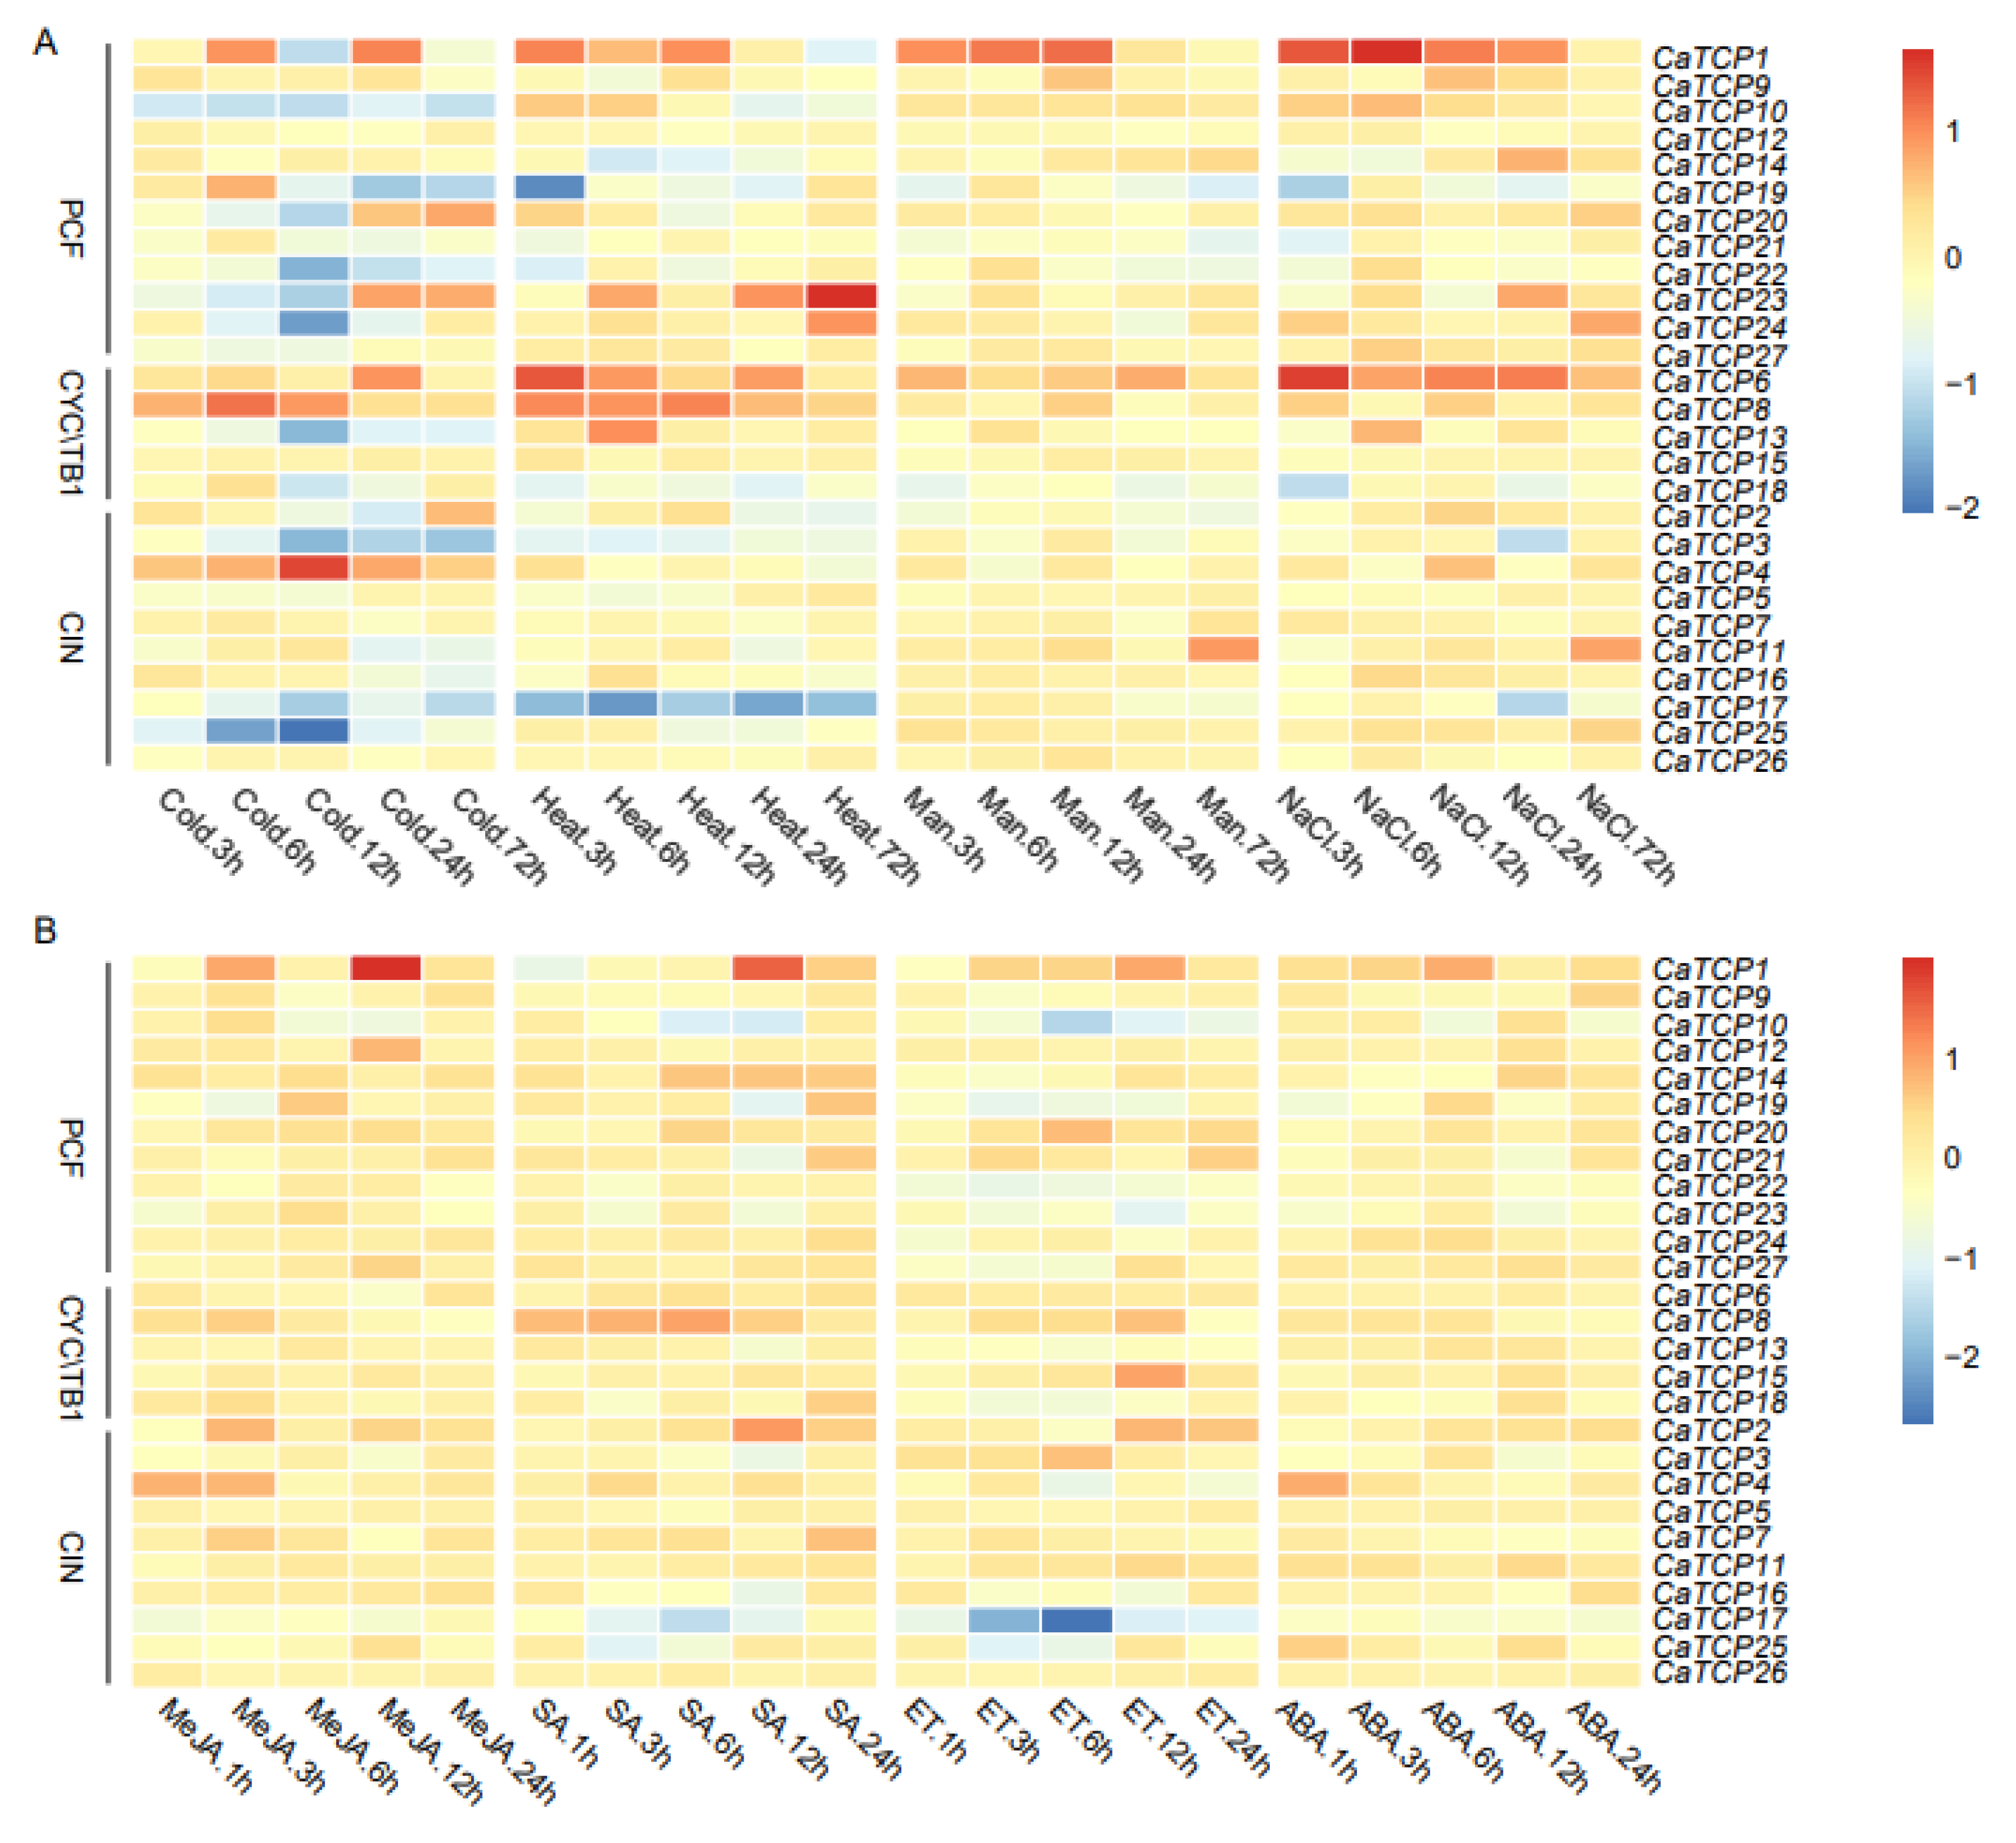
The expression profiling of CaTCPs under abiotic (cold, heat, drought, and salt), and phytohormone [methyl jasmonate (MeJA), salicylic acid (SA), ethylene (ET), and abscisic acid (ABA)] treatments at different time points was conducted using public transcriptome data (Figure 8). In abiotic stress conditions, a few TCP genes had comparatively high expression levels compared to the control group. For example, CaTCP8 was significantly upregulated under heat and cold stress. Notably, CaTCP4, which contains a low-temperature responsive element, exhibited significantly higher expression levels at 12 h under cold treatment (Figure 8A; Table S9). Under drought stress, CaTCP11 and CaTCP26 showed significant upregulation (Figure 8A). Interestingly, under salt stress, three CaTCPs, CaTCP1, CaTCP11, and CaTCP16, had significantly higher expression levels at 6 h, 72 h, and 6 h, respectively. It is noteworthy that all these genes contain a drought-responsive element (Figure 8A; Table S9).

Figure 8.
Expression profiling of CaTCPs under abiotic stress and phytohormone treatments. High expression levels are indicated by the red color and low expression levels are indicated by the blue color. The vertical bar on the right shows the three groups of CaTCPs. (A) Expression levels in seedings under abiotic stress conditions including cold, heat, drought (mannitol), and salt (NaCl) treatments for 3 h, 6 h, 12 h, 24 h, and 72 h. (B) Expression levels in response to phytohormone treatments including methyl jasmonate (MeJA), salicylic acid (SA), ethephon (ET), and abscisic acid (ABA) for 1 h, 3 h, 12 h, and 24 h. Numerous time points of abiotic stress contain 1 h, 3 h, 6 h, 12 h, 24 h.
Most genes showed upregulation under MeJA treatment. Notably, CaTCP8, which contains four MeJA responsiveness elements, exhibited higher expression (Figure 8B; Table S9). In contrast, only three genes (CaTCP11, CaTCP15, and CaTCP20) showed comparatively high expression levels under ET treatment (Figure 8B). After SA treatment, CaTCP2 and CaTCP7, which contain salicylic-acid-responsive elements, showed significantly higher expression levels (Figure 8B; Table S9). After ABA treatment, few genes showed significant variation (Figure 8B). These results further validate the presence of cis-elements linked to phytohormones and abiotic stress in CaTCPs, indicating their specific physiological roles in response to signaling pathways and abiotic stress, particularly in the case of salt, MeJA, and SA treatment. The results are based on the mining of publicly available transcriptome sequencing data.
2.9. Prediction of Interaction Network of CaTCPs
To better understand protein interactional relationships between CaTCPs, we constructed an interaction network using the 27 CaTCPs. We filtered out interrelationships with confidence levels below 0.9, resulting in 22 interacting CaTCPs. The detailed data of the predicted interaction network for these 22 CaTCPs are recorded in Table S10. The interaction network of CaTCPs revealed a complex relationship. CaTCP4 and CaTCP9 exhibited a co-expression phenomenon with CaTCP16, which show consistent changes in gene expression levels. CaTCP16 plays a vital role in the interaction network by directly interacting with 13 CaTCPs and indirectly interacting with 8 CaTCPs (Figure S2; Table S10). CaTCP16 interacted with the regulation of developmental-process-related TCP genes, CaTCP3 and CaTCP4, and other CaTCPs, which had been annotated by GO as the regulation of developmental processes (GO:0050793) (Figure S2; Table S7). CaTCP16 also interacted with shoot system development, CaTCP5, CaTCP9, and other CaTCPs. Therefore, CaTCP16 may be involved in cell differentiation and development rhythms in pepper.
2.10. Three-Dimensional Structure Prediction of CaTCPs Protein
To assess the 3D structure models of CaTCP proteins, we subjected the protein sequences to the Robetta server for prediction. We selected 22 high-quality structures based on their confidence score values. The results indicated that the predicted structures of CaTCP are highly reliable, with the most favored regions ranging from 82.1% to 91.4%, additional allowed regions ranging from 6.1% to 16.3%, generously allowed regions ranging from 0% to 1.7%, and disallowed regions ranging from 0% to 1.3% (Table S11). The secondary structures of the CaTCP protein can be classified into four main classes: alpha helices, beta sheets, random coils, and extended strands. The distribution of secondary structures was as follows: alpha helices accounted for 8.06–36.03%, beta sheets accounted for 0.90–7.12%, random coils accounted for 42.20–74.41%, and extended strands accounted for 6.09–19.61% (Figure S3; Table S11). The random coil was the predominant secondary structure, indicating a high degree of consistency in the secondary structures.
3. Discussion
3.1. Identification, Expansion, and Evolution of TCP Gene Family in Pepper
Pepper (Capsicum annuum L.) is the second-most widely cultivated vegetable in the Solanaceae family, following tomatoes [34]. TCP transcription factors have been reported to be involved in various processes [35,36,37,38,39]. To date, TCPs have not been identified in the genomes of unicellular algae. However, five to six TCPs have been found in basal land plants [40], and numerous members have been identified in gymnosperms and angiosperms [11,40]. In this study, we identified 27 TCPs in the pepper genome, including twelve CaTCPs in the genomic duplicated region, which were involved in whole-genome duplication (WGD) or tandem duplication. Tandem duplication is presumed to generate gene copies [41,42]. Another key mechanism for the expansion of gene families is whole-genome duplication (WGD). In the pepper genome, with the expansion and evolution of CaTCPs mainly owing to WGD, 29.6% of CaTCPs were involved in WGD (Table S3); one possible reason for this could be that Solanaceae species have experienced additional WGD events [43,44].
3.2. CaTCP Expression Pattern during Various Tissue Growth Stages
Conducting expression analysis in various tissues and growth stages will enhance our understanding of the regulatory mechanisms and biological processes involving CaTCPs in pepper [45]. The expression of 27 CaTCPs was profiled in the flower, root, stem, placenta, and pericarp. The results revealed a significant high expression of CaTCP7 in the placenta, CaTCP12 in the stem, and CaTCP16 in the flower. Several reports have confirmed that TCPs exhibit diverse expression levels as a result of their involvement in various biological processes [46,47,48]. For instance, in cotton, tissue-specific expression patterns of GhTCP genes in the root, stem, leaf, flower, fiber, and ovule were analyzed. In the current study, CaTCP16 belonging to CYC/TB1 showed significantly high expression in flowers, suggesting a key role at this growth stage. In agreement with previous reports, our results suggest that CaTCPs in pepper have multiple roles at various stages of growth and development.
3.3. The Essential Role of TCPs in Shoot Branching
TCPs have been proven to play crucial roles in shoot branching, which is an important aspect of plant growth and development, influencing plant height, photosynthesis efficiency, and the transport of organic matter [38]. Previous extensive reports have highlighted the significance of the TCP gene family in regulating cell growth and proliferation in lateral branches. Specifically, members of the CYC/TB1 subclass can suppress the growth of lateral buds. For instance, in maize, cultivars that overexpress tb1, which belongs to the CYC/TB1 subclass, are given priority in artificial selection due to their contribution to the formation of strong apical dominance [5]. Similarly, the silencing of SlBRC1, a member of the CYC/TB1 subclass, leads to a decrease in apical dominance, dwarfing, and increased lateral branching. However, axillary buds located in the stem of tomato plants exhibit high expression levels of SlBRC1, resulting in the inhibition of outgrowth [49]. Peppers and tomatoes have similar branching patterns, such as sympodial growth and cymose inflorescences. CYC/TB1 members may have similar functions that inhibit shoot branching in pepper. Notably, CaTCP6 and CaTCP8, which are homologous to SlBRC1 and belong to the CYC/TB1 subclass, display high expression levels in lateral branches, and may play a crucial role in the establishment of apical dominance.
3.4. miRNA Participating in the Gene-Regulatory Mechanisms of Stress Response
MicroRNAs (miRNAs) are a diverse class of non-coding, single-stranded regulatory RNAs, typically consisting of 20–24 nucleotides [50,51,52]. These miRNAs play a key role in regulating gene expression by binding to complementary regions of target mRNAs [53]. Recent studies have validated that miRNAs control diverse cellular functions, including responses to various stresses and the regulation of growth processes in pepper plants [35,54]. In the current research, we predicted thirty-seven miRNAs targeting nineteen CaTCPs. These mRNA might be crucial players in the regulation of growth and stress response. Previous research supports this conclusion [18,24,55,56]. For instance, TCP4 in Arabidopsis was targeted by miR319, contributing to the regulation of the cotyledon boundary and leaf serration formation and accelerating plant maturation [57,58]. Arabidopsis mutants lacking miR319 have a prolonged juvenile stage, indicating that miR319 plays a key role in the vegetative phase change [59]. These studies show that miRNAs play diverse roles in growth processes and responses to various abiotic stresses by regulating the expression pattern of targeted CaTCPs.
4. Materials and Methods
4.1. Identification and Characterization Analysis of the TCP Genes in Pepper
This study utilized the genome data of the pepper cultivar CM334. The genome sequences of Capsicum annuum, Arabidopsis thaliana, Oryza sativa, Solanum tuberosum, and Solanum lycopersicum were downloaded from Phytozome (https://phytozome-next.jgi.doe.gov/, accessed on 12 January 2022). Published TCP protein sequences, including 24 AtTCPs, 22 OsTCPs, 31 StTCPs, and 30 SlTCPs, were adopted to construct a local protein database with blast-2.5.0 using default parameters. Putative CaTCPs were determined using BLASTP against the local databases with default parameters. The Hidden Markov Model (HMM) file (PF03634) of the TCP domain was downloaded from the Pfam protein domain database (http://pfam.xfam.org/, accessed on 12 January 2022) to further verify the putative CaTCPs. HMMER 3.1 (http://www.hmmer.org/, accessed on 12 January 2022) was used to search CaTCPs with the e-value set to 1 × 10⁻⁵. Finally, 27 CaTCPs were the outcome of both BLASTP and HMMER. The subcellular localization of TCP proteins in the pepper was predicted via the WoLF PSORT server (https://wolfpsort.hgc.jp/, accessed on 12 January 2022).
4.2. Phylogenetics and Synteny Analysis of CaTCP Proteins
TCP protein sequences in Arabidopsis, rice, tomato, potato, and pepper were adopted to study the phylogenetic relationship. Initially, the software tool Mega X (https://megasoftware.net/home, accessed on 12 January 2022) was used to perform sequence alignments. Subsequently, we plotted the phylogenetic tree using the Neighbor-Joining (NJ) method with 1000 bootstrap replicates. Finally, the iTol (https://itol.embl.de/, accessed on 12 January 2022) website service was used to further display the tree. We used MCScanX (https://github.com/wyp1125/MCScanX, accessed on 12 January 2022) to explore the synteny relationships of TCP genes in Arabidopsis, tomato, potato, and pepper. Additionally, Ka/Ks values for all TCP gene pairs were calculated using TBtools [60].
4.3. Gene Structure and Conserved Motif Analysis
The pepper genome annotation file was downloaded from Phytozome. The structures of the CaTCPs genes were plotted using TBtools. The conserved motifs in CaTCP proteins were identified using Multiple Em for Motif Elucidation (MEME, https://meme-suite.org/, accessed on 12 January 2022) software using the following parameters: the motif width range was 6 to 13 and the maximum number of motifs was 20 [36].
4.4. Cis-Elements Analysis in CaTCP Promoters
We extracted 2000 bp of sequence upstream of the start codon of the CaTCPs as the promoter to explore the cis-acting binding elements. The cis-acting elements were predicted by matching sequences in the promoter with binding sites in the PlantCARE (http://bioinformatics.psb.ugent.be/webtools/plantcare/html/, accessed on 12 January 2022) database. Finally, the figure was plotted through TBtools v2.052 software.
4.5. Prediction of Putative miRNA Targeting CaTCPs and GO Annotation Analysis
The coding sequences of the 27 CaTCPs were used to search possible target miRNAs with the help of psRNATarget (https://bio.tools/psrnatarget#!, accessed on 12 January 2022). The uploaded miRNA sequences were previously reported [35]. We used Cytoscape software (V3.8.2; https://cytoscape.org/download.html, accessed on 12 January 2022) to display the interaction relationship between the targeted and related miRNAs. GO annotation analysis was performed with the help of the eggnog website (http://eggnog-mapper.embl.de/, accessed on 12 January 2022) and TBtools.
4.6. Transcriptomic Data Analysis of the CaTCPs in Diverse Tissues, Abiotic, and Hormone Conditions
The RNA-seq data (BioProject ID: PRJNA223222) include samples from the root, stem, leaf, placenta, and pericarp at various time points: 1 day, 2 days, 3 days, mature green (MG), breaker (B), 5 days post breaker, and 10 days post breaker in Capsicum annuum L. The breaker stage in fruit typically refers to the stage when the fruit begins to lose its green color and starts to show signs of ripening [32]. The analysis was performed using the CM334 reference genome. The raw sequence reads (BioProject ID: PRJNA525913) of CM334 under different conditions, including cold, man, NaCl, heat, and mock, were obtained from the NCBI. For the data, at the 6-true-leaf stage, the plants were exposed to temperatures of 10 °C and 40 °C to simulate cold and heat stress, respectively. For salinity stress, plants were subjected to treatment with 50 mL of a 400 mM NaCl solution; for osmotic stress, 50 mL of 400 mM mannitol was administered to the peppers. Additionally, the sequence data (PRJNA634831) of CM334 under treatments of abscisic acid (ABA), methyl jasmonate (MeJA), salicylic acid (SA), and ethylene (ET) were also downloaded from the NCBI. For the data, at the 6-true-leaf stage, pepper plants were sprayed with the following solutions on the underside of leaves: 5 mM sodium salicylate (SA), 100 μM methyl jasmonate (JA), 5 mM ethephon (ET), 100 μM (±)-ABA, or distilled water (mock). The Fragments Per Kilobase of the exon model per Million mapped reads (FPKM) were calculated through Hisat2 (v2.0.5) and Sringtie (v2.1.7) software. Fold-change was calculated. The expression levels were visualized using the R package pheatmap, based on log10 values.
4.7. RNA Isolation and Quantitative RT-PCR
Pepper plants (cultivar CM334) were grown in a walk-in greenhouse under 16 h light/8 h dark conditions at 25–28 °C. After six weeks, flower buds, lateral buds, stem leaves, and lateral leaves were collected from three different pepper plants for qRT-PCR. These tissue samples were frozen in liquid nitrogen and stored at −80 °C. RNA was extracted using a TIANGENTM RNA plant kit. cDNA was synthesized using an RNA Reverse Transcription Kit from Vazyme. The qRT-PCR was performed on the ABI 7500 real-time PCR system with SYBR-green dye from Vazyme. CaUBI3 was an internal reference gene [33]. The 2−ΔΔCT method was used to calculate the relative expression level. Primers for qRT-PCR are listed in Table S12.
4.8. Prediction of Protein–Protein Interaction Network of CaTCPs
The 27 CaTCP proteins were submitted to the string website (https://string-db.org/, accessed on 12 January 2022) to predict the protein–protein interaction network of CaTCPs.
4.9. 3D Structure Prediction, Validation, and Visualization of CaTCP Proteins
We used the AlphaFold2 website (https://alphafold.ebi.ac.uk/, accessed on 12 January 2022) to predict the 3D structures of the CaTCP proteins. The quality of the putative models was checked using the structural analysis and verification server (SAVES) (http://services.mbi.ucla.edu/SAVES, accessed on 12 January 2022). The SOPMA (http://npsa-pbil.ibcp.fr/cgi-bin/npsa_automat.pl?page=npsa_sopma.html, accessed on 12 January 2022) website was used to analyze the secondary structure of the chosen models. Finally, we used PyMol to visualize the 3D structures of the proteins [37].
5. Conclusions
This study identified 27 TCPs in the pepper genome for the first time. These CaTCP members were unevenly distributed on 12 chromosomes. Genome-wide analysis was performed to gain further insights into CaTCPs in pepper, including CaTCPs’ identification, gene phylogeny, sequence alignment, motif analysis, cis-element detection, miRNA prediction, GO enrichment analysis, the interaction network of CaTCPs proteins, and 3D structure prediction. Furthermore, the expression patterns of CaTCPs in different abiotic stresses and organs revealed their potential involvement in multiple key biological processes. In summary, the findings of this study make a significant contribution to the field by providing an important starting point for future investigations into the functions of CaTCPs. Specifically, further study of these genes can offer valuable insights into the growth and development of flowers, leaves, and shooting branches. Furthermore, these findings have important implications for developing effective pepper breeding strategies.
Supplementary Materials
The following supporting information can be downloaded at https://www.mdpi.com/article/10.3390/plants13050641/s1. Figure S1: Relative expression levels of 27 CaTCPs in stem leaf (SL), branch leaf (BL), flower bud (FB), and lateral bud (LB). (A) The expression levels of Class I CaTCPs, (B) subclass CYC/TB1 belonging to Class II, and (C) subclass CIN belonging to Class II. The value is the mean of three replicates. SD is represented using error bars. Raw data are recorded in Table S8. The 2−ΔΔCT method was used to calculate the relative expression level. Figure S2: Predicted protein–protein interaction network of CaTCP proteins. Different data sources are marked by various line colors. The String website was used to predict the protein–protein interaction network. Figure S3: Predicted three-dimensional models of CaTCP proteins, and α-helices, β-sheets, and random coils are marked by cyan, red, and brown, respectively. (A) The predicted three-dimensional model of PCF subclass members. (B) The predicted three-dimensional model of CYC/TB1 subclass members. (C) The predicted three-dimensional model of CIN subclass members. The AlphaFold2 website was used to predict the three-dimensional structure of CaTCP proteins. Table S1: TCPs in the pepper. The number designation of the TCP genes is based on their order of chromosome location. Blastp and HMMER were used to search CaTCPs with the e-value set to 1 × 10⁻⁵. Table S2: The protein sequences of TCP family genes in Arabidopsis thaliana, Oryza sativa, Solanum tuberosum, and Solanum lycopersicum. The sequences were downloaded from the published peppers. Table S3: The information of gene duplication type; Ka/Ks values of Capsicum annuum, Arabidopsis thaliana, Oryza sativa, Solanum tuberosum, and Solanum lycopersicum. MCScanX was used to infer the gene duplication types. Ka/Ks for the gene pairs was calculated using TBtools. Table S4: The information of 20 identified motifs in CaTCP proteins. Multiple Em for Motif Elucidation (MEME) software was used to infer conserved motifs; the parameters of MEME were as follows: the motif width ranged from 6 to 13, and the maximum number of motifs was 20. The first column is the predicted motif name, the second column is the regular expression of the predicted motif, and the third column and the fourth column represent the length and e-value of the motif, respectively. Table S5: Distribution information of motifs detected in the CaTCPs. The information was extracted based on the results generated by MEME; yes: the motif is present within this gene, “-”: the motif is not present within this gene. Table S6: Information of predicted miRNA targeting CaTCPs and statistical analysis of binding sites between miRNA and each CaTCP member. The miRNA sequences were downloaded from the published pepper, and the coding sequences (CDS) were used to search possible target miRNAs with the help of psRNATarget. Table S7: The GO enrichment analysis of CaTCPs. GO annotation analysis was performed with the help of the eggnog website. Table S8: The raw data of qRT-PCR. The value in this sheet is the mean of the relative expression of three samples. We calculated the standard deviation for each value. Table S9: Information of hormone-related, stress-related cis-elements and distribution information in the CaTCP. The cis-acting elements were predicted through matching sequences between the promoter and the PlantCARE. Table S10: Information of predicted protein interaction network. The String website was used to predict the protein–protein interaction network. Table S11: Stability and secondary structure percentage of CaTCP protein models. SOPMA website was used to analyze the secondary structure of the chosen models. Table S12: Primers for qRT-PCR. These primers were designed using primer-blast in NCBI.
Author Contributions
Conceptualization, F.G., Z.L. and Z.Z.; methodology, L.W., Y.H. (Yan Hu) and X.G.; software, Z.D., Y.H. (Yupeng Hao) and Y.Z.; validation, W.T., X.W. and J.L.; writing—original draft preparation, Z.D.; writing—review and editing, F.G., Z.L. and Z.Z.; visualization, Z.D.; supervision, F.G., Z.L. and Z.Z. All authors have read and agreed to the published version of the manuscript.
Funding
This study was financially supported in part by grants from the Project of Sanya Yazhou Bay Science and Technology City (No: SCKJ-JYRC-2022-25 and SCKJ-JYRC-2022-05), Project of Central Public-interest Scientific Institution Basal Research Fund (NO: 1630032022009), Hainan Provincial Natural Science Foundation of China (No: 322MS132), and Sanya City Science and Technology Innovation Initiative (0202-6602-C22304).
Data Availability Statement
The original contributions presented in the study are included in the article/Supplementary Material, further inquiries can be directed to the corresponding author.
Conflicts of Interest
The authors declare no conflicts of interest.
References
- Hoang, X.L.T.; Nhi, D.N.H.; Thu, N.B.A.; Thao, N.P.; Tran, L.P. Transcription factors and their roles in signal transduction in plants under abiotic stresses. Curr. Genom. 2017, 18, 483–497. [Google Scholar] [CrossRef] [PubMed]
- Kosugi, S.; Ohashi, Y. DNA binding and dimerization specificity and potential targets for the TCP protein family. Plant J. 2002, 30, 337–348. [Google Scholar] [CrossRef]
- Adryan, B.; Teichmann, S.A. The developmental expression dynamics of Drosophila melanogaster transcription factors. Genome Biol. 2010, 11, R40. [Google Scholar] [CrossRef] [PubMed]
- Jiang, Y.; Zeng, B.; Zhao, H.; Zhang, M.; Xie, S.; Lai, J. Genome-wide transcription factor gene prediction and their expressional tissue-specificities in maize. J. Integr. Plant Biol. 2012, 54, 616–630. [Google Scholar] [CrossRef]
- Doebley, J.; Stec, A.; Hubbard, L. The evolution of apical dominance in maize. Nature 1997, 386, 485–488. [Google Scholar] [CrossRef] [PubMed]
- Luo, D.; Carpenter, R.; Vincent, C.; Copsey, L.; Coen, E. Origin of floral asymmetry in Antirrhinum. Nature 1996, 383, 794–799. [Google Scholar] [CrossRef] [PubMed]
- Cubas, P.; Lauter, N.; Doebley, J.; Coen, E. The TCP domain: A motif found in proteins regulating plant growth and development. Plant J. 1999, 18, 215–222. [Google Scholar] [CrossRef]
- Kosugi, S.; Ohashi, Y. PCF1 and PCF2 specifically bind to cis elements in the rice proliferating cell nuclear antigen gene. Plant Cell 1997, 9, 1607–1619. [Google Scholar]
- Navaud, O.; Dabos, P.; Carnus, E.; Tremousaygue, D.; Herve, C. TCP transcription factors predate the emergence of land plants. J. Mol. Evol. 2007, 65, 23–33. [Google Scholar] [CrossRef]
- Viola, I.L.; Reinheimer, R.; Ripoll, R.; Manassero, N.G.U.; Gonzalez, D.H. Determinants of the DNA binding specificity of class I and class II TCP transcription factors. J. Biol. Chem. 2012, 287, 347–356. [Google Scholar] [CrossRef]
- Martin-Trillo, M.; Cubas, P. TCP genes: A family snapshot ten years later. Trends Plant Sci. 2010, 15, 31–39. [Google Scholar] [CrossRef] [PubMed]
- Howarth, D.G.; Donoghue, M.J. Phylogenetic analysis of the “ECE” (CYC/TB1) clade reveals duplications predating the core eudicots. Proc. Natl. Acad. Sci. USA 2006, 103, 9101–9106. [Google Scholar] [CrossRef] [PubMed]
- Crawford, B.C.; Nath, U.; Carpenter, R.; Coen, E.S. CINCINNATA controls both cell differentiation and growth in petal lobes and leaves of Antirrhinum. Plant Physiol. 2004, 135, 244–253. [Google Scholar] [CrossRef] [PubMed]
- Tatematsu, K.; Nakabayashi, K.; Kamiya, Y.; Nambara, E. Transcription factor AtTCP14 regulates embryonic growth potential during seed germination in Arabidopsis thaliana. Plant J. 2008, 53, 42–52. [Google Scholar] [CrossRef] [PubMed]
- Braun, N.; de Saint Germain, A.; Pillot, J.P.; Boutet-Mercey, S.; Dalmais, M.; Antoniadi, I.; Li, X.; Maia-Grondard, A.; Le Signor, C.; Bouteiller, N.; et al. The pea TCP transcription factor PsBRC1 acts downstream of Strigolactones to control shoot branching. Plant Physiol. 2012, 158, 225–238. [Google Scholar] [CrossRef] [PubMed]
- Li, D.; Zhang, H.; Mou, M.; Chen, Y.; Xiang, S.; Chen, L.; Yu, D. Arabidopsis Class II TCP transcription factors integrate with the FT-FD Module to control flowering. Plant Physiol. 2019, 181, 97–111. [Google Scholar] [CrossRef] [PubMed]
- Kieffer, M.; Master, V.; Waites, R.; Davies, B. TCP14 and TCP15 affect internode length and leaf shape in Arabidopsis. Plant J. 2011, 68, 147–158. [Google Scholar] [CrossRef]
- Palatnik, J.F.; Allen, E.; Wu, X.; Schommer, C.; Schwab, R.; Carrington, J.C.; Weigel, D. Control of leaf morphogenesis by microRNAs. Nature 2003, 425, 257–263. [Google Scholar] [CrossRef]
- Danisman, S.; van Dijk, A.D.; Bimbo, A.; van der Wal, F.; Hennig, L.; de Folter, S.; Angenent, G.C.; Immink, R.G. Analysis of functional redundancies within the Arabidopsis TCP transcription factor family. J. Exp. Bot. 2013, 64, 5673–5685. [Google Scholar] [CrossRef]
- Zhou, M.; Li, D.; Li, Z.; Hu, Q.; Yang, C.; Zhu, L.; Luo, H. Constitutive expression of a miR319 gene alters plant development and enhances salt and drought tolerance in transgenic creeping bentgrass. Plant Physiol. 2013, 161, 1375–1391. [Google Scholar] [CrossRef]
- Lucero, L.E.; Uberti-Manassero, N.G.; Arce, A.L.; Colombatti, F.; Alemano, S.G.; Gonzalez, D.H. TCP15 modulates cytokinin and auxin responses during gynoecium development in Arabidopsis. Plant J. 2015, 84, 267–282. [Google Scholar] [CrossRef]
- Nicolas, M.; Cubas, P. TCP factors: New kids on the signaling block. Curr. Opin. Plant Biol. 2016, 33, 33–41. [Google Scholar] [CrossRef] [PubMed]
- Mukhopadhyay, P.; Tyagi, A.K. OsTCP19 influences developmental and abiotic stress signaling by modulating ABI4-mediated pathways. Sci. Rep. 2015, 5, 9998. [Google Scholar] [CrossRef] [PubMed]
- Wang, S.T.; Sun, X.L.; Hoshino, Y.; Yu, Y.; Jia, B.; Sun, Z.W.; Sun, M.Z.; Duan, X.B.; Zhu, Y.M. MicroRNA319 positively regulates cold tolerance by targeting OsPCF6 and OsTCP21 in rice (Oryza sativa L.). PLoS ONE 2014, 9, e91357. [Google Scholar] [CrossRef] [PubMed]
- Yin, Z.; Li, Y.; Zhu, W.; Fu, X.; Han, X.; Wang, J.; Lin, H.; Ye, W. Identification, characterization, and expression patterns of TCP genes and microRNA319 in cotton. Int. J. Mol. Sci. 2018, 19, 3655. [Google Scholar] [CrossRef] [PubMed]
- Leng, X.; Wei, H.; Xu, X.; Ghuge, S.A.; Jia, D.; Liu, G.; Wang, Y.; Yuan, Y. Genome-wide identification and transcript analysis of TCP transcription factors in grapevine. BMC Genom. 2019, 20, 786. [Google Scholar] [CrossRef] [PubMed]
- Lei, N.; Yu, X.; Li, S.; Zeng, C.; Zou, L.; Liao, W.; Peng, M. Phylogeny and expression pattern analysis of TCP transcription factors in cassava seedlings exposed to cold and/or drought stress. Sci. Rep. 2017, 7, 10016. [Google Scholar] [CrossRef]
- Yao, X.; Ma, H.; Wang, J.; Zhang, D.B. Genome-wide comparative analysis and expression pattern of TCP gene families in Arabidopsis thaliana and Oryza sativa. J. Integr. Plant Biol. 2007, 49, 885–897. [Google Scholar] [CrossRef]
- Ma, J.; Wang, Q.; Sun, R.; Xie, F.; Jones, D.C.; Zhang, B. Genome-wide identification and expression analysis of TCP transcription factors in Gossypium raimondii. Sci. Rep. 2014, 4, 6645. [Google Scholar] [CrossRef]
- Parapunova, V.; Busscher, M.; Busscher-Lange, J.; Lammers, M.; Karlova, R.; Bovy, A.G.; Angenent, G.C.; de Maagd, R.A. Identification, cloning and characterization of the tomato TCP transcription factor family. BMC Plant Biol. 2014, 14, 157. [Google Scholar] [CrossRef]
- Wang, Y.; Zhang, N.; Li, T.; Yang, J.; Zhu, X.; Fang, C.; Li, S.; Si, H. Genome-wide identification and expression analysis of StTCP transcription factors of potato (Solanum tuberosum L.). Comput. Biol. Chem. 2019, 78, 53–63. [Google Scholar] [CrossRef] [PubMed]
- Kim, S.; Park, M.; Yeom, S.I.; Kim, Y.M.; Lee, J.M.; Lee, H.A.; Seo, E.; Choi, J.; Cheong, K.; Kim, K.T.; et al. Genome sequence of the hot pepper provides insights into the evolution of pungency in Capsicum species. Nat. Genet. 2014, 46, 270–278. [Google Scholar] [CrossRef] [PubMed]
- Ali, M.; Luo, D.X.; Khan, A.; Haq, S.U.; Gai, W.X.; Zhang, H.X.; Cheng, G.X.; Muhammad, I.; Gong, Z.H. Classification and genome-wide analysis of Chitin-Binding Proteins gene family in pepper (Capsicum annuum L.) and transcriptional regulation to phytophthora capsici, abiotic stresses and hormonal applications. Int. J. Mol. Sci. 2018, 19, 2216. [Google Scholar] [CrossRef] [PubMed]
- Diao, W.; Snyder, J.C.; Wang, S.; Liu, J.; Pan, B.; Guo, G.; Ge, W.; Dawood, M. Genome-wide analyses of the NAC transcription factor gene family in pepper (Capsicum annuum L.): Chromosome location, phylogeny, structure, expression patterns, cis-elements in the promoter, and interaction network. Int. J. Mol. Sci. 2018, 19, 1028. [Google Scholar] [CrossRef] [PubMed]
- Qin, C.; Yu, C.; Shen, Y.; Fang, X.; Chen, L.; Min, J.; Cheng, J.; Zhao, S.; Xu, M.; Luo, Y.; et al. Whole-genome sequencing of cultivated and wild peppers provides insights into Capsicum domestication and specialization. Proc. Natl. Acad. Sci. USA 2014, 111, 5135–5140. [Google Scholar] [CrossRef] [PubMed]
- Bailey, T.L.; Johnson, J.; Grant, C.E.; Noble, W.S. The MEME Suite. Nucleic Acids Res. 2015, 43, W39–W49. [Google Scholar] [CrossRef] [PubMed]
- Seeliger, D.; de Groot, B.L. Ligand docking and binding site analysis with PyMOL and Autodock/Vina. J. Comput. Aided Mol. Des. 2010, 24, 417–422. [Google Scholar] [CrossRef] [PubMed]
- Aguilar-Martinez, J.A.; Poza-Carrion, C.; Cubas, P. Arabidopsis BRANCHED1 acts as an integrator of branching signals within axillary buds. Plant Cell 2007, 19, 458–472. [Google Scholar] [CrossRef]
- Nicolas, M.; Torres-Perez, R.; Wahl, V.; Cruz-Oro, E.; Rodriguez-Buey, M.L.; Zamarreno, A.M.; Martin-Jouve, B.; Garcia-Mina, J.M.; Oliveros, J.C.; Prat, S.; et al. Spatial control of potato tuberization by the TCP transcription factor BRANCHED1b. Nat. Plants 2022, 8, 281–294. [Google Scholar] [CrossRef]
- Liu, M.M.; Wang, M.M.; Yang, J.; Wen, J.; Guo, P.C.; Wu, Y.W.; Ke, Y.Z.; Li, P.F.; Li, J.N.; Du, H. Evolutionary and comparative expression analyses of TCP transcription factor gene family in land plants. Int. J. Mol. Sci. 2019, 20, 3591. [Google Scholar] [CrossRef]
- Cusack, B.P.; Wolfe, K.H. Not born equal: Increased rate asymmetry in relocated and retrotransposed rodent gene duplicates. Mol. Biol. Evol. 2007, 24, 679–686. [Google Scholar] [CrossRef] [PubMed]
- Freeling, M. Bias in plant gene content following different sorts of duplication: Tandem, whole-genome, segmental, or by transposition. Annu. Rev. Plant Biol. 2009, 60, 433–453. [Google Scholar] [CrossRef] [PubMed]
- Tomato Genome, C. The tomato genome sequence provides insights into fleshy fruit evolution. Nature 2012, 485, 635–641. [Google Scholar] [CrossRef] [PubMed]
- Wang, Y.; Wang, X.; Paterson, A.H. Genome and gene duplications and gene expression divergence: A view from plants. Ann. N. Y. Acad. Sci. 2012, 1256, 1–14. [Google Scholar] [CrossRef] [PubMed]
- Jeifetz, D.; David-Schwartz, R.; Borovsky, Y.; Paran, I. CaBLIND regulates axillary meristem initiation and transition to flowering in pepper. Planta 2011, 234, 1227–1236. [Google Scholar] [CrossRef] [PubMed]
- Chen, L.; Chen, Y.Q.; Ding, A.M.; Chen, H.; Xia, F.; Wang, W.F.; Sun, Y.H. Genome-wide analysis of TCP family in tobacco. Genet. Mol. Res. 2016, 15, 10–4238. [Google Scholar] [CrossRef] [PubMed]
- Liu, Y.; Guan, X.; Liu, S.; Yang, M.; Ren, J.; Guo, M.; Huang, Z.; Zhang, Y. Genome-wide identification and analysis of TCP transcription factors involved in the formation of leafy head in Chinese cabbage. Int. J. Mol. Sci. 2018, 19, 847. [Google Scholar] [CrossRef]
- Liu, Z.; Yang, J.; Li, S.; Liu, L.; Qanmber, G.; Chen, G.; Duan, Z.; Zhao, N.; Wang, G. Systematic characterization of TCP gene family in four cotton species revealed that GhTCP62 regulates branching in Arabidopsis. Biology 2021, 10, 1104. [Google Scholar] [CrossRef]
- Martin-Trillo, M.; Grandio, E.G.; Serra, F.; Marcel, F.; Rodriguez-Buey, M.L.; Schmitz, G.; Theres, K.; Bendahmane, A.; Dopazo, H.; Cubas, P. Role of tomato BRANCHED1-like genes in the control of shoot branching. Plant J. 2011, 67, 701–714. [Google Scholar] [CrossRef]
- Jones-Rhoades, M.W.; Bartel, D.P.; Bartel, B. MicroRNAS and their regulatory roles in plants. Annu. Rev. Plant Biol. 2006, 57, 19–53. [Google Scholar] [CrossRef]
- Kozomara, A.; Griffiths-Jones, S. miRBase: Annotating high confidence microRNAs using deep sequencing data. Nucleic Acids Res. 2014, 42, D68–D73. [Google Scholar] [CrossRef] [PubMed]
- Shriram, V.; Kumar, V.; Devarumath, R.M.; Khare, T.S.; Wani, S.H. MicroRNAs as potential targets for abiotic stress tolerance in plants. Front. Plant Sci. 2016, 7, 817. [Google Scholar] [CrossRef] [PubMed]
- Michlewski, G.; Caceres, J.F. Post-transcriptional control of miRNA biogenesis. RNA 2019, 25, 1–16. [Google Scholar] [CrossRef] [PubMed]
- Hwang, D.G.; Park, J.H.; Lim, J.Y.; Kim, D.; Choi, Y.; Kim, S.; Reeves, G.; Yeom, S.I.; Lee, J.S.; Park, M.; et al. The hot pepper (Capsicum annuum) microRNA transcriptome reveals novel and conserved targets: A foundation for understanding MicroRNA functional roles in hot pepper. PLoS ONE 2013, 8, e64238. [Google Scholar] [CrossRef] [PubMed]
- Lee, Y.S.; Lee, D.Y.; Cho, L.H.; An, G. Rice miR172 induces flowering by suppressing OsIDS1 and SNB, two AP2 genes that negatively regulate expression of Ehd1 and florigens. Rice 2014, 7, 31. [Google Scholar] [CrossRef] [PubMed]
- Huo, H.; Wei, S.; Bradford, K.J. DELAY OF GERMINATION1 (DOG1) regulates both seed dormancy and flowering time through microRNA pathways. Proc. Natl. Acad. Sci. USA 2016, 113, E2199–E2206. [Google Scholar] [CrossRef] [PubMed]
- Sarvepalli, K.; Nath, U. Hyper-activation of the TCP4 transcription factor in Arabidopsis thaliana accelerates multiple aspects of plant maturation. Plant J. 2011, 67, 595–607. [Google Scholar] [CrossRef] [PubMed]
- Koyama, T.; Sato, F.; Ohme-Takagi, M. Roles of miR319 and TCP transcription factors in leaf development. Plant Physiol. 2017, 175, 874–885. [Google Scholar] [CrossRef]
- Guo, C.; Xu, Y.; Shi, M.; Lai, Y.; Wu, X.; Wang, H.; Zhu, Z.; Poethig, R.S.; Wu, G. Repression of miR156 by miR159 regulates the timing of the juvenile-to-adult transition in Arabidopsis. Plant Cell 2017, 29, 1293–1304. [Google Scholar] [CrossRef]
- Chen, C.; Chen, H.; Zhang, Y.; Thomas, H.R.; Frank, M.H.; He, Y.; Xia, R. TBtools: An integrative toolkit developed for interactive analyses of big biological data. Mol. Plant. 2020, 13, 1194–1202. [Google Scholar] [CrossRef]


Disclaimer/Publisher’s Note: The statements, opinions and data contained in all publications are solely those of the individual author(s) and contributor(s) and not of MDPI and/or the editor(s). MDPI and/or the editor(s) disclaim responsibility for any injury to people or property resulting from any ideas, methods, instructions or products referred to in the content. |
© 2024 by the authors. Licensee MDPI, Basel, Switzerland. This article is an open access article distributed under the terms and conditions of the Creative Commons Attribution (CC BY) license (https://creativecommons.org/licenses/by/4.0/).