
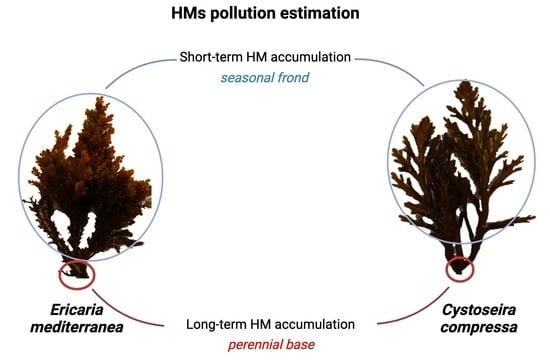
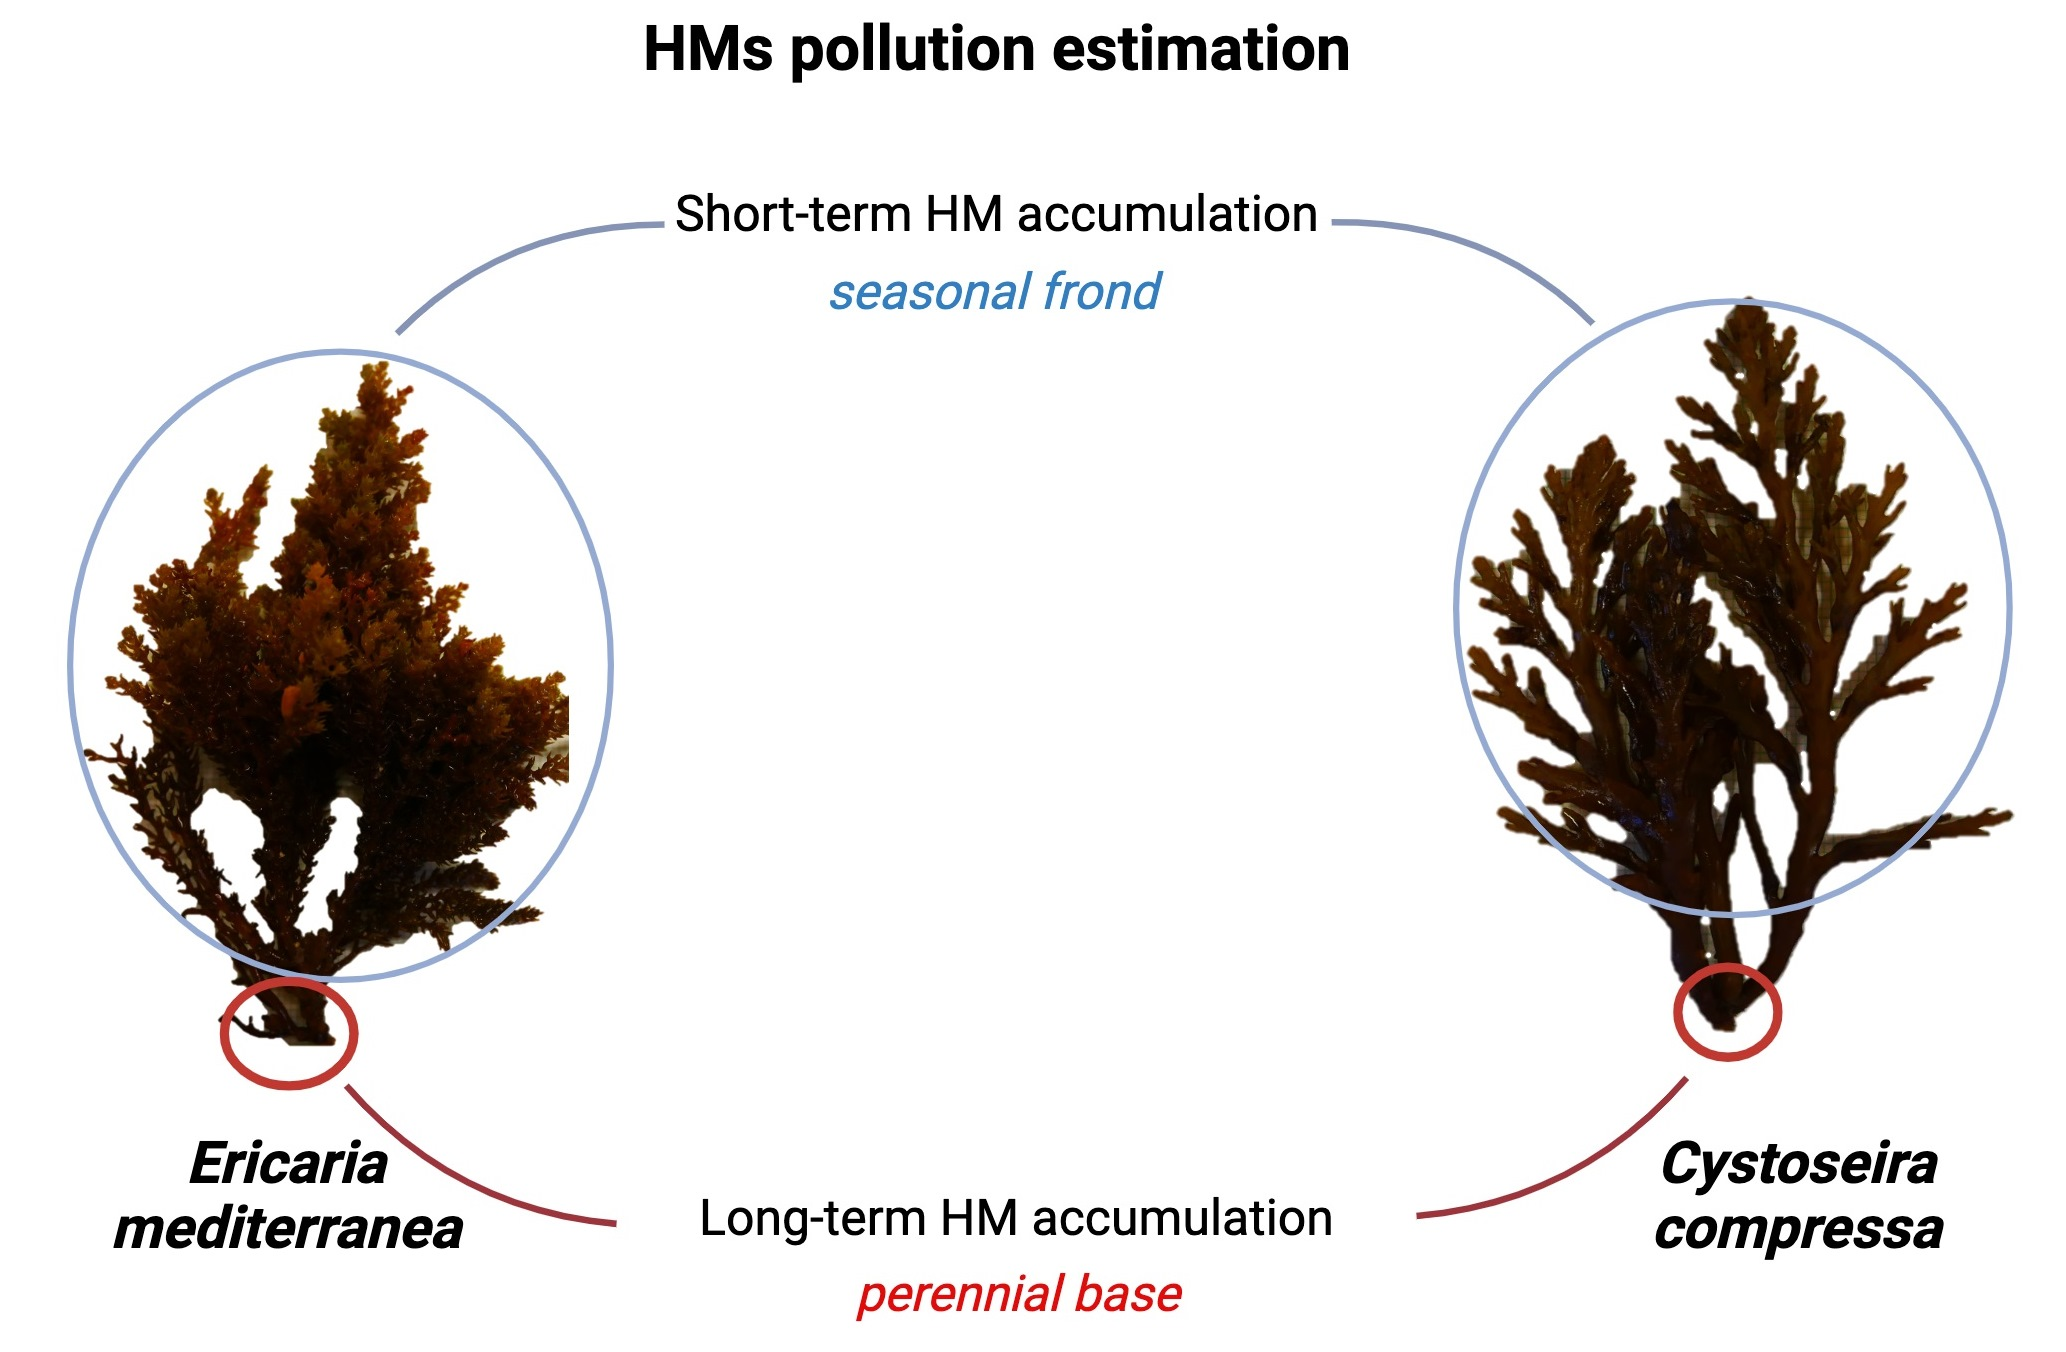
Cystoseira compressa and Ericaria mediterranea: Effective Bioindicators for Heavy- and Semi-Metal Monitoring in Marine Environments with Rocky Substrates

 ,
,  ,
,  , ,
, ,  and
and
Abstract
1. Introduction
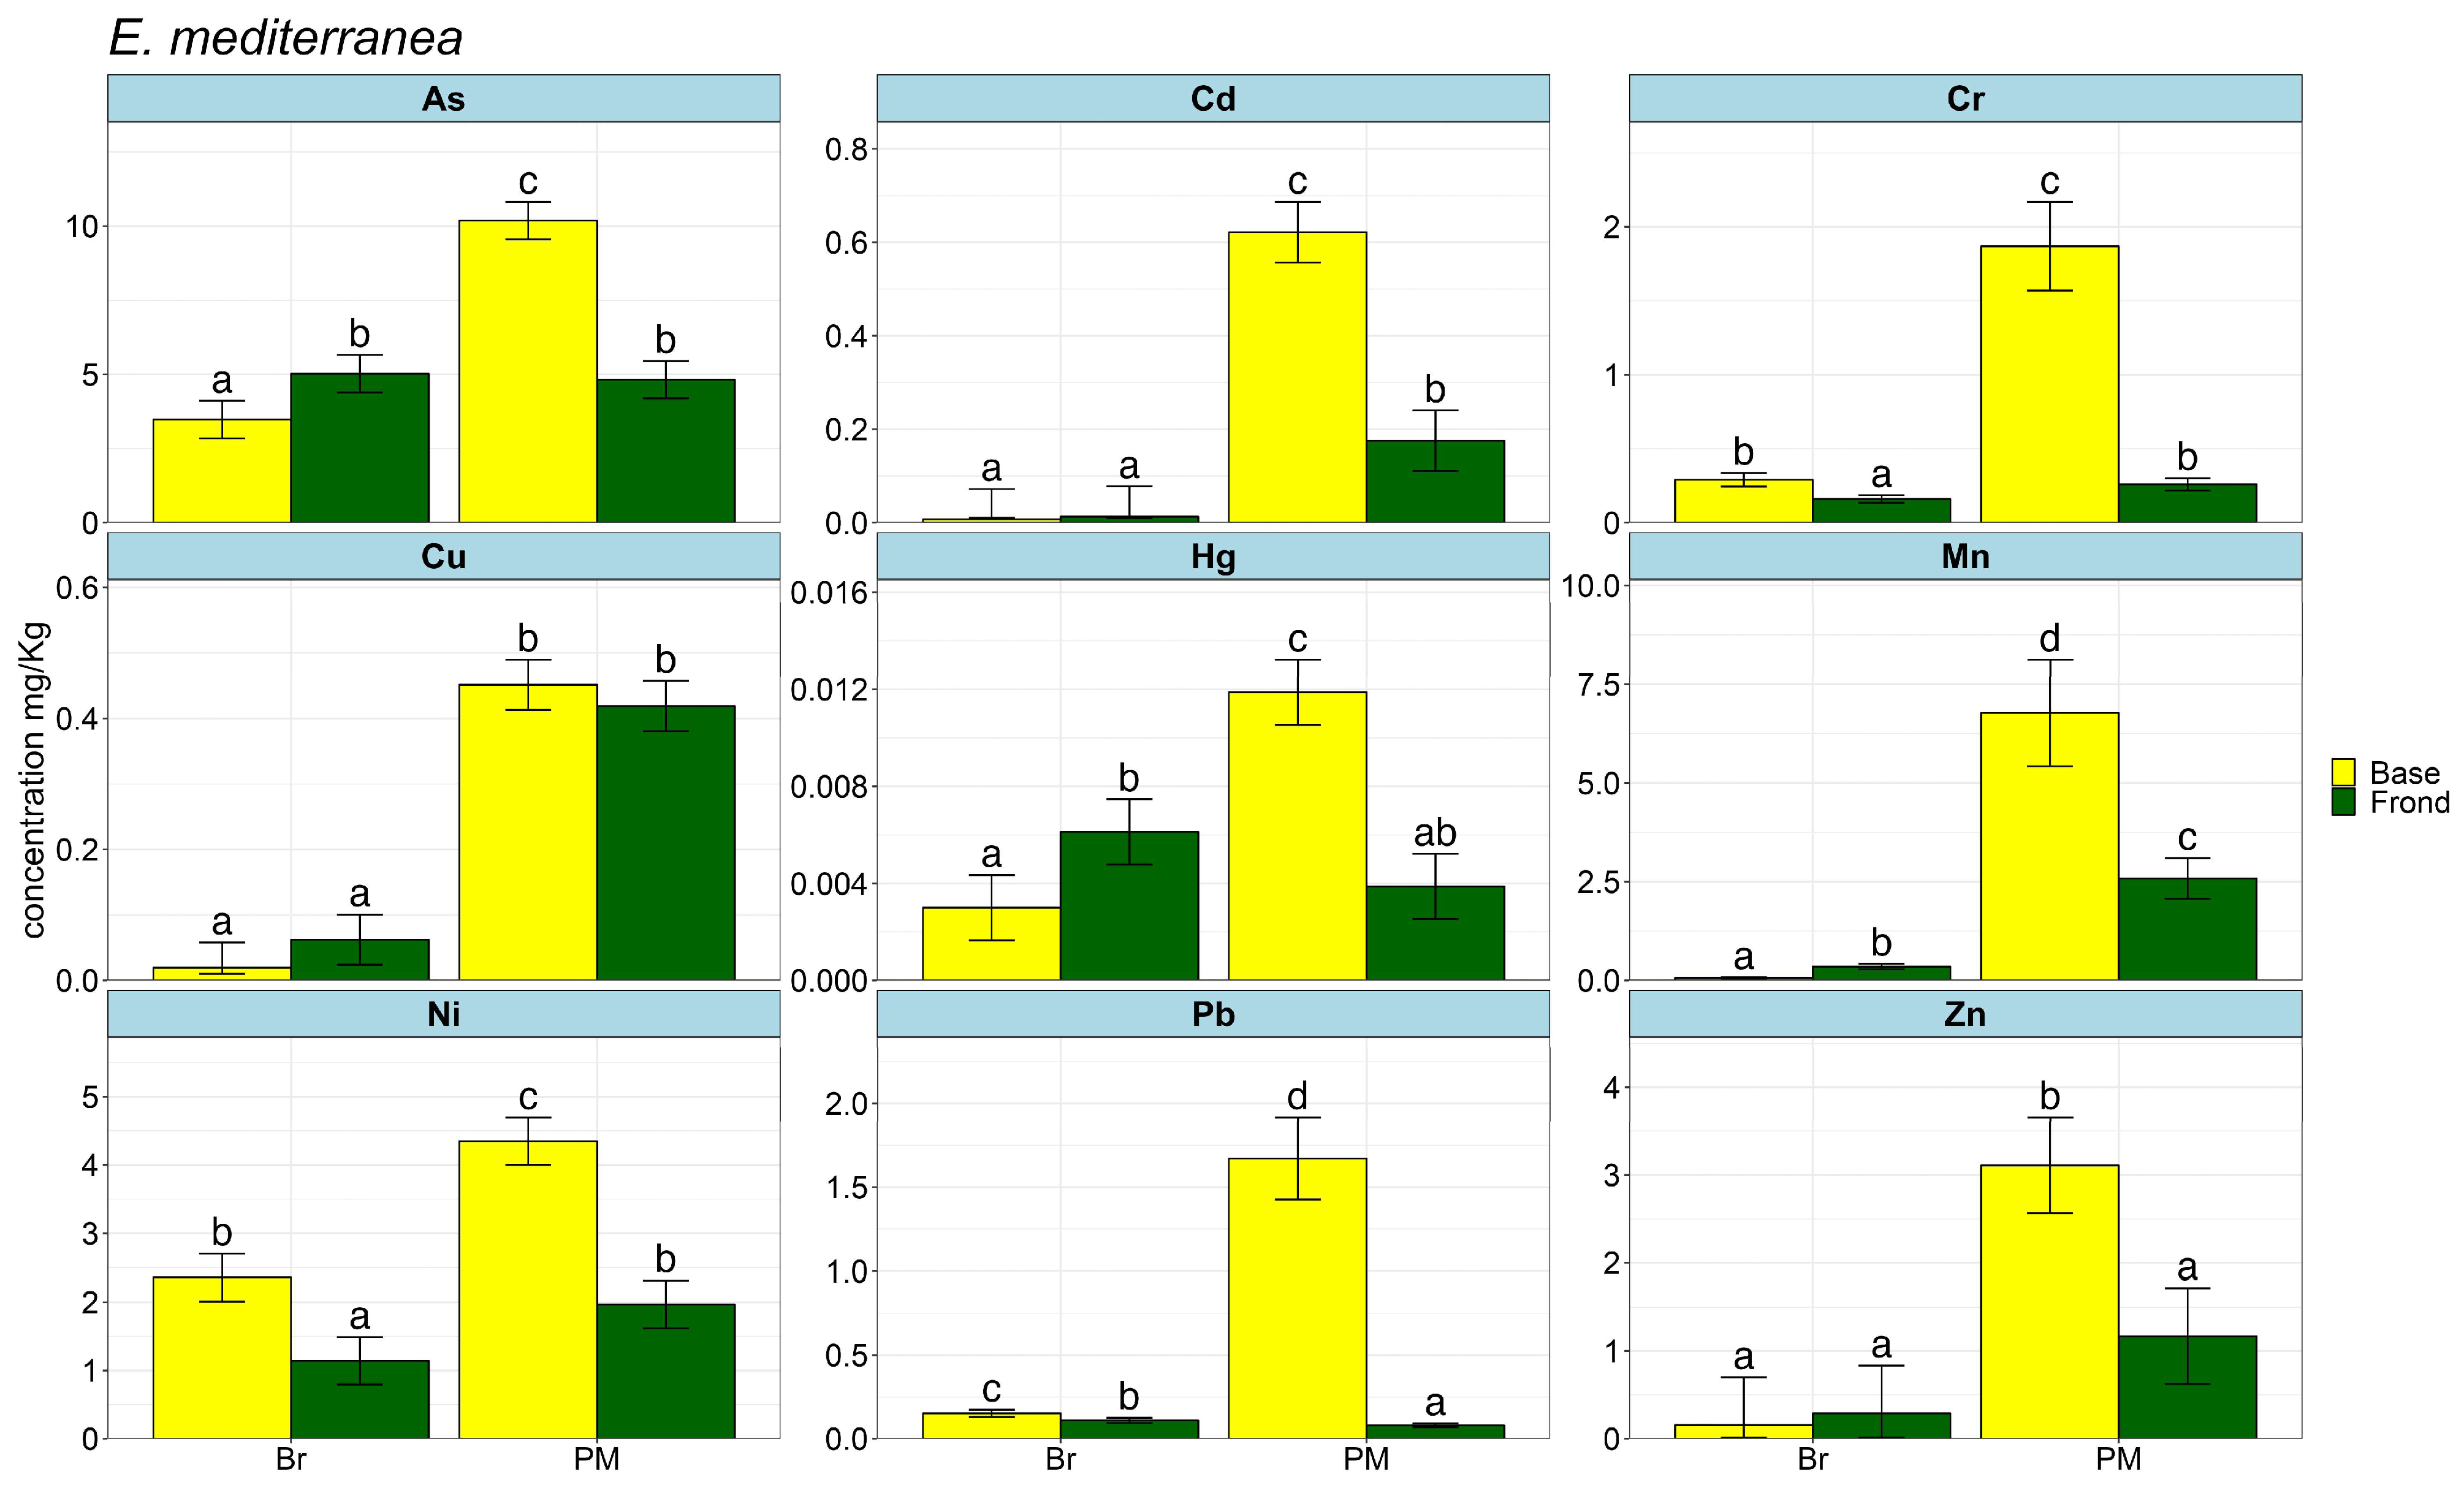
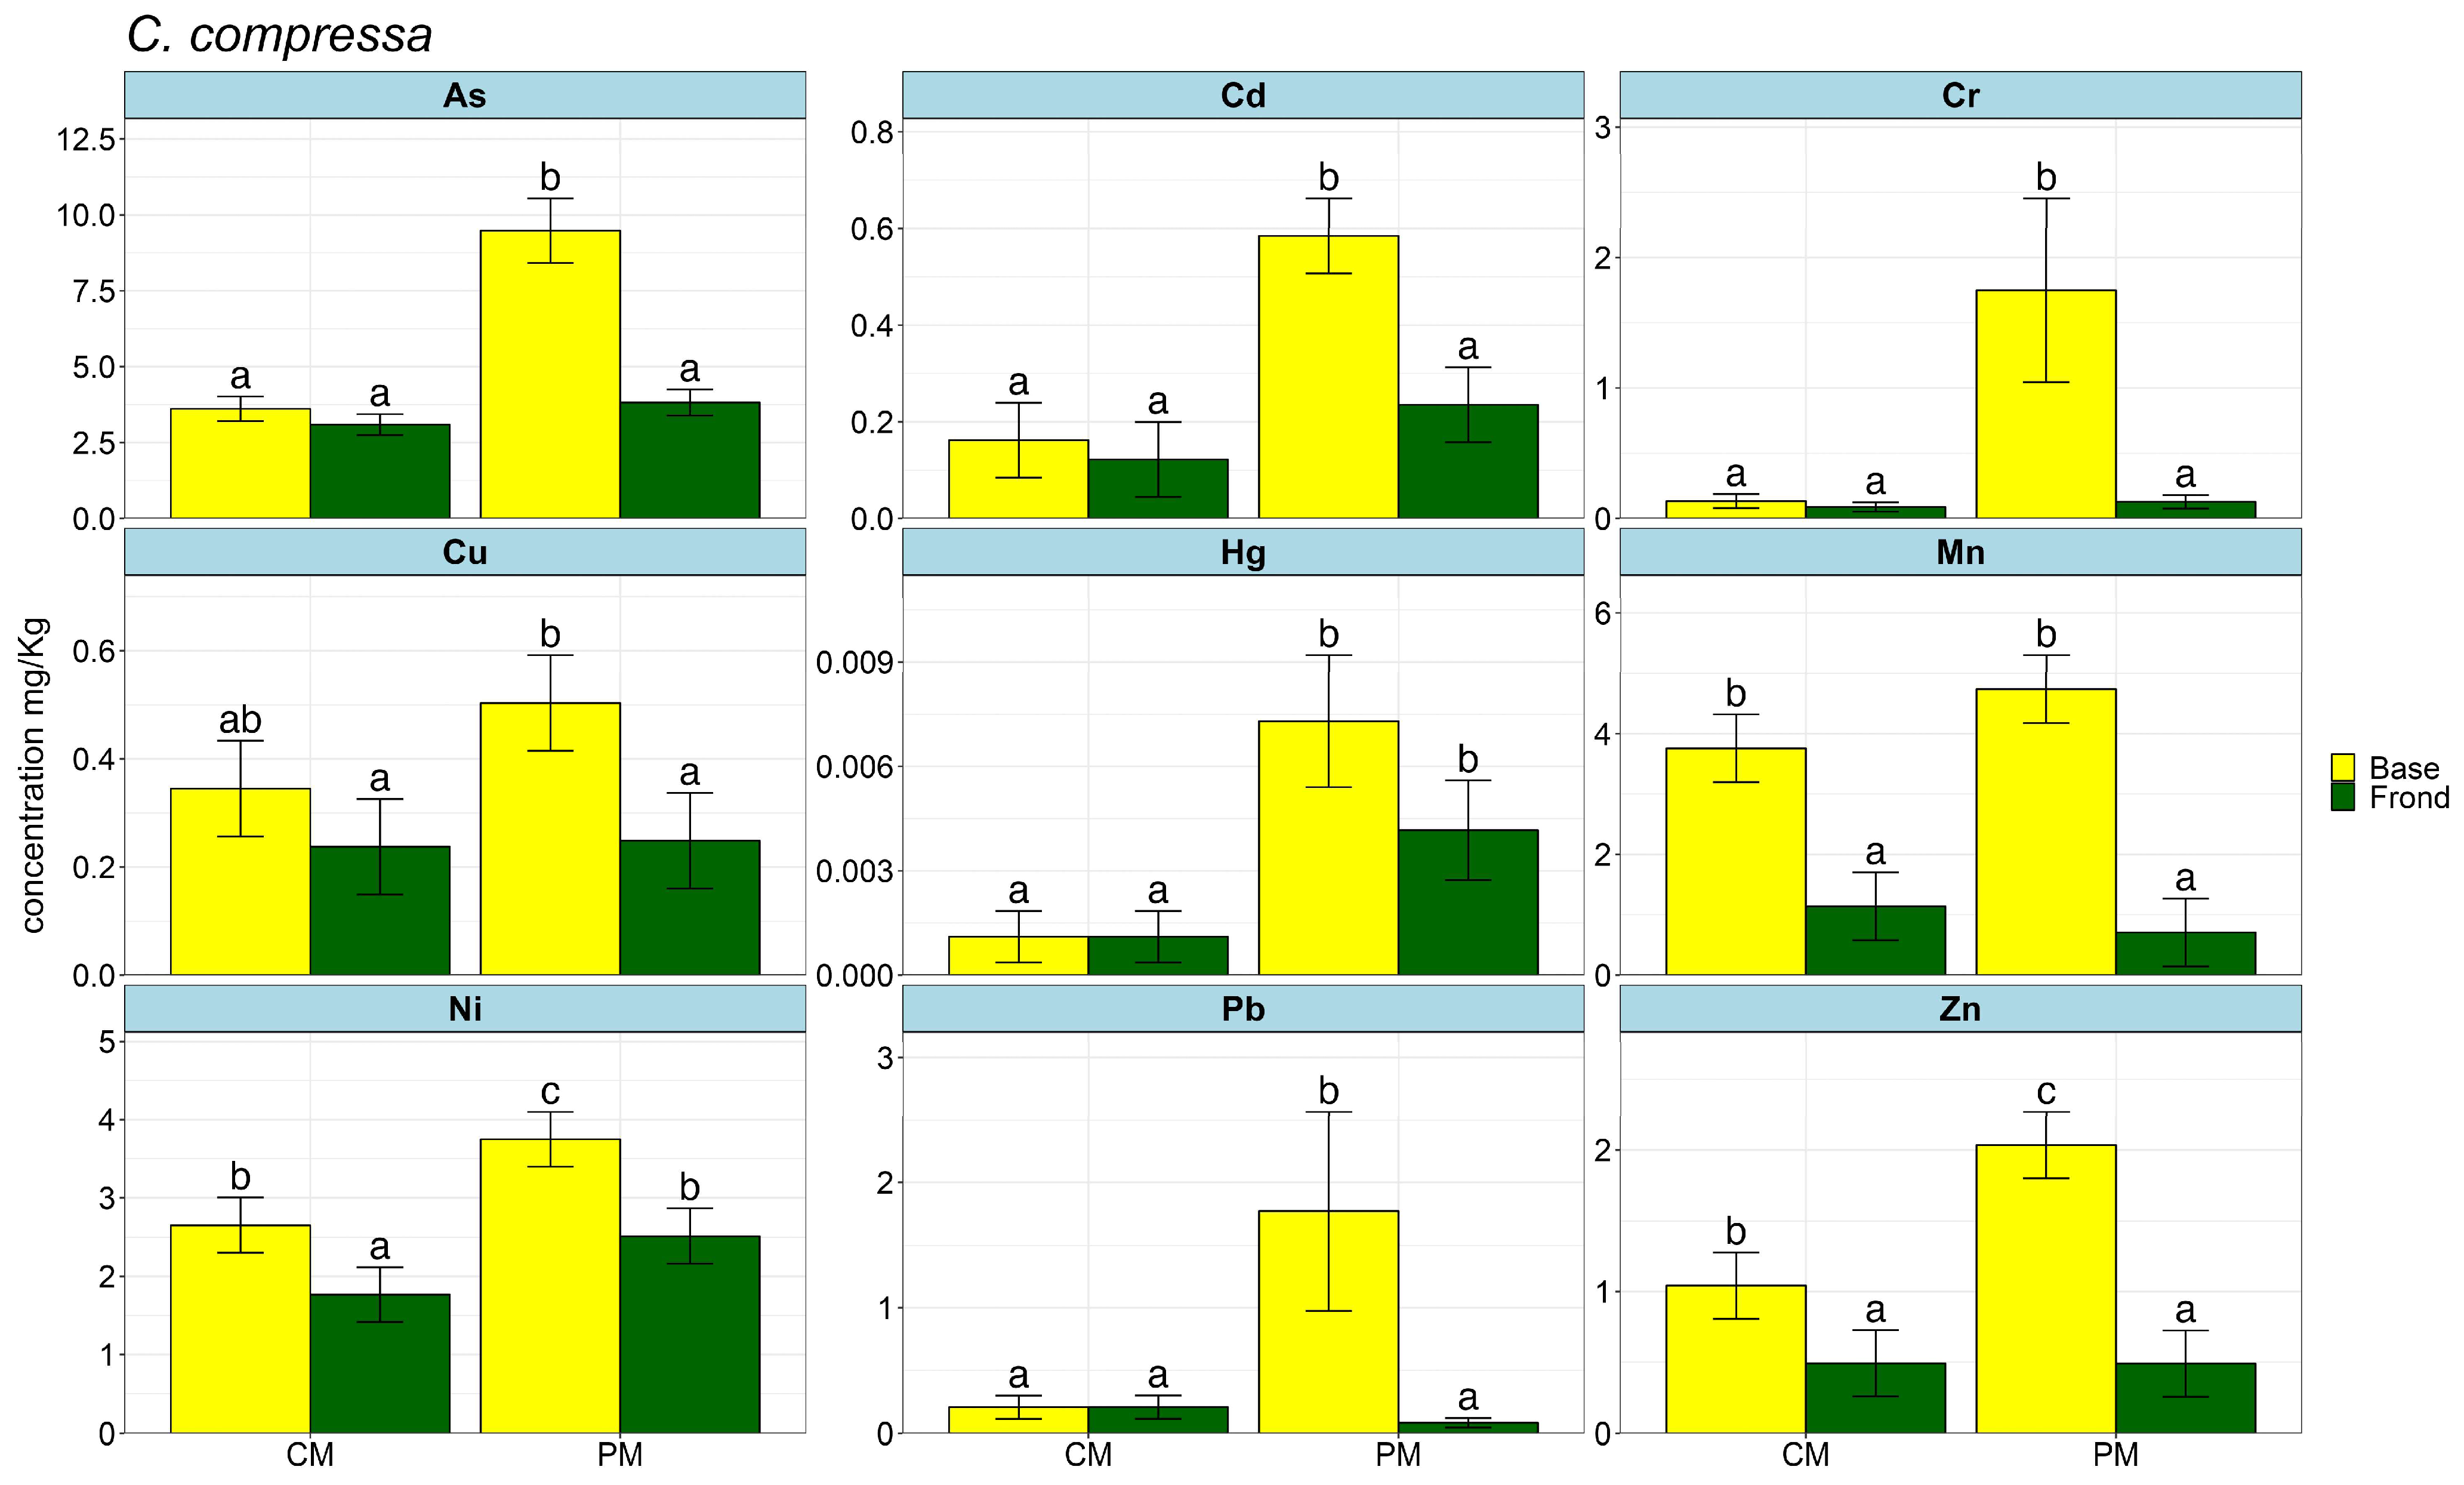
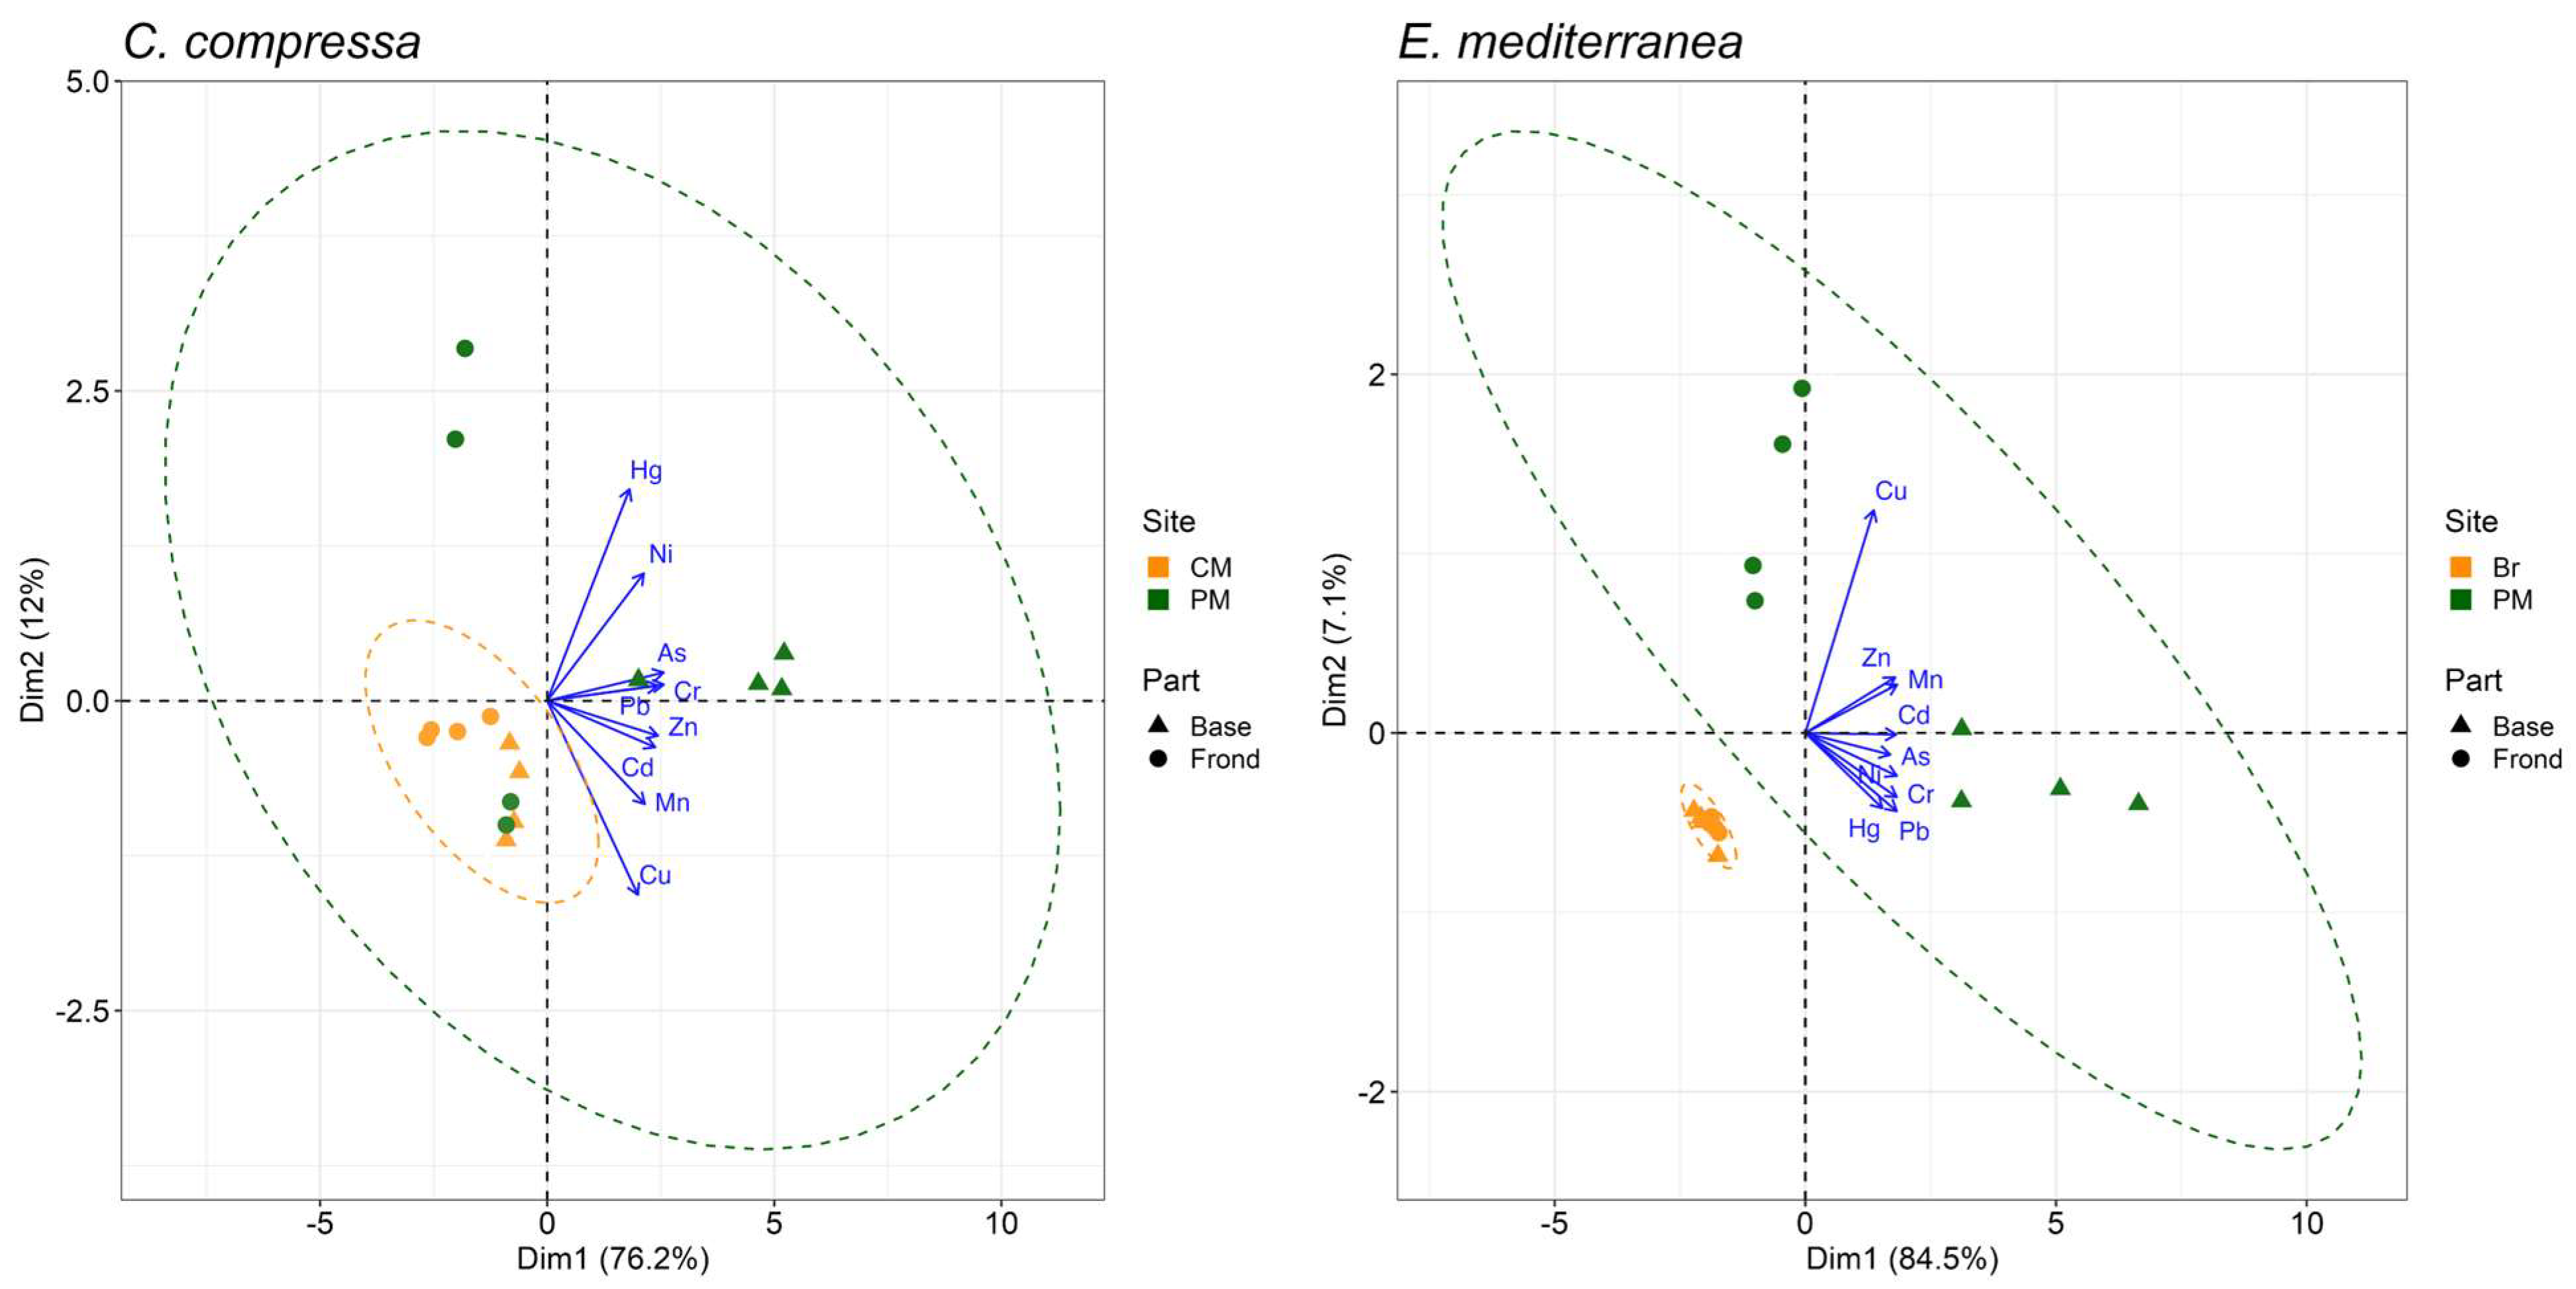
2. Results
3. Discussions
4. Materials and Methods
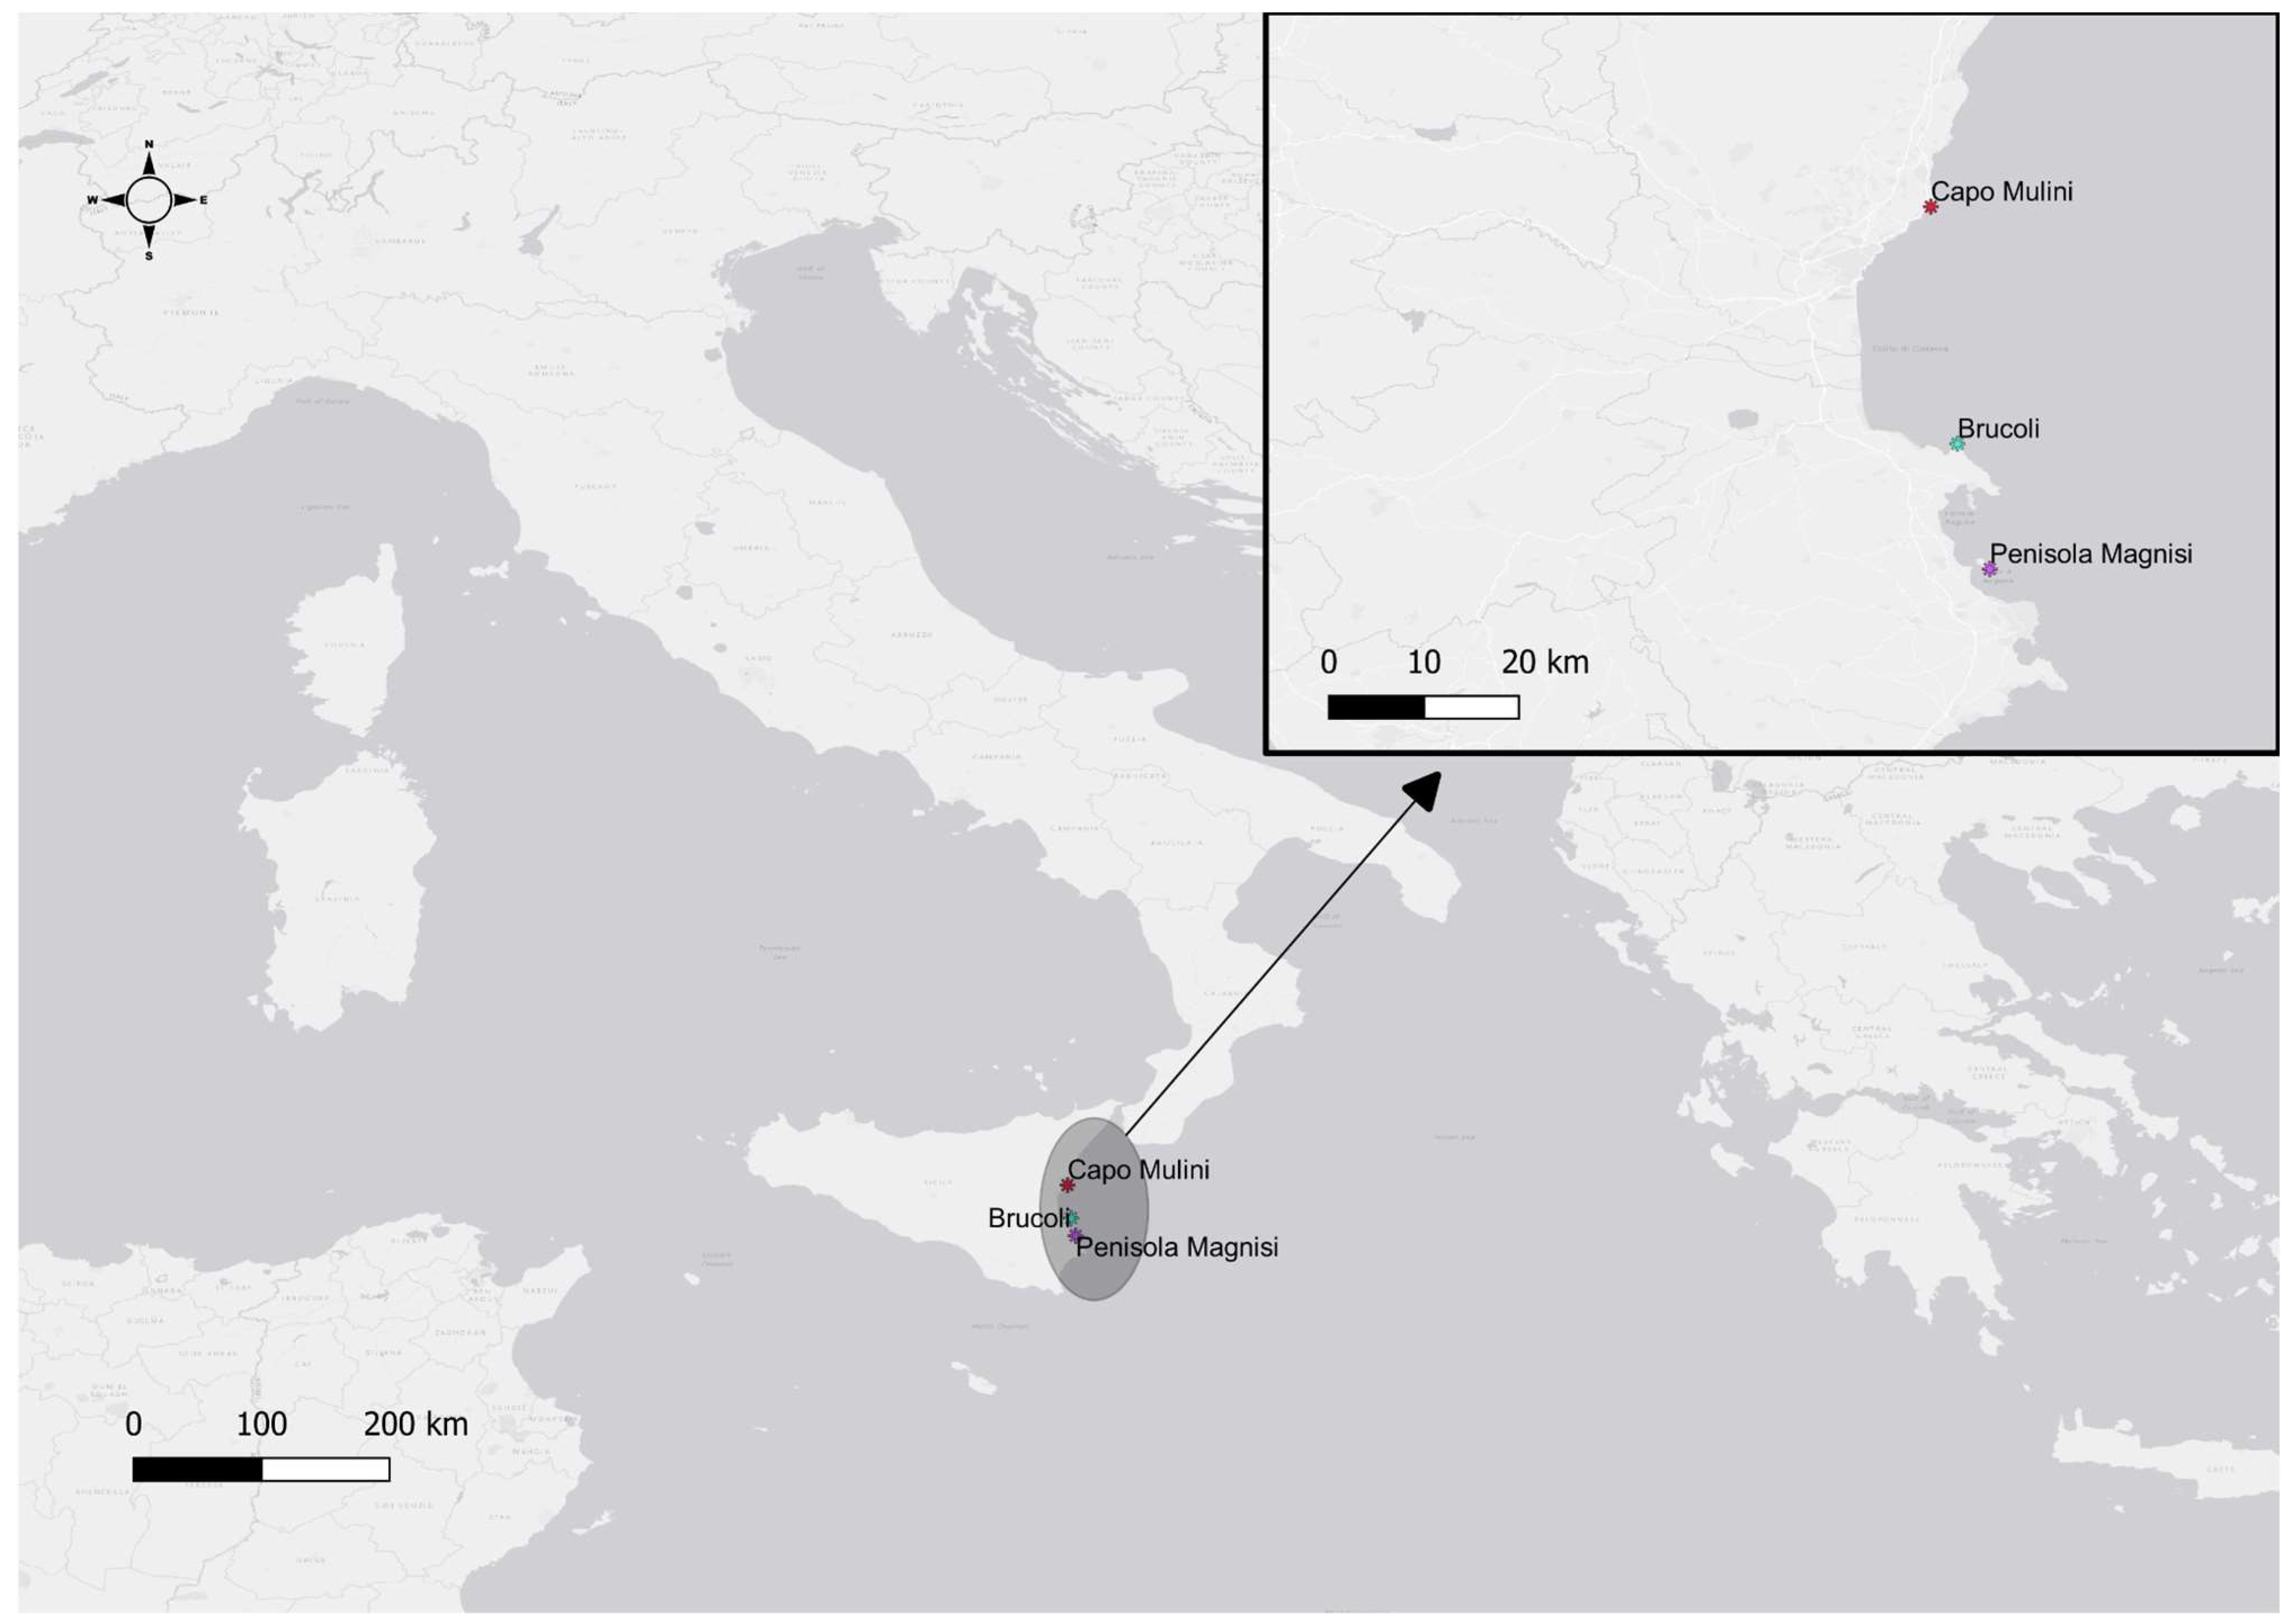
4.1. Study Area
4.2. Experimental Design
4.3. Chemicals and Standard Solutions
4.4. Samples Preparation
4.4.1. Seawater
4.4.2. Algae
4.5. Analysis by ICP-MS
4.6. Hg Analysis
4.7. Validation Parameters
4.8. Data Analysis
Supplementary Materials
Author Contributions
Funding
Data Availability Statement
Acknowledgments
Conflicts of Interest
References
- Chibuike, G.U.; Obiora, S.C. Heavy metal polluted soils: Effect on plants and bioremediation methods. Appl. Environ. Soil Sci. 2014, 2014, 752708. [Google Scholar] [CrossRef]
- Lalegerie, F.; Gager, L.; Stiger-Pouvreau, V.; Connan, S. The Stressful Life of Red and Brown Seaweeds on the Temperate Intertidal Zone: Effect of Abiotic and Biotic Parameters on the Physiology of Macroalgae and Content Variability of Particular Metabolites. Adv. Bot. Res. 2020, 95, 247–287. [Google Scholar] [CrossRef]
- Leonardi, C.; Toscano, V.; Genovese, C.; Mosselmans, J.F.W.; Ngwenya, B.T.; Raccuia, S.A. Evaluation of cadmium and arsenic effects on wild and cultivated cardoon genotypes selected for metal phytoremediation and bioenergy purposes. Environ. Sci. Pollut. Res. 2021, 28, 55102–55115. [Google Scholar] [CrossRef]
- Tarras-Wahlberg, N.H.; Flachier, A.; Lane, S.N.; Sangfors, O. Environmental Impacts and Metal Exposure of Aquatic Ecosystems in Rivers Contaminated by Small Scale Gold Mining: The Puyango River Basin, Southern Ecuador. Sci. Total Environ. 2001, 278, 239–261. [Google Scholar] [CrossRef]
- Ridgway, J.; Breward, N.; Langston, W.J.; Lister, R.; Rees, J.G.; Rowlatt, S.M. Distinguishing between Natural and Anthropogenic Sources of Metals Entering the Irish Sea. Appl. Geochem. 2003, 18, 283–309. [Google Scholar] [CrossRef]
- Karadede, H.; Oymak, S.A.; Ünlü, E. Heavy Metals in Mullet, Liza Abu, and Catfish, Silurus Triostegus, from the Atatürk Dam Lake (Euphrates), Turkey. Environ. Int. 2004, 30, 183–188. [Google Scholar] [CrossRef]
- Harms, U. The Levels of Heavy Metals (Mn, Fe, Co, Ni, Cu, Zn, Cd, Pb, Hg) in Fish from Onshore and Offshore Waters of the German Bight. Z. Leb. Forsch. 1975, 157, 125–132. [Google Scholar] [CrossRef]
- Freedman, B. The Impacts of Pollution and other Stresses on Ecosystem Structure and Function. Environmental Ecology; Academic press: London, UK, 1989. [Google Scholar]
- Güven, K.; Özbay, C.; Ünlü, E.; Satar, A. Acute Lethal Toxicity and Accumulation of Copper in Gammarus pulex (L.) (Amphipoda). Turk. J. Biol. 1999, 23, 513–521. [Google Scholar]
- Reichelt-Brushett, A. Risk Assessment and Ecotoxicology Limitations and Recommendations for Ocean Disposal of Mine Waste in the Coral Triangle. Oceanography 2012, 25, 40–51. [Google Scholar] [CrossRef]
- Regmi, P.; Garcia Moscoso, J.L.; Kumar, S.; Cao, X.; Mao, J.; Schafran, G. Removal of Copper and Cadmium from Aqueous Solution Using Switchgrass Biochar Produced via Hydrothermal Carbonization Process. J. Environ. Manag. 2012, 109, 61–69. [Google Scholar] [CrossRef] [PubMed]
- Mohan, D.; Kumar, H.; Sarswat, A.; Alexandre-Franco, M.; Pittman, C.U. Cadmium and Lead Remediation Using Magnetic Oak Wood and Oak Bark Fast Pyrolysis Bio-Chars. Chem. Eng. J. 2014, 236, 513–528. [Google Scholar] [CrossRef]
- Ryabushko, V.I.; Prazukin, A.V.; Gureeva, E.V.; Bobko, N.I.; Kovrigina, N.G.; Nekhoroshev, M.V. Fucoxanthin and Heavy Metals in Brown Algae of Genus Cystoseira c. Agardh from Water Areas with Different Anthropogenic Influences (Black Sea). Mar. Biol. J. 2017, 2, 70–79. [Google Scholar] [CrossRef]
- Benfares, R.; Seridi, H.; Belkacem, Y.; Inal, A. Heavy Metal Bioaccumulation in Brown Algae Cystoseira Compressa in Algerian Coasts, Mediterranean Sea. Environ. Processes 2015, 2, 429–439. [Google Scholar] [CrossRef]
- Rainbow, P.S. Biomonitoring of Heavy Metal Availability in the Marine Environment. Mar. Pollut. Bull. 1995, 31, 183–192. [Google Scholar] [CrossRef]
- Chiarelli, R.; Roccheri, M.C. Marine Invertebrates as Bioindicators of Heavy Metal Pollution. Open J. Met. 2014, 4, 93–106. [Google Scholar] [CrossRef]
- Zalewska, T.; Danowska, B. Marine environment status assessment based on macrophytobenthic plants as bio-indicators of heavy metals pollution. Mar. Pollut. Bull. 2017, 118, 281–288. [Google Scholar] [CrossRef] [PubMed]
- Khristoforova, N.K.; Kobzar, A.D. Brown Algae as Indicators of Water Pollution by Heavy Metals in the Rudnaya Bay(Japan Sea). Izv. Tikhookeanskogo Nauchno-Issledovatel’skogo Rybokhozyajstvennogo Tsentra 2012, 168. [Google Scholar]
- Almela, C.; Algora, S.; Benito, V.; Clemente, M.J.; Devesa, V.; Súñer, M.A.; Vélez, D.; Montoro, R. Heavy metal, total arsenic, and inorganic arsenic contents of algae food products. J. Agric. Food Chem. 2002, 50, 918–923. [Google Scholar] [CrossRef]
- Caliceti, M.; Argese, E.; Sfriso, A.; Pavoni, B. Heavy metal contamination in the seaweeds of the Venice lagoon. Chemosphere 2002, 47, 443–454. [Google Scholar] [CrossRef]
- Kravtsova, A.; Milchakova, N.; Frontasyeva, M. Elemental accumulation in the black sea brown algae Cystoseira studied by neutron activation analysis. Ecol. Chem. Eng. S 2014, 21, 9–23. [Google Scholar] [CrossRef]
- MSFD, M.S.F.D. Establishing a framework for community action in the field of environmental policy. Dir. 2008/56/EC Eur. Parliam. Counc. 17 June 2008. Available online: https://eur-lex.europa.eu/legal-content/en/ALL/?uri=CELEX%3A32008L0056 (accessed on 5 January 2024).
- Arıcı, E.; Bat, L.; Yıldız, G. Comparison of metal uptake capacities of the brown algae Cystoseira barbata and Cystoseira crinita (Phaeophyceae) collected in Sinop, Turkey. Pak. J. Mar. Sci. 2019, 28, 5–17. [Google Scholar]
- Pellegrini, M.; Laugier, A.; Sergent, M.; Phan-Tan-Luu, R.; Valls, R.; Pellegrini, L. Interactions between the toxicity of the heavy metals cadmium, copper, zinc in combinations and the detoxifying role of calcium in the brown alga Cystoseira barbata. J. Appl. Phycol. 1993, 5, 351–361. [Google Scholar] [CrossRef]
- Sales, M.; Cebrian, E.; Tomas, F.; Ballesteros, E. Pollution impacts and recovery potential in three species of the genus Cystoseira (Fucales, Heterokontophyta). Estuar. Coast. Shelf Sci. 2011, 92, 347–357. [Google Scholar] [CrossRef]
- Boundir, Y.; Hasni, M.; Rafik, F.; Sabri, H.; Bahammou, N.; Cheggour, M.; Achtak, H.; Cherifi, O. First study of the ecological status in the atlantic coast of morocco using the brown seaweed cystoseira tamariscifolia. Appl. Ecol. Environ. Res. 2019, 17, 14315–14331. [Google Scholar] [CrossRef]
- de Caralt, S.; Verdura, J.; Vergés, A.; Ballesteros, E.; Cebrian, E. Differential effects of pollution on adult and recruits of a canopy-forming alga: Implications for population viability under low pollutant levels. Sci. Rep. 2020, 10, 17825. [Google Scholar] [CrossRef]
- Kut, D.; Topcuoğlu, S.; Esen, N.; Küçükcezzar, R.; Güven, K.C. Trace metals in marine algae and sediment samples from the bosphorus. Water. Air. Soil Pollut. 2000, 118, 27–33. [Google Scholar] [CrossRef]
- Al-Masri, M.S.; Mamish, S.; Budier, Y. Radionuclides and trace metals in eastern Mediterranean Sea algae. J. Environ. Radioact. 2003, 67, 157–168. [Google Scholar] [CrossRef]
- Schintu, M.; Marras, B.; Durante, L.; Meloni, P.; Contu, A. Macroalgae and DGT as indicators of available trace metals in marine coastal waters near a lead-zinc smelter. Environ. Monit. Assess. 2010, 167, 653–661. [Google Scholar] [CrossRef]
- Akcali, I.; Kucuksezgin, F. A biomonitoring study: Heavy metals in macroalgae from eastern Aegean coastal areas. Mar. Pollut. Bull. 2011, 62, 637–645. [Google Scholar] [CrossRef]
- Guiry, M.D.; Guiry, G.M. AlgaeBase. World-Wide Electronic Publication; National University of Ireland: Galway, UK, 2023; Available online: http://www.algaebase.org (accessed on 1 December 2023).
- US Environmental Protection Agency. National Recommended Water Quality Criteria—Aquatic Life Criteria Table; US Environmental Protection Agency: Washington, DC, USA, 2021. Available online: https://www.epa.gov/wqc/national-recommended-water-quality-criteria-aquatic-life-criteria-table (accessed on 5 January 2024).
- EU Directive 2013/39/EU of the European Parliament and of the Council of 12 August 2013 amending Directives 2000/60/ECand 2008/105/EC as regards priority substances in the field of water policy. Off. J. Eur. Union 2013, 226, 1–17. Available online: https://eur-lex.europa.eu/legal-content/en/ALL/?uri=CELEX%3A32013L0039 (accessed on 5 January 2024).
- Taylor, V.F.; Jackson, B.P. Concentrations and speciation of arsenic in New England seaweed species harvested for food and agriculture. Chemosphere 2016, 163, 6–13. [Google Scholar] [CrossRef] [PubMed]
- Barreiro, R.; Real, C.; Carballeira, A. Heavy-metal accumulation by Fucus ceranoides in a small estuary in north-west Spain. Mar. Environ. Res. 1993, 36, 39–61. [Google Scholar] [CrossRef]
- Zhao, F.J.; Tang, Z.; Song, J.J.; Huang, X.Y.; Wang, P. Toxic metals and metalloids: Uptake, transport, detoxification, phytoremediation, and crop improvement for safer food. Mol. Plant 2022, 15, 27–44. [Google Scholar] [CrossRef]
- Hurd, C.L.; Harrison, P.J.; Bischof, K.; Lobban, C.S. Seaweed Ecology and Physiology, 2nd ed.; Cambridge University Press: Cambridge, UK, 2014; ISBN 9781139192637. [Google Scholar] [CrossRef]
- Chernova, E.N.; Shulkin, V.M. Concentrations of Metals in the Environment and in Algae: The Bioaccumulation Factor. Russ. J. Mar. Biol. 2019, 45, 191–201. [Google Scholar] [CrossRef]
- Hussain, B.; Riaz, L.; Li, K.; Hayat, K.; Akbar, N.; Hadeed, M.Z.; Zhu, B.; Pu, S. Abiogenic silicon: Interaction with potentially toxic elements and its ecological significance in soil and plant systems. Environ. Pollut. 2023, 338, 122689. [Google Scholar] [CrossRef] [PubMed]
- Panebianco, F.; Nava, V.; Giarratana, F.; Gervasi, T.; Cicero, N. Assessment of heavy- and semi-metals contamination in edible seaweed and dried fish sold in ethnic food stores on the Italian market. J. Food Compos. Anal. 2021, 104, 104150. [Google Scholar] [CrossRef]
- Tardugno, R.; Virga, A.; Nava, V.; Mannino, F.; Salvo, A.; Monaco, F.; Giorgianni, M.; Cicero, N. Land Snails (Mediterranean Escargot). Toxics 2023, 11, 317. [Google Scholar] [CrossRef] [PubMed]
- Di Salvo, E.; Tardugno, R.; Nava, V.; Naccari, C.; Virga, A.; Salvo, A.; Corbo, F.; Clodoveo, M.L.; Cicero, N. Gourmet Table Salts: The Mineral Composition Showdown. Toxics 2023, 11, 705. [Google Scholar] [CrossRef]
- Magnusson, B. The Fitness for Purpose of Analytical Methods: A Laboratory Guide to Method Validation and Related Topics (2014); Eurachem, European Union: Brussels, Belgium, 2014; p. 56. [Google Scholar]
- Box, G.E.P.; Cox, D.R. An Analysis of Transformations. J. R. Stat. Soc. Ser. B 1964, 26, 211–243. [Google Scholar] [CrossRef]
- Venables, W.N.; Ripley, B.D. Modern Applied Statistics with S, 4th ed.; Springer: New York, NY, USA, 2002. [Google Scholar]
- R Core Team. R: A Language and Environment for Statistical Computing, Version 4.3.2; R Foundation for Statistical Computing: Vienna, Austria, 2023; Available online: https://www.R-project.org/ (accessed on 6 October 2023).
- Lê, S.; Josse, J.; Husson, F. FactoMineR: An R package for multivariate analysis. J. Stat. Softw. 2008, 25, 1–18. [Google Scholar] [CrossRef]


| Site | Sampling Date | Hg | Cu | Cd | Cr | Pb | Zn | As | Mn | Ni |
|---|---|---|---|---|---|---|---|---|---|---|
| CM | 28 January 2022 | <LOQ | 0.993 | 0.026 | 0.010 | 0.009 | 2.268 | <LOQ | 0.985 | 0.032 |
| 29 April 2022 | <LOQ | 0.135 | 0.003 | 0.006 | <LOQ | 1.640 | <LOQ | 0.339 | 0.018 | |
| 19 July 2022 | <LOQ | 0.243 | 0.013 | 0.006 | 0.012 | 1.779 | <LOQ | 0.663 | 0.019 | |
| 13 September 2022 | <LOQ | 0.328 | 0.006 | 0.005 | 0.008 | 1.921 | <LOQ | 0.503 | 0.012 | |
| PM | 27 January 2022 | <LOQ | 0.147 | 0.021 | 0.011 | 0.011 | 2.096 | <LOQ | 0.884 | 0.039 |
| 7 March 2022 | <LOQ | 0.038 | <LOQ | 0.007 | <LOQ | 1.100 | <LOQ | 0.028 | 0.020 | |
| 8 April 2022 | <LOQ | 0.057 | 0.003 | 0.008 | 0.002 | 1.466 | <LOQ | 0.219 | 0.021 | |
| 28 July 2022 | <LOQ | 0.076 | 0.007 | 0.009 | 0.005 | 1.832 | <LOQ | 0.410 | 0.023 | |
| 3 October 2022 | <LOQ | 0.093 | <LOQ | 0.007 | 0.005 | 1.776 | <LOQ | 0.467 | 0.027 | |
| Br | 11 March 2022 | <LOQ | 0.133 | <LOQ | 0.008 | <LOQ | 2.292 | <LOQ | 0.102 | 0.013 |
| 5 May 2022 | <LOQ | 0.114 | <LOQ | 0.010 | <LOQ | 3.218 | <LOQ | 0.134 | 0.019 | |
| 22 July 2022 | <LOQ | 0.102 | <LOQ | 0.010 | <LOQ | 2.887 | <LOQ | 0.114 | 0.016 | |
| 7 September 2022 | <LOQ | 0.113 | <LOQ | 0.014 | <LOQ | 3.121 | <LOQ | 0.115 | 0.011 |
| Hg | Cu | Cd | Cr | Pb | Zn | As | Mn | Ni | |
|---|---|---|---|---|---|---|---|---|---|
| C. compressa base | - | 9.230 | 159.231 | 222.188 | 814.667 | 1.585 | - | 24.245 | 196.833 |
| C. compressa frond | - | 8.301 | 124.615 | 39.438 | 48.000 | 0.342 | - | 5.616 | 92.286 |
| E. mediterranea base | - | 7.761 | 148.769 | 176.688 | 643.778 | 1.337 | - | 20.683 | 170.357 |
| E. mediterranea frond | - | 6.150 | 80.923 | 33.438 | 42.222 | 0.284 | - | 8.775 | 74.167 |
| Element | LOD (mg/Kg) | LOQ (mg/Kg) | R2 | SRM 1570a (Spinach Leaves) (%) | Spiked Ultrapure Water (%) |
|---|---|---|---|---|---|
| As | 0.001 | 0.003 | 0.9997 | 98.00 ± 1.01 | 97.85 ± 0.95 |
| Cd | 0.001 | 0.003 | 0.9999 | 101.00 ± 1.05 | 101.50 ± 1.12 |
| Cr | 0.001 | 0.003 | 0.9996 | 97.35 ± 0.61 | 97.05 ± 0.50 |
| Cu | 0.003 | 0.010 | 0.9995 | 96.00 ± 1.01 | 96.10 ± 0.98 |
| Hg | 0.0003 | 0.001 | 0.9998 | 98.50 ± 1.10 | 98.35 ± 1.00 |
| Ni | 0.003 | 0.010 | 0.9996 | 97.20 ± 0.81 | 97.42 ± 1.03 |
| Pb | 0.0003 | 0.001 | 0.9999 | 105.00 ± 1.06 | 104.85 ± 1.03 |
| Zn | 0.010 | 0.033 | 0.9995 | 98.12 ± 0.77 | 98.30 ± 0.93 |
Disclaimer/Publisher’s Note: The statements, opinions and data contained in all publications are solely those of the individual author(s) and contributor(s) and not of MDPI and/or the editor(s). MDPI and/or the editor(s) disclaim responsibility for any injury to people or property resulting from any ideas, methods, instructions or products referred to in the content. |
© 2024 by the authors. Licensee MDPI, Basel, Switzerland. This article is an open access article distributed under the terms and conditions of the Creative Commons Attribution (CC BY) license (https://creativecommons.org/licenses/by/4.0/).
Share and Cite
Pagana, I.; Nava, V.; Puglia, G.D.; Genovese, C.; Emma, G.; Salonia, C.; Cicero, N.; Alongi, G. Cystoseira compressa and Ericaria mediterranea: Effective Bioindicators for Heavy- and Semi-Metal Monitoring in Marine Environments with Rocky Substrates. Plants 2024, 13, 530. https://doi.org/10.3390/plants13040530
Pagana I, Nava V, Puglia GD, Genovese C, Emma G, Salonia C, Cicero N, Alongi G. Cystoseira compressa and Ericaria mediterranea: Effective Bioindicators for Heavy- and Semi-Metal Monitoring in Marine Environments with Rocky Substrates. Plants. 2024; 13(4):530. https://doi.org/10.3390/plants13040530
Chicago/Turabian StylePagana, Ilaria, Vincenzo Nava, Giuseppe D. Puglia, Claudia Genovese, Giuseppe Emma, Carla Salonia, Nicola Cicero, and Giuseppina Alongi. 2024. "Cystoseira compressa and Ericaria mediterranea: Effective Bioindicators for Heavy- and Semi-Metal Monitoring in Marine Environments with Rocky Substrates" Plants 13, no. 4: 530. https://doi.org/10.3390/plants13040530
APA StylePagana, I., Nava, V., Puglia, G. D., Genovese, C., Emma, G., Salonia, C., Cicero, N., & Alongi, G. (2024). Cystoseira compressa and Ericaria mediterranea: Effective Bioindicators for Heavy- and Semi-Metal Monitoring in Marine Environments with Rocky Substrates. Plants, 13(4), 530. https://doi.org/10.3390/plants13040530