Abstract
MADS-box genes are essential for plant development and secondary metabolism. The majority of genes within a genome exist in a gene family, each with specific functions. Ginseng is an herb used in medicine for its potential health benefits. The MADS-Box gene family in Jilin ginseng has not been studied. This study investigated the evolution and structural and functional diversification of the PgMADS gene family using bioinformatics and analyzed gene expression through methyl jasmonate (MeJA) regulation. The results revealed that the evolution of the PgMADS gene family is diverged into ten clusters of a constructed phylogenetic tree, of which the SOC1 cluster is the most prevalent with a higher number of PgMADS genes. Despite their distinct evolutionary clusters, a significant number of members contains common conserved motifs. The PgMADS gene family was functionally differentiated into three primary functional categories, biological process, molecular function, and cellular component. Their expression is variable within a tissue, at a developmental stage, and in cultivars. Regardless of the diversity of the functions of PgMADS genes and evolution, their expression correlated and formed a co-expression gene network. Weighted gene co-expression network analyses identified hub genes that could be regulating ginsenoside biosynthesis. Interestingly, the family also is involved in MeJA regulation. These findings provide a valuable reference for future investigations on PgMADS genes.
1. Introduction
Ginseng, Panax ginseng Meyer, is a herbal plant in the Araliaceae Family, which is highly consumed as a remedial herb in Asian countries [1]. The ginseng root is utilized as a tonic to strengthen weak bodies, uphold the body’s balance, and boost essential energy levels [2]. The genus Panax is characterized by a wealth of medicinal phytochemicals, particularly saponins, along with polyacetylenes, phenolic compounds, such as flavonoids and phenolic acids, essential oils, polysaccharides, trace elements, and vitamins [3]. The most significant focus has been directed towards its saponin content, the ginsenosides. There are more than 150 naturally occurring ginsenosides identified from Panax species and about 70 in ginseng [4].
The development of plants and how they react to changing natural conditions and challenging environments are governed by complex regulatory systems comprising molecular elements, like MADS-box genes, acting as transcription factors (TFs), regulatory RNAs, and enzymes [5]. The MADS-box gene family derives its name from an acronym that represents the initials of its four founding members: the first letter abbreviation of the Mini chromosome maintenance 1 (MCM1) gene in Saccharomyces cerevisiae of yeast [6], the AGAMOUS (AG) gene in Arabidopsis thaliana [7], the DEFICIENS (DEF) gene in Antirrhinum majus [8], and the Serum Response Factor (SRF) gene in human serum [9]. Collectively, they are referred to as MADS-box genes.
The MADS-box gene family plays a central role in plant development, especially in flower development [10], in secondary metabolism, and plant responses to biotic and abiotic stresses [11]. Numerous researchers have identified and described genes involved in floral organs, and only a limited number of studies have been conducted on secondary metabolites. Some of the studies on the involvement of MADS-box genes in the development of reproduction organs include controlling rice flower development [12], a study on the function of OsMADS18 in flower development [13] through the characterization of SlCMB1 for tomato fruit ripening [14], and a characterization of MADS-box cDNA (GAG2) in ginseng flower development [15]. MADS-box TFs have also been identified in secondary metabolite regulation. In the banana plantlet root, FoRlm1 has been identified as essential for aerial hyphal growth and virulence [16]. Ma et al. [17] discovered that GmNMH7 inhibits the root development and nodulation of soyabean (Glycine max [L.] Merr.). In tomato, SICMB1 influences carotenoid accumulation during fruit ripening and regulates autocatalytic ethylene synthesis [14], and SIMBP8 in tomato regulates drought, salt, and stress-related genes [18]. In ginseng, PgbHLH, PgNBS, PgRLK, and PgCYP (P450) gene families play a variety of roles, such as in biotic and abiotic stress tolerances, growth and development, and ginsenoside biosynthesis, as reported in different studies [11,19,20,21]. Little is known about the quantity, structure, and functions of the PgMADS gene family in ginseng. In the present study, we genome-wide identified the PgMADS gene family and conducted the evolutionary, structural, and functional differentiation among the members of PgMADS gene family in ginseng and their expression under MeJA induction for ginsenoside biosynthesis. The study on PgMADS genes of the family would enhance the use of the results for research and breeding programs.
2. Results
2.1. Identification of PgMADS Gene Transcripts
The MADS-box domain HMM that was downloaded obtained 5642 candidate MADS-box sequences based on a comparison with the ginseng genome. A total of 6635 candidate MADS-box sequences were obtained via local Blast alignment to the Jilin ginseng transcriptome. By combining the above results, a total of 2809 MADS-box transcripts were obtained based on local Blast to the Jilin ginseng transcriptome. The sequences were analyzed using ORF finder and Cd search tools in NCBI. A total of 162 transcripts containing the MADS-box conserved domains were identified and named as PgMADS gene transcripts. These transcripts were spliced from 57 PgMADS genes, which are designated as PgMADS01 to PgMADS57. Transcripts derived from the same gene are differentiated by suffixes “-01, -02”. The PgMADS gene family contained an average length of 1170 bp, with a shortest and longest lengths of 201 bp (PgMADS56) and 3213 bp (PgMADS42-05) (Table S1).
2.2. Structural Characterization and Evolution of the PgMADS Gene Family
2.2.1. Motif Domain Prediction of the PgMADS Gene Transcripts
We conducted an analysis of the above 162 PgMADS transcripts for their open reading frames (ORFs) using the ORF Finder provided by National Center for Biotechnology Information (NCBI) using the PgMADS nucleotide sequences. Of the 162 transcripts, 105 were found to have complete ORFs and were translated into amino acids. The motif length ranged from 8 amino acids to 50 amino acids, and the number of motifs varied among the PgMADS sequences. Multiple sequences of the PgMADS transcripts contained at least two conserved motifs 1 and 4. The highly conserved motifs for a higher number of PgMADS transcripts are motifs 4, 9, 2, 1, 3, and 5 and are distributed along the PgMADS transcripts in the same order. Many transcripts spliced from PgMADS46 gene were clustered in different groups displaying the most significant quantity of these motifs regardless of the group, such as PgMADS46-70, PgMADS46-15, PgMADS46-49, PgMADS46-24, and PgMADS46-41 (Figure 1). All PgMADS genes contain a conserved MADS domain characterizing them as a gene family.
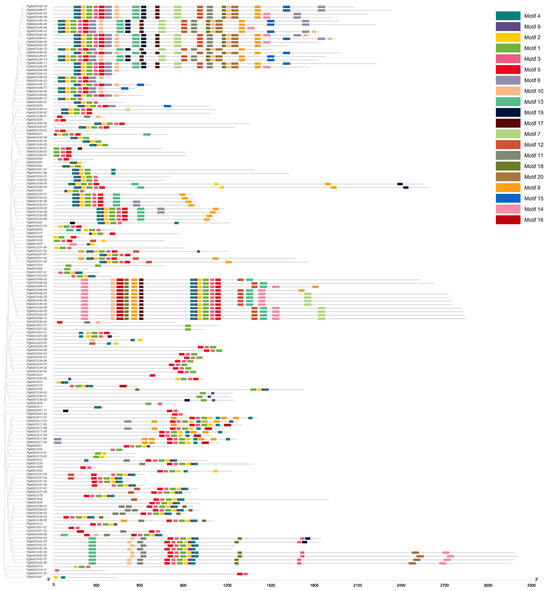
Figure 1.
PgMADS conserved motif structure. The number of conserved motifs in the PgMADS gene transcripts and its phylogenetic tree constructed using the maximum-likelihood (ML) method.
2.2.2. Phylogenetic Analysis of PgMADS Gene Family
Phylogenetic analysis showed that members of the PgMADS gene family were distributed differently. Members of the PgMADS gene family were unequally scattered with MADS genes from the other three species in different clusters (Figure 2). The AP1 and AG subfamilies contained two PgMADS genes, and the MIKC* and AP1 subfamilies contained three PgMADS genes. A higher number of PgMADS genes was scattered under the SOC1 subfamily. PgMADS genes formed different groups within the same subfamily. For example, under the SOC1 group, PgMADS44-01 clustered with AGL20, sharing a common ancestor, while within the same subfamily, PgMADS31-03 is clustered with TaAGL7 sharing a different ancestor. Under the SEP subfamily, all the eleven PgMADS genes were dramatically clustered together. PgMADS39-03 and PgMADS39-02 clustered with SEP1. The transcripts spliced from the PgMADS36 gene were clustered with OsMADS8/24, TaAGL28, TaAGL16, and TaAGL30. All PgMDS genes were grouped together with other published MADS genes with the highest number of the members of PgMADS observed in the SOC1, AGL15, and SEP1 clusters (Table S2). These cluster results of MADS genes suggest a likelihood of diverse evolution and functions depicted by PgMADS genes in plant development.
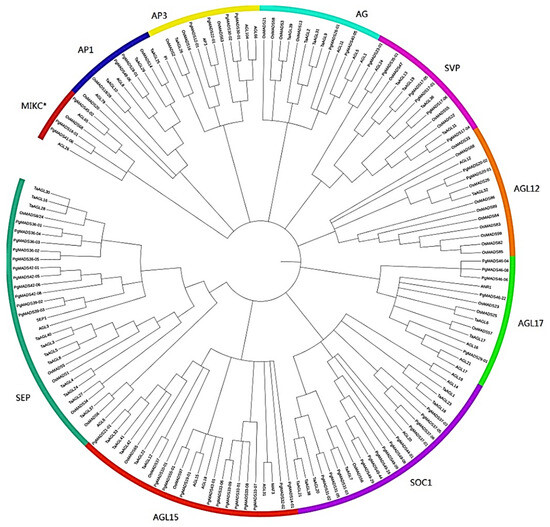
Figure 2.
Phylogenetic analysis of the PgMADS genes. (A) Phylogenetic analysis of the 60 PgMADS genes with 100 MADS genes selected from other plant species. The phylogenetic tree was constructed using MEGA7 with the maximum likelihood method. AGL for Arabidopsis thaliana, Os for Oryza sativa, and Ta for Triticum aestivum. (B) Evolution relatedness of PgMADS genes in the phylogenic clusters constructed using the genes from Arabidopsis thaliana as a control.
2.2.3. Chromosome Positions of the PgMADS Gene Transcripts in the Ginseng Genome
One hundred and forty of 162 PgMADS gene transcripts were scattered and distributed on 21 chromosomes (Chr), and none of them were mapped on Chr04, Chr10, and Chr17 (Figure 3). Chr18 contained the highest number of PgMADS genes, with 21 genes, followed by Chr20 and Chr21, with 16 genes each. Most of the chromosomes (Chr02, Chr05, Chr07, Chr08, Chr09, Chr11, Chr12, Chr13, Chr15, Chr16, and Chr21) contained fewer than 5 genes per Chr, while Chr6, Chr14, Chr19, Chr22, and Chr24 contained 5–10 genes per Chr. The enrichment regions showed a relatively high density on Chr01, Chr03, Chr18, Chr20, and Chr23, having more than 10 genes each. The length and number of genes distributed on chromosomes varied within the PgMADS gene family. Chr06, with a gene (PgMADS45) and the longest length of 1731 bp, aligned with ten genes, while Chr20, with the shortest alignment length of 237 bp (PgMADS32-02), contained 16 genes, and Chr18, with 387 bp in length (PgMADS46-13), aligned with 21 genes. PgMADS genes were aligned in two clusters on Chr06, with eight genes on cluster one and two genes on cluster two within 200 bp length. PgMADS genes were localized on various chromosomes indicating the possibility of various functions.
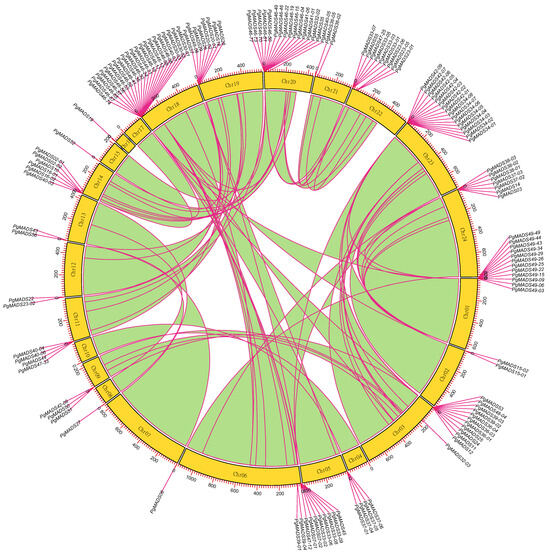
Figure 3.
Chromosomal localization of the PgMADS gene transcripts. The 140 of 162 PgMADS gene transcripts were localized on 21 chromosomes, while none of them were mapped on Chr04, Chr10, and Chr17. Each chromosome with a variation in the number of gene transcripts and alignment length.
2.3. Annotation and Functional Differentiation of the PgMADS Gene Family
2.3.1. Gene Ontology Functional Categorization and Enrichment Analysis of the PgMADS Gene Transcripts
PgMADS gene transcripts were submitted to GO categories for mapping, and the results predicted various functions for the transcripts among the gene family. One hundred and sixty-two PgMADS transcripts were mapped unequally on the GO categories. Forty-seven PgMADS transcripts were mapped into seven GO categories, followed by 36 transcripts into 11 GO categories, while only two transcripts were mapped into 18 GO functional categories (Figure 4A). Categorization of the 162 PgMADS transcripts at Level 2 classified 106 (65%) of these 162 transcripts into all three primary GO functional categories, biological processes (BPs), molecular functions (MFs), and cellular components (CCs) (Figure 4B). PgMADS transcripts were distributed more in BP GO functions. Approximately 100 of PgMADS transcripts are involved in all the three primary GO function categories. Most of the transcripts are involved in the cellular process and metabolic process of BPs, binding and the transcription regulatory activity of MFs, and the intracellular and cellular anatomical entity of CCs. Enrichment analysis showed that 10 of the 12 sub-categories were significantly enriched at p ≤ 0.01 (Figure 4C). More than 90% of the transcripts are expected to participate in the cellular process (95%), metabolic process (92%), and binding (92%). These findings suggest that the functions of the transcripts in the PgMADS gene family are probably different.
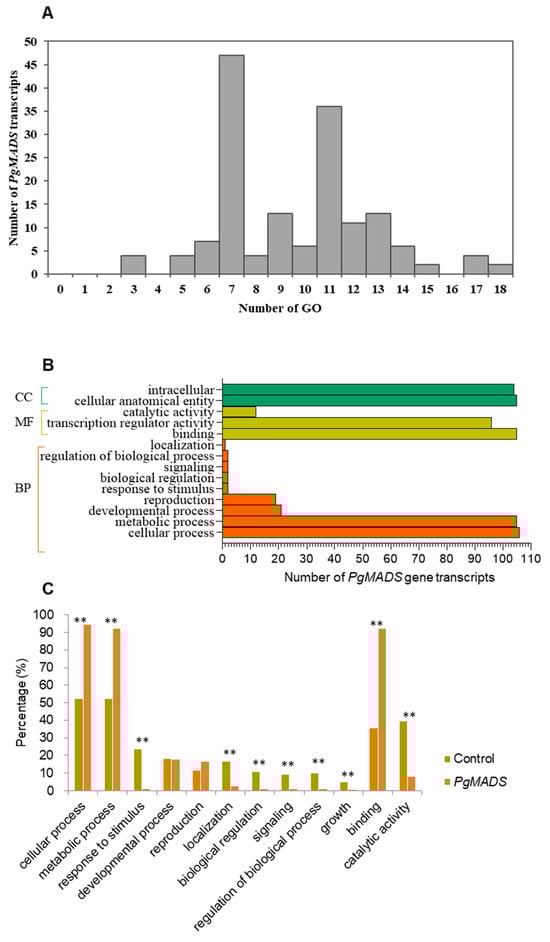
Figure 4.
Functional categorization of PgMADS gene transcripts based on gene ontology (GO). (A) GO mapping distribution of 162 PgMADS transcripts. (B) Distribution of PgMADS transcripts for GO enrichment based on the biological process (BP), molecular function (MF), and cellular component (CC) at Level 2 and a p-value = 1. (C) Subcategories (Level 2) in which the PgMADS transcripts are involved and their enrichments. The GO term categorization of the transcripts expressed in 14 tissues of the 4-year-old plant used for the identification of the PgMADS transcripts as the background control for the enrichment analysis. ** Significant at p ≤ 0.01.
2.3.2. Sub-Category Analysis of PgMADS Transcripts in Different Cultivars and Different Tissues and at Different Developmental Stages
GO analysis of the expression profiles of PgMADS transcripts showed that a consistently higher number of transcripts were determined in cellular processes, metabolic processes, and binding activity of the three sub-categories at Level 2 (Figure S1) in the space and time of growth. Among the roots of the 42 cultivars representing different locations, the number of transcripts was higher in binding activity and metabolic processes (Figure S1A) while there was a considerably higher variation in expression for cellular processes among cultivars. The transcripts were abundantly expressed in cultivar seven (S7). In the 14 tissues of 4-year-old plants and the roots of differently aged plants, the transcript expression was relatively higher in the cellular process, metabolic process, and binding than in the other sub-categories (Figure S1B,C). Transcripts were abundantly expressed in the fruit pedicle relative to other tissues and in 12-year-old roots relative to the other three ages. The results showed a consistently higher number of transcripts determined in cellular processes, metabolic processes, and binding activity of the three sub-categories at Level 2.
2.3.3. Co-Expression Network of the Gene Transcripts in the PgMADS Gene Family
A co-expression network among PgMADS genes was formed in the 4-year-old roots of 42 cultivars. Due to expression levels of 39 of the 162 PgMADS gene transcripts being zero in all 42 cultivars, 123 gene transcripts were used for co-expression network construction. When p ≤ 5.0 × 10⁻² was set, the 123 PgMADS transcripts formed a co-expression network with a total of 509 edges and 17 clusters (Figure 5A,B). When comparing the interaction network formed by the PgMADS gene transcripts to that by the randomly selected unknown ginseng genes, the number of the nodes and edges of the network formed by the PgMADS genes was higher than that of the co-expression network of randomly selected genes with a decreasing p-value (Figure 5C,D). There was a significant difference between PgMADS genes and randomly unknown selected genes at almost all the p values (Figure 5E,F). The results suggest that there is a closer connection between PgMADS genes than the random unknown genes.
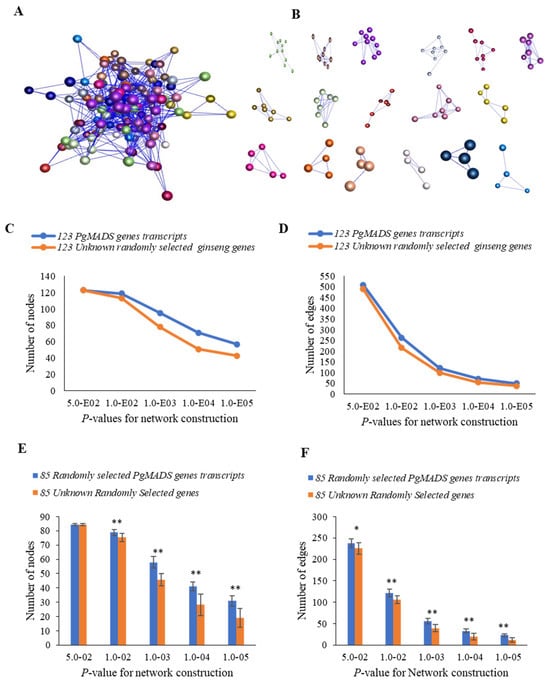
Figure 5.
Co-expression network of the PgMADS gene transcripts expressed in the 4-year-old roots of 42 cultivars. (A) The co-expression network of 123 PgMADS gene transcripts was constructed at a cutoff of p ≤ 5.0 × 10⁻². It consists of 123 gene nodes, 509 edges, and different colors indicate different clusters. (B) The 17 clusters constituting the network. (C) Tendency that PgMADS gene transcripts form a network using the unknown randomly selected ginseng genes as a control: variation in number of nodes. (D) Tendency that PgMADS gene transcripts form a network using the unknown randomly selected ginseng genes as a control: variation in number of edges. (E) Statistics of the variation in the number of nodes in the PgMADS network. (F) Statistics of the variation in the number of edges in the PgMADS network. The 85 PgMADS gene transcripts used for statistical analysis were randomly selected from the 123 PgMADS gene transcripts with 10 replications. The 85 unknown randomly selected ginseng transcripts used as a control with 10 replications. Statistics of the variation in the number of nodes and edges were analyzed using a t-test, with “*” at p ≤ 0.05; “**” at p ≤ 0.01. Error bars, standard deviation.
In a co-expression network for 14 tissues of a 4-year-old plant, because the expression of 23 of the of the 162 PgMADS transcripts was zero, 23 PgMADS gene transcripts were removed for co-expression network construction. A co-expression network was formed with a total of 139 nodes, 1222 edges, and 11 clusters at p ≤ 5.0 × 10⁻² (Figure S2A,B). PgMADS had comparatively higher correlated expression and formed a co-expression network, relative to the randomly selected unknown genes (Figure S2C,D). With a decreasing p-value, the number of nodes and edges also decreased for both PgMADS and randomly selected ginseng genes. There was a significant difference for the interactions with the higher number of nodes and edges for all p-value levels (Figure S2E,F). The results showed that the network formed by the transcripts of the PgMADS gene was more closely connected and more inclined to perform functions in the interaction.
2.3.4. The Weighted Gene Co-Expression Network (WGCNA) of the PgMADS Gene Transcripts
The constructed connection of the corresponding topological overlap at an appropriate soft threshold power (soft power = 9) according to the standard scale-free networks is shown in Figure S3A, left. When the soft threshold power was defined as 14, the scale-free topological index is 0.9, and the change in average gene connectivity under different power values was calculated (Figure S3A, right).
The gene clustering tree was constructed according to the correlation of gene expression (Figure S3B). A branch of the tree corresponds to a cluster of gene sets with a high correlation. The gene modules were divided according to the clustering relationship between genes. Genes with similar expression patterns were classified into the same module. The branches of the clustering tree were cut and distinguished to produce different modules: yellow, blue, turquoise, and brown (Figure S3B). Each color represents a module and a grey color indicated the genes that could not be classified into any module. The number of genes per module is shown in Figure S3C in which the turquoise module contained the largest number of genes and the brown module contained the fewest number of genes.
2.3.5. Identification and Analysis of Vital Modules Correlated with Ginsenoside Contents
The expression mode of the module gene in each sample was shown with the module eigenvalue. The heatmap shows the traits–gene adjacency of the module (Figure S3B). The categorized eigengene expression levels expressed in three different parameters, including the 4-year-old roots of 42 cultivars (S1–S42), 14 tissues (fiber roots, leg roots), main root epiderm, main root cortex, rhizome, arm roots, stem, leaf peduncle, leaflet pedicel, leaf blade, fruit peduncle, fruit pedicel, fruit flesh, seed, and the roots of four differently aged plants (5-, 12-, 18- and 25-year-old roots). All the modules showed a diverse expression pattern of increased and decreased patterns between S1 to S42 cultivars (Figure S3D–G). In the tissues, the yellow and blue modules had their highest expression in fruit peduncle, while turquoise module had its highest expression in the stem and the brown module was highly expressed in the fruit flesh (Figure S3D–G). Among differently aged roots, the brown module remained constant for all the years, while both the yellow and blue were increasing and decreasing. The expression decreased with the increase in the number of years for the turquoise module (Figure S3F). The association between the four modules and the traits (ginsenosides: Rg1, Re, Rf, Rb1, Rg2, Rc, Rb2, Rb3, Rd, and TS) was constructed by correlating the eigengene value of the modules with the ginsenoside contents. Among the four modules, the turquoise module formed a strong association with Rg1, Rb1, and Rd, while the blue module was correlated with Rb3 (Figure 6A).
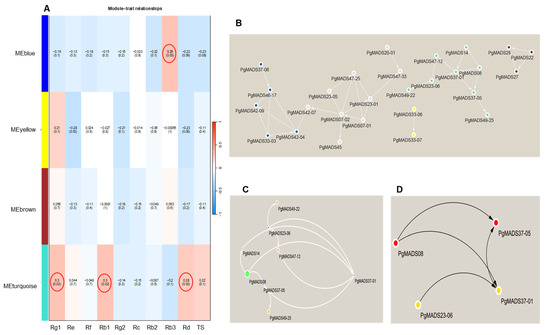
Figure 6.
Module–trait relationship and network. (A) Each row corresponds to a module, and each column corresponds to a mono-ginsenoside. Each cell contains the test statistic value and its corresponding p-value from the linear mixed-effects model where it represents p < 0.05. The red circle represents the ginsenoside-based gene significance in a module. (B) The interaction network connections for all modules. (C) The network of the eight most highly connected genes in the turquoise module. In this network, we only display a connection if the corresponding topological overlap is above a threshold of 0.08. (D) Hub genes with the top-four degree in the turquoise module of the network.
2.3.6. Identification Hub Genes of the PgMADS Genes Based on WGCN Construction
WGCNs were constructed for all modules of PgMADS genes (Figure 6B) where the nodes represent genes and edges represent regulatory connections between the genes. A total of 27 nodes was formed in a network. The most highly interconnected genes were in the turquoise module with eight genes, PgMADS08, PgMADS49-25, PgMADS47-12, PgMADS49-22, PgMADS37-01, PgMADS37-05, PgMADS14, and PgMADS23-06 (Figure 6C). The hub genes were composed of four genes in the network using the NCC method. The four hub genes included PgMADS08, PgMADS23-06, PgMADS37-01, and PgMADS37-05 (Figure 6D).
2.3.7. Identification of the PgMADS Genes with MeJA and Abiotic Stress Signal Promoter Elements
PlantCare analysis showed that PgMADS genes contained a variety of cis-acting elements, ranging from 2 to 18 cis-acting elements per gene. The PgMADS36-02 gene contained the lowest number of the two elements, while PgMADS39-04 contained a total of 18 cis-acting elements (Figure 7). The genes showed a relatively higher response to ABRE, MeJA, and MBS elements. PgMADS24 contained the highest number of five MBS promoter elements followed by the transcripts spliced from PgMADS49 and PgMADS37 genes. The ABRE element was comparatively rich within a total of 103 PgMADS genes and relatively richer in the PgMADS29 gene that contained 8 ABRE elements, followed by PgMADS16-02 and PgMADS16-01 with 6 ABRE elements each. In addition to ABRE element, 121 PgMADS genes contained MeJA responsiveness elements (TGACG and CGTCA motifs). A total of 84 genes were responsive to the drought inducibility element, and a limited number of PgMADS genes showed responsiveness to auxin elements.
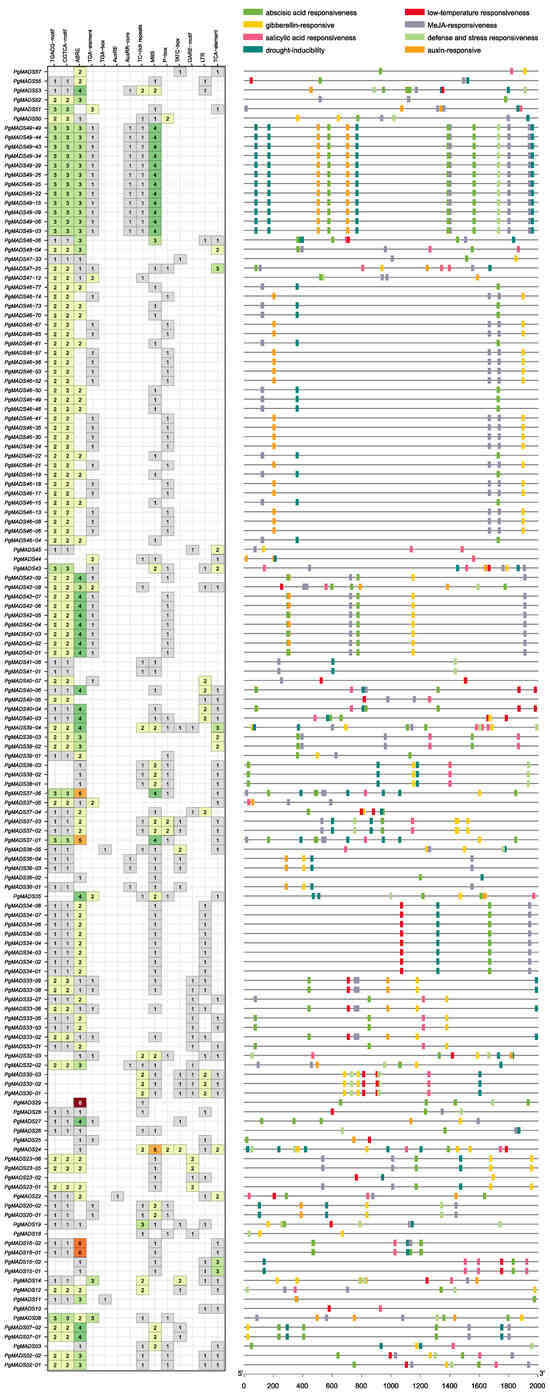
Figure 7.
The cis-acting elements of the PgMADS genes.
2.3.8. Correlation Analysis Between Expression of PgMADS Hub Genes and Ginsenoside Contents Under MeJA Induction
The study analyzed the PgMADS hub genes, PgMADS08, PgMADS23-06, PgMADS37-01, and PgMADS37-05, selected from a WGCNA in a turquoise module having a significant correlation with Rg1, Rb1, and Rd contents (Figure 6A). Gene expression and the contents of ginsenoside changed with the MeJA-treatment time. The PgMADS08 expression level was significant at 36 h after MeJA treatment when compared to the control (0 h) but not significant at its peak expression level at 72 h (Figure 8A). PgMADS23-06 expression levels were significant at 6 h, 24 h, 36 h, 48 h, 60 h, 72 h, 84 h, and 96 h after MeJA treatment but not significant at its peak expression level after MeJA induction (Figure 8B). PgMADS37-01 expression levels were significant at 6 h and at its peak expression level at 24 h after MeJA treatment (Figure 8C). PgMADS37-05 expression levels were significant at 36 h, 60 h, 72 h, 84 h, and at its peak expression level at 96 h after treatment with MeJA (Figure 8D). The contents of ginsenoside Rg1 were significantly different from the control contents (0 h) at 6 h, 12 h, 48 h, 60 h, 96 h, and 108 h and reached its peak at 96 h (Figure 8E). Rb1 was relatively significantly different from the control contents (0 h) for all time points except at 12 h, which was not significant in comparison to the control (Figure 8F). Rd was significantly different from the control for all time points except at 6 h (Figure 8G). These results suggest that MeJA has the role of regulating the biosynthesis of ginsenosides.
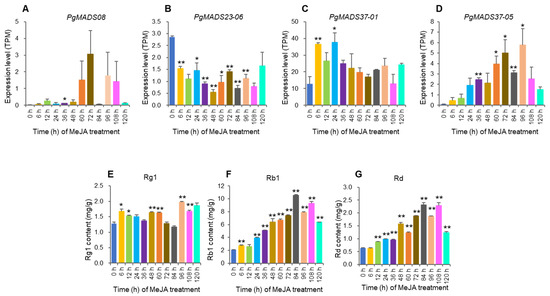
Figure 8.
The expression levels of the transcripts of PgMADS genes, PgMADS08 (A), PgMADS23-06 (B), PgMADS37-01 (C), and PgMADS37-05 (D), and the changes in ginsenosides, Rg1 (E), Rb1 (F), and Rd (G) in the adventitious roots treated with MeJA, relative to those in the control (0 h). The “*” and “**” are significant differences in gene expression levels or ginsenoside contents between MeJA-treated and control roots at p ≤ 0.05 and p ≤ 0.01. No mark is a non-significant difference in gene expression levels or ginsenoside contents between MeJA-treated and control roots. Error bars, standard deviation.
We conducted correlation analysis between expression levels of the four hub genes and the three ginsenoside contents under MeJA induction to further confirm their roles in ginsenoside biosynthesis. The results showed that there is no significant correlation between the expression of two of four hub genes, PgMADS08 and PgMADS37-01, and Rg1, Rb1, and Rd contents under MeJA treatment. The PgMADS23-06 expression was negatively correlated with Rb1 and Rd contents at p ≤ 0.01 and not significantly correlated with Rg1 contents. The PgMADS37-05 expression was positively correlated with Rb1 and Rd contents at p ≤ 0.001, with no significant correlation with Rg1 contents (Figure S4).
3. Discussion
MADS-box genes are characterized by a conserved DNA-binding domain and have been characterized in several plant species, such as shrub willow [22], Arabidopsis [23,24], soybean [17], wheat [25], tomato [26], rubber tree [27], rice [12], and Chinese jujube [28]. However, there is limited knowledge about the diversity of MADS-box genes in ginseng. The study has identified and characterized 162 transcripts spliced from 57 MADS-box genes in Jilin ginseng and referred to as PgMADS genes. The size of the PgMADS gene family is comparable with those of the gene family in pineapple, having 48 MADS genes [10], and jujube, having 52 MADS genes [28], but smaller than those of wheat, which has 180 MADS gene [25] and Arabidopsis, having 107 MADS genes [24]. The characterization findings reveal that the PgMADS gene family has undergone significant differentiation in terms of evolution, structure, and function, while also being involved in various biological processes and regulatory pathways. The results further indicate that although the characteristics of the members of the PgMADS gene family have diverged in evolution, structure, and functions, the gene family functions in a coordinated manner despite their functional differences.
The protein motifs of the individual members of the PgMADS family demonstrate structural similarities within one group but different patterns for each of the other groups. The majority of PgMADS transcripts contain motifs distributed in the same order, aligned at a similar length, and appear consistently at similar positions. A previous study on the AHL gene family in soyabean indicated that the motif distribution among the gene family suggests a significant function in the gene family [29]. Furthermore, each cluster of the PgMADS gene family on the evolutionary family tree has specific conserved motifs distinguishing it from other clusters with examples of transcripts spliced from the PgMADS46 gene classified under the AGL17 subfamily of the gene family tree, containing a similar distribution of 14 motifs and mapped on chromosome 18. The similar pattern is observed for PgMADS49 transcripts classified under the SOC1 subfamily, containing 17 motifs aligned at a similar length and appearing consistently at similar positions and mapped on chromosome one. Previous phylogeny reconstructions have revealed that there is a correlation between the phylogeny of the MADS-box gene family and the structural and functional evolution of land plants [30]. Additionally, according to Qing et al. [31], two or more genes found within a few base pairs of each other on a single chromosome region may be considered a gene cluster and may collectively have a generalized function. The alignment lengths of the PgMADS genes on the chromosomes varied with no correlation with the number of scattered genes within each chromosome. The result aligns with that of Li et al. [32] highlighting that there is no correlation between chromosome length and gene distribution.
The diverse evolutionary characteristics of PgMADS suggest a likelihood of diverse functions depicted by PgMADS genes in plant development. Studies confirmed that SOC1-like and SEP genes are involved in the floral transition as floral promoters and homeotic genes [23,33]. AGL12 in Arabidopsis was expressed in roots [34]. AP1 and AP3 were involved in the genetic control of flower development [35]. The over-expression of AGOMOUS like-protein AGL15 regulated the expression of MIR156, which prolonged the vegetative stage and delayed the floral transition in Arabidopsis Thaliana [36].
Despite the variation in PgMADS genes in the evolutionary and structure analysis, their consistency in GO term enrichment proposes functions in the three primary categories: BP, CC, and MF. The members of the PgMADS gene family were categorized into 12 subcategories at Level 2, showing variability in expression across different tissues, developmental stages, and cultivars indicating that they are functionally broadly differentiated and distinct from other gene families in ginseng. The functional diversity of the PgMADS gene family is larger than that of PgbHLH, PgTCP, and PgERF, which were categorized into 11, 6, and 8, subcategories respectively [11,37,38], but less than that of PgRLK, which was categorized into 23 subcategories [20].
Our analysis indicated the high expression of transcripts in the PgMADS gene family was at 12 years but decreased in the following years, confirming the previous studies that age affects gene expression. The saponin contents generally increase with age but reach their maximum level at six years [39]. A transcriptome analysis conducted by Fang et al. [40] revealed that growth years of ginseng affect the genes associated with expression. PgMADS gene expression is higher in the fruit’s tissues than the in the root’s tissues, implying that the gene family is more involved at fruiting development. Zhang et al. [5] reported that the tissue specificity of gene expression may be correlated with specific biological functions. Additionally, the transcript expression levels were higher in some cultivars than others, suggesting that cultivar variability contributes to gene expression. Qi et al. [41] mentioned that environmental conditions significantly influence gene expression and thus the quality and levels of ginsenosides. Interestingly, these PgMADS gene expression levels create a co-expression gene network, reinforcing the idea that these genes function as a family to fulfil particular functions. The co-expression networks validate the functional diversity within the PgMADS gene family while also highlighting the consistency of their functions across different tissues, developmental stages, and cultivars.
Previous studies showed that the MADS gene family plays important roles in growth and development [42,43,44] and plant responses to hormones [45], biotics [16,46] and abiotic stresses [18]. The cis-regulatory element analysis of the members of PgMADS gene family in the present study provides additional evidence on these roles of the genes in ginseng. Moreover, the four hub genes of the PgMADS gene family, PgMADS08, PgMADS23-06, PgMADS37-01, and PgMADS37-05, that have been identified via WGCNA have been responsive to MeJA treatment, suggesting that the PgMADS gene family indeed plays roles in plant responses to ginsenoside biosynthesis. The results of our study with that of Langfelder and Horvath [47] indicated that WGCN analysis identifies the regulatory mechanisms involved in ginsenoside biosynthesis and facilitates the exploration of potential transcription factors in various cultivars. The application of MeJA to adventitious roots stimulates the production of ginsenosides. The results confirm the existing evidence that MeJA was proven to be able to regulate ginsenoside contents [48,49] and expressions of the key enzyme genes involved in ginsenoside biosynthesis [4]. The variations in the four PgMADS hub gene expression levels and ginsenoside contents significantly respond to MeJA treatment to further confirm that MeJA is associated with ginsenoside biosynthesis [50,51]. The recent similar results have been obtained in a gene expression analysis of the FAR1/FHY3 gene family under MeJA treatment in ginseng [52].
Collectively, all the results indicate that the characteristics of the PgMADS gene family have substantially differentiated from evolution, functions, and expression but also reveal that the transcripts from the PgMADS gene family function in a coordinated manner despite their divergence.
4. Materials and Methods
4.1. Plant Materials and Datasets
Different plant materials and datasets of P. ginseng were used in this study. Four ginseng transcriptome datasets that consist of the sequences of all expressed gene transcripts and the expression of all transcripts spliced from the expressed genes developed by Wang et al. [53], hereafter defined as datasets A, B, C, and D, and three ginseng sequenced genomes [54,55,56] were used for this study. Dataset A consists of 248,993 transcripts developed from 14 tissues of a four-year-old ginseng plant at the seed-ripening stage (NCBI/SRA: SRX1445566-SRX1445579) and the transcriptome of each tissue. The 14 different tissues and organs include fiber roots, leg roots, main root epiderm, main root cortex, rhizome, arm roots, stem, leaf peduncle, leaflet pedicel, leaf blade, fruit peduncle, fruit pedicel, fruit flesh, and seed of a single plant. Dataset B consists of 54,000–65,000 transcripts developed from the roots of 5-, 12-, 18-, and 25-year-old ginseng plants (NCBI/SRA: SRX1445580-SRX1445583); and transcriptome dataset C, which consists of 55,000–65,000 transcripts developed from the 4-year-old roots of 42 cultivars, represents the genetic variation and diversity of Jilin ginseng (NCBI/GEO SSR13131364-SSR13131405). Dataset D was based on ginseng adventitious roots treated with MeJA for multiple treatment durations, including the transcript expression in the adventitious roots subjected to 12 durations of MeJA treatments. The three genomes used for this study are as follows: the IR826 genome with a 91× coverage was assembled into 9072 scaffolds with an average N50 = 109 kb and identified to have 42,006 predicted genes [54]. The Chp genome has a 206× coverage and was assembled into 9845 scaffolds with an average N50 = 569 kb and annotated into 59,352 genes [55]. The P. ginseng genome was assembled with an estimated size of 3.4 Gb, sequence length of 3.36 Gb with an average N50 = 19.75 Mb, and annotated into 65,913 genes [56].
4.2. Identification of PgMADS Gene Transcripts
The PgMADS gene transcripts were identified as previously described [11,53]. To identify the MADS-box gene family in ginseng, the Hidden Markov Model (HMM) profile of SRF-like and MEF2-like domain and the protein sequences of the SRF-like and MEF2-like genes downloaded from NCBI “https://blast.ncbi.nlm.nih.gov/Blast.cgi (accessed on 23 September 2020)” were used to query the 248,993 Jilin ginseng gene transcripts [53] using TBLASTN, applying an E-value of 1.0 × 10⁻⁶. The candidate protein sequences of MADS-box transcription factors obtained were aligned to the Panax ginseng genome protein database using Hummer software to obtain the candidate protein sequences of Panax ginseng MADS-box transcription factors. Following this, a Hidden Markov Model (HMM) profile of MADS-box genes was retrieved from Pfam [57] and applied as queries to perform a search in dataset A based on the aforementioned criteria. The MADS-box candidate genes identified from the previous BLASTn results were then re-used as queries for a follow-up search in dataset A, applying an E-value of 1.0 × 10⁻⁶ to optimize the discovery of MADS-box candidate genes. To ensure the accuracy of the MADS-box candidate gene transcripts, the SMART tool “https://smart.embl.de/ (accessed on 19 October 2020)” was employed to eliminate any potentially false-positive results. The identified MADS-box candidate gene transcripts in ginseng were named as PgMADS gene transcripts.
4.3. Structural Characterization and Evolution of PgMADS Gene Family
4.3.1. Motif Prediction of the PgMADS Gene Transcripts
The motifs of PgMADS gene transcripts were searched at a motif number and a motif width from 2 to 50 for a gene using the MEME tool “https://meme-suite.org/meme/tools/meme (accessed on 23 September 2023)” [58]. The open reading frames (ORFs) of the PgMADS transcripts were searched using the ORF Finder at NCBI “https://www.ncbi.nlm.nih.gov/ (accessed on 30 December 2023)”. For this analysis, the maximum number of motifs was set to 20, the motif length was set to 8–50 amino acids, and other parameters were used as default.
4.3.2. Phylogenetic Analysis of the PgMADS Gene Family
A phylogenetic tree was constructed to analyze the evolutionary characteristics of the PgMADS gene family. The transcript that had the longest sequence and complete ORF for each PgMADS gene was selected for the analysis. The phylogenetic tree was constructed using a total of 160 MADS genes from PgMADS (60), Arabidopsis thaliana (26), Oryza sativa (35), and Triticum aestivum (39). MADS gene sequences from these species, A. thaliana, O. sativa, and T. aestivum, were downloaded from the Plant Transcription Factor Database “https://www.ncbi.nlm.nih.gov/ (accessed on 20 October 2023)” and used as the evolutionary control. The gene sequences were translated into amino acid sequences, aligned with each other using ClustalW, and used to construct a phylogenetic tree using MEGA 7 with the maximum likelihood (ML) method [59] with the neighbor-joining method and a bootstrap value set to 2000. Furthermore, ten clades of the A. thaliana genes, MICK*, P1, AP3, AG, SVP, AGL12, AGL17, SOC1, AG15, and SEP1, were used to predict the functions of PgMADS genes.
4.3.3. Chromosome Positions of the PgMADS Gene Transcripts in the Ginseng Genome
The sequences of PgMADS genes are listed in Table S1, obtained from dataset A [53]. The ginseng genome [56] was downloaded from NCBI “https://www.ncbi.nlm.nih.gov/ (accessed on 23 December 2023)”and the library was built using the BLASTN 2.9 tool. A total of 162 PgMADS gene sequences were aligned to the ginseng genome using BLASTn and the sequences with a similarity ≥ 99% and length ≥ 200 bp were selected for localization and gene visualization on chromosomes. The chromosome localization and gene visualization of these genes were performed using TBtools [60].
4.4. Functional Differentiation of the PgMADS Gene Family
4.4.1. Annotation and Gene Ontology of PgMADS Gene Transcripts
Annotation and categorization of PgMADS gene transcripts in gene ontology (GO) was performed using Blast2GO v5.0 [61]. The results of the annotation and GO categorization were used to estimate the functional differentiation among the genes in the PgMADS family. The genes were categorized into three primary functional categories, namely biological processes (BPs), molecular functions (MFs), and cellular components (CCs). We further categorized the genes into different sub-categories. The enrichment of each sub-category of all the genes was tested via Chi-square analysis using the categorization of all the genes expressed in the ginseng 4-year-old plant (database A) [53] as the background control.
4.4.2. Sub-Category Analysis of PgMADS Gene Transcripts in Different Cultivars, in Different Tissues, and at Different Developmental Stages
In order to explore the roles of the gene transcripts, we categorized the functions of the transcripts of the PgMADS genes expressed in the 4-year-old roots of 42 different cultivars, 14 tissues (fiber roots, leg roots, main root epiderm, main root cortex, rhizome, arm roots, stem, leaf peduncle, leaflet pedicel, leaf blade, fruit peduncle, fruit pedicel, fruit flesh, seed), and the roots of four differently aged plants (5-, 12-, 18-, and 25-year-old). The numbers of transcripts were categorized into the 12 sub-categories of BF, MF, and CC among the roots of the 42 different cultivars and different tissues and among the roots of differently aged plants.
4.4.3. Co-Expression Network of the Gene Transcripts in the PgMADS Gene Family
We examined whether the expression activities of the gene members of the PgMADS gene family are related. Unknown randomly selected ginseng genes from the ginseng transcriptome database A [53] were used as the negative control. The expression levels of the PgMADS gene transcripts were extracted from dataset C from different cultivars and dataset A from different tissues. R 4.4.0 software was used to calculate Pearson’s correlation coefficients, and the gene co-expression networks were constructed using the BioLayout Express3D Version 3.2 software [62].
4.4.4. Construction of the Weighted Gene Co-Expression Network (WGCN) of Gene Transcripts in the PgMADS Gene Family
Weighted gene co-expression networks were constructed for PgMADS genes in R using the WGCNA (v1.63) package. Prior to WGCN analysis, the data were processed and genetically filtered by calculating the MAD (Median Absolute Deviation) value for each gene to assess gene variability. The MAD was set at threshold of 0.01, retaining genes with greater variability and removing genes with almost constant expression (MAD values less than 0.01). In addition, considering the proportion of missing gene expression values for each gene, retained genes had a missing rate less than 10%. The abnormalities in gene expression were deleted, and genes expressed as 0 were removed. Finally, 34 of the 162 PgMADS gene transcripts were selected for subsequent co-expression network analysis. Genes were then screened according to the standard of the expression level using the scale-free topological index of 0.9. The power value was selected as the analysis parameter, and the gene connectivity for different power values was calculated. The gene clustering tree was constructed according to the correlation of gene expression, and then, the genes with similar expression patterns were classified into the same module. The branches of the cluster tree were cut and distinguished to produce different modules. The module eigengene was calculated based on the genes of each module and used to test associations with the contents of ginsenosides. The modules were merged with the threshold value of a module eigenvalue similarity > 0.75 and p ≤ 0.05. Genes with a high degree of connectivity within a co-expression module were imported into Cytoscape (v3.10.2) for visualization.
4.4.5. Identification and Analysis of Vital Modules Correlated with Ginsenoside Contents
The module eigenvalue represented the expression value for all genes in the identified module. Modules were identified according to the heatmap of the expression patterns. Vital modules were selected based on their gene expression patterns in the four-year-old roots of 42 ginseng cultivars, in the four-year-old roots of 14 tissues and expression patterns in different aged roots. The module eigenvalue expression levels were further correlated with the contents of ginsenosides. The modules with significance of p ≤ 0.05 and related to ginsenoside biosynthesis were identified.
4.4.6. Identification of Hub Genes for the PgMADS Genes via WGCN Construction
The genes with connectivity to hub genes were considered associated genes. Cytoscape-v3.10.2 software was used to draw the co-expression network. Nodes in the network represent genes, and edges represent regulatory relationships between genes.
4.4.7. Identification of the Genes with MeJA and Abiotic Stress Signal Promoter Elements
PgMADS genes with promoter elements using the cis-acting element prediction method [63] were identified. The genes with cis-acting elements detected were compared in the ginseng genome database to obtain their chromosomal position and shotgun sequence on NCB1 “https://www.ncbi.nlm.nih.gov/ (accessed on 5 March 2024)” using Panax ginseng code WZH-002. PlantCare “https://bioinformatics.psb.ugent.be/webtools/plantcare/html/ (accessed on 8 March 2024)” was used for identifying the promoter elements for the PgMADS gene nucleic acid database regulating abiotic stresses for the responses to the following plant hormones and abiotic stress signals: methyl jasmonate responsiveness (TGACG-motif and CGTCA-motif) [64,65], abscisic acid responsiveness (ABRE) [66], auxin responsive elements (TGA-element, TGA-box, AuXRE, and AuxRR-core) [67,68], defense and stress-related response elements (TC-rich repeats, MBS, and LTR) [69], gibberellin responsive elements (P-box, TATC-box, and GARE-motif) [70], and salicylic acid responsive elements (TCA-element) [71]. Then, the results were visualized using Tbtools [60].
4.4.8. Correlation Analysis Between Expression of PgMADS Hub Genes and Ginsenoside Contents Under MeJA Induction
Ginseng adventitious roots treated with MeJA for multiple treatment durations, including the transcript expression and ginsenoside contents, were subjected to 12 durations of MeJA treatment. One gram of adventitious roots in a 250 mL triangular flask containing 150 mL of B5 liquid medium was cultured at 22 °C and 110 rpm in the dark for 30 days. MeJA was added into the above B5 liquid medium at a final concentration of 200 μM for induced processing at 6 h, 12 h, 36 h, 48 h, 72 h, 84 h, 96 h, 108 h, and 120 h, respectively, in three replications for each time point, and the untreated group was treated as a negative control (0 h). One gram of the adventitious roots from each of the three replicates at each time point was immediately frozen in liquid nitrogen and stored at −80 °C for RNA-seq. The expression of PgMADS hub genes was extracted from dataset D. The remaining adventitious roots were dried and stored at 4 °C for ginsenoside content measurements. Nine mono-ginsenosides, Rg1, Re, Rf, Rg2, Rb1, Rc, Rb2, Rb3, and Rd, were extracted using the Soxhlet extraction method [72] and measured using high-performance liquid chromatography (HPLC) [73]. The standards used for these ginsenosides were purchased from the National Institute for the Control of Pharmaceutical and Biological Products (Beijing, China). The expression levels of the genes and ginsenoside contents in the MeJA-treated samples at each time point were compared with those in the control samples at the 0 h time point using a standard t-test. To further confirm the PgMADS hub genes in ginsenoside biosynthesis, their expression levels at each time point, including the 0 h time point, were subjected to Pearson’s correlation analysis with the ginsenoside contents at each time point. If the PgMADS gene was correlated with the ginsenoside contents at p ≤ 0.05, the gene was considered to be potentially involved in ginsenoside biosynthesis.
5. Conclusions
This study identified and analyzed the MADS-box gene family in ginseng, referred to as the PgMADS gene family. A total of 162 transcripts spliced from 57 PgMADS genes were identified and their structural characteristics, evolutionary background, functional roles, expression activities, and MeJA regulation were characterized for ginsenoside biosynthesis. Despite the diversity among the members of the PgMADS gene family, the PgMADS genes remain functionally coordinated by forming a co-expression network. Moreover, MeJA regulation showed that PgMADS hub genes have the role of controlling the biosynthesis of ginsenosides. The results of this study provide a broader understanding of the PgMADS genes and establish a basis for exploring the roles of PgMADS genes in various biological processes and signaling pathways, especially in the ginsenoside biosynthesis pathway in ginseng.
Supplementary Materials
The following supporting information can be downloaded at: https://www.mdpi.com/article/10.3390/plants13243574/s1, Figure S1. Variation in the functional categories of the PgMADS gene transcripts. (A) Among the four-year-old roots of 42 cultivars. (B) Among 14 tissues of a four-year-old plant. (C) Among the roots of differently aged plants; Figure S2. Co-expression network of the PgMADS gene transcripts expressed in 14 tissues. (A) The colorful balls indicate the co-expression network construction using 139 PgMADS gene transcripts. The network was constructed at a cutoff of p ≤ 5.0 × 10⁻². It consists of 139 gene nodes and 1222 edges. (B) Eleven clusters constituting the network. (C) Tendency that PgMADS gene transcripts form a network using the unknown randomly selected ginseng gene transcripts as a control: variation in number of nodes. (D) Tendency that PgMADS gene transcripts form a network using the unknown randomly selected ginseng gene transcripts as a control: variation in number of edges. (E) Statistics of variation in number of nodes in the PgMADS gene transcript network. (F) Statistics of variation in number of edges in the PgMADS gene transcript network. The 95 PgMADS gene transcripts used for statistical analysis were randomly selected from the 139 PgMADS gene transcripts with 10 replications. The 95 unknown randomly selected ginseng transcripts used as a control with 10 replications. Statistics of variation in the number of nodes and edges were analyzed using a t-test, with “*” at p ≤ 0.05; “**” at p ≤ 0.01. No mark is non-significant difference in number of nodes and edges. Error bars, standard deviation; Figure S3. (A) Analysis of network topology for various soft-thresholding powers. The left panel shows the correlation of the soft threshold with the scale-free fit index. The right panel displays the influence of soft-threshold power on mean connectivity. (B) Gene clustering tree based on hierarchical clustering of adjacency differences. (C) The number of PgMADS genes in four modules. (D) Yellow module expression levels in the roots of 42 cultivars, in 14 tissues, and in the roots at four different ages. (E) Blue module expression levels in the roots of 42 cultivars, in 14 tissues, and in the roots at four different ages. (F) Turquoise module expression levels in the roots of 42 cultivars, in 14 tissues, and in the roots at four different ages. (G) Brown module expression levels in the roots of 42 cultivars, in 14 tissues, and in roots at four different ages; Figure S4. Correlation of the expression levels of PgMADS08, PgMADS23-06, PgMADS37-01, and PgMADS37-05 with the contents of ginsenosides Rg1, Rb1, and Rd; Table S1. The PgMADS gene transcripts in ginseng and their sequences. Table S2. The genes under each subfamily in the phylogenetic tree.
Author Contributions
All authors contributed to different aspects. Conceptualization of the project, M.Z. (Meiping Zhang) and Y.W.; methodology, K.S.L., D.W., S.L., R.L. and C.W.; software, Y.J. and A.W.; Formal analysis, K.S.L. and L.L.; validation and data curation, K.W., M.Z. (Mingzhu Zhao) and P.C.; writing-original draft preparation, K.S.L.; supervision and fund acquisition, Y.W. and M.Z. (Mingzhu Zhao). All authors have read and agreed to the published version of the manuscript.
Funding
The research was funded by the Department of Science and Technology of Jilin Province (20240402046GH, 20240101227JC) and the Jilin Agricultural University Technical Services Programme of Natural Sciences (20240027, 20230143).
Data Availability Statement
The datasets used for this study are available in the Sequence Read Archive (SRA) of National Center for Biotechnology Information (NCBI), BioProject PRJNA302556; and in the Gene Expression Omnibus (GEO) of NCBI, SRP066368, and SRR13131364–SRR13131405. All plant materials are available from the corresponding author on request.
Conflicts of Interest
The authors declare no conflicts of interest.
Abbreviations
The following abbreviations are used in this manuscript:
| MADS | Mini chromosome maintenance 1, AGAMOUS, DEFICIENS, Serum Response Factor |
| PgMADS | Panax ginseng MADS |
| GO | Gene ontology |
| MF | Molecular function |
| BP | Biological process |
| CC | Cellular component |
| MeJA | Methyl jasmonate |
| PgNBS | Panax ginseng nucleotide binding site |
| PgRLK | Panax ginseng Receptor-like kinase |
| PgCYP | Panax ginseng Cytochrome P450 |
| PgbHLH | Panax ginseng Basic helix-loop-helix |
References
- Nocerino, E.; Amato, M.; Izzo, A.A. The aphrodisiac and adaptogenic properties of ginseng. Fitoterapia 2000, 71, S1–S5. [Google Scholar] [CrossRef]
- Park, J.D.; Rhee, D.K.; Lee, Y.H. Biological activities and chemistry of saponins from Panax ginseng C.A. Meyer. Phytochem. Rev. 2005, 4, 159–175. [Google Scholar] [CrossRef]
- Tiwari, R.; Rana, C.S. Plant secondary metabolites: A review. Int. J. Eng. Res. Gen. Sci. 2015, 3, 661–670. [Google Scholar]
- Kim, Y.J.; Zhang, D.; Yang, D.C. Biosynthesis and biotechnological production of ginsenosides. Biotechnol. Adv. 2015, 33, 717–735. [Google Scholar] [CrossRef]
- Zhang, X.; Wang, Q.; Yang, S.; Lin, S.; Bao, M.; Bendahmane, M.; Wu, Q.; Wang, C.; Fu, X. Identification and characterization of the mads-box genes and their contribution to flower organ in carnation (Dianthus caryophyllus L.). Genes 2018, 9, 193. [Google Scholar] [CrossRef]
- Passmore, S.; Maine, G.T.; Elble, R.; Christ, C.; Tye, B.K. Saccharomyces cerevisiae protein involved in plasmid maintenance is necessary for mating of MATα Cells. J. Mol. Biol. 1988, 204, 593–606. [Google Scholar] [CrossRef] [PubMed]
- Yanofsky, M.F.; Ma, H.; Bowman, J.L.; Drews, G.N.; Feldmann, K.A.; Meyerowitz, E.M. The protein encoded by the Arabidopsis homeotic gene agamous resembles transcription factors. Nature 1990, 346, 35–39. [Google Scholar] [CrossRef] [PubMed]
- Schwarz-Sommer, Z.; Huijser, P.; Nacken, W.; Saedler, H.; Sommer, H. Genetic control of flower development by homeotic genes in Antirrhinum majus. Science 1990, 250, 931–936. [Google Scholar] [CrossRef] [PubMed]
- Norman, C.; Runswick, M.; Pollock, R.; Treisman, R. Isolation and properties of cDNA clones encoding SRF, a transcription factor that binds to the c-fos serum response element. Cell 1988, 55, 989–1003. [Google Scholar] [CrossRef]
- Zhang, X.; Fatima, M.; Zhou, P.; Ma, Q.; Ming, R. Analysis of MADS-box genes revealed modified flowering gene network and diurnal expression in pineapple. BMC Genom. 2020, 21, 8. [Google Scholar] [CrossRef]
- Zhu, L.; Zhao, M.; Chen, M.; Li, L.; Jiang, Y.; Liu, S.; Jiang, Y.; Wang, K.; Wang, Y.; Sun, C.; et al. The bHLH gene family and its response to saline stress in Jilin ginseng, Panax ginseng C.A. Meyer. Mol. Genet. Genom. 2020, 295, 877–890. [Google Scholar] [CrossRef]
- Kang, H.-G.; An, G. Isolation and characterization of a rice MADS Box gene belonging to the GL2 gene family. Mol. Cells 1997, 7, 45–51. [Google Scholar] [CrossRef] [PubMed]
- Fornara, F.; Pařenicová, L.; Falasca, G.; Pelucchi, N.; Masiero, S.; Ciannamea, S.; Lopez-Dee, Z.; Altamura, M.M.; Colombo, L.; Kater, M.M. Functional characterization of OsMADS18, a member of the AP1/SQUA subfamily of MADS box genes. Plant Physiol. 2004, 135, 2207–2219. [Google Scholar] [CrossRef]
- Zhang, J.; Hu, Z.; Yao, Q.; Guo, X.; Nguyen, V.; Li, F.; Chen, G. A tomato MADS-box protein, SlCMB1, regulates ethylene biosynthesis and carotenoid accumulation during fruit ripening. Sci. Rep. 2018, 8, 3413. [Google Scholar] [CrossRef] [PubMed]
- Kim, Y.S.; Lee, H.S.; Lee, M.H.; Yoo, O.J.; Liu, J.R. A MADS box gene homologous to AG is expressed in seedlings as well as in flowers of ginseng. Plant Cell Physiol. 1998, 39, 836–845. [Google Scholar] [CrossRef] [PubMed][Green Version]
- Ding, Z.; Xu, T.; Zhu, W.; Li, L.; Fu, Q. A MADS-box transcription factor FoRlm1 regulates aerial hyphal growth, oxidative stress, cell wall biosynthesis and virulence in Fusarium oxysporum f. sp. cubense. Fungal Biol. 2020, 124, 183–193. [Google Scholar] [CrossRef]
- Ma, W.; Liu, W.; Hou, W.; Sun, S.; Jiang, B.; Han, T.; Feng, Y.; Wu, C. GmNMH7, a MADS-box transcription factor, inhibits root development and nodulation of soybean (Glycine max [L.] Merr.). J. Integr. Agric. 2019, 18, 553–562. [Google Scholar] [CrossRef]
- Yin, W.; Hu, Z.; Hu, J.; Zhu, Z.; Yu, X.; Cui, B.; Chen, G. Tomato (Solanum lycopersicum) MADS-box transcription factor SlMBP8 regulates drought, salt tolerance and stress-related genes. Plant Growth Regul. 2017, 83, 55–68. [Google Scholar] [CrossRef]
- Yin, R.; Zhao, M.; Wang, K.; Lin, Y.; Wang, Y.; Sun, C.; Wang, Y.; Zhang, M. Functional differentiation and spatial-temporal co-expression networks of the NBS-encoding gene family in Jilin ginseng, Panax ginseng C.A. Meyer. PLoS ONE 2017, 12, e0181596. [Google Scholar] [CrossRef] [PubMed]
- Lin, Y.; Wang, K.; Li, X.; Sun, C.; Yin, R.; Wang, Y.; Wang, Y.; Zhang, M. Evolution, functional differentiation, and co-expression of the RLK gene family revealed in Jilin ginseng, Panax ginseng C.A. Meyer. Mol. Genet. Genom. 2018, 293, 845–859. [Google Scholar] [CrossRef] [PubMed]
- Wang, Y.; Li, X.; Lin, Y.; Wang, Y.; Wang, K.; Sun, C.; Lu, T.; Zhang, M. Structural variation, functional differentiation, and activity correlation of the cytochrome P450 gene superfamily revealed in ginseng. Plant Genome 2018, 11, 170106. [Google Scholar] [CrossRef] [PubMed]
- Qu, Y.; Bi, C.; He, B.; Ye, N.; Yin, T.; Xu, L.A. Genome-wide identification and characterization of the MADS-box gene family in Salix Suchowensis. PeerJ 2019, 7, e8019. [Google Scholar] [CrossRef] [PubMed]
- Becker, A.; Theißen, G. The major clades of MADS-box genes and their role in the development and evolution of flowering plants. Mol. Phylogenetics Evol. 2003, 29, 464–489. [Google Scholar] [CrossRef]
- Pařenicová, L.; De Folter, S.; Kieffer, M.; Horner, D.S.; Favalli, C.; Busscher, J.; Cook, H.E.; Ingram, R.M.; Kater, M.M.; Davies, B.; et al. Molecular and phylogenetic analyses of the complete MADS-box transcription factor family in Arabidopsis: New openings to the MADS world. Plant Cell 2003, 15, 1538–1551. [Google Scholar] [CrossRef]
- Ma, J.; Yang, Y.; Luo, W.; Yang, C.; Ding, P.; Liu, Y.; Qiao, L.; Chang, Z.; Geng, H.; Wang, P.; et al. Genome-wide identification and analysis of the MADS-box gene family in bread wheat (Triticum aestivum L.). PLoS ONE 2017, 12, e0181443. [Google Scholar] [CrossRef] [PubMed]
- Wang, Y.; Zhang, J.; Hu, Z.; Guo, X.; Tian, S.; Chen, G. Genome-wide analysis of the MADS-box transcription factor family in Solanum Lycopersicum. Int. J. Mol. Sci. 2019, 20, 2961. [Google Scholar] [CrossRef] [PubMed]
- Wei, M.; Wang, Y.; Pan, R.; Li, W. Genome-wide identification and characterization of MADS-box family genes related to floral organ development and stress resistance in Hevea Brasiliensis Müll. Arg. Forests 2018, 9, 304. [Google Scholar] [CrossRef]
- Zhang, L.; Zhao, J.; Feng, C.; Liu, M.; Wang, J.; Hu, Y. Genome-wide identification, characterization of the MADS-box gene family in Chinese jujube and their involvement in flower development. Sci. Rep. 2017, 7, 1025. [Google Scholar] [CrossRef]
- Wang, M.; Chen, B.; Zhou, W.; Xie, L.; Wang, L.; Zhang, Y.; Zhang, Q. Genome-wide identification and expression analysis of the AT-hook motif nuclear localized gene family in Soybean. BMC Genom. 2021, 22, 361. [Google Scholar] [CrossRef]
- Theissen, G.; Becker, A.; Di Rosa, A.; Kanno, A.; Kim, J.T.; Münster, T.; Winter, K.U.; Saedler, H. A short history of MADS-box genes in plants. Plant Mol. Biol. 2000, 42, 115–149. [Google Scholar] [CrossRef] [PubMed]
- Qing, J.; Du, Q.; Meng, Y.; Liu, P.; Du, H.; Wang, L. Genome-wide identification and expression pattern analysis of the ribonuclease T2 family in Eucommia ulmoides. Sci. Rep. 2021, 11, 6900. [Google Scholar] [CrossRef] [PubMed]
- Li, W.; Geng, Z.; Zhang, C.; Wang, K.; Jiang, X. Whole-genome characterization of Rosa chinensis AP2/ERF transcription factors and analysis of negative regulator RcDREB2B in Arabidopsis. BMC Genom. 2021, 22, 90. [Google Scholar] [CrossRef] [PubMed]
- Zhao, T.; Ni, Z.; Dai, Y.; Yao, Y.; Nie, X.; Sun, Q. Characterization and expression of 42 MADS-box genes in wheat (Triticum aestivum L.). Mol. Genet. Genom. 2006, 276, 334–350. [Google Scholar] [CrossRef]
- Rounsley, S.D.; Ditta, G.S.; Yanofsky, M.F. Diverse roles for MADS box genes in Arabidopsis development. Plant Cell 1995, 7, 1259–1269. [Google Scholar] [CrossRef] [PubMed]
- Jack, T.; Brockman, L.L.; Meyerowitz, E.M. The homeotic gene APETALA3 of Arabidopsis thaliana encodes a MADS box and is expressed in petals and stamens. Cell 1992, 68, 683–697. [Google Scholar] [CrossRef]
- Serivichyaswat, P.; Ryu, H.S.; Kim, W.; Kim, S.; Chung, K.S.; Kim, J.J.; Ahn, J.H. Expression of the floral repressor miRNA156 is positively regulated by the AGAMOUS-like proteins AGL15 and AGL18. Mol. Cells 2015, 38, 259–266. [Google Scholar] [CrossRef] [PubMed]
- Liu, C.; Lv, T.; Shen, Y.; Liu, T.; Liu, M.; Hu, J.; Liu, S.; Jiang, Y.; Zhang, M.; Zhao, M.; et al. Genome-wide identification and integrated analysis of TCP genes controlling ginsenoside biosynthesis in Panax ginseng. BMC Plant Biol. 2024, 24, 47. [Google Scholar] [CrossRef]
- Chen, J.; Zhou, Y.; Zhang, Q.; Liu, Q.; Li, L.; Sun, C.; Wang, K.; Wang, Y.; Zhao, M.; Li, H.; et al. Structural variation, functional differentiation and expression characteristics of the AP2/ERF gene family and its response to cold stress and methyl jasmonate in Panax ginseng C.A. Meyer. PLoS ONE 2020, 15, e0226055. [Google Scholar] [CrossRef]
- Soldati, F.; Tanaka, O. Panax ginseng: Relation between age of plant and content of ginsenosides. Planta Medica 1984, 50, 351–352. [Google Scholar] [CrossRef]
- Fang, X.; Zhou, X.; Wang, Y.; Wang, Y.; Wang, H. Transcriptional regulatory network of ginsenosides content in various ginseng cultivars. Sci. Hortic. 2023, 322, 112388. [Google Scholar] [CrossRef]
- Qi, L.W.; Wang, C.Z.; Yuan, C.S. Ginsenosides from American ginseng: Chemical and pharmacological diversity. Phytochemistry 2011, 72, 689–699. [Google Scholar] [CrossRef] [PubMed]
- Sasaki, R.; Yamane, H.; Ooka, T.; Jotatsu, H.; Kitamura, Y.; Akagi, T.; Tao, R. Functional and expressional analyses of PmDAM genes associated with endodormancy in Japanese Apricot. Plant Physiol. 2011, 157, 485–497. [Google Scholar] [CrossRef] [PubMed]
- Zhao, K.; Zhou, Y.; Ahmad, S.; Xu, Z.; Li, Y.; Yang, W.; Cheng, T.; Wang, J.; Zhang, Q. Comprehensive cloning of Prunus Mume dormancy associated MADS-box genes and their response in flower bud development and dormancy. Front. Plant Sci. 2018, 9, 17. [Google Scholar] [CrossRef]
- Elitzur, T.; Yakir, E.; Quansah, L.; Zhangjun, F.; Vrebalov, J.; Khayat, E.; Giovannoni, J.J.; Friedman, H. Banana MaMADS transcription factors are necessary for fruit ripening and molecular tools to promote shelf-life and food security. Plant Physiol. 2016, 171, 380–391. [Google Scholar] [CrossRef] [PubMed]
- Choi, H.S.; Koo, H.B.; Jeon, S.W.; Han, J.Y.; Kim, J.S.; Jun, K.M.; Choi, Y.E. Modification of ginsenoside saponin composition via the CRISPR/Cas9-mediated knockout of protopanaxadiol 6-hydroxylase gene in Panax ginseng. J. Ginseng Res. 2022, 46, 505–514. [Google Scholar] [CrossRef]
- Goodwin, P.H.; Best, M.A. Ginsenosides and Biotic Stress Responses of Ginseng. Plants 2023, 12, 1091. [Google Scholar] [CrossRef]
- Langfelder, P.; Horvath, S. WGCNA: An R package for weighted correlation network analysis. BMC Bioinform. 2008, 9, 559. [Google Scholar] [CrossRef]
- Li, L.; Wang, Y.; Zhao, M.; Wang, K.; Sun, C.; Zhu, L.; Han, Y.; Chen, P.; Lei, J.; Wang, Y.; et al. Integrative transcriptome analysis identifies new oxidosqualene cyclase genes involved in ginsenoside biosynthesis in Jilin ginseng. Genomics 2021, 113, 2304–2316. [Google Scholar] [CrossRef] [PubMed]
- Kim, O.T.; Yoo, N.H.; Kim, G.S.; Kim, Y.C.; Bang, K.H.; Hyun, D.Y.; Kim, S.H.; Kim, M.Y. Stimulation of Rg3 ginsenoside biosynthesis in ginseng hairy roots elicited by methyl jasmonate. Plant Cell Tissue Organ Cult. 2013, 112, 87–93. [Google Scholar] [CrossRef]
- Wan, S.; Xin, X.-F. Regulation and integration of plant jasmonate signaling: A comparative view of monocot and dicot. J. Genet. Genom. 2022, 49, 704–714. [Google Scholar] [CrossRef] [PubMed]
- Li, L.; Wang, K.; Zhao, M.; Li, S.; Jiang, Y.; Zhu, L.; Chen, J.; Wang, Y.; Sun, C.; Chen, P.; et al. Selection and validation of reference genes desirable for gene expression analysis by qRT-PCR in MeJA-treated ginseng hairy roots. PLoS ONE 2019, 14, e0226168. [Google Scholar] [CrossRef] [PubMed]
- Jiang, Y.; Zeng, Z.; He, G.; Liu, M.; Liu, C.; Liu, M.; Lv, T.; Wang, A.; Wang, Y.; Zhao, M.; et al. Genome-wide identification and integrated analysis of the FAR1/FHY3 gene family and genes expression analysis under methyl jasmonate treatment in Panax ginseng C.A. Mey. BMC Plant Biol. 2024, 24, 549. [Google Scholar] [CrossRef]
- Wang, K.; Jiang, S.; Sun, C.; Lin, Y.; Yin, R.; Wang, Y.; Zhang, M. The spatial and temporal transcriptomic landscapes of ginseng, Panax ginseng C.A. Meyer. Sci. Rep. 2016, 5, 18283. [Google Scholar] [CrossRef]
- Xu, J.; Chu, Y.; Liao, B.; Xiao, S.; Yin, Q.; Bai, R.; Su, H.; Dong, L.; Li, X.; Qian, J.; et al. Panax ginseng genome examination for ginsenoside biosynthesis. GigaScience 2017, 6, gix093. [Google Scholar] [CrossRef] [PubMed]
- Kim, N.H.; Jayakodi, M.; Lee, S.C.; Choi, B.S.; Jang, W.; Lee, J.; Kim, H.H.; Waminal, N.E.; Lakshmanan, M.; van Nguyen, B.; et al. Genome and evolution of the shade-requiring medicinal herb Panax ginseng. Plant Biotechnol. J. 2018, 16, 1904–1917. [Google Scholar] [CrossRef]
- Wang, Z.H.; Wang, X.F.; Lu, T.; Li, M.R.; Jiang, P.; Zhao, J.; Liu, S.T.; Fu, X.Q.; Wendel, J.F.; Van de Peer, Y.; et al. Reshuffling of the ancestral core-eudicot genome shaped chromatin topology and epigenetic modification in Panax. Nat. Commun. 2022, 13, 1902. [Google Scholar] [CrossRef]
- Finn, R.D.; Coggill, P.; Eberhardt, R.Y.; Eddy, S.R.; Mistry, J.; Mitchell, A.L.; Potter, S.C.; Punta, M.; Qureshi, M.; Sangrador-Vegas, A.; et al. The Pfam protein families’ database: Towards a more sustainable future. Nucleic Acids Res. 2016, 44, D279–D285. [Google Scholar] [CrossRef]
- Bailey, T.L.; Johnson, J.; Grant, C.E.; Noble, W.S. The MEME Suite. Nucleic Acids Res. 2015, 43, W39–W49. [Google Scholar] [CrossRef] [PubMed]
- Kumar, S.; Stecher, G.; Tamura, K.; Dudley, J. MEGA7: Molecular evolutionary genetics analysis version 7.0 for bigger datasets. Mol. Biol. Evol. 2016, 33, 1870–1874. [Google Scholar] [CrossRef]
- Chen, C.; Chen, H.; Zhang, Y.; Thomas, H.R.; Frank, M.H.; He, Y.; Xia, R. TBtools—An integrative toolkit developed for interactive analyses of big biological data. Mol. Plant 2020, 13, 1194–1202. [Google Scholar] [CrossRef] [PubMed]
- Conesa, A.; Götz, S.; García-Gómez, J.M.; Terol, J.; Talón, M.; Robles, M. Blast2GO: A universal tool for annotation, visualization and analysis in functional genomics research. Bioinformatics 2005, 21, 3674–3676. [Google Scholar] [CrossRef]
- Theocharidis, A.; van Dongen, S.; Enright, A.J.; Freeman, T.C. Network visualization and analysis of gene expression data using BioLayout Express3D. Nat. Protoc. 2009, 4, 1535–1550. [Google Scholar] [CrossRef] [PubMed]
- Choi, D.W.; Jung, J.D.; Ha, Y.I.; Park, H.W.; In, D.S.; Chung, H.J.; Liu, J.R. Analysis of transcripts in methyl jasmonate-treated ginseng hairy roots to identify genes involved in the biosynthesis of ginsenosides and other secondary metabolites. Plant Cell Rep. 2005, 23, 557–566. [Google Scholar] [CrossRef] [PubMed]
- Bae, S.-H.; Wook Han, H.; Moon, J. Functional analysis of the molecular interactions of TATA box-containing genes and essential genes. PLoS ONE 2015, 10, e0120848. [Google Scholar] [CrossRef] [PubMed]
- Yan, Y.; Yan, Z.; Zhao, G. Genome-wide identification of WRKY transcription factor family members in Miscanthus sinensis (Miscanthus sinensis Anderss). Nature 2024, 14, 5522. [Google Scholar] [CrossRef]
- Hong, J.; Ha, J.; Kang, J.; Young Kim, S. ABFs, a family of ABA-responsive element binding factors. J. Biol. Chem. 2000, 275, 1723–1730. [Google Scholar]
- Ain-Ali, Q.U.; Mushtaq, N.; Amir, R.; Gul, A.; Tahir, M.; Munir, F. Genome-wide promoter analysis, homology modeling and protein interaction network of Dehydration Responsive Element Binding (DREB) gene family in Solanum tuberosum. PLoS ONE 2021, 16, e0261215. [Google Scholar] [CrossRef] [PubMed]
- Chen, F.; Zhang, J.; Ha, X.; Ma, H. Genome-wide identification and expression analysis of the Auxin-Response factor (ARF) gene family in Medicago sativa under abiotic stress. BMC Genom. 2023, 24, 498. [Google Scholar] [CrossRef] [PubMed]
- Wang, Q.; Lu, X.; Chen, X.; Zhao, L.; Han, M.; Wang, S.; Zhang, Y.; Fan, Y.; Ye, W. Genome-wide identification and function analysis of HMAD gene family in cotton (Gossypium spp.). BMC Plant Biol. 2021, 21, 386. [Google Scholar] [CrossRef]
- Zhang, M.; Cheng, W.; Wang, J.; Cheng, T.; Zhang, Q. Genome-wide identification, evolution, and expression analysis of GASA gene family in Prunus mume. Int. J. Mol. Sci. 2022, 23, 10923. [Google Scholar] [CrossRef] [PubMed]
- Jia, X.; Wang, L.; Zhao, H.; Zhang, Y.; Chen, Z.; Xu, L.; Yi, K. The origin and evolution of salicylic acid signaling and biosynthesis in plants. Mol. Plant 2023, 16, 245–259. [Google Scholar] [CrossRef] [PubMed]
- Hsu, B.Y.; Jen, C.T.; Inbaraj, B.S.; Chen, B.H. A comparative study on analysis of ginsenosides in American ginseng root residue by HPLC-DAD-ESI-MS and UPLC-HRMS-MS/MS. Molecules 2022, 27, 3071. [Google Scholar] [CrossRef] [PubMed]
- Christensen, L.P. Chapter 1 Ginsenosides: Chemistry, Biosynthesis, Analysis, and Potential Health Effects. In Advances in Food and Nutrition Research; Academic Press: Cambridge, MA, USA, 2008; Volume 55, pp. 1–99. [Google Scholar]


Disclaimer/Publisher’s Note: The statements, opinions and data contained in all publications are solely those of the individual author(s) and contributor(s) and not of MDPI and/or the editor(s). MDPI and/or the editor(s) disclaim responsibility for any injury to people or property resulting from any ideas, methods, instructions or products referred to in the content. |
© 2024 by the authors. Licensee MDPI, Basel, Switzerland. This article is an open access article distributed under the terms and conditions of the Creative Commons Attribution (CC BY) license (https://creativecommons.org/licenses/by/4.0/).