Abstract
Flowering is initiated in response to environmental cues, with the photoperiod and ambient temperature being the main ones. The regulatory pathways underlying floral transition are well studied in Arabidopsis thaliana but remain largely unknown in legumes. Here, we first applied an in silico approach to infer the regulatory inputs of four FT-like genes of the narrow-leafed lupin Lupinus angustifolius. We studied the roles of FTc1, FTc2, FTa1, and FTa2 in the activation of meristem identity gene AGL8 in response to 8 h and 16 h photoperiods, vernalization, and the circadian rhythm. We developed a set of regression models of AGL8 regulation by the FT-like genes and fitted these models to the recently published gene expression data. The importance of the input from each FT-like gene or their combinations was estimated by comparing the performance of models with one or few FT-like genes turned off, thereby simulating loss-of-function mutations that were yet unavailable in L. angustifolius. Our results suggested that in the early flowering Ku line and intermediate Pal line, the FTc1 gene played a major role in floral transition; however, it acted through different mechanisms under short and long days. Turning off the regulatory input of FTc1 resulted in substantial changes in AGL8 expression associated with vernalization sensitivity and the circadian rhythm. In the wild ku line, we found that both FTc1 and FTa1 genes had an essential role under long days, which was associated with the vernalization response. These results could be applied both for setting up new experiments and for data analysis using the proposed modeling approach.
1. Introduction
Flowering is controlled by a large number of signaling pathways providing the developmental regulation and response to environmental conditions. Major factors affecting the timing of floral transition include the photoperiod and vernalization [1,2].
The detailed mechanisms of flowering regulation have been revealed in Arabidopsis thaliana [3,4]. The main floral activator and integrator of various signaling pathways is the FLOWERING LOCUS T (FT) gene, whose expression is turned on in response to environmental signals in leaves. The small mobile FT protein moves through the phloem to the shoot apex, where in complex with the transcription factor FD, it activates meristem identity genes such as APETALA1 (AP1), LEAFY (LFY), and FRUITFULL (FUL) [5,6,7] (Figure 1). Meristem identity genes control the formation of floral organs [8]. The major regulators of photoperiod and vernalization in Arabidopsis are CONSTANS (CO) [9,10] and FLOWERING LOCUS C (FLC) [11], whose protein products bind directly to the promoter region and first intron of the FT gene, respectively [12,13,14]. In the non-inductive conditions, FLC represses FT in a complex with SHORT VEGETATIVE PHASE (SVP) [15]. The vernalization treatment switches the mechanism of FLC silencing, leading to FT de-repression, which becomes activated by the CO protein. CO is also responsible for the circadian clock control, resulting in the rhythmic expression of FT during the day time [12,16,17]. FT-like genes promote flowering in most plant species [18,19].

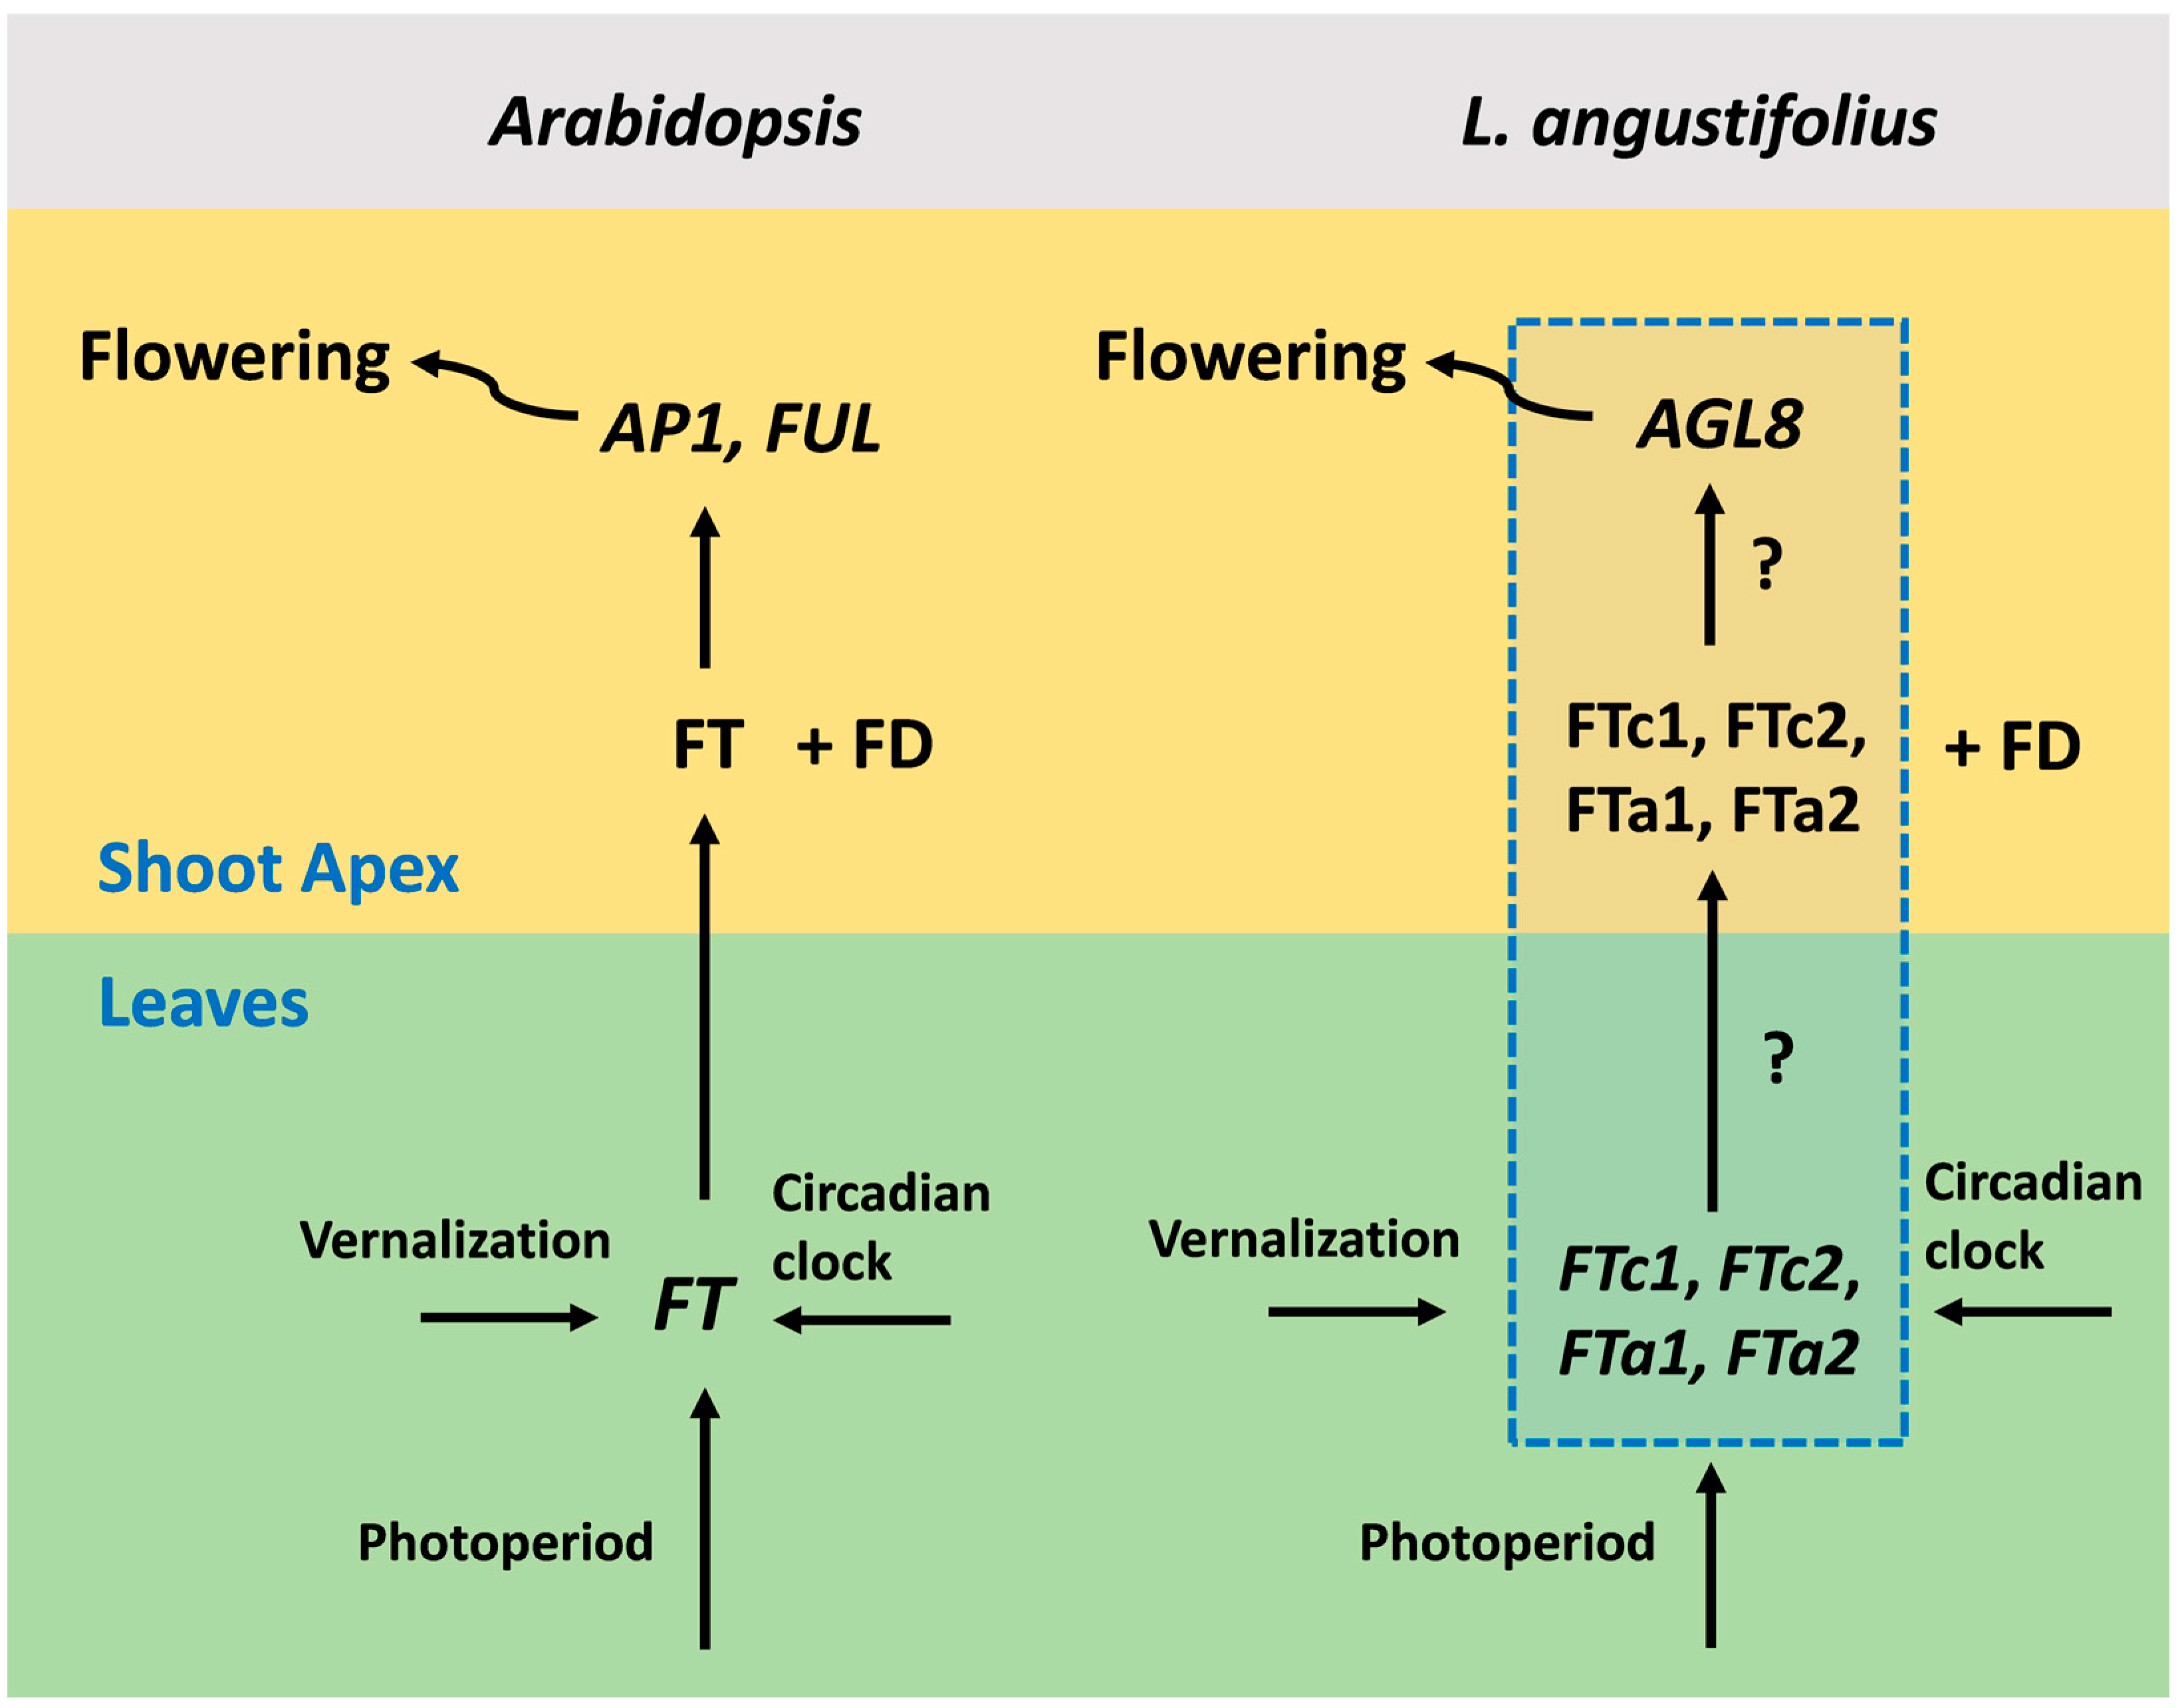
Figure 1.
A general scheme of flowering initiation in Arabidopsis thaliana and a putative network in the narrow-leafed lupin Lupinus angustifolius. In Arabidopsis, the expression of the FT gene is activated in the leaves by the photoperiod and vernalization pathways. Next, the FT protein becomes expressed in the shoot apical meristem, where in complex with the transcription factor FD, it activates meristem identity genes, including AP1 and FUL. Meristem identity genes, in turn, activate pathways responsible for the formation of floral organs. L. angustifolius has four FT gene orthologues, which are FTc1, FTc2, FTa1, and FTa2. The mechanisms of FT-like gene activation by environmental signals and the involvement of each FT-like gene in the regulation of meristem identity genes are still unknown (shown in the blue dotted box). AGL8 is the L. angustifolius orthologue of the Arabidopsis AP1 and FUL genes and a putative target of FT-like genes.
In legumes, the mechanisms of flowering induction in response to environmental signals appear to be more complex than in Arabidopsis for several reasons. First, orthologs of the FLC and CO integrator genes are absent or inactive in vernalization-sensitive legume species [20,21]. Secondly, the genomes of temperate legumes contain four to six FT-like genes, grouped into three subclades, namely FTa, FTb, and FTc [22]. Although the upstream regulators of the FT-like genes have not yet been identified in many legume species, multiple studies have suggested that these genes are the major targets of vernalization and photoperiod signals [23,24,25]. However, the mechanisms by which several FT-like genes act as floral integrators also remain largely unexplored. It has been shown that the FT-like genes in legumes differ in their function, with one or two genes being most critical in their regulatory role. For example, in Medicago trancatula, these genes are FTa1 and FTb1, and in Pisum sativum, FTb2 and FTa1 [22,23].
The narrow-leafed lupin Lupinus angustifolius is a valuable legume crop with high grain protein content and substantial contribution to soil improvement. It has four FT-like genes, which are FTa1, FTa2, FTc1, and FTc2 [24]. The major gene responsible for the vernalization-induced flowering in L. angustifolius is FTc1 [24,26]. The natural mutations that occurred in this locus during the domestication period resulted in early flowering and loss of vernalization insensitivity. Two deletions in cultivated varieties encompassing 1423 bp and 5162 bp of the LanFTc1 promoter region were named as Ku and Jul, respectively, while the wild allele having intermediate phenology and carrying 1208 bp deletion was named as Pal. The wild allele (ku) without a mutation retained vernalization responsiveness and flowered late [21,26].
The recently published L. angustifolius dataset [21] includes the expression of four FT-like genes and their putative target AGL8, whose protein sequence revealed the highest similarity to A. thaliana FUL/AGL8 (AT5G60910) and AP1 (AT1G69120) genes [21]. The expression data varied with respect to vernalization, the photoperiod, and circadian clock. The data were obtained for three alleles (Ku, Pal, and ku) having different flowering times and vernalization sensitivity. This set of genes can provide a complete description of the flowering initiation, since each of them acts as an integrator of a large number of signaling pathways. Thus, the expression of each integrator reflects the influence of many genes (Figure 1). Such a “hub” approach has been earlier applied in multiple modeling studies that inferred regulatory interactions underlying floral transition [27]. Thus, we used this dataset to model the influence of vernalization, the photoperiod, and circadian rhythm on flowering initiation in the narrow-leafed lupin.
The mathematical modeling of gene networks is a powerful tool to predict regulatory mechanisms based on the dynamics of gene expression. Earlier studies on modeling floral transition in plants were mainly conducted in Arabidopsis [28,29,30,31]. A number of publications have presented in silico analyses of flowering networks in pea (P. sativum) [32], chickpea (Cicer arietinum) [33], and M. trancatula [34]. However, none of the previously published models of floral transition networks in legumes considered the effect of vernalization under different photoperiod lengths and times of day.
The following questions remain unanswered: (1) if there is a “major” vernalization response gene, do other FT-like genes play any role in vernalization-induced flowering? (2) How does each FT-like gene regulate meristem identity genes? (3) How does the regulation by FT-like genes vary with respect to the photoperiod, vernalization, and circadian clock? (4) How do the regulatory mechanisms change in the accessions with different flowering times and vernalization sensitivities? Each question is common to all legumes and none of these issues have yet been studied in detail.
In this paper, we constructed a set of linear regression models to predict the regulatory mechanisms of flowering initiation in L. angustifolius. First, we selected the best model structure of AGL8 regulation by FT-like genes. Next, we applied this model to experimental data and considered expression patterns of AGL8 resulting from its activation by different combinations of FT-like genes. We excluded the regulatory inputs of FT-like genes one by one and evaluated the AGL8 patterns in the models based on (1) the cost function values, (2) specific discrepancies between gene expression patterns in the model and experiment, and (3) values of the regulatory parameters.
Our models showed that in the early flowering L. angustifolius Ku line and in the Pal line with intermediate phenology, turning off the regulatory input of FTc1 resulted in changes in AGL8 expression associated with vernalization sensitivity and circadian rhythm, which differed between short and long days. In the wild ku line, FTa1 and FTc1 genes played the most prominent role during long days, which was dependent on vernalization. Our models did not predict any specific function of FTa2 and FTc2 genes in AGL8 regulation in all L. angustifolius lines.
Overall, here we first used mathematical modeling to predict regulatory interactions underlying an influence of vernalization and the photoperiod on floral induction in the narrow-leafed lupin. The suggested approach can be applied to other legume species once the experimental data become available.
2. Results
2.1. Selection of Model Structure for AGL8 Regulation
Our aim was to test how FT-like genes might contribute to AGL8 activation in the narrow-leafed lupin using gene expression data models. The data included the relative mRNA concentrations of five L. angustifolius genes (FTa1, FTa2, FTc1, FTc2, and AGL8) in the following three lines: the line carrying the domesticated early flowering FTc1 allele (Ku), the line carrying the wild allele ku, and the line carrying the Pal allele, which is an intermediate between the domesticated and wild lines [21]. The data were obtained for 8 h (SD) and 16 h (LD) photoperiods with and without vernalization at two time points during the day, at 9 A.M. and 3 P.M. for SD and 7 A.M. and 6 P.M. for LD (see “Materials and Methods”) [21]).
An important problem in modeling is finding a balance between the complexity of the model structure, expressed, for example, in the number of free parameters, and the level of data diversity, expressed in data type and amount. Too complex models are prone to overfitting, while too simple ones may not be useful for testing meaningful hypotheses about underlying mechanisms. We utilized linear regression as a modeling framework that is simple and suitable for the available data and discarded modeling based on ordinary differential equations due to poor temporal resolution. Therefore, the AGL8 expression level was represented as a linear combination of the FT-like gene expression levels at each time point. AGL8 expression in the model was fitted to that in the data by minimizing the cost function F (see “Materials and Methods”).
The simplest model of AGL8 regulation (Model 1) was formulated under the assumption that FT-like genes have the same regulatory parameters:
where constants ci can be interpreted as regulatory parameters, with c0 including the contribution of non-FT factors to the regulation of AGL8 and c1 reflecting the cumulative regulatory inputs of all FT-like genes.
The basal expression level quantified by the coefficient c0 should adequately represent different conditions in the data, so it was assumed to take different values for different conditions (vernalization conditions and circadian rhythm). Since the focus of our study was on the FT-like genes in L. angustifolius lines with different vernalization sensitivities, we also allowed c1 to vary between vernalized and non-vernalized conditions. We examined that this assumption on c1 was informative by comparing the model performance on the SD expression data with and without this assumption. As an additional test, we calculated the model performance on data under the assumption that c1 varied between the morning and the evening data. Results showed that variation in c1 across vernalization conditions substantially improved the model performance for the intermediate Pal line, which partially retains vernalization sensitivity, and it was not so effective for the vernalization-insensitive Ku line (Supplementary Figure S1). Moreover, variation in c1 across times of the day did not produce an essential difference in the model performance on the expression data of both lines. Therefore, implementing different vernalization conditions via the variation in parameter c1 for these conditions was informative and thus was kept in all models considered in the study.
As alternatives to Model 1, we also tested two models with separate regulatory parameters for different FT-like genes.
In Model 2, the gene was singled out as the “major” regulator, while , , and had the same regulatory parameters:
In Model 3, all FT genes had their own regulatory parameters:
Models 2 and 3 are convenient for testing hypotheses about different regulatory roles of FT-like genes in AGL8 regulation, but whether we can use them depends on whether these models outperform Model 1 on data considering different numbers of free parameters in the models.
To select the best model structure, we fitted Models 1–3 to experimental data from the 8 h dataset with and without vernalization collected at different times of the day. At this step, we considered only SD data, since the LD data had only 2–3 points in dynamics, which was not enough for rigorous model comparison.
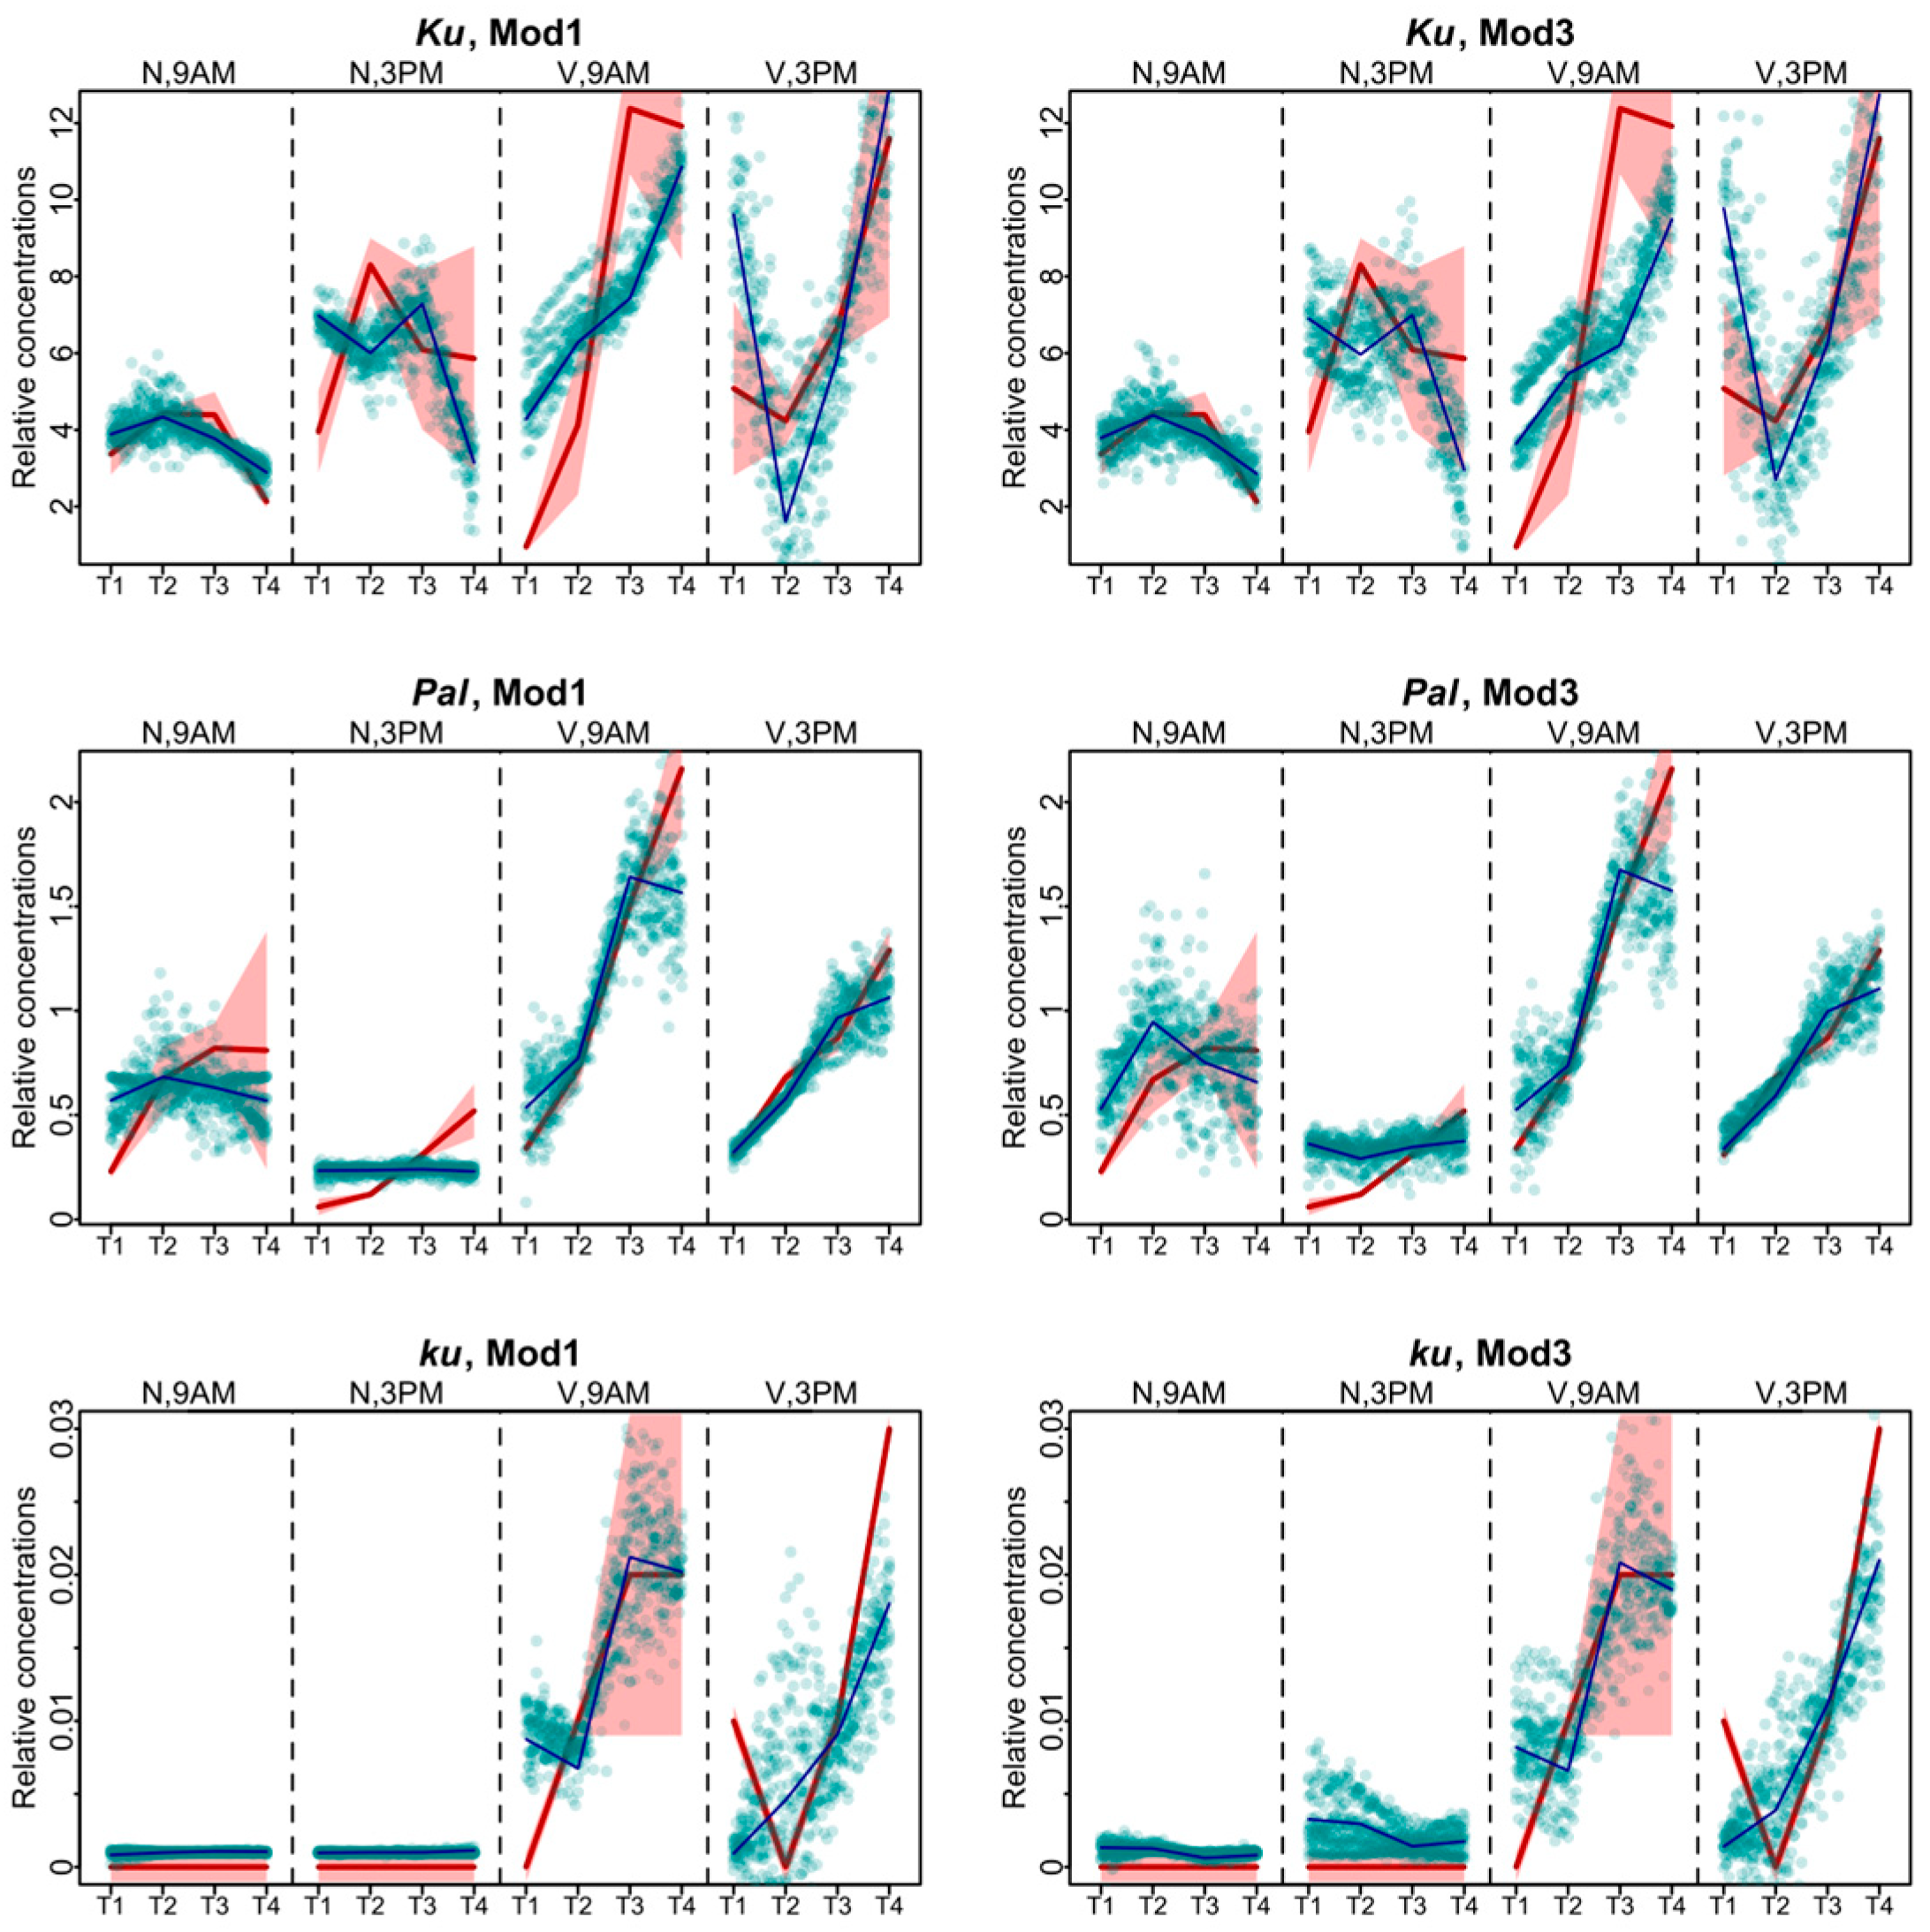
The models produced largely similar fits (Figure 2), with the best values of the cost function being in Models 1 and 3 (Figure 3). For the Ku line, the solutions of these two models differed mostly for the vernalized data. The solution of Model 1 was closer to experimental data at 9 A.M., while Model 3 better reproduced the data at 3 P.M. For Pal, the fits differed mostly in the non-vernalized data, with Model 1 exhibiting the more relevant dynamics. For the ku line, differences between the two models were observed at 3 P.M. At that time, Model 1 performed better for the data without vernalization, while Model 3 for the vernalized data (Figure 2).

Figure 2.
Data fitting results for Models 1 and 3, which show the lowest values of the cost function. Averaged dynamics and standard deviation of the experimental data are shown in red, and the model solutions (averaged over 1000 runs) are shown in black. Green dots represent the simulation results from 10 randomly chosen runs of the minimization process. “N” and “V” stand for non-vernalized and vernalized data, respectively. “9 A.M.” and “3 P.M.” are the times of the day when the data were collected. T1–T4 stand for sampling terms [21].
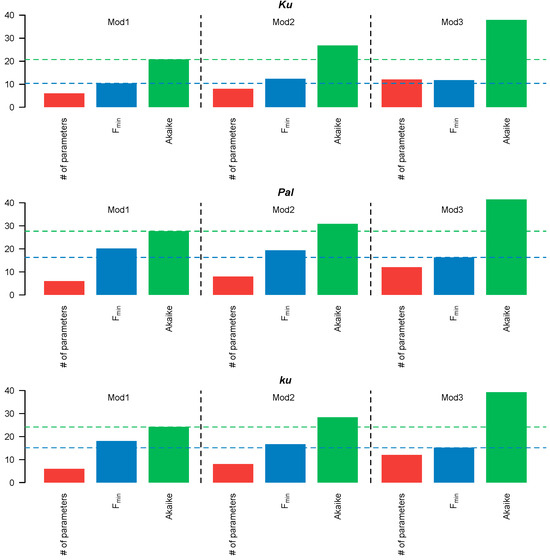
Figure 3.
Number (#) of free parameters (red), minimal cost function value Fmin (blue), and AIC value (green) for Models 1–3. The blue and green dotted lines correspond to the minimum values of the cost function and AIC, respectively.
Since Models 1–3 had different numbers of free parameters, we compared their performance using the Akaike information criterion (AIC), which accounts for both the fitting quality and the number of free parameters. The simplest, Model 1, in which all FT-like genes acted cumulatively, exhibited the lowest AIC values across all L. angustifolius lines (Figure 3). Therefore, the more complicated structures of Models 2–3 were not justified, so we selected Model 1 for further analysis.
2.2. Modeling Regulatory Inputs of FT-like Genes to AGL8 Activation
To predict the importance of each FT-like gene in AGL8 activation, we conducted a number of numerical experiments. We designed a set of models based on the selected Model 1 by excluding one or several FT-like genes from the total sum over FT-like genes in the model equation. Depending on which FT-like genes were excluded, these models aimed to test the following hypotheses:
Hypothesis H0.
all FT-like genes are involved in AGL8 regulation (pure Model 1).
Hypothesis H1.
FTa2 is not involved in AGL8 regulation:
Hypothesis H2.
FTa1 is not involved in AGL8 regulation:
Hypothesis H3.
FTc2 is not involved in AGL8 regulation:
Hypothesis H4.
FTc1 is not involved in AGL8 regulation:
Hypothesis H5.
AGL8 expression can be explained solely by the regulation of the FTc1 gene:
Since all these models had the same number of parameters, we evaluated how they fit to experimental data according to the cost function values (Figure 4). If the exclusion of an FT-like gene from the model led to a substantial decrease in the model performance on the AGL8 expression data, that would suggest the importance of this gene in AGL8 regulation.

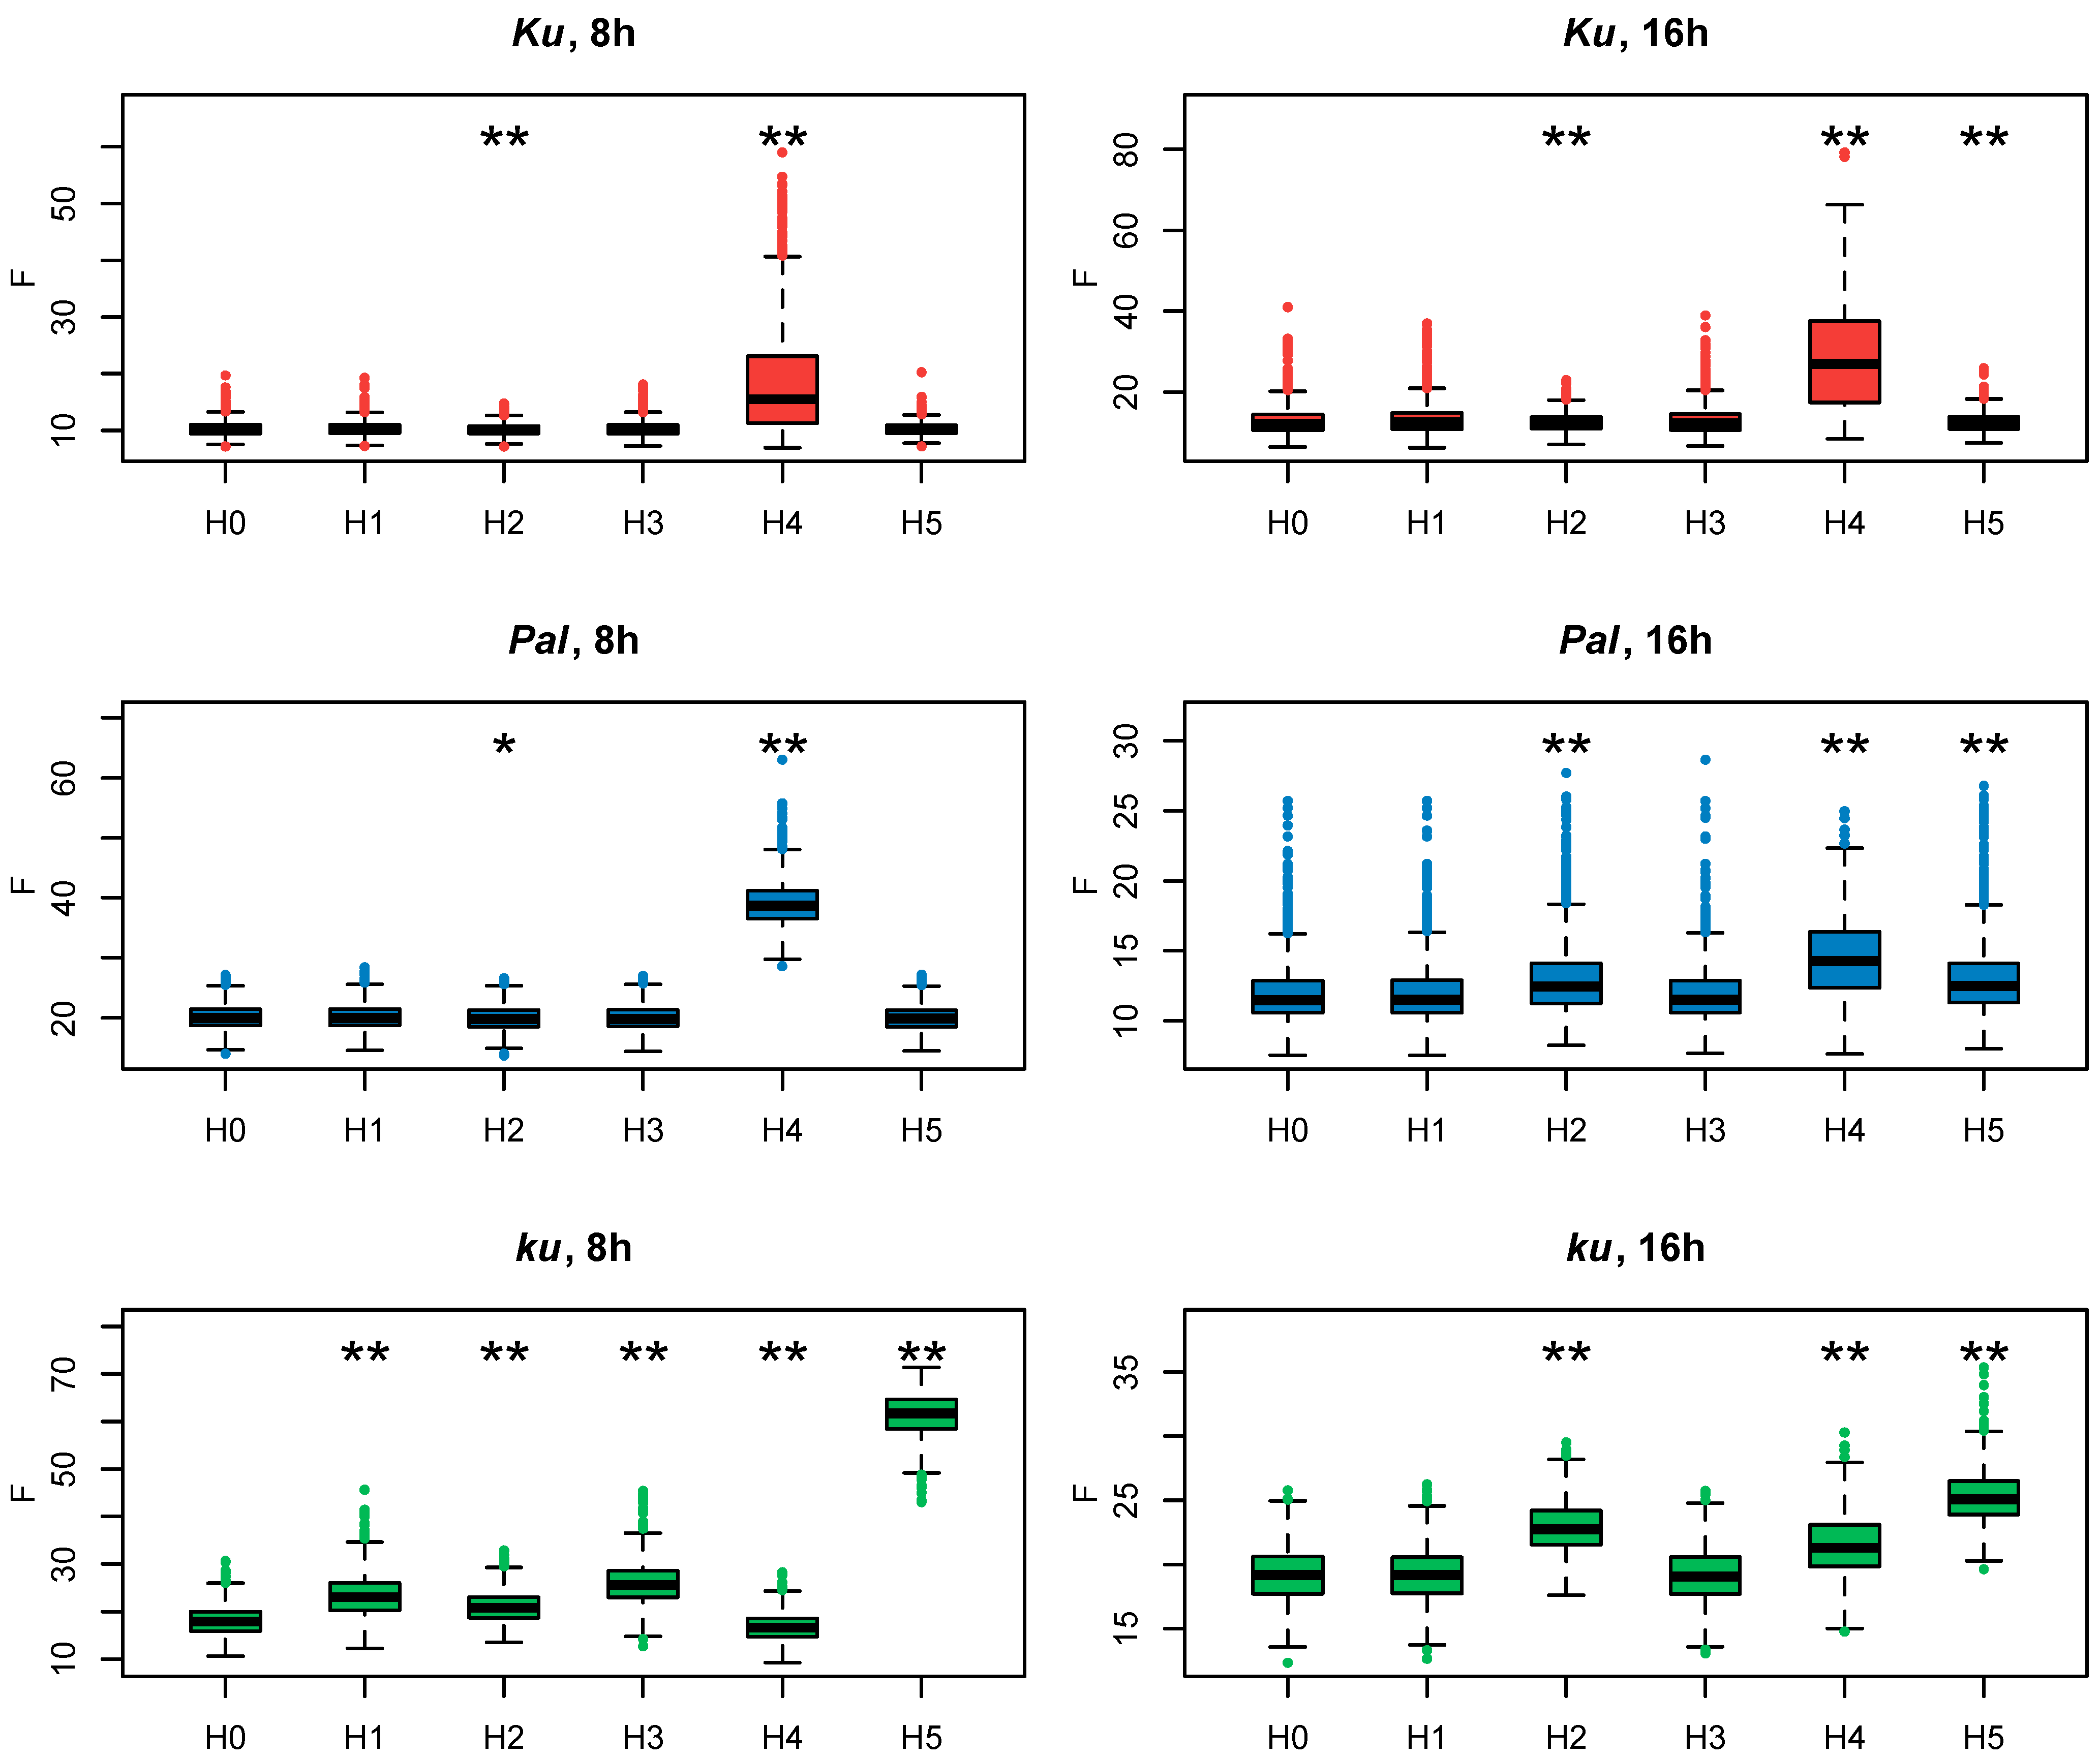
Figure 4.
Cost function values (F) from 1000 minimization runs in Model 1 under hypotheses H0–5 for three L. angustifolius lines. Asterisks indicate statistically significant differences in the mean F between Hi (i = 1…5) and H0 (* p < 0.05, ** p < 0.01). The labels 8 h and 16 h are SD and LD photoperiods, respectively.
2.2.1. Analysis of AGL8 Regulation for 8 h Photoperiod
To understand which FT-like gene mostly affects AGL8 regulation, we compared the cost function values of Models H1–H5 with that of Model 1 under the null hypothesis H0 (Model H0).
In Ku and Pal lines, the F values of Models H1, H3, H5, and H0 did not differ significantly (Figure 4). A small but statistically significant difference was detected between the F values of Model H2, where FTa1 was excluded from AGL8 regulation, and Model H0. A substantially increased value of the cost function was produced only in Model H4, without the input of FTc1, which suggested the importance of this gene in this case. Interestingly, regulation by FTc1 alone (Model H5) did not affect AGL8 expression in Ku and Pal, showing that this gene could act as a sole activator of AGL8 (Figure 4) On the contrary, in the late flowering vernalization-sensitive ku line, Model H5 produced the worst fits, while Model H4 had the same fit quality as H0. In the ku line, we detected the statistical difference between the values of the cost function of Models H1–4 and Model H0, but their mean values were not essentially different from that in Model H0 (Figure 4).
These results demonstrated that under the short days in the Ku and Pal lines, AGL8 activation mostly depended on FTc1, while in the wild ku line, FTc1 was unable to fully provide AGL8 activation without an input from other FT genes.
2.2.2. Analysis of AGL8 Regulation for 16 h Photoperiod
As in the models for short days, in the case of the 16 h photoperiod data for the Ku and Pal lines, the highest value of the cost function was found in Model H4 (Figure 4). In the Pal line, there was a statistically significant difference in the cost function value between Model H0 and Models H2 and H5, suggesting the involvement of more FT-like genes in the AGL8 regulation under LD. In the Ku line, the cost function values of Models H0, H2, and H5 were very similar, despite the small p-value (Figure 4). Thus, in the Ku and Pal lines, the exclusion of FTc1 from AGL8 regulation mostly affected the F values under both 8 h and 16 h photoperiods.
In contrast, for the wild ku line, our models suggested different regulations between short and long days. In both photoperiods, the fits in Model H5 were much worse than in Model H0. However, in contrast to SD, the cost function values of Models H2 and H5 also showed a statistically significant difference and had substantially higher values than in Model H0 (Figure 4). Thus, our models suggested that the FTa1 and FTc1 genes played an essential role in AGL8 regulation in the ku line under the 16 h photoperiod.
2.2.3. AGL8 Pattern Defects in Models Vary with Respect to Vernalization and Circadian Rhythm
Another way to investigate the influence of FT-like genes within the framework of Model 1 is to analyze specific defects in model solutions and compare these defects across the models with all FT-like genes present and with some FT-like genes excluded. Therefore, we examined the AGL8 expression patterns in Models H4 and H5, which had the worst cost function values, and compared them to Model H0. During the 8 h photoperiod, for all L. angustifolius lines, Model H0 reflected the overall dynamics of AGL8 expression, although with some uncertainties mainly affecting the first and last time points (Figure 5).
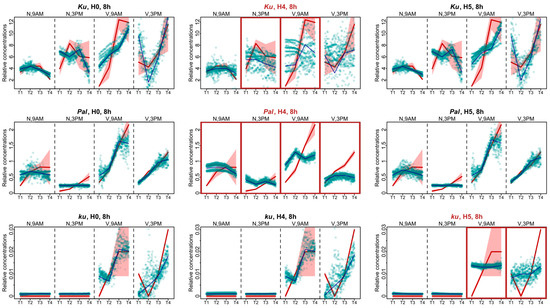
Figure 5.
Expression dynamics in Models H4, H5, and H0 compared to experimental data for the 8 h photoperiod. Averaged dynamics of the experimental data are shown in red, and the model solution (average of 1000 runs) is shown in blue. Green dots represent the simulation results from 10 random runs of the minimization process. Models showing specific defects in solutions compared to H0 are marked with brown frames. “N” and “V” stand for non-vernalized and vernalized data, respectively. The labels “9 A.M.” and “3 P.M.” are the times of the day when the data were collected. T1–T4 stand for sampling terms [21].
The lack of regulatory influence of the FTc1 gene in Model H4 led to the impairment of all fits in the Pal line. The AGL8 expression patterns after vernalization were mostly affected, where the model did not reproduce an increase in expression levels prior to flowering (Figure 5). For the wild ku line, we also detected similar defects in the fits of Model H5 to the vernalized data (Figure 5). The patterning defects in the Ku line were less pronounced compared to Model H0. The worst fits of Model H4 were detected for the non-vernalized data at 3 P.M. and the vernalized data at 9 A.M. (Figure 5).
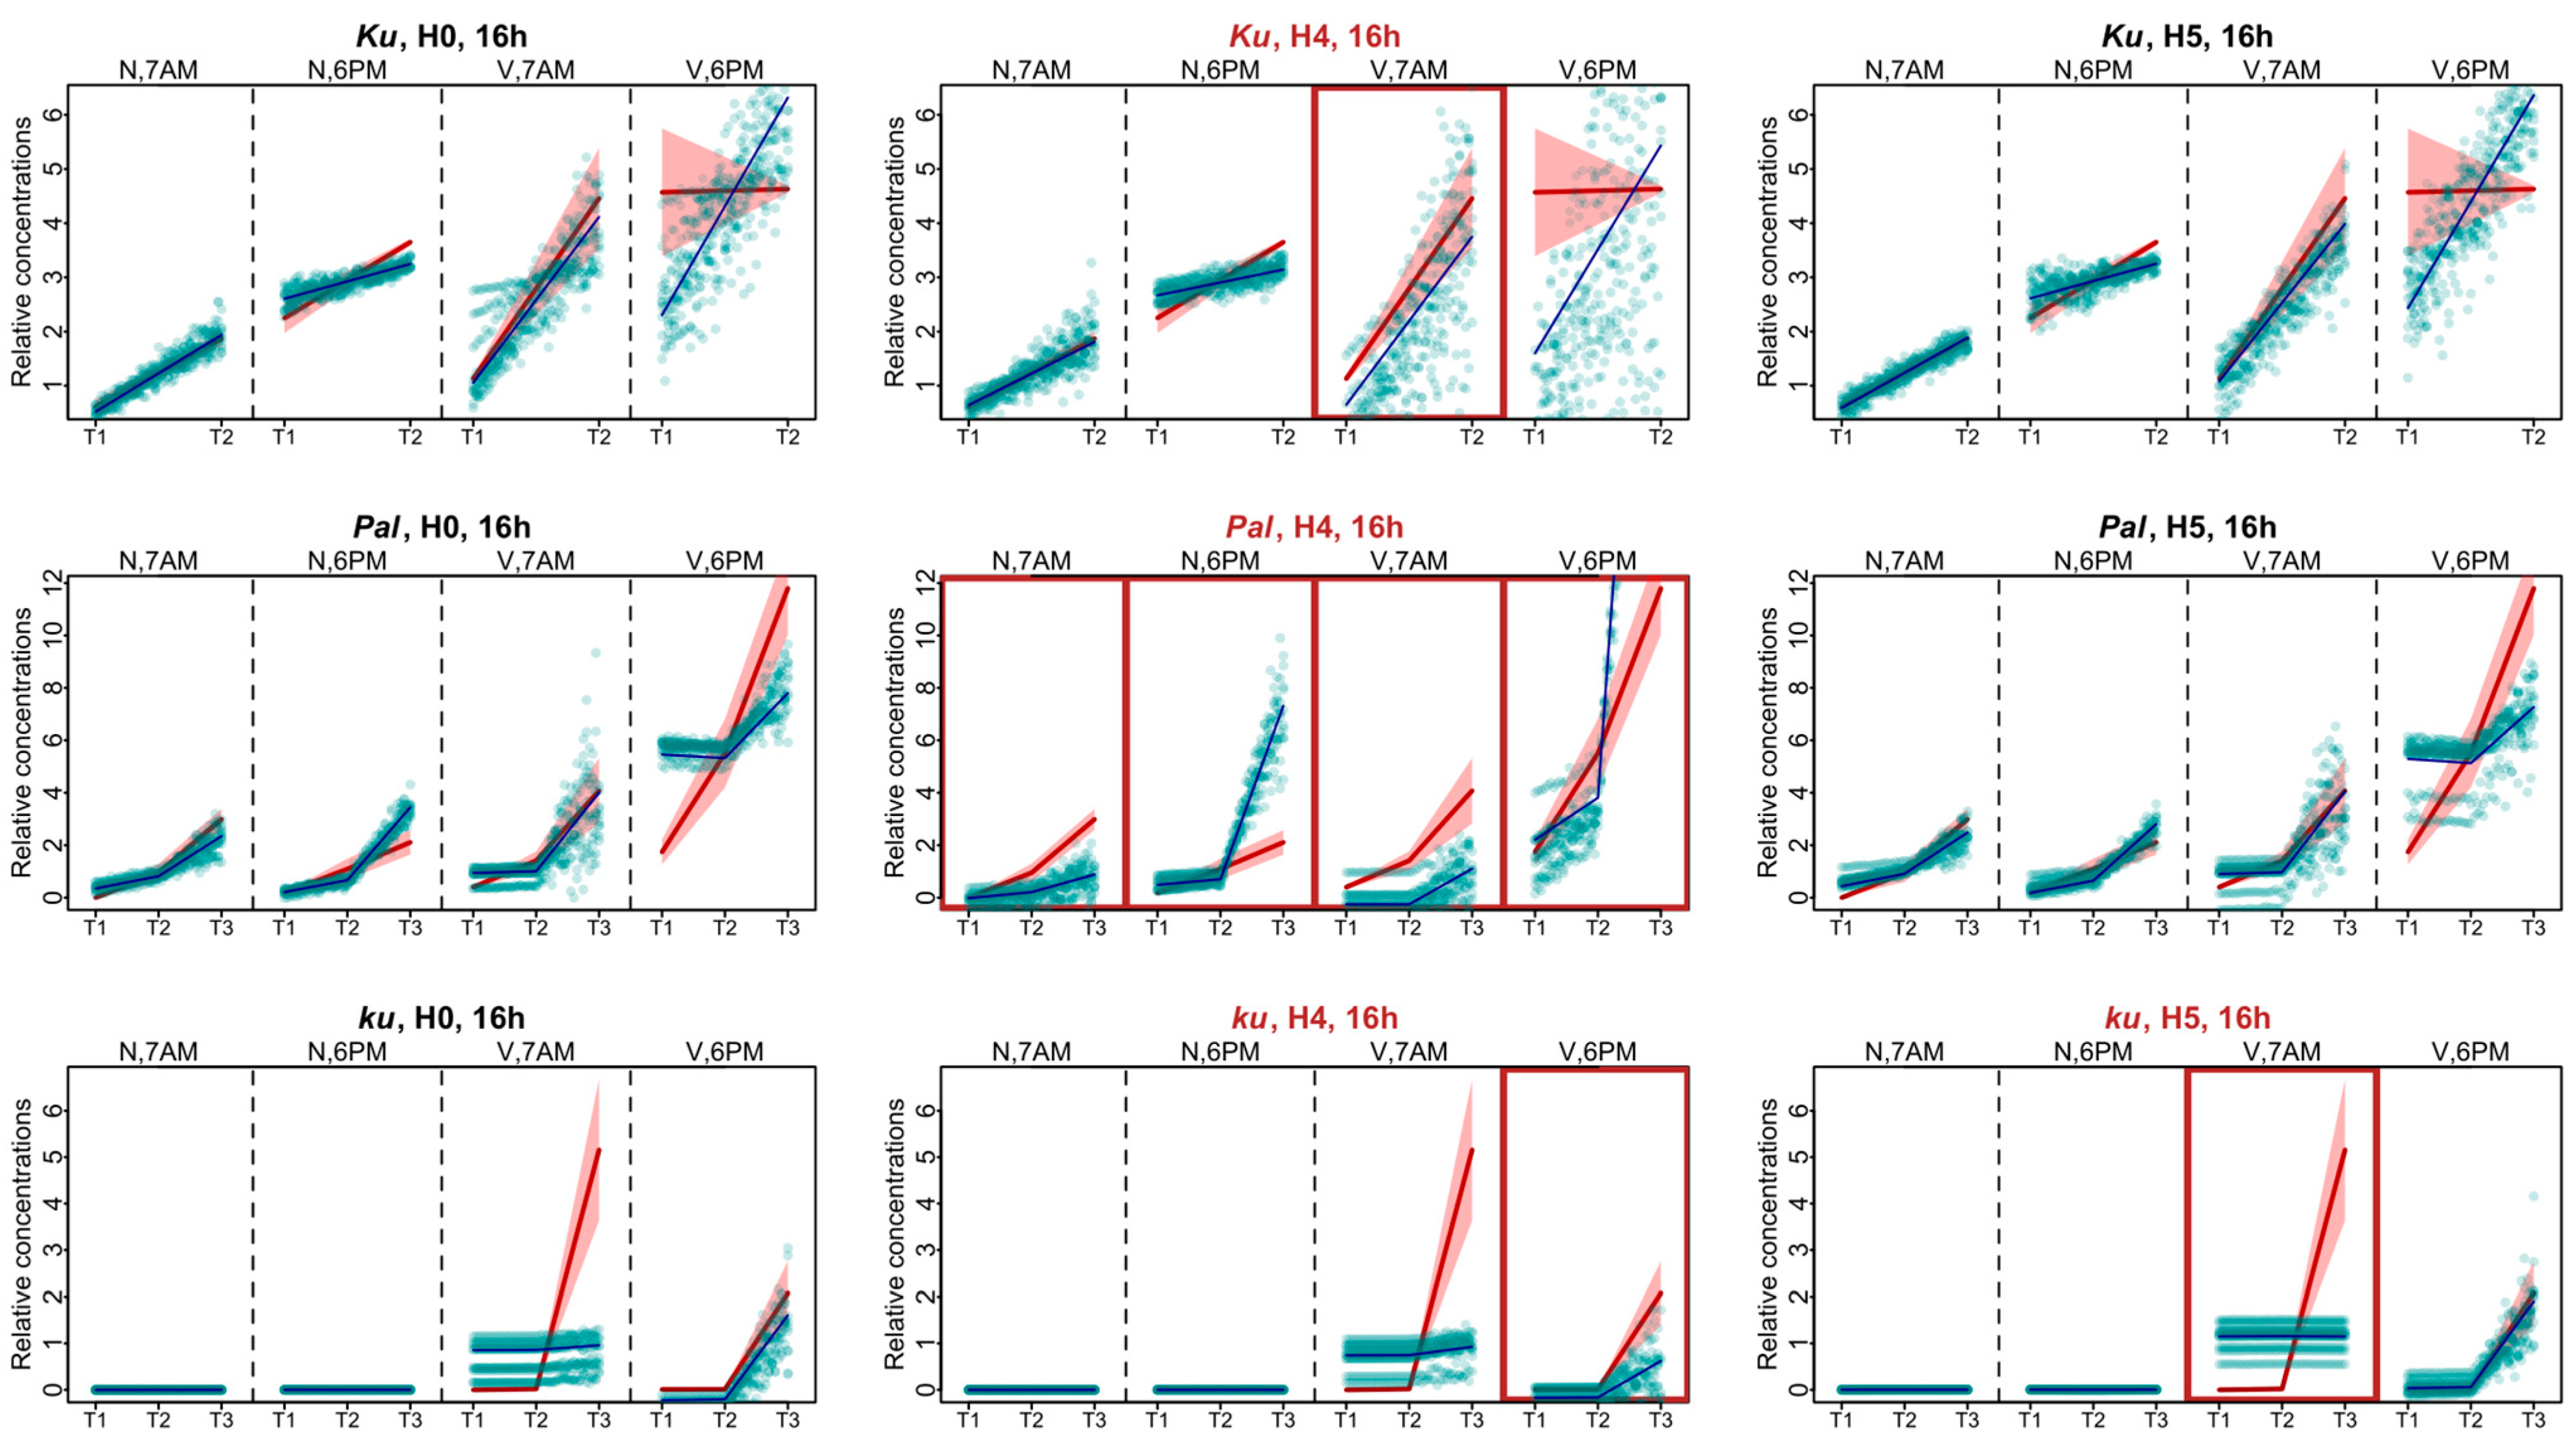
The experimental data for the 16 h photoperiod had much less points in dynamics than the 8 h data. For these data, in each L. angustifolius line, Model H0 failed to reproduce the AGL8 expression dynamics for one of the time points after vernalization, being 6 P.M. for the Ku and Pal lines and 7 A.M. for the ku line (Figure 6). As in the SD case, under the 16 h photoperiod, the most severe defects in the fits of Model H4 compared to Model H0 were found in the Pal line. They manifested themselves both under the non-vernalized conditions and after vernalization (Figure 6). In the Ku line, the worst fits of Model H4 were observed at 7 A.M. at vernalized conditions and were less pronounced than in Pal (Figure 6). In the ku line under LD, we found the specific defects of AGL8 patterns in Model H5 at 7 A.M. and in Model H4 at 6 P.M. under vernalized conditions. The fitting defects in Model H4 compared to Model H0 suggested that the regulatory input of FTc1 to AGL8 expression in ku increased under LD (Figure 6).
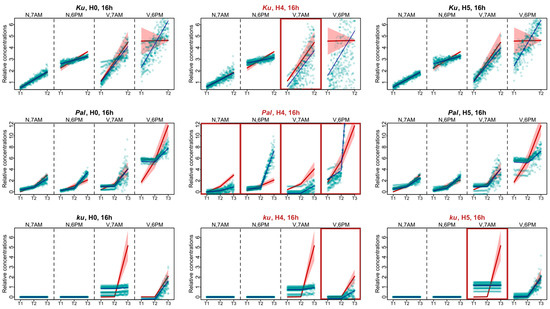
Figure 6.
Expression dynamics in Models H4, H5, and H0 compared to experimental data for the 16 h photoperiod. Averaged dynamics of the experimental data are shown in red, and the model solution (average of 1000 runs) is shown in blue. Green dots represent the simulation results from 10 random runs of the minimization process. Models showing specific defects in solutions compared to H0 are marked with brown frames. “N” and “V” stand for non-vernalized and vernalized data; “7 A.M.” and “6 P.M.” are the times of data collection during LD. T1–T4 stand for sampling terms [21].
2.2.4. Roles of FT-like Genes and Non-FT Factors in Models Inferred from the Values of Regulatory Parameters (8 h Photoperiod)
We analyzed parameter values in Model 1 under the hypotheses H1–H5 and compared them to the hypothesis H0 to uncover the details of regulatory inputs to AGL8 activation in vernalized and non-vernalized conditions and at different times of day (Supplementary Table S1).
Under SD, the c1 constant, marking a regulatory contribution of the FT-like genes, increased after vernalization in almost all L. angustifolius lines. An exclusion of the FTc1 input in Model H4 for the Ku line resulted in a significant increase in the c1 value compared to Model H0. This was observed in both vernalized and non-vernalized conditions but was most evident after vernalization (Supplementary Table S1). By contrast, in the Pal line, Model H4 showed only a slight increase in the c1 value after vernalization and a negative c1 value without vernalization. This suggested that in the Ku line under SD, an exclusion of FTc1 resulted in a significantly increased positive input from other FT genes, whereas in Pal, this input was minimal or even negative. In the wild ku line, the application of Model H5, where AGL8 was regulated only by FTc1, led to a slight increase in c1 in the non-vernalized conditions and very low negative c1 values after vernalization compared to Model H0 (Supplementary Table S1). This suggests that the AGL8 patterning defects in the H5 model are not substantially dependent on the regulation by FT genes.
The c0 constant designates regulation by the non-FT factors. In the Ku line during the 8 h photoperiod, the differences in c0 values between Model H4 and Model H0 showed a strong dependence on the circadian rhythm. In both vernalized and non-vernalized conditions, c0 values increased significantly at 3 P.M. but remained unchanged at 9 A.M. compared to the H0 model (Supplementary Table S1). On the contrary, in the Pal line, c0 values in Model H4 did not significantly depend on vernalization or the circadian rhythm and showed slightly increased values compared with Model H0 in all conditions and times of the day. In the wild ku line, the c0 constant did not vary significantly between models H5 and H0 with respect to the circadian rhythm. However, the c0 value in ku was higher in the H5 model compared to Model H0 in vernalized conditions (Supplementary Table S1).
We can conclude that under SD, in the Ku line, the defects in fits of Model H4, which were dependent on vernalization, compared to H0 (Figure 5), were mostly determined by the c1 constant. The dependence of fit defects on circadian rhythms was expressed in the variation in c0 between 9 A.M. and 3 P.M. On the contrary, in the Pal line, the substantial fitting defects of Model H4 (Figure 5) were expressed by a slight increase in the values of c1 and c0 constants relative to Model H0, which in the case of c1 depended on vernalization. The vernalization dependence of fitting defects of Model H5 (Figure 5) in the ku line was associated with variation in both c1 and c0 constants with respect to vernalization (Supplementary Table S1).
2.2.5. Roles of FT-like Genes and Non-FT Factors in Models Inferred from the Values of Regulatory Parameters (16 h Photoperiod)
Over the 16 h photoperiod, c1 values of Model H4 in the Ku line slightly increased after vernalization compared to Model H0, while in the Pal line, this increase was much more substantial and was observed in the non-vernalized conditions. In the ku line after vernalization, c1 values were slightly increased in Models H2, H4, and H5 after vernalization, with the highest value in Model H4. In the non-vernalized data, Models H2 and H5 had negative c1 values (Supplementary Table S2).
c0 constant values of Model H4 in the Ku line were elevated compared to Model H0 across all conditions and times. Interestingly, in the Pal line, c0 values increased in Model H4 relative to H0 in the non-vernalized conditions at 6 P.M. but decreased in all other conditions and times. In the ku line, both Models H2 and H5 showed elevated values of c0 compared to Model H0 in all conditions and times of the day, while in Model H4, the values of c0 remained unchanged (Supplementary Table S2).
In conclusion, in the Ku line under LD, the defects in Model H4 compared to H0 (Figure 6) were determined by the increased values of both constants c0 and c1, with c1 values dependent on vernalization. The substantial defects of Model H4 in the Pal line were associated with the vernalization dependence of the c1 constant (Supplementary Table S2). The specific defects in the solution of Model H4 in the non-vernalized conditions at 6 P.M. were associated with an increase in the c0 constant (Supplementary Table S2). In the ku line, all hypotheses whose cost function values statistically differed from Model H0 (Figure 4) were associated with the changes in the regulatory constants. c1 values were slightly elevated in Models H2, H4, and H5 after vernalization, which explained the fitting defects in Models H4 and H5 (Figure 6). The values of c0 did not depend on vernalization or circadian rhythms (Supplementary Table S2).
2.3. Modifications of Model 1
Since Model 1 had some problems with capturing the AGL8 expression dynamics, especially for 16 h photoperiod data, we considered several ways to improve the fitting. One constraint of Model 1 is that the AGL8 expression level is a linear function of FT concentrations, while these concentrations themselves are nonlinear functions of time. We applied the following three modifications of Model 1, in which AGL8 nonlinearly responds to FT inputs:
Model 4:
Model 5:
Model 6:
We also considered the following modification, in which the model was kept linear but the regulatory coefficient associated with the FT influence was assumed to be a linear function of time.
Model 7:
The summation in Models 4–7 occurs over all FT-like genes. It is important that all these modifications have the same number of free parameters as Model 1, so that we do not complicate the model structure in terms of parameters and can reliably compare the quality of their fits to data with the baseline Model 1.
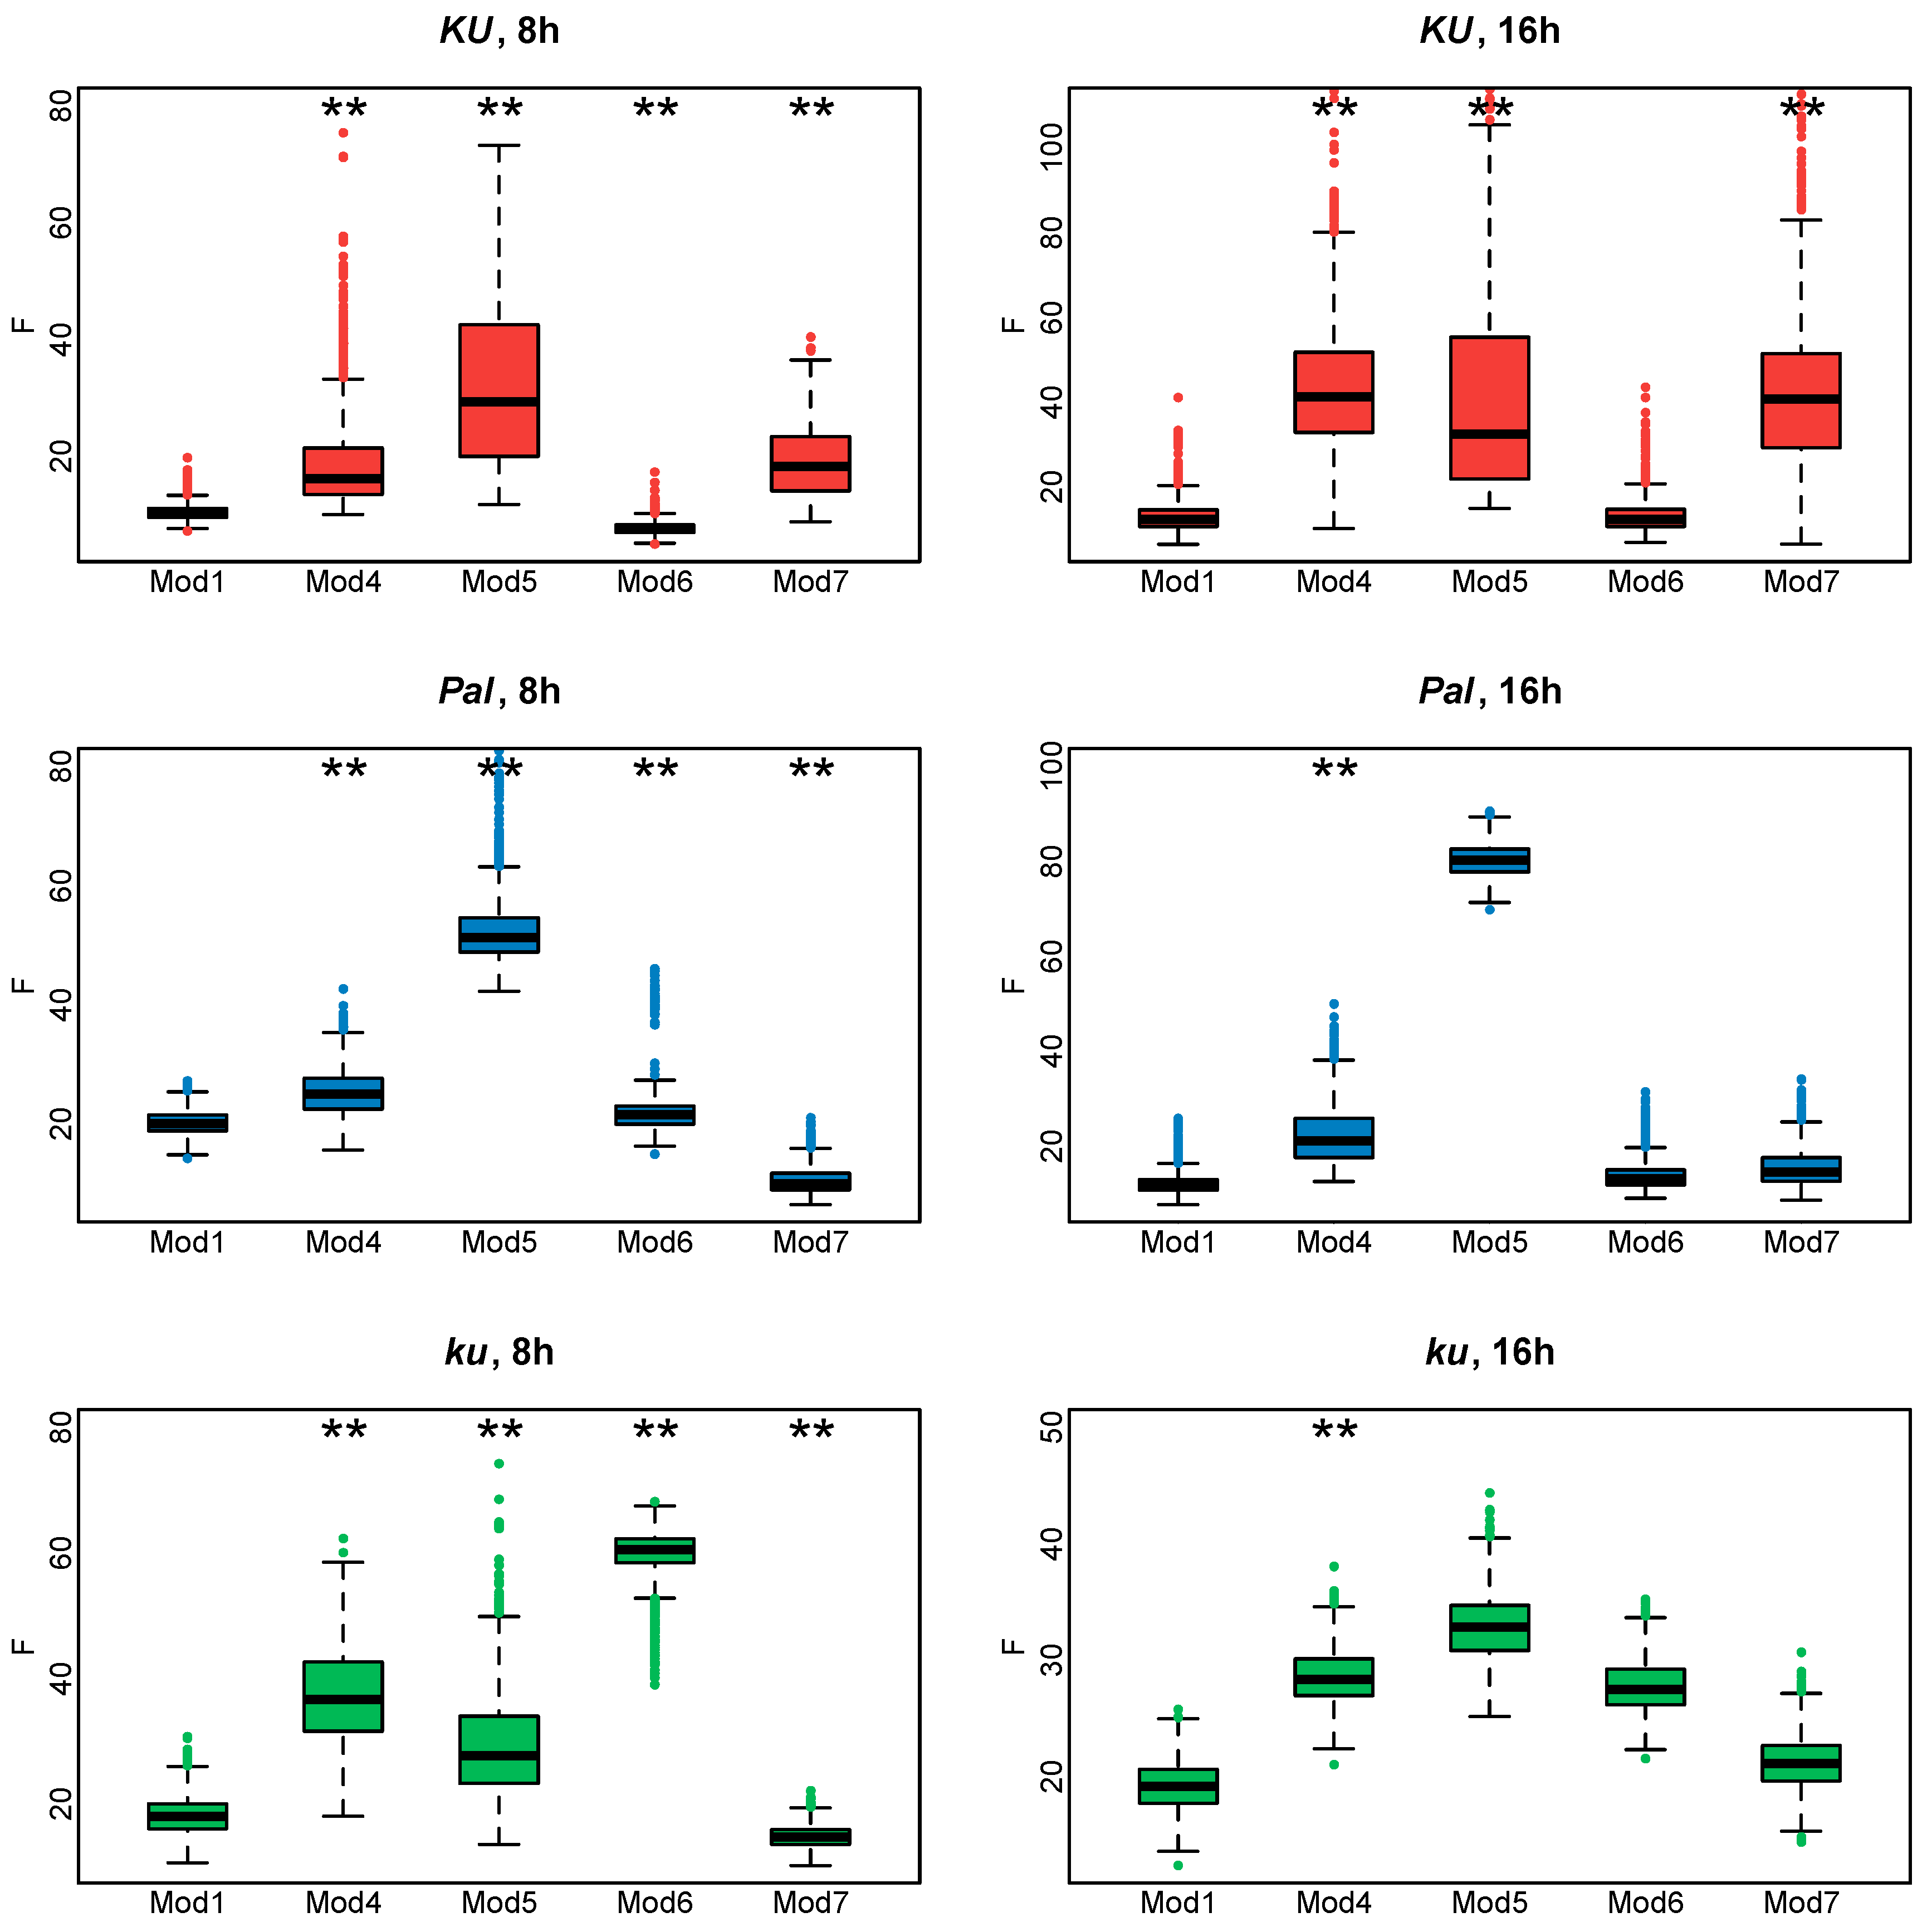
Figure 7 shows the cost function values for the fitting of Models 4–7 to the AGL8 expression data. It is evident that Model 6 works better for the Ku line, while for the Pal and ku lines, Model 7 provides minimal cost function values in both 8 and 16 h photoperiods. However, none of these models outperform Model 1 equally well in all L. angustifolius lines. We concluded that the shortcomings in reproducing AGL8 expression dynamics by Model 1 were not due to its lack of nonlinear or time-dependent response to FT inputs but presumably to the presence of additional regulatory inputs missing in the model.
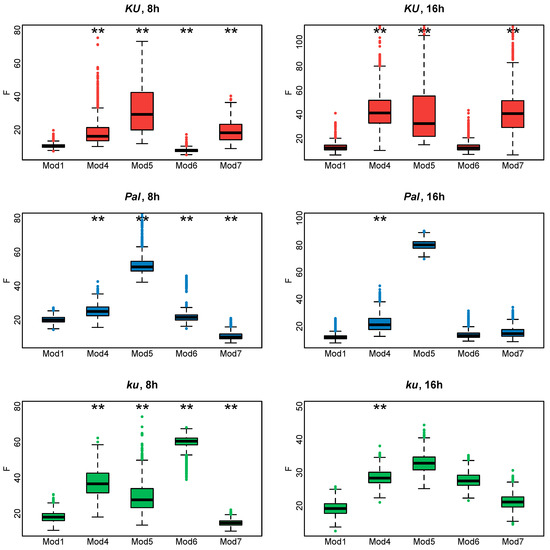
Figure 7.
Cost function values (F) for 1000 minimization runs of Model 1 and Models 4–7 for three L. angustifolius lines. Asterisks indicate statistically significant differences in the mean F between Model i (i = 4…7) and Model 1 (** p < 0.01). The labels 8 h and 16 h are SD and LD photoperiods.
3. Discussion
In this paper, we analyzed the core regulatory interactions underlying floral transition in the narrow-leafed lupin L. angustifolius under variable environmental conditions [21]. The mechanisms of FT-like gene activation by vernalization and the photoperiod in L. angustifolius are yet unknown, so we used a “hub” approach, assuming that FT-like gene expression dynamics reflect the influence of environmental cues.
The narrow-leafed lupin became an interesting object to study mechanisms of floral transition after the discovery of large deletions in the promoter region of the FTc1 gene. Such deletions caused early flowering and almost abolished the vernalization response [24,26]. Consequently, the FTc1 gene was considered to confer early flowering and vernalization independence. However, there is yet no direct experimental evidence whether other L. angustifolius FT-like genes (FTa1, FTa2, and FTc2) play any role in vernalization-induced flowering.
We suggested a number of hypotheses on how L. angustifolius FT-like genes contribute to the regulation of AGL8, an ortholog of the Arabidopsis core meristem identity genes AP1 and FUL [5,6]. We considered a gene network structure common to many plant species including legumes, in which FT-like genes regulate AP1-like genes (Figure 1) [8,35,36]. However, in this case, AGL8 expression was considered in leaves, where it showed strong association with vernalization independence of the Ku locus [37]. The expression and function of AP1 orthologs in leaves have been described in a number of plant species [38,39].
After selecting the most appropriate structure of the regression model, we turned off the regulatory input L. angustifolius FT-like genes one by one to figure out their roles in AGL8 regulation. These numerical experiments could be interpreted as a simulation of loss of function mutations in FT-like genes, which have not yet been studied experimentally. Then, we fit the model solutions to AGL8 expression data in three L. angustifolius lines differing in the flowering time and vernalization sensitivity [21]. The greater the deviation of the model solution from the experimental data, the more significant the regulatory role of the missing FT-like gene in AGL8 regulation.
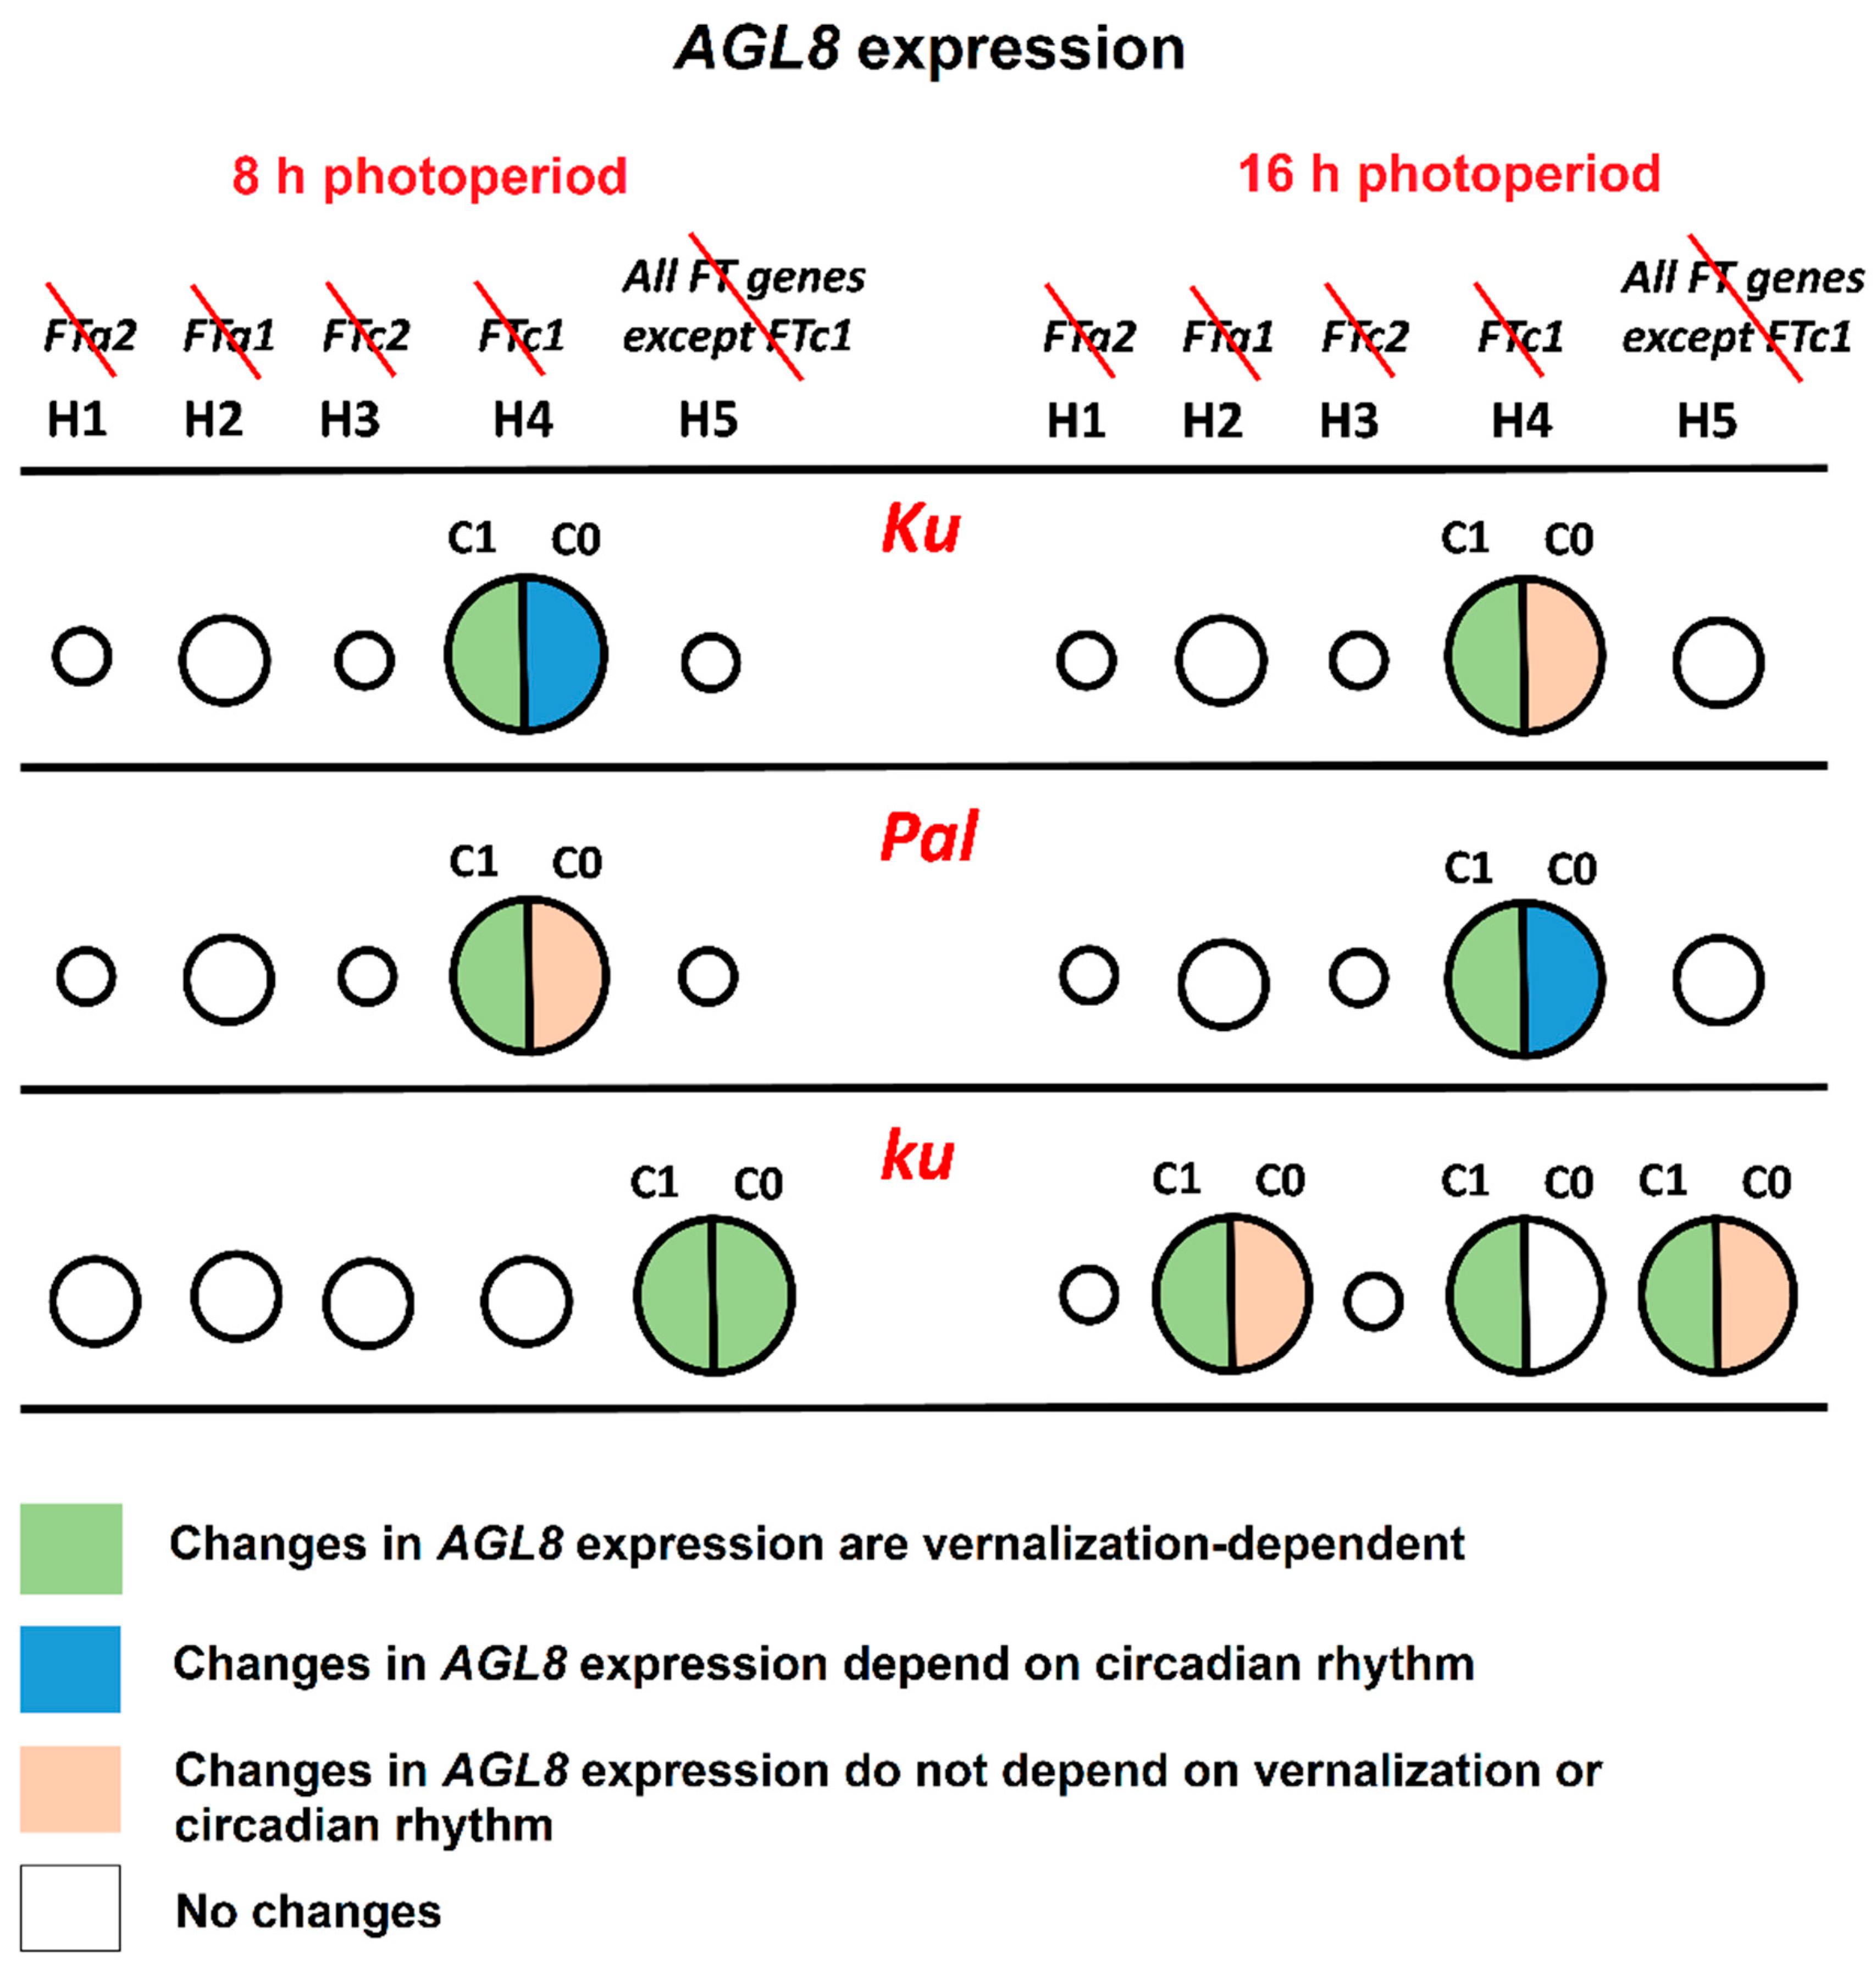
The line carrying the early flowering Ku allele showed the most patterning defects under the hypothesis H4, where FTc1 did not play a role in AGL8 regulation (Figure 4 and Figure 8). Under SD, an exclusion of FTc1 from AGL8 regulation resulted in an increased activation by other FT-like genes, especially in vernalized conditions, and by a more intense regulation by other factors, which depended on circadian rhythms (Figure 8, Supplementary Table S1). Under LD, the elimination of FTc1 regulatory input was associated with a slight increase in regulation by other FT-like genes in vernalized conditions and regulation by non-FT factors in all conditions and times of the day (Figure 8, Supplementary Table S2). In summary, our models showed that in the Ku line, FTc1 had a maximal effect on AGL8 expression under both short and long days, although through different mechanisms (Figure 8).
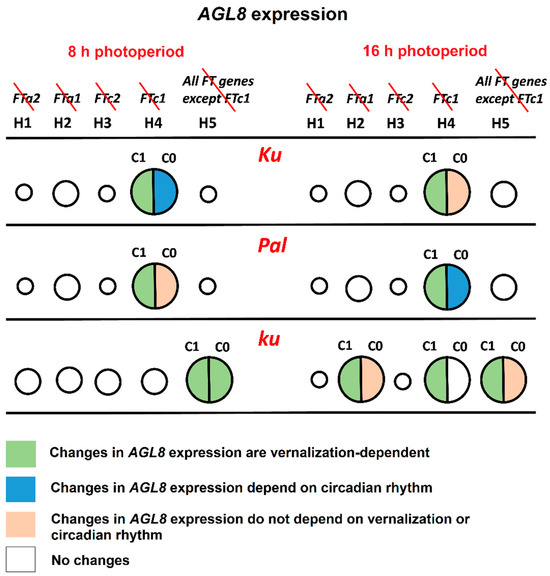
Figure 8.
The roles of FT-like genes in AGL8 regulation in L. angustifolius models. The figure summarizes the regulatory effects of the exclusion of one or several FT-like genes from AGL8 regulation under 8 and 16 h photoperiods. Circles of different sizes show an effect of FT-like gene exclusion on the cost function values of Model 1 under hypotheses H1–H5. FT-like genes excluded from each model are specified in the top panel and crossed out in red. The larger the circle, the stronger the influence of regulators on AGL8 expression. In models with the smallest circles, cost function values did not show statistically significant differences from model H0, where AGL8 was regulated by all four FT-like genes (FTa1, FTa2, FTc1, and FTc2) (Figure 4). Cost function values in the models with middle and large circles had statistically significant differences from model H0. However, only models with large circles exhibited patterning defects and/or changes in regulatory parameters. The association of changes in the regulatory parameters with vernalization and circadian rhythms are indicated by different colors, according to the key at the bottom panel. The c1 constant presents the regulatory input of FT-like genes, while c0 reflects the regulation of AGL8 by other factors (Supplementary Tables S1 and S2).
In the intermediate Pal line, the strongest effect on AGL8 expression was also provided by the exclusion of the FTc1 gene under both SD and LD (Figure 4 and Figure 8). However, in this case, the patterning defects were stronger than in Ku and depended both on vernalization and circadian rhythms (Figure 5 and Figure 6). The analysis of parameter values suggested that under both SD and LD, an exclusion of FTc1 resulted in an increased cumulative action of FTa1, FTa2, and FTc2 genes, depending on vernalization (Supplementary Tables S1 and S2, Figure 8). Under LD, this exclusion additionally was associated with the action of some other factors, which depended on circadian rhythms (Figure 8). Thus, in both the Ku and Pal lines, despite differences in their phenology, AGL8 expression was primarily dependent on FTc1 without any significant regulatory influence from other FT-like genes. For several legume species, the regulatory inputs from vernalization and photoperiod pathways were suggested to be integrated by different FT-like genes. For example, in M. truncatula, early flowering and vernalization response are provided by the FTa1 gene, while the FTb gene is responsible for photoperiod sensitivity [23,36]. A similar allocation has been reported for FTb2 and FTa1 genes in the garden pea P. sativum [22]. Given a significant increase in FTa1 expression in the L. angustifolius Pal line under LD (Figure 9), the FTa1 gene has been proposed to be responsible for photoperiod regulation, in addition to FTc1, conferring vernalization response [21]. In our study, an exclusion of FTa1 from AGL8 regulation in Model H2 did not substantially affect cost function or parameter values in the Pal line, while it changed the model parameters in the wild ku line after vernalization (Figure 4, Supplementary Table S2).
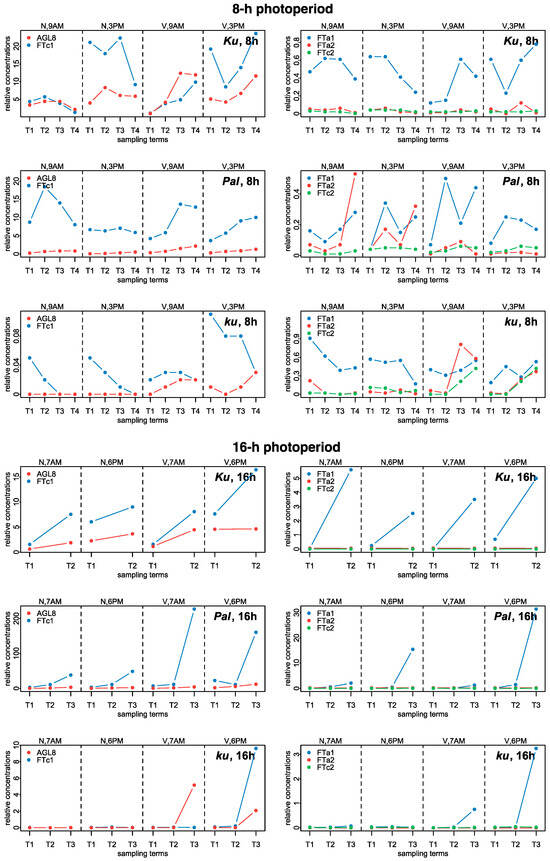
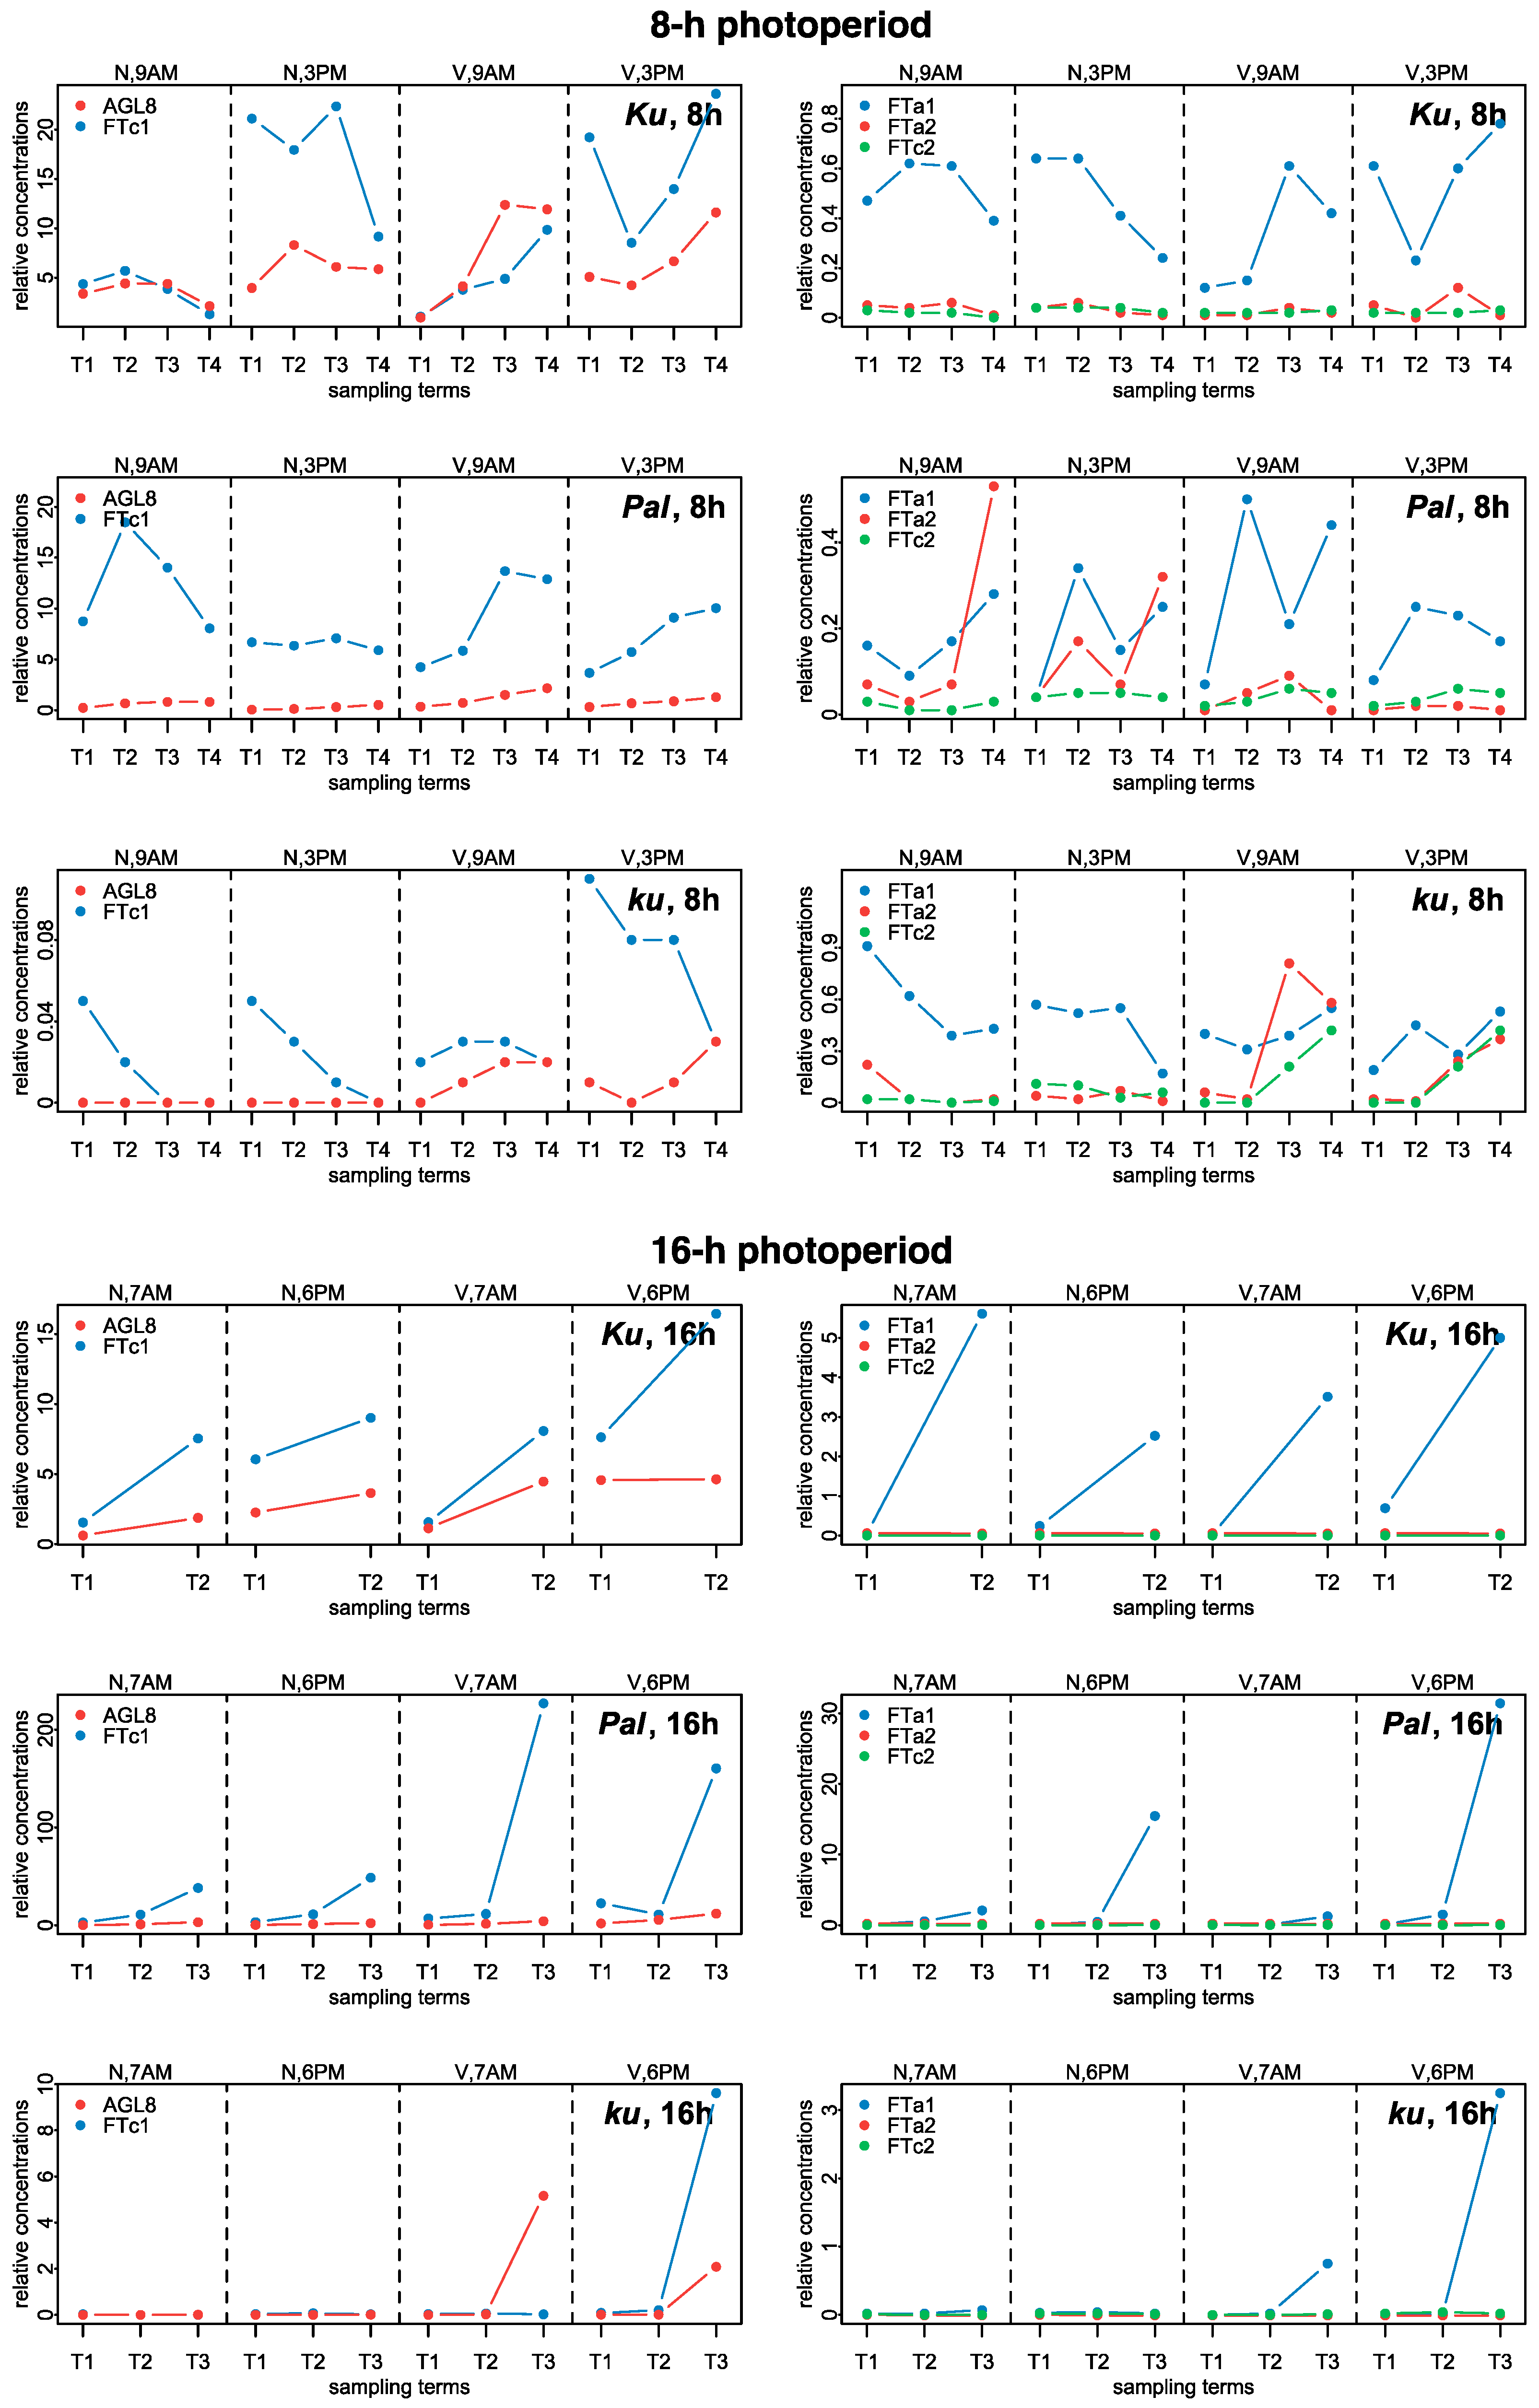
Figure 9.
Experimental data on the expression dynamics of AGL8, FTc1, FTa1, FTa2, and FTc2 genes over the 8 h (SD) and 16 h (LD) photoperiods [21]. The data were obtained with qRT-PCR. “N” and “V” stand for non-vernalized and vernalized data; “9 A.M.” and “3 P.M.” are the times of the day when the data were collected during SD, while “7 A.M.” and “6 P.M.” are the times of data collection for LD. T1–T4 stand for sampling terms [21].
In the wild ku line, AGL8 expression was regulated by different sets of FT-like genes compared to Ku and Pal, and this regulation was dependent on the photoperiod. Under SD, the worst cost function values were observed under the hypothesis H5, where AGL8 was regulated only by the FTc1 gene. This resulted in the defects of model fits in the vernalized conditions and in the vernalization dependence of all parameter values (Figure 8, Supplementary Table S1). Thus, under SD, the wild allele of the FTc1 gene was unable to provide the correct expression of AGL8 in the absence of regulatory contributions from other FT-like genes. Under LD, in addition to the model H5, parameter values were affected in the models H2 and H4 in a vernalization-dependent manner. This demonstrated that under LD, both FTa1 and FTc1 genes were necessary for the correct AGL8 expression in the ku allele. Indeed, these regulatory inputs led to floral transition under LD, contrasting with an absence of any strong regulator under SD, where ku did not flower [21].
A strong effect of FTc1 on AGL8 in the Ku and Pal lines is explained by its high expression levels, presumably caused by deletions encompassing binding sites of some repressor factors. Despite a large number of candidate transcription factor motifs, some of them were proposed to have functional roles [24,26]. A MADS-box transcription factor AGAMOUS-like 15 (AGL15) has been recently suggested as a candidate regulator of early flowering related to FTc1 indels in two lupin species, Lupinus luteus and L. angustifolius [40]. In Arabidopsis, AGL15 acts as a floral repressor by binding the FT promoter sequence at sites partially overlapping with those bound by the vernalization integrator proteins FLC and SVP [15,40,41]. Interestingly, there is a strong dependence between the number of AGL15 binding sites in the FTc1 promoter and early flowering of L. angustifolius. The wild ku allele has five AGL15 repressor binding sites, the intermediate allele Pal has two sites, the Ku allele has one site, and the Jul allele has no AGL15 sites. A similar tendency has been observed for the yellow lupin [40]. The roles of candidate transcription factor binding sites could be further validated with genome editing tools and improved transformation protocols [26,42,43].
In the study [21], the authors examined the expression of two homologs of A. thaliana genes involved in the FLC vernalization pathway, CRLK1 and UGT85A2. These two genes were selected based on transcriptomic data on their contribution to the vernalization response via FTc1 in L. angustifolius [37]. CRLK1 functions in the C-repeat binding factor (CBF) cold sensitivity pathway, while UGT85A2 is involved in the UDP-glycosyltransferase pathway. The downstream genes in these pathways, CBF and CBF EXPRESSION INDUCTOR 1 (ICE1), provide regulatory links to FLC [44,45]. CRLK1 showed a negative response to vernalization in early and intermediate Ku and Pal lines, but a positive or variable response in the wild-type ku line. UGT85A2 was downregulated by vernalization in all L. angustifolius lines. The above pathways are putatively underlying the vernalization response related to FTc1, a major FT-like gene, in L. angustifolius.
As in a case of the FLC repressor, the CO gene, a major integrator of the photoperiod pathway in Arabidopsis, does not appear to have a role in L. angustifolius [20,21]. Thus, the mechanisms of the photoperiod and circadian rhythm regulation in the narrow-leafed lupin remain challenging. Interestingly, in the L. angustifolius lines carrying promoter deletions, the distal promoter regions, which in Arabidopsis contain CCAAT binding sites, potentiating CO-mediated activation, remain preserved [21,24,26,46]. However, despite the absence of functional CO, many orthologs of Arabidopsis photoperiod genes play essential functional roles in temporal legume species, suggesting their possible involvement in FT regulation without a central integrator gene [47,48,49,50,51,52].
Our models did not predict any specific function of FTa2 and FTc2 genes in AGL8 regulation. A recent study in the sister lupin species, L. luteus, predicted the association of indels in the FTc2 gene with photoperiod responsiveness with a specific role of a large insertion of a Copia-like retrotransposon element into the FTc2 third intron [40]. Overall, in this study, the authors considered associations of indels in all four L. luteus FT-like genes with phenotypic traits. The application of this approach to L. angustifolius could further verify regulatory functions of FTa1, FTa2, and FTc2 genes.
The structure of the genetic network of meristem identity gene regulation by FT-like genes (Figure 1) also requires experimental verification. It could be the case that FTa2 and FTc2 genes act upstream of FTc1, and each gene makes a small contribution into FTc1 regulation. In this case, FTc1 acts as a hub, accumulating inputs from all other FT genes and transmitting them to AGL8. In our models, we considered an overall contribution of each FT gene to AGL8 activation, and we could not judge whether an effect of FT-like genes on AGL8 is direct or indirect. Moreover, it is unclear whether FT-like genes form a network of interactions or what the position of each FT-like gene is in this network. The application of the reverse genetics methods could provide more details on the gene network structure underlying floral transition in L. angustifolius.
To make reliable predictions about the role of each FT-like gene, we needed to find the right balance between model complexity and the data structure. Since the experimental data had very poor temporal resolution, we discarded the modeling based on ordinary differential equations and chose the regression-based framework. The linear regression models adequately reflected the dynamics of AGL8 expression in SD; however, they failed to reproduce AGL8 data for some conditions under LD. Nevertheless, after testing more complex regression-based models, we concluded that these shortcomings were not due to the nonlinear or time-dependent response of AGL8 to FT inputs but presumably to the presence of additional regulatory inputs that are missing in the model. Despite most models of floral transition considering FT-like genes as the sole positive regulators of meristem identity genes [28,29,30,32,33], the role of another integrator gene, SUPPRESSOR OF OVEREXPRESSION OF CONSTANS (SOC1), should also be taken into account. As in a case of the FT gene, the Arabidopsis SOC1 is directly bound by the FLC protein and thus is involved in the vernalization response [53,54]. Legumes have several paralogous copies of SOC1 genes, which have been recently shown to play a significant role in the vernalization-induced flowering of M. trancatula [34,55,56]. The L. angustifolius SOC1 integrators should be included in the gene network once the experimental data become available.
4. Materials and Methods
4.1. Experimental Data
The numerical data on gene expression in L. angustifolius were obtained from Supplementary Table “Data Sheet 1” of [21] (https://www.frontiersin.org/articles/10.3389/fpls.2020.572135/full#supplementary-material, accessed on 16 December 2024). Three L. angustifolius lines were considered, namely 83A:476, carrying domesticated FTc1 allele Ku, Palestyna, carrying FTc1 allele Pal with an intermediate phenology, and P27255, carrying the wild FTc1 allele ku [21]. In the paper, for simplicity, we called these lines by the name of the allele. The data presented expression dynamics of FTa1, FTa2, FTc1, FTc2, and AGL8 genes in leaves under 8 h and 16 h photoperiods with and without vernalization. For each of these conditions, plant material was collected at two time points during the day to estimate the dependence of gene expression on circadian rhythms, which were 9 A.M. and 3 P.M. for the 8 h photoperiod and 7 A.M. and 6 P.M. for the 16 h photoperiod [21]. Gene expression dynamics included 2–4 time points (sampling terms) within a period of two weeks prior to flowering (Supplementary Table S5 from [21]). mRNA concentrations (mean ± s.d.) were measured using qRT-PCR with two reference genes (LanDExH7 and LanTUB6). S.d. was a standard deviation of 3 biological replicates, each representing a mean of 3 technical replicates [21]. Figure 9 shows the dynamics of mean mRNA concentration values.
In the early flowering Ku line under SD, the levels of expression FTc1 and AGL8 were much higher than in FTa1, FTa2, and FTc2 and showed slight induction by vernalization prior to flowering. Under LD, the expression of FTc1 and AGL8 was nearly independent of vernalization. FTc1 and FTa1 concentrations increased prior to flowering in both vernalized and non-vernalized conditions and in FTa1, this increase was quite significant. FTc1 levels were higher in the evening than in the morning under both SD and LD. The expression of FTa2 and FTc2 was very low independently of LD or vernalization (Figure 9, [21]).
In the intermediate Pal line under SD, the expression of FTc1 was much higher than in all other genes but was not substantially induced by vernalization contrary to AGL8, which showed an increase in vernalized conditions, primarily at 9 A.M. Under LD, the expression of FTc1 was greatly increased after vernalization independently of the circadian rhythm, while AGL8 concentration was mostly increased at 6 P.M. The expression of FTa1 in the Pal line under LD showed a very substantial induction in both non-vernalized and vernalized conditions mostly in the evening term. As in the case of Ku, the expression of FTa2 and FTc2 was very low in the Pal line.
In the wild ku line under SD, the expression of both FTc1 and AGL8 slightly increased after vernalization, while under LD, the expression of FTc1, FTa1, and AGL8 was substantially induced in the vernalized conditions mostly at 6 P.M. Under SD, FTa2 and FTc2 genes showed an increased expression after vernalization in contrast to their expression in the Ku and Pal lines (Figure 9, [21]).
For a more robust parameter estimation process, we performed linear interpolation of the expression values over time and generated additional data points by taking intermediate values from the interpolated function. As a result, 61 data points (means and variances) were obtained in total for the 8 h data and 41 for the 16 h data. Finally, 1000 sets of expression levels were randomly generated by sampling values from the normal distribution with the mean and variance values obtained from the interpolated function.
4.2. Models and Parameter Optimization
Regression models of the AGL8 expression level were applied using expression levels of FT genes as predictors, as described in the text. Parameter values in the models were estimated by multiple parameter optimization runs, in which the AGL8 expression in the model was fitted to that in the data. The fitting was performed by minimizing the following cost function:
where “data” and “model” mark the AGL8 expression levels in the data and model, respectively; “V” and “N” mark vernalized and non-vernalized conditions, respectively; and “9” and “3” stand for 9 A.M. an 3 P.M. data, respectively, which indicate times of data collection under SD. Under LD, these times are 7 A.M. and 6 P.M., respectively, but we keep the “9” and “3” notation for simplicity. is the standard deviation from the data. The summation in this formula goes over all data points. The numerical minimization procedure was performed in R, using the Nelder–Mead minimization method. The mean and standard deviation of parameter values were estimated from the minimization results obtained for each of the 1000 datasets.
The following Akaike information criterion (AIC) adjusted for small data samples was used to compare the performance of models with different numbers of parameters:
where k is the number of parameters, m is the number of data points, and is the maximal likelihood. For the weighted cost function F used in our study, the maximal likelihood is expressed via the minimal value of F as follows: [33].
Supplementary Materials
The following supporting information can be downloaded at: https://www.mdpi.com/article/10.3390/plants13243548/s1, Figure S1: Dependence of the cost function values on parameter variation for different environmental conditions. Var 1–3 (variants 1–3) represent three different options for variation of parameters in Model 1 under 8 h photoperiod: Var 1: c1 differed between vernalized and non-vernalized conditions; Var 2: c1 differed between 9 A.M. and 3 P.M.; Var 3: c1 did not differ between any conditions. In both Pal and Ku lines, Var 1 had the lowest value of the cost function. Asterisks indicate statistically significant differences in the mean F between Var 1 and 2 and Var 3 (* p < 0.05, ** p < 0.01); Table S1: Regulatory parameters for Model 1 under the hypotheses H0-H5 for the 8 h photoperiod. c1 constant presents the regulatory input of FT-like genes, while c0 reflects the regulation of AGL8 by other factors. The values of each constant differ between vernalized (V) and non-vernalized (N) conditions. c0 values also vary depending on the time of day: “9” corresponds to the data collected at 9 A.M. and “3” to the data collected at 3 P.M. [21]; Table S2: Regulatory parameters for Model 1 under the hypotheses H0-H5 for the 16 h photoperiod. c1 constant presents the regulatory input of FT-like genes, while c0 reflects the regulation of AGL8 by other factors. The values of each constant differ between vernalized (V) and non-vernalized (N) conditions. c0 values also vary depending on the time of day: “7” corresponds to the data collected at 7 A.M. and “6” to the data collected at 6 P.M. [21].
Author Contributions
Conceptualization, S.Y.S. and V.V.G.; methodology, V.V.G., M.A.D. and M.P.B.; software, M.A.D. and D.H.; validation, M.P.B., E.V.G., E.A.S. and M.V.G.; formal analysis, M.A.D., E.V.G., M.V.G. and D.H.; investigation, S.Y.S., V.V.G. and M.G.S.; writing—original draft preparation, M.A.D., S.Y.S. and V.V.G.; writing—review and editing, S.Y.S., V.V.G. and E.A.S.; visualization, M.A.D. and S.Y.S.; funding acquisition, M.G.S. All authors have read and agreed to the published version of the manuscript.
Funding
This research was funded by the Ministry of Science and Higher Education of the Russian Federation as part of the World-class Research Center program: Advanced Digital Technologies contract no. 075-15-2022-311, dated 20 April 2022.
Data Availability Statement
All data and modeling results are contained within the article and Supplementary Information.
Conflicts of Interest
The authors declare no conflicts of interest.
References
- Amasino, R. Seasonal and Developmental Timing of Flowering. Plant J. 2010, 61, 1001–1013. [Google Scholar] [CrossRef]
- Lee, Z.; Kim, S.; Choi, S.J.; Joung, E.; Kwon, M.; Park, H.J.; Shim, J.S. Regulation of Flowering Time by Environmental Factors in Plants. Plants 2023, 12, 3680. [Google Scholar] [CrossRef] [PubMed]
- Bouché, F.; Lobet, G.; Tocquin, P.; Périlleux, C. FLOR-ID: An Interactive Database of Flowering-Time Gene Networks in Arabidopsis Thaliana. Nucleic Acids Res. 2016, 44, D1167–D1171. [Google Scholar] [CrossRef]
- Kinoshita, A.; Richter, R. Genetic and Molecular Basis of Floral Induction in Arabidopsis Thaliana. J. Exp. Bot. 2020, 71, 2490–2504. [Google Scholar] [CrossRef] [PubMed]
- Ferrándiz, C.; Gu, Q.; Martienssen, R.; Yanofsky, M.F. Redundant Regulation of Meristem Identity and Plant Architecture by FRUITFULL, APETALA1 and CAULIFLOWER. Development 2000, 127, 725–734. [Google Scholar] [CrossRef] [PubMed]
- Kaufmann, K.; Wellmer, F.; Muiño, J.M.; Ferrier, T.; Wuest, S.E.; Kumar, V.; Serrano-Mislata, A.; Madueño, F.; Krajewski, P.; Meyerowitz, E.M.; et al. Orchestration of Floral Initiation by APETALA1. Science 2010, 328, 85–89. [Google Scholar] [CrossRef] [PubMed]
- Yamaguchi, N. LEAFY, a Pioneer Transcription Factor in Plants: A Mini-Review. Front. Plant Sci. 2021, 12, 701406. [Google Scholar] [CrossRef]
- Wellmer, F.; Riechmann, J.L. Gene Networks Controlling the Initiation of Flower Development. Trends Genet. 2010, 26, 519–527. [Google Scholar] [CrossRef]
- Song, Y.H. The Effect of Fluctuations in Photoperiod and Ambient Temperature on the Timing of Flowering: Time to Move on Natural Environmental Conditions. Mol. Cells 2016, 39, 715–721. [Google Scholar] [CrossRef] [PubMed]
- Takagi, H.; Hempton, A.K.; Imaizumi, T. Photoperiodic Flowering in Arabidopsis: Multilayered Regulatory Mechanisms of CONSTANS and the Florigen FLOWERING LOCUS T. Plant Commun. 2023, 4, 100552. [Google Scholar] [CrossRef] [PubMed]
- Nishio, H.; Kudoh, H. Distinct Responses to Autumn and Spring Temperatures by the Key Flowering-Time Regulator FLOWERING LOCUS C. Curr. Opin. Genet. Dev. 2023, 78, 102016. [Google Scholar] [CrossRef]
- Valverde, F.; Mouradov, A.; Soppe, W.; Ravenscroft, D.; Samach, A.; Coupland, G. Photoreceptor Regulation of CONSTANS Protein in Photoperiodic Flowering. Science 2004, 303, 1003–1006. [Google Scholar] [CrossRef] [PubMed]
- Searle, I.; He, Y.; Turck, F.; Vincent, C.; Fornara, F.; Kröber, S.; Amasino, R.A.; Coupland, G. The Transcription Factor FLC Confers a Flowering Response to Vernalization by Repressing Meristem Competence and Systemic Signaling in Arabidopsis. Genes Dev. 2006, 20, 898–912. [Google Scholar] [CrossRef] [PubMed]
- Madrid, E.; Chandler, J.W.; Coupland, G. Gene Regulatory Networks Controlled by FLOWERING LOCUS C That Confer Variation in Seasonal Flowering and Life History. J. Exp. Bot. 2021, 72, 4–14. [Google Scholar] [CrossRef]
- Mateos, J.L.; Madrigal, P.; Tsuda, K.; Rawat, V.; Richter, R.; Romera-Branchat, M.; Fornara, F.; Schneeberger, K.; Krajewski, P.; Coupland, G. Combinatorial Activities of SHORT VEGETATIVE PHASE and FLOWERING LOCUS C Define Distinct Modes of Flowering Regulation in Arabidopsis. Genome Biol. 2015, 16, 31. [Google Scholar] [CrossRef]
- Turck, F.; Fornara, F.; Coupland, G. Regulation and Identity of Florigen: FLOWERING LOCUS T Moves Center Stage. Annu. Rev. Plant Biol. 2008, 59, 573–594. [Google Scholar] [CrossRef]
- Shim, J.S.; Kubota, A.; Imaizumi, T. Circadian Clock and Photoperiodic Flowering in Arabidopsis: CONSTANS Is a Hub for Signal Integration. Plant Physiol. 2017, 173, 5–15. [Google Scholar] [CrossRef]
- Pin, P.A.; Nilsson, O. The Multifaceted Roles of FLOWERING LOCUS T in Plant Development. Plant Cell Environ. 2012, 35, 1742–1755. [Google Scholar] [CrossRef]
- Lee, N.; Shim, J.S.; Kang, M.-K.; Kwon, M. Insight from Expression Profiles of FT Orthologs in Plants: Conserved Photoperiodic Transcriptional Regulatory Mechanisms. Front. Plant Sci. 2024, 15, 1397714. [Google Scholar] [CrossRef]
- Hecht, V.; Foucher, F.; Ferrándiz, C.; Macknight, R.; Navarro, C.; Morin, J.; Vardy, M.E.; Ellis, N.; Beltrán, J.P.; Rameau, C.; et al. Conservation of Arabidopsis Flowering Genes in Model Legumes. Plant Physiol. 2005, 137, 1420–1434. [Google Scholar] [CrossRef]
- Rychel-Bielska, S.; Plewiński, P.; Kozak, B.; Galek, R.; Ksia̧żkiewicz, M. Photoperiod and Vernalization Control of Flowering-Related Genes: A Case Study of the Narrow-Leafed Lupin (Lupinus angustifolius L.). Front. Plant Sci. 2020, 11, 572135. [Google Scholar] [CrossRef]
- Hecht, V.; Laurie, R.E.; Vander Schoor, J.K.; Ridge, S.; Knowles, C.L.; Liew, L.C.; Sussmilch, F.C.; Murfet, I.C.; Macknight, R.C.; Weller, J.L. The Pea GIGAS Gene Is a FLOWERING LOCUS T Homolog Necessary for Graft-Transmissible Specification of Flowering but Not for Responsiveness to Photoperiod. Plant Cell 2011, 23, 147–161. [Google Scholar] [CrossRef]
- Laurie, R.E.; Diwadkar, P.; Jaudal, M.; Zhang, L.; Hecht, V.; Wen, J.; Tadege, M.; Mysore, K.S.; Putterill, J.; Weller, J.L.; et al. The Medicago FLOWERING LOCUS T Homolog, MtFTa1, Is a Key Regulator of Flowering Time. Plant Physiol. 2011, 156, 2207–2224. [Google Scholar] [CrossRef] [PubMed]
- Nelson, M.N.; Książkiewicz, M.; Rychel, S.; Besharat, N.; Taylor, C.M.; Wyrwa, K.; Jost, R.; Erskine, W.; Cowling, W.A.; Berger, J.D.; et al. The Loss of Vernalization Requirement in Narrow-leafed Lupin Is Associated with a Deletion in the Promoter and De-repressed Expression of a Flowering Locus T (FT) Homologue. New Phytol. 2017, 213, 220–232. [Google Scholar] [CrossRef]
- Surkova, S.Y.; Samsonova, M.G. Mechanisms of Vernalization-Induced Flowering in Legumes. Int. J. Mol. Sci. 2022, 23, 9889. [Google Scholar] [CrossRef]
- Taylor, C.M.; Kamphuis, L.G.; Zhang, W.; Garg, G.; Berger, J.D.; Mousavi-Derazmahalleh, M.; Bayer, P.E.; Edwards, D.; Singh, K.B.; Cowling, W.A.; et al. INDEL Variation in the Regulatory Region of the Major Flowering Time Gene LanFTc1 Is Associated with Vernalization Response and Flowering Time in Narrow-leafed Lupin (Lupinus angustifolius L.). Plant Cell Environ. 2019, 42, 174–187. [Google Scholar] [CrossRef]
- Van Dijk, A.D.J.; Molenaar, J. Floral Pathway Integrator Gene Expression Mediates Gradual Transmission of Environmental and Endogenous Cues to Flowering Time. PeerJ 2017, 5, e3197. [Google Scholar] [CrossRef] [PubMed]
- Jaeger, K.E.; Pullen, N.; Lamzin, S.; Morris, R.J.; Wigge, P.A. Interlocking Feedback Loops Govern the Dynamic Behavior of the Floral Transition in Arabidopsis. Plant Cell 2013, 25, 820–833. [Google Scholar] [CrossRef] [PubMed]
- Pullen, N.; Jaeger, K.E.; Wigge, P.A.; Morris, R.J. Simple Network Motifs Can Capture Key Characteristics of the Floral Transition in Arabidopsis. Plant Signal. Behav. 2013, 8, e26149. [Google Scholar] [CrossRef] [PubMed]
- Wang, C.C.; Chang, P.-C.; Ng, K.-L.; Chang, C.-M.; Sheu, P.C.; Tsai, J.J. A Model Comparison Study of the Flowering Time Regulatory Network in Arabidopsis. BMC Syst. Biol. 2014, 8, 15. [Google Scholar] [CrossRef]
- Leal Valentim, F.; Mourik, S.V.; Posé, D.; Kim, M.C.; Schmid, M.; Van Ham, R.C.H.J.; Busscher, M.; Sanchez-Perez, G.F.; Molenaar, J.; Angenent, G.C.; et al. A Quantitative and Dynamic Model of the Arabidopsis Flowering Time Gene Regulatory Network. PLoS ONE 2015, 10, e0116973. [Google Scholar] [CrossRef] [PubMed]
- Pavlinova, P.; Samsonova, M.G.; Gursky, V.V. Dynamical Modeling of the Core Gene Network Controlling Transition to Flowering in Pisum Sativum. Front. Genet. 2021, 12, 614711. [Google Scholar] [CrossRef]
- Gursky, V.V.; Kozlov, K.N.; Nuzhdin, S.V.; Samsonova, M.G. Dynamical Modeling of the Core Gene Network Controlling Flowering Suggests Cumulative Activation From the FLOWERING LOCUS T Gene Homologs in Chickpea. Front. Genet. 2018, 9, 547. [Google Scholar] [CrossRef]
- Duk, M.A.; Gursky, V.V.; Samsonova, M.G.; Surkova, S.Y. Modeling the Flowering Activation Motif during Vernalization in Legumes: A Case Study of M. Trancatula. Life 2024, 14, 26. [Google Scholar] [CrossRef]
- Sussmilch, F.C.; Berbel, A.; Hecht, V.; Vander Schoor, J.K.; Ferrándiz, C.; Madueño, F.; Weller, J.L. Pea VEGETATIVE2 Is an FD Homolog That Is Essential for Flowering and Compound Inflorescence Development. Plant Cell 2015, 27, 1046–1060. [Google Scholar] [CrossRef]
- Putterill, J.; Zhang, L.; Yeoh, C.C.; Balcerowicz, M.; Jaudal, M.; Gasic, E.V. FT Genes and Regulation of Flowering in the Legume Medicago Truncatula. Funct. Plant Biol. 2013, 40, 1199. [Google Scholar] [CrossRef]
- Plewiński, P.; Książkiewicz, M.; Rychel-Bielska, S.; Rudy, E.; Wolko, B. Candidate Domestication-Related Genes Revealed by Expression Quantitative Trait Loci Mapping of Narrow-Leafed Lupin (Lupinus angustifolius L.). Int. J. Mol. Sci. 2019, 20, 5670. [Google Scholar] [CrossRef]
- Trevaskis, B.; Bagnall, D.J.; Ellis, M.H.; Peacock, W.J.; Dennis, E.S. MADS Box Genes Control Vernalization-Induced Flowering in Cereals. Proc. Natl. Acad. Sci. USA 2003, 100, 13099–13104. [Google Scholar] [CrossRef] [PubMed]
- Brambilla, V.; Gomez-Ariza, J.; Cerise, M.; Fornara, F. The Importance of Being on Time: Regulatory Networks Controlling Photoperiodic Flowering in Cereals. Front. Plant Sci. 2017, 8, 665. [Google Scholar] [CrossRef] [PubMed]
- Plewiński, P.; Rychel-Bielska, S.; Kozak, B.; Maureira-Butler, I.J.; Iqbal, M.M.; Nelson, M.N.; Książkiewicz, M. FLOWERING LOCUS T Indel Variants Confer Vernalization-Independent and Photoperiod-Insensitive Flowering of Yellow Lupin (Lupinus luteus L.). Hortic. Res. 2022, 9, uhac180. [Google Scholar] [CrossRef]
- Fernandez, D.E.; Wang, C.-T.; Zheng, Y.; Adamczyk, B.J.; Singhal, R.; Hall, P.K.; Perry, S.E. The MADS-Domain Factors AGAMOUS-LIKE15 and AGAMOUS-LIKE18, along with SHORT VEGETATIVE PHASE and AGAMOUS-LIKE24, Are Necessary to Block Floral Gene Expression during the Vegetative Phase. Plant Physiol. 2014, 165, 1591–1603. [Google Scholar] [CrossRef]
- Bortesi, L.; Fischer, R. The CRISPR/Cas9 System for Plant Genome Editing and Beyond. Biotechnol. Adv. 2015, 33, 41–52. [Google Scholar] [CrossRef] [PubMed]
- Barker, S.J.; Si, P.; Hodgson, L.; Ferguson-Hunt, M.; Khentry, Y.; Krishnamurthy, P.; Averis, S.; Mebus, K.; O’Lone, C.; Dalugoda, D.; et al. Regeneration Selection Improves Transformation Efficiency in Narrow-Leaf Lupin. Plant Cell Tissue Organ Cult. 2016, 126, 219–228. [Google Scholar] [CrossRef]
- Kim, H.-J.; Hyun, Y.; Park, J.-Y.; Park, M.-J.; Park, M.-K.; Kim, M.D.; Kim, H.-J.; Lee, M.H.; Moon, J.; Lee, I.; et al. A Genetic Link between Cold Responses and Flowering Time through FVE in Arabidopsis Thaliana. Nat. Genet. 2004, 36, 167–171. [Google Scholar] [CrossRef] [PubMed]
- Lee, J.; Jung, J.; Park, C. INDUCER OF CBF EXPRESSION 1 Integrates Cold Signals into FLOWERING LOCUS C-mediated Flowering Pathways in Arabidopsis. Plant J. 2015, 84, 29–40. [Google Scholar] [CrossRef]
- Tiwari, S.B.; Shen, Y.; Chang, H.; Hou, Y.; Harris, A.; Ma, S.F.; McPartland, M.; Hymus, G.J.; Adam, L.; Marion, C.; et al. The Flowering Time Regulator CONSTANS Is Recruited to the FLOWERING LOCUS T Promoter via a Unique Cis-element. New Phytol. 2010, 187, 57–66. [Google Scholar] [CrossRef]
- Paltiel, J.; Amin, R.; Gover, A.; Ori, N.; Samach, A. Novel Roles for GIGANTEA Revealed under Environmental Conditions That Modify Its Expression in Arabidopsis and Medicago Truncatula. Planta 2006, 224, 1255–1268. [Google Scholar] [CrossRef] [PubMed]
- Hecht, V.; Knowles, C.L.; Vander Schoor, J.K.; Liew, L.C.; Jones, S.E.; Lambert, M.J.M.; Weller, J.L. Pea LATE BLOOMER1 Is a GIGANTEA Ortholog with Roles in Photoperiodic Flowering, Deetiolation, and Transcriptional Regulation of Circadian Clock Gene Homologs. Plant Physiol. 2007, 144, 648–661. [Google Scholar] [CrossRef]
- Liew, L.C.; Hecht, V.; Laurie, R.E.; Knowles, C.L.; Vander Schoor, J.K.; Macknight, R.C.; Weller, J.L. DIE NEUTRALIS and LATE BLOOMER 1 Contribute to Regulation of the Pea Circadian Clock. Plant Cell 2009, 21, 3198–3211. [Google Scholar] [CrossRef]
- Zhang, L.; Jiang, A.; Thomson, G.; Kerr-Phillips, M.; Phan, C.; Krueger, T.; Jaudal, M.; Wen, J.; Mysore, K.S.; Putterill, J. Overexpression of Medicago MtCDFd1_1 Causes Delayed Flowering in Medicago via Repression of MtFTa1 but Not MtCO-Like Genes. Front. Plant Sci. 2019, 10, 1148. [Google Scholar] [CrossRef]
- Jaudal, M.; Wen, J.; Mysore, K.S.; Putterill, J. Medicago PHYA Promotes Flowering, Primary Stem Elongation and Expression of Flowering Time Genes in Long Days. BMC Plant Biol. 2020, 20, 329. [Google Scholar] [CrossRef] [PubMed]
- Wang, X.; Zhang, J.; Liu, X.; Kong, Y.; Han, L. The Roles of the PSEUDO-RESPONSE REGULATORs in Circadian Clock and Flowering Time in Medicago Truncatula. Int. J. Mol. Sci. 2023, 24, 16834. [Google Scholar] [CrossRef]
- Seo, E.; Lee, H.; Jeon, J.; Park, H.; Kim, J.; Noh, Y.-S.; Lee, I. Crosstalk between Cold Response and Flowering in Arabidopsis Is Mediated through the Flowering-Time Gene SOC1 and Its Upstream Negative Regulator FLC. Plant Cell 2009, 21, 3185–3197. [Google Scholar] [CrossRef]
- Lee, J.; Lee, I. Regulation and Function of SOC1, a Flowering Pathway Integrator. J. Exp. Bot. 2010, 61, 2247–2254. [Google Scholar] [CrossRef] [PubMed]
- Fudge, J.B.; Lee, R.H.; Laurie, R.E.; Mysore, K.S.; Wen, J.; Weller, J.L.; Macknight, R.C. Medicago Truncatula SOC1 Genes Are Up-Regulated by Environmental Cues That Promote Flowering. Front. Plant Sci. 2018, 9, 496. [Google Scholar] [CrossRef] [PubMed]
- Poulet, A.; Zhao, M.; Peng, Y.; Tham, F.; Jaudal, M.; Zhang, L.; Van Wolfswinkel, J.C.; Putterill, J. Gene-Edited Mtsoc1 Triple Mutant Medicago Plants Do Not Flower. Front. Plant Sci. 2024, 15, 1357924. [Google Scholar] [CrossRef]


Disclaimer/Publisher’s Note: The statements, opinions and data contained in all publications are solely those of the individual author(s) and contributor(s) and not of MDPI and/or the editor(s). MDPI and/or the editor(s) disclaim responsibility for any injury to people or property resulting from any ideas, methods, instructions or products referred to in the content. |
© 2024 by the authors. Licensee MDPI, Basel, Switzerland. This article is an open access article distributed under the terms and conditions of the Creative Commons Attribution (CC BY) license (https://creativecommons.org/licenses/by/4.0/).