1. Introduction
Pigeon pea (
Cajanus cajan L.) is a perennial legume with global cultivation predominantly in tropical and semitropical regions. Globally, pigeon pea production is ranked sixth after dry bean, chickpea, field pea, cowpea, and lentil [
1]. The South Asia region is the primary producer, contributing to more than 90% of the world’s pigeon pea production [
1]. In Kenya, pigeon pea ranks third among food grain legumes, after common bean and cowpea [
2]. The widespread popularity of pigeon pea among smallholder farmers can be attributed to its multifaceted utility. Notably, pigeon pea seeds are highly nutritious and serve as a crucial protein source, particularly for people in developing countries [
3,
4,
5]. Mature pigeon pea seeds contain approximately 18.8% protein, 53% starch, 2.3% fat, 6.6% crude fibre, and 250.3 mg of minerals per 100 g [
6]. Additionally, pigeon pea possesses medicinal properties due to the presence of various phytochemicals, including alkaloids (34%), flavonoids (46%), sterols (22%), and phenols (44%), contributing to its significant role in traditional medicine [
7]. Pigeon pea plants offer fodder for domestic animals, materials for thatching and fencing, contribute to soil erosion control, and provide fuel wood [
2,
8]. Being a perennial shrub, pigeon pea offers advantages such as multiple harvests and significant contributions to soil fertility [
2]. The crop boasts high biomass productivity primarily used as fodder, and enriches soil nutrient and moisture content [
9,
10]. Importantly, pigeon pea serves as a cash crop for low-income farmers, enhancing their economic stability [
11]. However, the yield of pigeon pea is still low to the partial adaptability of the available genotypes to environmental stresses associated with climate change.
Climate change, particularly irregular rainfall and prolonged droughts, poses significant risks to crop development and growth [
12]. Pigeon pea is known to exhibit drought tolerance, although drought stress significantly affects its development and growth at the seedling and early reproductive phases. Therefore, assessing drought stress tolerance in pigeon pea at the seedling stage is vital in the context of current and projected erratic precipitation patterns and prolonged droughts as a result of climate change [
13]. Drought stress profoundly affects crop performance, triggering physiological and biochemical responses with intricate implications for growth and yield [
14]. Reactive oxygen species (ROS) and reactive nitrogen species (RNS) generated under drought stress disrupt cellular redox regulatory functions, inducing oxidative stress [
15,
16]. The delicate balance between ROS production and the antioxidant defence system determines the cellular damage extent, impacting membrane integrity, protein structure, and nucleic acid stability [
17,
18,
19].
Oxidative stress adversely affects plant health, growth, and development, causing lipid peroxidation, enzyme inactivation, and DNA damage [
18,
19]. Elevated ROS levels under drought stress compromise membrane integrity, disrupting nutrient uptake and transport, and alter protein structure, leading to enzyme inactivation [
18,
19]. These impacts extend to nucleic acids, with ROS-induced DNA damage affecting genetic stability [
17,
18,
19]. Oxidative stress inhibits cell division and elongation, resulting in stunted growth and a reduced leaf area in plants facing water deficit conditions [
18,
20]. These alterations collectively compromise reproductive development in crops enduring prolonged water deficit, adversely affecting yield components such as grain number and size, impacting economic returns for farmers [
21]. Stomatal closure, a fundamental water conservation mechanism, limits carbon dioxide influx for photosynthesis, reducing energy production and altering carbon partitioning [
22]. This contributes to reduced photosynthetic activity, coupled with membrane injury and altered enzyme functioning, especially associated with ATP synthesis [
16]. Hormonal signalling, notably involving abscisic acid (ABA), plays a crucial role in regulating drought response mechanisms [
23,
24]. Prolonged drought disrupts hormonal homeostasis, profoundly impacting overall plant growth and development [
20,
24,
25]. Drought-induced outcomes include decreased cell division, compromised root differentiation, altered foliage dimensions, reduced shoot length, and modified stomatal movements, collectively diminishing water and mineral nutrition associations, ultimately decreasing the plant yield and water usage efficacy [
25]. Given the global challenge of sustaining food production under changing climatic conditions, these physiological alterations underscore the urgent need for drought-resilient crops.
The success of breeding programs in any crop relies on the genetic variability among the genotypes available to breeders for developing desirable varieties [
26]. They are crucial for assessing the availability and variability of target traits in breeding programs [
27,
28,
29]. Genetic variation is paramount for effective breeding and germplasm conservation of pigeon pea genotypes [
30,
31,
32]. Exploring genetic variations within pigeon pea genotypes can lead to the development of improved cultivars that are more resilient to environmental stress and better suited to the diverse needs of farmers and consumers [
30,
33]. Therefore, assessing genetic variation is the foundation in plant breeding as it enables the selection of varieties that exhibit desirable traits for crop improvement programs [
34,
35]. Molecular markers have been reported to be effective in the determination of the genetic variation of crop plants [
36,
37]. The start codon targeted (SCoT) marker is one of the molecular markers and exclusively targets the gene loci bordering the translation start codon (i.e., ATG) on both sense and antisense strands of DNA [
38]. The start codon targeted marker–based system has distinct advantages over other widely used molecular markers such as SSR, RAPD, ISSR, and AFLP. The advantages include its simplicity requiring a single primer for amplification, cost-effectiveness, high reproducibility, high polymorphism, and extensive genetic information [
39,
40,
41,
42,
43]. Notably, it exhibits universality across various plant species. These features render SCoT marker–based genotyping an efficient and versatile tool for studying trait-associated variations in pigeon pea.
In this study, we hypothesize (Null; Ho) that variations are absent in morphological, physiological, and biochemical responses of pigeon pea genotypes to drought stress against the Alternate Hypothesis (H1) that variations exist in responses of pigeon pea genotypes to drought stress as may be revealed in morphological, physiological, and biochemical traits. We thus report the evaluation of the response of eight genotypes of pigeon pea to drought stress treatments, with the overall aim of identifying pigeon genotypes with the potential as drought-tolerant hybrids.
3. Discussion
Drought stress poses a significant challenge to crop productivity and pigeon pea (Cajanus cajan L.) is no exception to its impact. The present study confirmed the significant reduction in shoot and root growth under drought stress. The shoot and root inhibition pattern and reduction in biomass production also differed among the four genotypes when subjected to drought stress. The differential genotype response to drought stress suggests a great deal of genetic variation among genotypes. The growth suppression and biomass reduction were lowest in LM, KT, and SM compared to other pigeon pea genotypes in drought stress conditions, indicating its ability to withstand drought stress. Therefore, these parameters could be used as morphological criteria for detecting drought stress tolerance and susceptibility in pigeon pea plants.
In the present study, under escalating water stress, pigeon pea plants exhibited a substantial decrease in the quantum yield of photosystem II (Phi 2) across all the eight genotypes, aligning with findings previously reported in
Lablab purpureus [
44]. This reduction demonstrates the photosynthetic sensitivity of pigeon pea to water deficit, with diverse responses highlighting the effect of genotypic variations. The photosystem II quantum efficiency (FvP/FmP) ratio, a crucial indicator of photosystem II (PSII) photochemical efficiency, consistently declined with the severity of water stress, providing a direct measure of plant stress exposure [
45]. Despite initial higher values under moderate water stress, the FvP/FmP ratios significantly reduced under extreme stress conditions, consistent with trends observed in soybeans due to increased susceptibility to photo-oxidative stress, and impaired PSII efficiency [
46,
47]. Under water stress conditions, all the pigeon pea genotypes exhibited a consistent decline in photochemical efficiency (FvP/FmP) coupled with a notable increase in non-photochemical quenching (NPQt). This heightened NPQt acts as a protective mechanism for PSII against damaging conditions, dissipating excess excitation energy as heat [
46,
48]. The dynamic response of NPQt under different stress levels, especially its dramatic increase under severe water stress, highlights the plant’s effective regulation of excess energy, preventing potential photodamage [
49,
50]. Additionally, the positive correlation between Phi2 and FvP/FmP suggests that genotypes with higher PSII photochemistry efficiency also enhance overall photosynthetic efficiency, potentially impacting improved crop yields [
51,
52].
This study revealed that the genotypes LM and KAT consistently maintained RWC levels and photosynthetic pigments, which acted to maintain high photosynthetic efficiency in these genotypes under water stress conditions. This is corroborated by the unaltered levels of soluble sugars in the leaves of drought-stressed plants. This aligns with previous studies demonstrating that genotypes exhibiting superior water retention capabilities are inherently more resilient to drought stress [
53,
54]. The findings from this study confirms earlier studies [
55], emphasizing the adverse impact of water stress on the RWC in plants. The observed variability in the RWC in the pigeon pea genotypes in response to water stress demonstrates the genetic variability in drought tolerance [
54]. The genotypes LM and KAT characterized by their ability to maintain higher RWC levels and photosynthetic pigments emerged as potential drought-tolerant candidates. Proline accumulation in severely stressed plants of genotypes LM and KAT might play an active role in the regulation of the RWC and membrane damage from growth recovery as previously reported for cotton [
56], rice [
57],
Pinus ponderosa trees [
58], and wheat [
59,
60] under water stress.
Previous studies have reported increased ROS production in response to drought stress across diverse plant species [
18,
61,
62,
63]. In this study, a significant increase in MDA content and H
2O
2 occurred in the leaf tissues of all eight pigeon pea genotypes under severe water stress conditions. The elevated levels of these oxidative stress markers contribute to the destruction of photosynthetic pigments, protein denaturation, and eventually programmed cell death [
64,
65]. Water-stressed pigeon pea genotypes displayed elevated activities of ascorbate peroxidase (APX) and catalase (CAT) compared to control plants, indicating enhanced plant tolerance to oxidative damage by reinforcing antioxidant defence mechanisms [
66]. Notably, leaves of drought-stressed plants exhibited a significant rise in CAT activity, reaching levels of 2.13 units/mg protein in genotype KAT. This may be attributed to the increased accumulation of H
2O
2 and MDA, leading to the excitation of the activities of ROS scavenging enzymes. Fluctuations in catalase activity among genotypes could be as a result of unique molecular responses to water deficit, reflecting genetic heterogeneity in drought stress responses in diverse genotypes [
67,
68]. Some genotypes, including P1, P3, SM, and MM, showed increased catalase activity under water stress, suggesting their high capacity to upregulate enzyme production to protect against ROS accumulation and oxidative damage.
Peroxidases, essential for detoxifying ROS, play a crucial role in safeguarding plant cells from oxidative damage [
69,
70]. Genotypes P1, P3, P9, SM, MM, and KAT exhibited increased APX activity under water stress. Peroxidase activity (POD) was significantly increased under water stress for genotypes P3, SM, MM, LM, and KAT. The increased scavenging enzymes activity in these genotypes under water stress suggests their capacity to upregulate enzyme production to protect against ROS accumulation and oxidative damage. The decline in enzymatic activities in some genotypes indicates that these genotypes might have a low capacity to catalyse reactive oxygen species under water stress conditions. This may also suggest that these genotypes may be susceptible to prolonged drought stress and oxidative damage [
71,
72,
73].
Phenolic compounds as secondary metabolites play a vital role in plants’ adaptation and defence mechanisms under adverse environmental conditions, including drought stress. The reduction in total phenolic compounds (TPCs) across these genotypes suggests potential consequences in their ability to withstand and adapt to drought stress. However, a notable exception to this trend was observed in genotype P2, which showed an increase in the accumulation of total phenolics compared to its control. The observed increase in phenolic content in genotype P2 under water stress conditions may be due to enzyme activation [
74]. This suggests that genotype P2’s response to drought could be regulated by phenolic acids, offering a potential approach to improve drought tolerance in pigeon pea through manipulation of the phenylpropanoids pathway [
75,
76,
77].
The increased sensitivity to drought in the pigeon pea genotypes is linked to a decrease in soluble carbohydrate accumulation, likely a consequence of impaired CO
2 assimilation under water limitation [
78,
79]. The higher concentration of total soluble sugars in control plants, compared to drought-stressed plants, is attributed to the abundance of water, facilitating efficient sugar synthesis and accumulation through photosynthesis [
80]. Water stress reduced the total soluble sugar content in five pigeon pea genotypes (P2, P9, SM, MM, and KAT) accompanied by significant decreases in Phi2, FvP/FmP, and SPAD values. This decline in FvP/FmP, indicating PSII quantum efficiency, suggests a potential decrease in photosynthesis, leading to reduced sugar synthesis. Conversely, drought stress increased the total sugar content in genotypes P1, P3, and LM, despite declines in photosynthetic parameters Phi2, FvP/FmP, and SPAD. This increase may result from reduced plant growth before photosynthesis under moderate drought [
81], leading to an excess of carbon skeletons redirected towards osmolyte production [
82]. Under adverse conditions, the soluble sugar is essential for maintaining membrane integrity and adjusting osmotic pressure.
The protein content analysis revealed an increase in three out of the eight pigeon pea cultivars—specifically, genotypes P9, LM, and KAT. This elevation in protein levels under water stress aligns with the notion that stress-induced proteins may serve as a form of nitrogen storage, utilized later by the plant, or contribute to osmotic adaptation [
83,
84]. Drought stress can intricately influence protein synthesis, with evidence suggesting both the induction of new proteins to enhance plant survival and, paradoxically, the degradation of leaf proteins under severe water deficiency, leading to a shift towards free amino acids and decreased protein synthesis [
85,
86,
87]. This study revealed a significant increase in total free amino acids under intensified drought stress across the pigeon pea genotypes, except for genotype LM, which showed a decline under severe water stress. Notably, genotype P3 exhibited the most substantial rise in free amino acid content, highlighting its pivotal role as an adaptation strategy during water deficit stress conditions. These amino acids contribute to detoxifying reactive oxygen species, regulating pH, and facilitating osmotic adjustments [
88,
89]. This increase in free amino acids is attributed to heightened protein degradation, which enhances osmotic potential and drought tolerance, while also serving as a reservoir of nitrogen and carbon for essential metabolic processes.
The results reveal a linear increase in proline content with escalating drought stress, with genotypes P2, SM, and LM exhibiting the highest proline accumulation under severe water stress conditions. This increased proline accumulation aligns with its established role as an osmo-protectant and stress-responsive molecule, crucial for maintaining osmotic balance, stabilizing cellular structures, and mitigating the negative impacts of drought stress [
90,
91,
92]. The significance of proline in drought tolerance lies in its contribution to cellular protection against osmotic stress, stabilization of macromolecules, and maintenance of redox balance, as well as serving as a reservoir of carbon and nitrogen for future metabolic demands after stress alleviation. The increase in proline levels in pigeon pea plants experiencing severe water stress might actively contribute to maintaining the relative water content (RWC) and mitigating membrane damage [
93]. Despite this consistent pattern, genotype P3 exhibited a sustained low-level increase in proline content under extreme water stress. These diverse responses underscore the genetic variability in stress tolerance mechanisms among the pigeon pea genotypes, with genotype P2 showcasing a robust potential for proline accumulation as part of their stress adaptation strategy.
The observed variability in proline accumulation within the pigeon pea genotypes resonates with similar findings in rice and wheat, emphasizing the genetic variability underpinning stress responses [
94,
95]. This diversity carries implications for breeding strategies aimed at enhancing drought tolerance in pigeon pea, urging the prioritization of genotypes with a higher capacity for proline accumulation. The significance of proline in drought response is further supported by studies in other plant species such as strawberries, peas, and petunias, where proline accumulation and antioxidant enzyme activity were upregulated in response to drought stress [
96,
97,
98]. These consistent observations across diverse plant species underscore the conserved nature of the role and regulation of proline in response to water deficit [
91], reinforcing its importance in the context of drought stress adaptation in pigeon pea plants.
Understanding genetic diversity within pigeon pea populations is critical for guiding future breeding initiatives, ensuring the preservation of necessary genetic diversity for a robust breeding program [
99]. The current study revealed low levels of observed heterozygosity (0.40) and gene diversity (GD) (0.44) among the studied population, indicating a prevalence of homozygous individuals sharing common alleles. The reduced heterozygosity aligns with the self-pollinating nature of
C. cajan [
100] and is consistent with findings among Tanzanian pigeon pea accessions [
101]. The polymorphic information content (PIC) values ranged from 0.0 to 0.39, averaging 0.335, indicating moderate genetic variability, consistent with findings in other legume crops [
99,
102,
103]. The observed variation in PIC values can be attributed to genotypic differences within the pigeon pea genotypes, with one marker (SCoT10) showing a PIC value of 0, thus indicating its inability to discriminate between genotypes. The moderate PIC value in this study indicates a moderate degree of polymorphism among the pigeon pea genotypes, facilitating a precise estimation of genetic distance. Among the primers, SCoT7 and SCoT29 displayed the highest PIC values (0.38), suggesting their moderate utility for assessing genetic diversity within the pigeon pea genotypes.
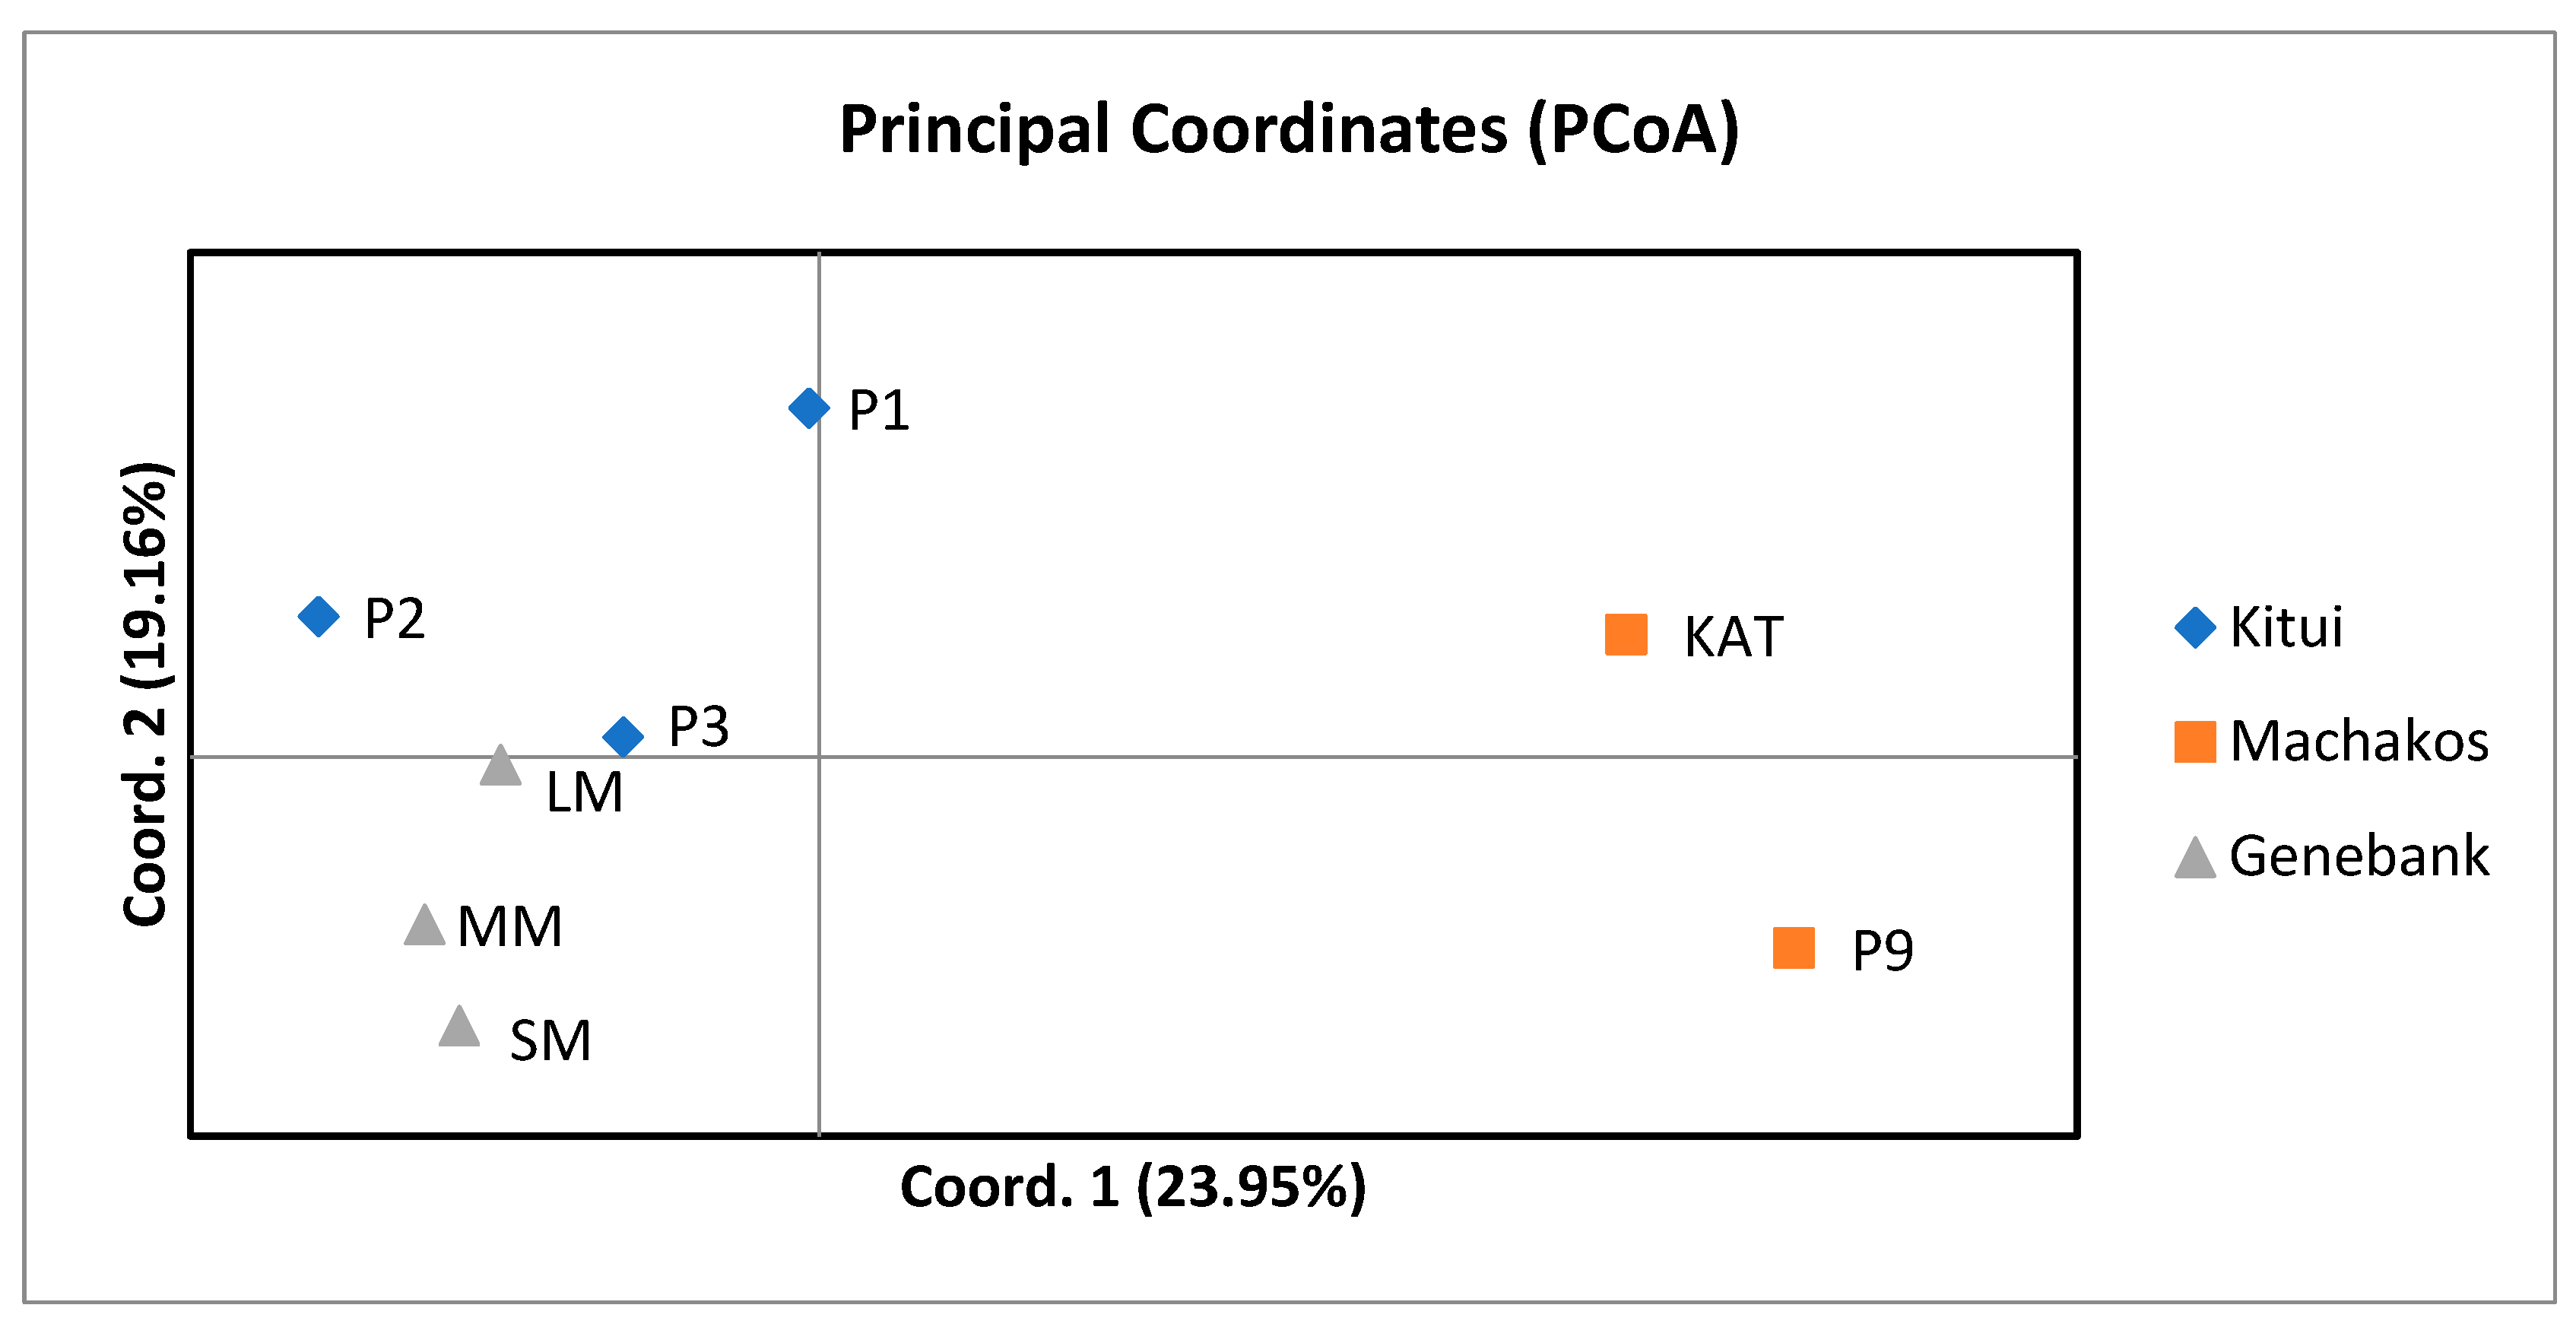
The principal coordinate analysis (PCoA) results revealed three distinct sub-populations influenced by geographical adaptation. The pigeon pea population from Kitui County showed the highest genetic similarity, emphasizing the importance of considering geographical origins in breeding decisions. To validate differentiation between populations, the findings indicated significant molecular variance among and within populations. The distribution of variance within populations aligns with observations in other cross-pollinating species and studies involving SCoT markers, contrasting with self-pollinating plant species, which typically exhibit greater genetic diversity among populations [
27].
The analysis of molecular variance uncovered a significant proportion of genetic variation within populations, contrasting with a relatively low difference among the three studied populations. These findings are similar to the observations by Kimaro et al. [
101], who reported a higher genetic variation of 53.3% within pigeon pea accessions using SSR markers. The restricted genetic diversity within pigeon pea cultivars, encompassing only a fraction of the overall genetic diversity present in the pigeon pea gene pool, aligns with previous research [
104,
105]. This study reinforces earlier findings indicating limited genetic variation among the cultivated pigeon pea genotypes collected in Africa [
106].
The SCoT markers demonstrated low genetic diversity among the eight tested pigeon pea genotypes. The observed low genetic diversity can be attributed partly to the self-pollinating nature of pigeon pea and the limited geographic origins of the studied genotypes [
107,
108], which were obtained from the Eastern Province region of Kenya. The implications of limited genetic diversity within these genotypes are particularly significant for pigeon pea breeding programs since the adoption of genetically homogeneous cultivars has historically led to reduced plant genetic diversity, rendering crops susceptible to diseases and pests [
106]. Pigeon pea, despite its morphological diversity, lacks comparable molecular-level diversity, emphasizing the need for strategic breeding decisions.
4. Materials and Methods
4.1. Plant Materials and Effect of Drought on Pigeon Pea Accessions at the Seedling Stage
Eight pigeon pea landraces were used in the experiment, three of which were obtained from the National Genebank of Kenya domiciled at the Genetic Resources Research Institute (GeRRI) of the Kenya Agricultural and Livestock Research Organisation (KALRO) and five from farmers’ fields in Lower Eastern (Machakos and Kitui Counties), Kenya.
The experiment was carried out using a completely randomized design with five replications. Three seeds of each pigeon pea landrace were grown in pre-weighed soil in 15 cm diameter plastic pots and left to germinate under greenhouse conditions. Thinning was performed on the seventh day and only one seedling was left to grow in each pot. On the 14th day, three stress treatments were induced by adjusting water content to 100% field capacity (FC) as a control, 50% FC (moderate drought stress), and 25% FC (severe drought stress). Drought stress was applied by first subjecting all the plants to maximum saturation level for 24 h after which, the water was emptied from the holding trays. The water absorbed was allowed to drain for 24 h for the soil to attain field capacity (FC) retention. Subsequently, the weights of individual pots were taken and the amount of water retained in the soil was recorded. Drought stress was induced by maintaining the pots with 50% FC and 25% FC. The pots were monitored daily and watered to their respective weights. The amount of water added to each pot was calculated using the percentage of pot water capacity [
109].
4.2. Assessment of Growth and Biomass Production Parameters
Five randomly selected pigeon pea plants were taken to evaluate the growth performance by measuring the shoot length (SL) and the root length (RL) in plants grown under normal and drought stress conditions. The data were collected after exposure to drought stress treatments for 28 days. Plants along with the roots were carefully removed from the soil, the roots were rinsed gently with tap water, and were then placed in tissue paper to absorb moisture. The fresh weights (FW) of individual plants were measured by using an electronic weighing machine (ELICO Electronic, Georgiev KD, Bulgaria). Afterwards, the plants were wrapped in aluminium foil and kept in an oven at 70 °C for 72 h to obtain the dry weight (DW).
4.3. Measurement of Physiological Parameters
After exposure to drought stress treatment for 28 days, measurements of physiological variables including photosynthetic rate, chlorophyll content (SPAD), leaf temperature (LT), linear electron flow (LEF), quantum yield of photosystem II (Phi2), ratio of incoming light (excited electrons) that goes towards non-photochemical quenching (PhiNPQ), ratio of incoming light that is lost via non-regulated processes (PhiNO), non-photochemical quenching (NPQt), and maximum quantum yield of photosystem II (FvP/FmP) were analysed using MultspeQ Beta Device v1.0 (East Lansing, MI, USA). In addition, the leaf samples were harvested and used to determine the relative water content (RWC).
4.4. Determination of the Relative Water Content
The estimation of the relative water content was determined according to the protocol described by Mullan and Pietragalla [
110]. Fully expanded leaves that were exposed to maximum sunlight were selected from the plants in the glasshouse on the 14th day after the start of the drought stress treatment. The leaf samples were placed in pre-weighed sample tubes and hermetically sealed with a lid. Subsequently, the individual tubes were weighed to obtain the fresh weight (FW) of the leaves. Distilled water (1 mL) was added to each tube, and the tubes were then kept in darkness at 4 °C for 24 h to enable the leaves to attain full turgor. The leaf samples were then carefully removed from the tubes and blotted dry with paper towels. The turgid weight (TW) was measured by weighing each leaf sample. The leaf samples were then placed in labelled envelopes and dried for 48 h in an oven at 70 °C. The dry weight was recorded, and the relative water content (RWC) was calculated using the formula
where FW is the fresh weight, DW is the dry weight, and TW is the turgid weight.
4.5. Determination of the Malondialdehyde and Hydrogen Peroxide Content
The content of MDA was determined as described by Shin et al. [
111], whereby leaf tissue (0.5 g) of stressed and non-stressed plants were ground into a fine paste using 2 mL of ice-cold trichloroacetic acid (0.1%
w/
v). The fine homogeneous paste was centrifuged at 18,626×
g for 10 min at 4 °C. Exactly 0.5 mL of the supernatant was mixed with 1.5 mL solution of 10% trichloroacetic acid and 0.25% thiobarbituric acid (TBA) reagent. The mixture was then placed in a hot water bath at 95 °C for 30 min, cooled on ice for 5 min, and centrifuged at 855.3×
g for 10 min. To quantify the MDA concentration, 200 μL of the supernatant was subjected to spectrophotometric analysis by measuring the absorbance (A
532 and A
600). To the supernatant, 1 mL of 20% (
w/
v) TCA containing 0.5% (
w/
v) TBA was added and incubated in a water bath at 95 °C for 30 min and quickly cooled on ice. The mixture was spun at 9503×
g for 10 min and the absorbance was measured at 532 and 600 nm using a UV-mini 1240 spectrophotometer (Shimadzu, Kyoto, Japan). A molar absorptivity value of 155 mM
−1 cm
−1 was deployed to calculate the MDA content after taking away the non-specific turbidity reading at 600 nm. The malondialdehyde concentration was calculated with its extinction coefficient 155 mM
−1 cm
−1 and expressed as nmol malondialdehyde g
−1 fresh mass using the formula
where A532 nm denotes the maximum absorbance of the TBA-MDA complex, A600 nm represents the correction for non-specific turbidity, and 155 mM
−1 cm
−1 is the specific molar extinction coefficient for MDA.
All measurements were conducted three times using three independent extracts from one plant sample.
The hydrogen peroxide content was measured as described by Velikova et al. [
112]. Briefly, 0.5 g leaf sample was homogenized with 2 mL cold 0.1% (
w/
v) TCA. The suspension was spun at 1164×
g for 30 min at 4 °C. Then, 0.5 mL of the supernatant, 0.5 mL 10 mM potassium phosphate buffer (pH 7.0), and 1 mL of 1 M potassium iodide was added and mixed. The absorbance was read at 390 nm and the amount of H
2O
2 was calculated using the extinction coefficient 0.28/mM/cm and expressed as μmol/g FW (fresh weight).
4.6. Determination of Antioxidant Enzyme Activities
Leaf samples from water-stressed plants were collected 14 days after the initiation of drought stress. These samples were then crushed into a fine paste using a sterilized cold mortar and pestle in 2 mL of extraction buffer (100 mM KHPO4 (pH 6.8), 0.2 mM EDTA, and 1% (w/v) polyvinylpyrrolidone). The mixture was then spun in a Mikro 200R centrifuge (Andreas Hettich Gmbh, Tuttlingen, Germany) at 19,980× g for 20 min at 4 °C. The supernatants were then assayed for ascorbate peroxidase, total peroxidase, and catalase enzyme activities.
Ascorbate peroxidase (APX) activity was assayed by monitoring ascorbic acid oxidation and recording the change in absorbance at 290 nm. The leaf extract (10 µL) was mixed with 2 mL reaction buffer (0.2 mM Tris/HCl buffer (pH 7.8), 0.5 mM hydrogen peroxide, and 0.25 mM ascorbic acid). The activity of APX was calculated from the extinction coefficient (2.8 mM
−1 cm
−1) of ascorbate as delineated by Nakano and Asada [
113]. The APX activity was expressed in units per mg of protein (U/mg protein).
Total peroxidase (POD) activity was assayed by adding 50 µL of the leaf extract to 2 mL reaction mixture (0.05 M sodium acetate buffer (pH 7.0), 0.025 M guaiacol, and 0.025 M hydrogen peroxide). The total peroxidase activity was determined by recording the increase in absorbance due to the formation of tetra-guaiacol at 470 nm, taking the coefficient of extinction for the reaction to be 26.6 mM−1 cm−1. The POD activity was expressed in units per mg of protein (U/mg protein).
The catalase (CAT) activity was determined following the Cakmak et al. [
114] protocol. First, 50 μL of the enzyme extract, 3 mL of reaction buffer (15 mM H
2O
2 and 50 mM phosphate buffer (pH 7.0)) was added. Then, catalase activity was determined from absorbance readings at 240 nm for 1 min; the readings decreased with the decay of H
2O
2. The activity of CAT was subsequently calculated as described by Nakano and Asada [
113] using the formula
The CAT activity was expressed in units per mg of protein (U/mg protein).
4.7. Determination of Total Soluble Sugars (SS)
The phenol-sulphuric acid technique as described by Chen et al. [
115] was used to quantify soluble sugars. Briefly, leaf samples (0.2 g) were homogenized in 70% ethanol, and the resulting homogenates were centrifuged at 6082×
g for 10 min. A 2 mL aliquot of the carbohydrate solution was mixed with a 5% phenol solution and concentrated sulphuric acid, followed by incubation and colour development for 10 min. Optical density readings at 490 nm were taken against dilute sulphuric acid as a blank. Redistilled phenol and freshly prepared 5% phenol in water were used. Glucose standard solution facilitated sugar quantification. The concentration of carbohydrates was calculated based on D-glucose calibration using the following equation:
where A
490 is the final absorbance at 490 nm, α represents the equation of the slope, and (β) denotes the intercept of the slope.
4.8. Determination of the Total Phenolic Content (TPC)
The total phenolic content in pigeon pea leaf samples was determined following the protocol of Ainsworth and Gillespie [
116]. Leaf samples (0.5 g) were ground in absolute ethanol and incubated at 25 °C for 48 h. The supernatant (1 mL) obtained after centrifugation was mixed with 5 mL of 0.2 N Folin–Ciocalteau reagent (FCR) and 4 mL of sodium carbonate. After incubation for 1 h at 25 °C, optical density was measured at 765 nm, and phenolic content was quantified using a gallic acid standard curve. The results were expressed as mg of gallic acid equivalent (GAE) per gram of extracts (mg/gFW). The gallic acid standard curve was prepared using concentrations of gallic acid solutions (25, 50, 75, and 100 μg/mL) with an R
2 value of 0.9523. The total phenolic content was expressed as mg GAE per 100 g of dry sample (mg/100 g) after correcting for dilution.
4.9. Estimation of Total Soluble Proteins (SP), Total Free Amino Acids (TFA), and Proline Content
The Bradford assay method [
117] was used to determine the quantities of total soluble proteins in both non-stressed and drought-stressed plants. Specifically, 1 mL of the Bradford reagent was mixed with 0.1 mL of the crude extract, and the optical density was measured at 595 nm. The protein concentrations were approximated using the regression equation derived from a standard curve prepared with 1 mg/mL bovine serum albumin (BSA).
Total free amino acids in non-stressed and drought-stressed pigeon pea plants were assessed through a ninhydrin-based colorimetric assay following Huang and Wu’s protocol [
118]. Leaf samples (0.2 g) were homogenized in 5 mL of absolute ethanol, and amino acids were extracted by heating the crude extracts in a water bath at 95 °C for 1 h. After cooling, the mixture was centrifuged at 9500×
g for 10 min, and 1 mL of the supernatant was mixed with 0.5 mL of 2% (
w/
v) ninhydrin and 0.2 M phosphate buffer (pH 8.0). The absorbance was measured at 570 nm using a UV–Vis spectrophotometer (Shimadzu, Kyoto, Japan), and proline reference standards were prepared at a concentration of 1 mg/mL.
To quantify proline content, 0.1 mg of fresh leaf tissues from both non-stressed and drought-stressed samples were homogenized in 3% aqueous sulphosalicylic acid. After centrifugation at 9503× g for 5 min at room temperature, reaction mixtures were prepared with 1 mL of plant extract supernatant, 1 mL of sulphosalicylic acid, and 2 mL each of glacial acetic acid and acidic ninhydrin. After incubation at 96 °C for 1 h and termination, the reacted samples were extracted with toluene, and absorbance was measured at 520 nm using toluene as a blank. Proline concentrations were estimated based on a standard concentration curve, calculated on a fresh weight basis, and expressed as milligrams per gram FW.
4.10. Genomic DNA Extraction
The DNA extraction from fresh leaves of pigeon pea landraces followed the cetyltrimethyl bromide (CTAB) protocol [
119]. The resulting pellet was dissolved in 50 µL sterile water and treated with RNAase (10 μg/mL) and DNA quantified spectrophotometrically (UV-mini 1240, Shimadzu-Japan). Genomic DNA size and quality were verified through agarose gel electrophoresis (1%
w/
v agarose gel, 0.05 mg/mL ethidium bromide) at 80 V for 60 min in an electrophoresis tank (Bio-Rad, Gmbh—FeldKirchen, Germany).
4.11. PCR Amplification of SCoT Markers and Product Electrophoresis
The PCR reaction of the isolated genomic DNA was carried out in a 25 μL reaction volume, which included 2.0 μL DNA (50 ng/μL), 12.5 μL of Ampliqon Taq DNA polymerase (Ampliqon A/S, Odense M, Denmark), 1.0 μL of SCoT primers (Macrogen Europe, Maastrichit, The Netherlands;
Table 7), and 9.5 μL of sterile double-distilled water. The amplification was performed in a PTC-1196 thermocycler (Bio-Rad, Hercules, CA, USA) under the following conditions: pre-heating for 5 min at 94 °C; 35 cycles, with each cycle lasting 45 s at 94 °C; annealing temperature varying depending on the primers and carried out for 45 s; elongation at 72 °C for 60 s; and finally a final extension at 72 °C for 7 min. The amplified products were visualized using 1% agarose gel stained with ethidium bromide (0.05 mg/mL) and on a Gel-Doc
TM XR+ Imaging System (Bio-Rad, Gmbh – FeldKirchen, Germany) under UV light. The size of the bands was estimated with reference to GeneRuler 1 kb and 100 bp ladder standard markers (Fischer Thermo Scientific, Waltham, MA, USA).
4.12. PCR Scoring and Data Analysis
The resulting amplicon patterns were scored as either absent (0) or present (1) following the method described by Collard and Mackill [
39]. These patterns were subsequently compared to assess the genetic relationship between the eight pigeon pea genotypes.
Genetic parameters were computed using GenAlEx V6.503 software [
120]. These parameters included total amplified bands (TAB), monomorphic bands (MB), percentage bands per loci (PB), resolving power (Rp), heterozygosity (HT), effective number of alleles (Ne), genetic diversity (GD), and the Shannon Information Index (I). PowerMarker v2.3.4 [
121] was used to calculate the polymorphic information content (PIC) of each genotype.
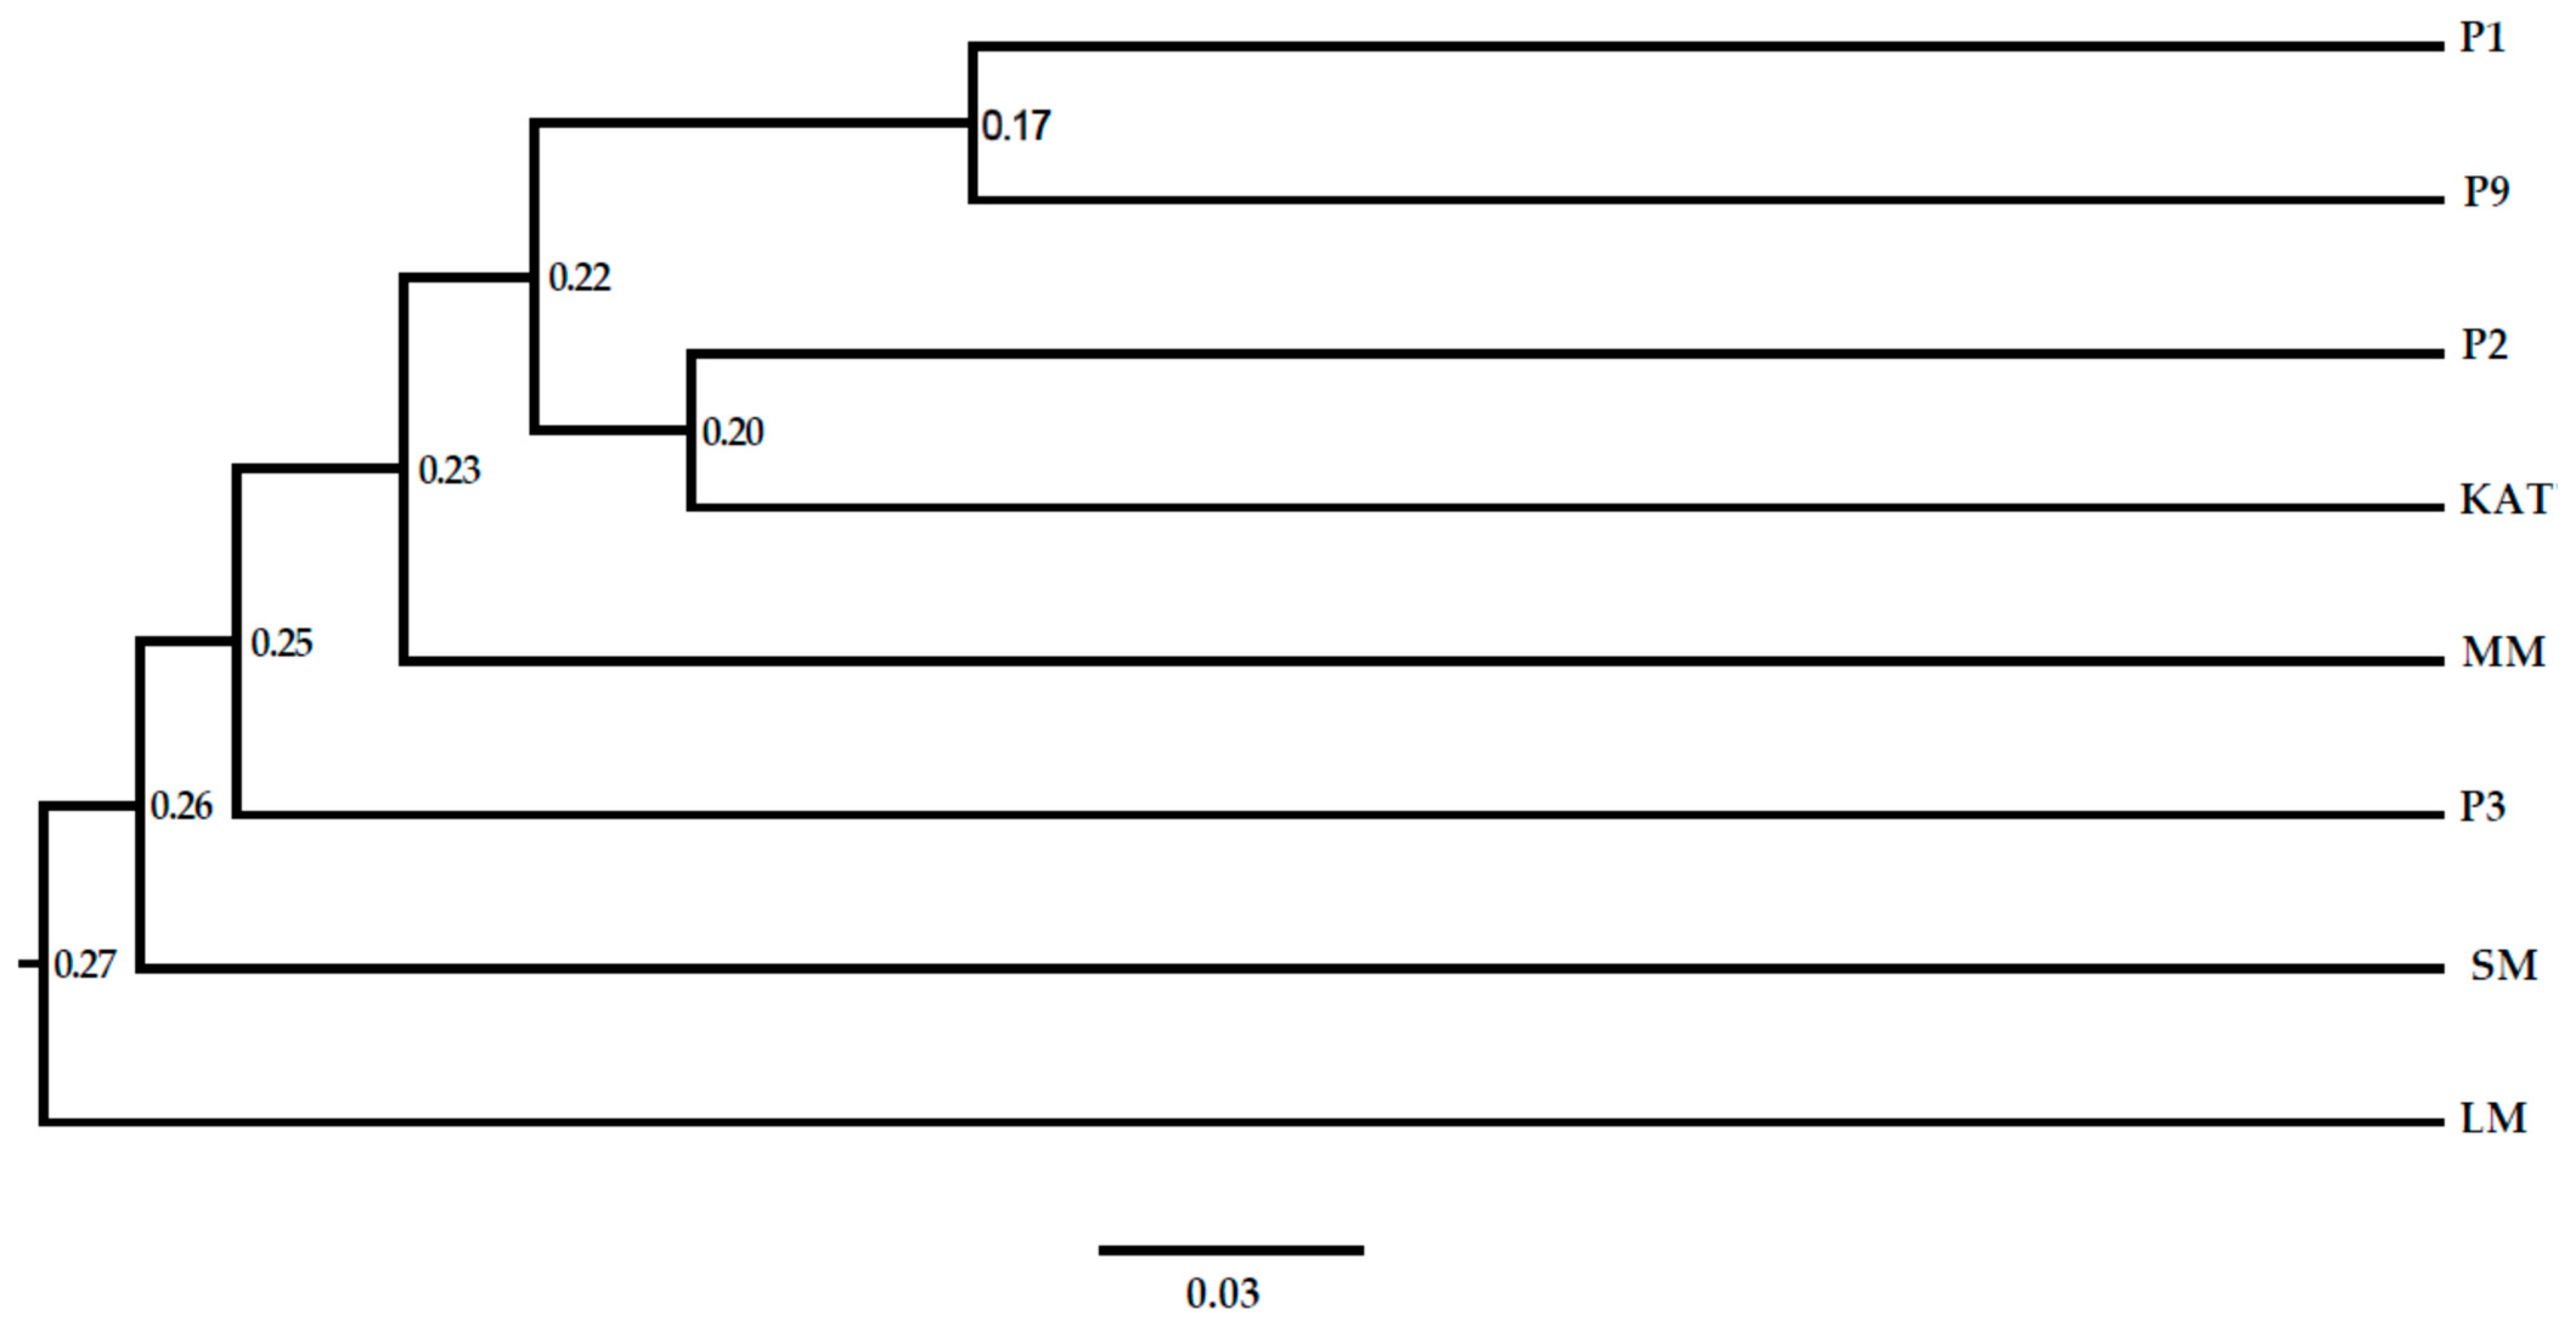
4.13. Phylogenetic Analysis
Jaccard’s similarity coefficient was applied in determination of the pairwise relationship between markers. For cluster analysis, an unweighted pair-group method with arithmetic averages (UPGMA) dendrogram was generated, employing Nei’s genetic distance calculated from pairwise comparisons. The computation of genetic distances between pairs of accessions was carried out using GenAlEx v6.503 [
120]. The distance matrix served as the basis for conducting a principal coordinate analysis (PCoA). Subsequently, an unrooted neighbour-joining phylogenetic tree was constructed using FigTree software V1.4.3, with no presumption of an evolutionary hierarchy. The construction of this tree involved 1000 bootstrap replicates to enhance its robustness.
Evaluation of the variations present within and between the pigeon pea genotypes was investigated using the AMOVA method using GenAlEx V6.503 software.
4.14. Principal Coordinate Analysis
Principal coordinate analysis (PCoA) was performed using GenAlex V6.503 software [
120] to visualize the relationships among the pigeon pea genotypes.
4.15. Statistical Analysis
R Studio was utilized to conduct correlation analysis and the generated graphs. The data used for this analysis encompassed physiological readings collected over three days, consolidated into distinct data sets. For instance, control readings for three days (D1, D2, and D3) were merged into one “control” data set. Similarly, data for 25% FC and 50% FC were grouped into separate data sets. The regression analyses in this report are structured by genotype and ordered as control, 25% FC, and 50% FC, allowing for systematic data comparison across treatments.
For the collected physiological and biochemical parameters, the data underwent analysis of variance (ANOVA) using the F test at a significance level of 5%. Post hoc comparisons of means were conducted using Scott–Knott’s test (
p ≤ 0.05) with the Sisvar software Version 1.0. The clustering analyses were designed using Microsoft Excel software 365, and the radar plot graphs were plotted through Sigma Plot 11.0 software (SPSS Inc., San Jose, CA, USA). Additionally, principal coordinate analysis (PCoA) was executed on the data sets using GenAlex V6.503 software [
120].


 ,
, 