
Decoupling Distribution of n-Alkanes in Aeolian Sand and Vegetation of the Northern Ulan Buh Desert, China: Insight into Organic Matter Preservation in Arid Regions

 ,
,  , , ,
, , ,
Abstract
1. Introduction
2. Results
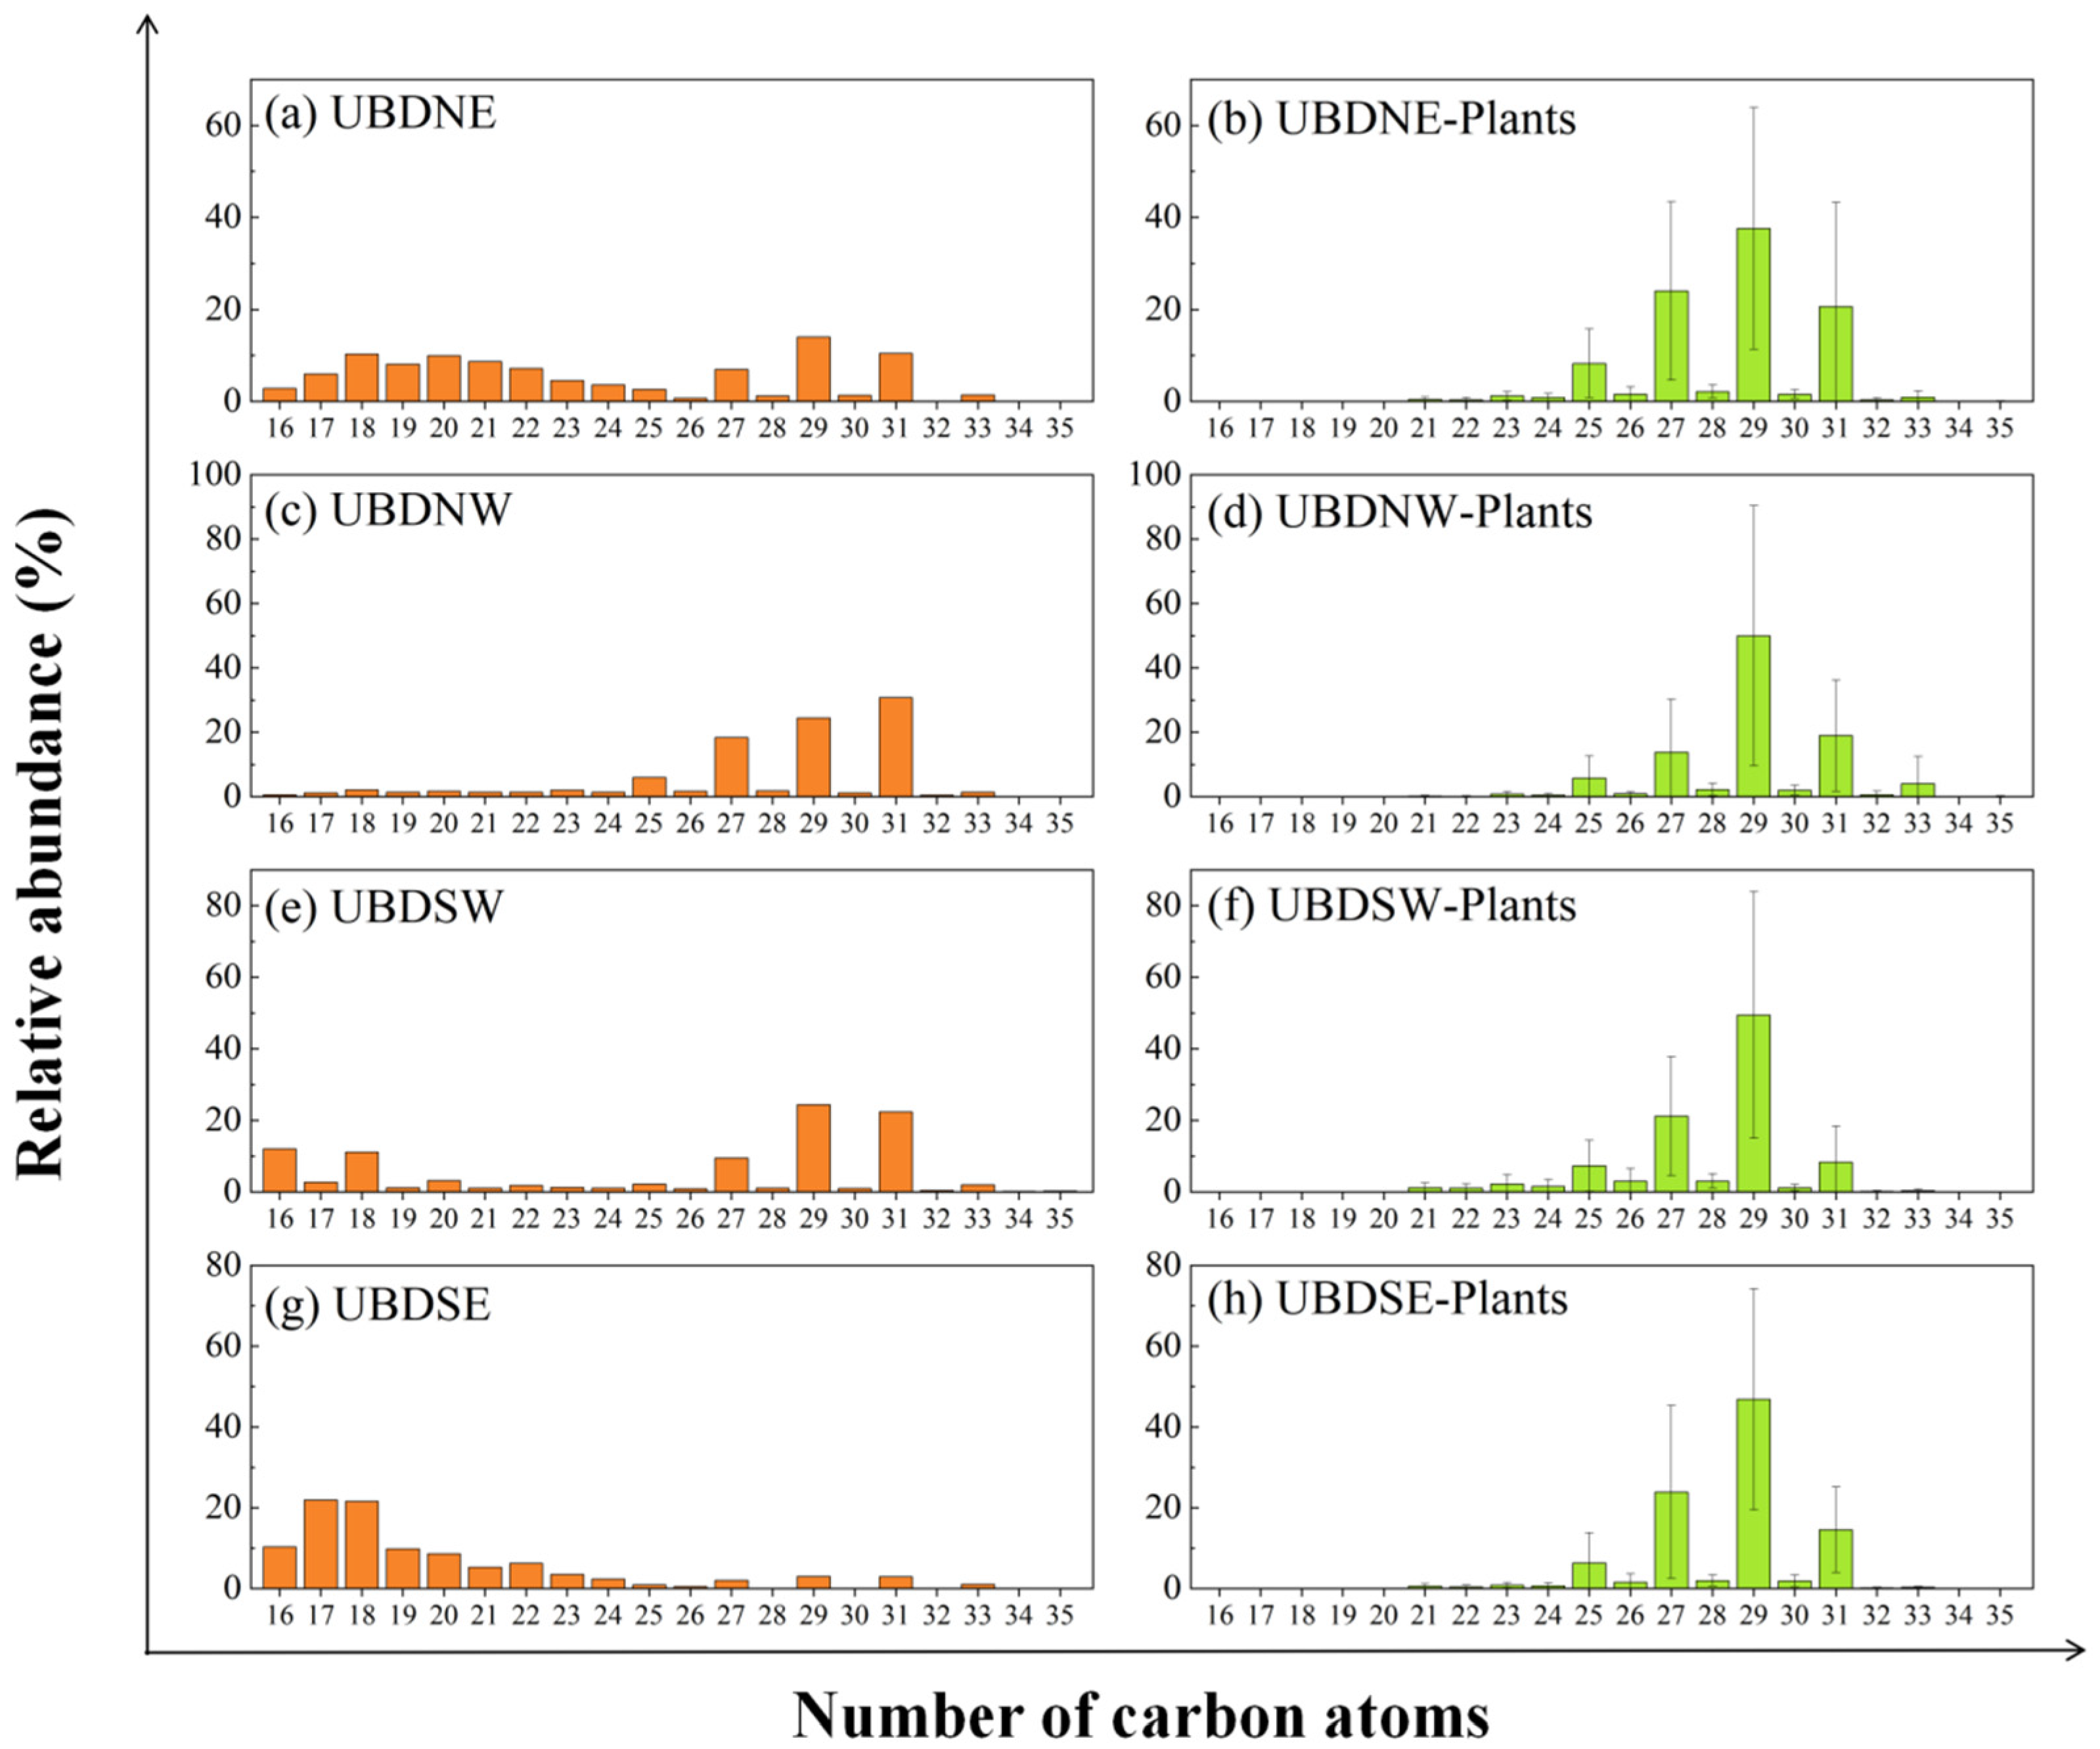
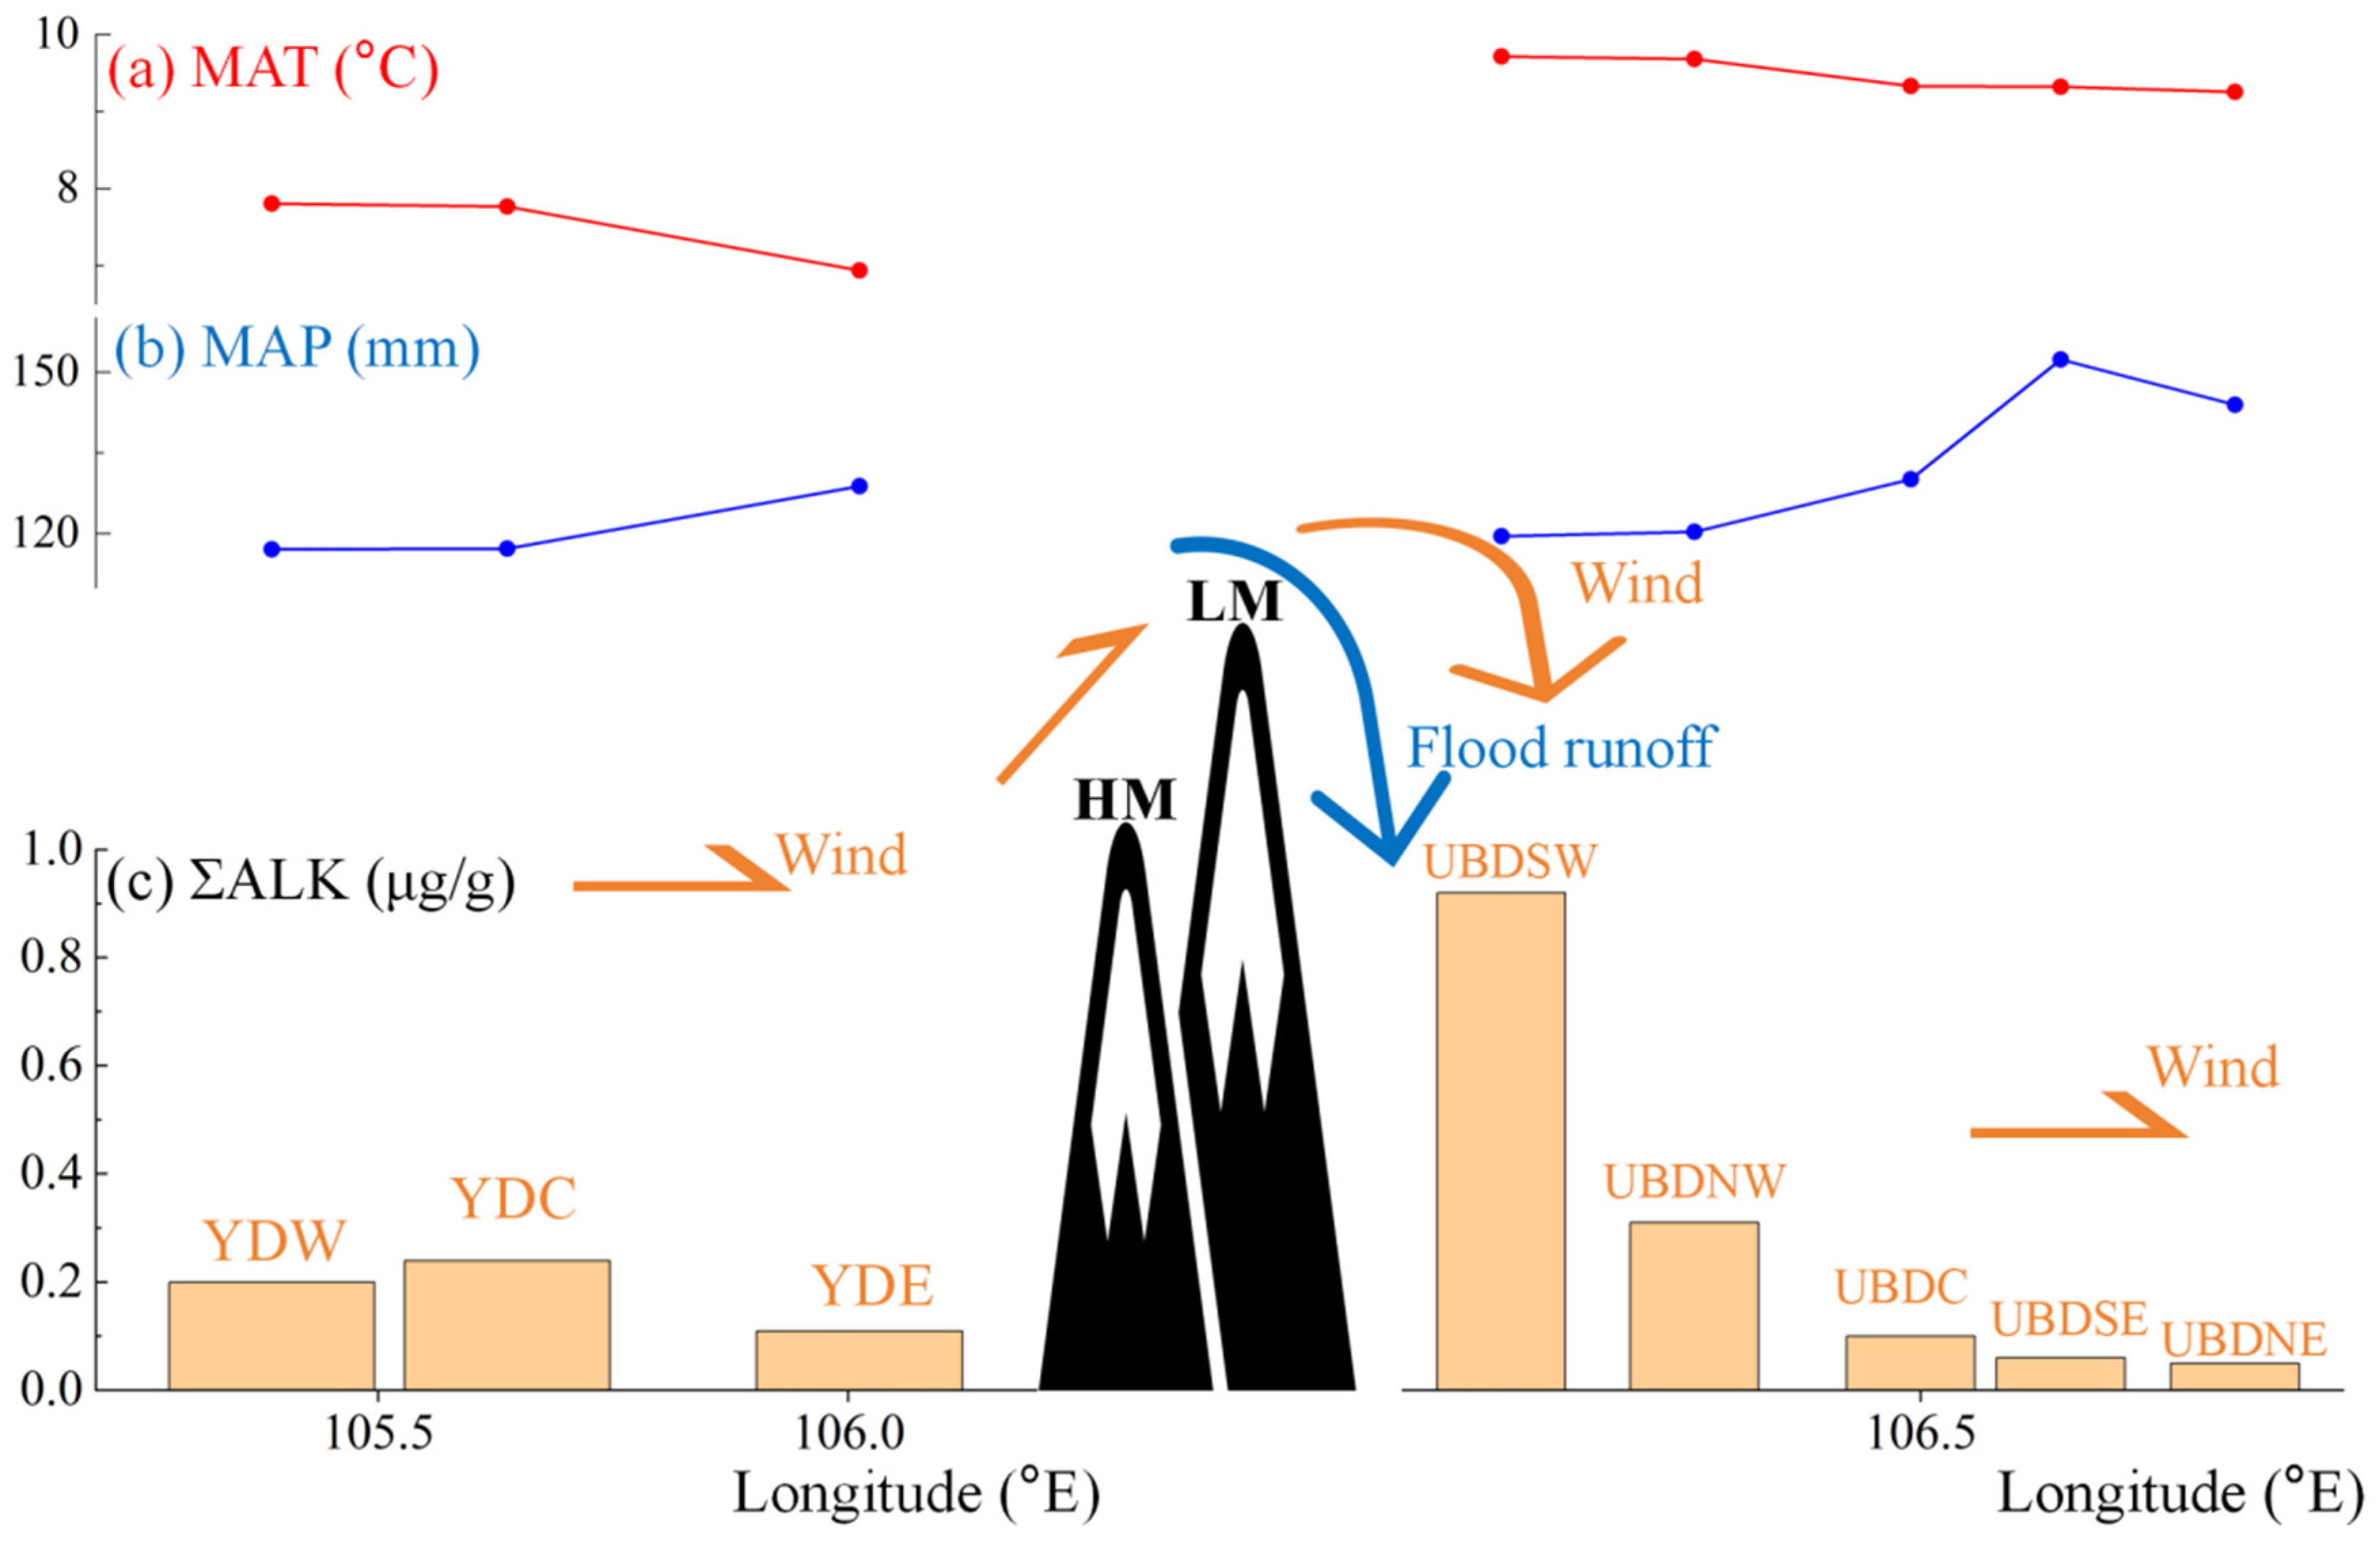
2.1. Aeolian Sand n-Alkane Abundances and Distribution Patterns
2.2. Leaf Wax n-Alkane Abundances and Distribution Patterns
3. Discussion
3.1. Biogenic Sources of Sedimentary n-Alkanes in the Eastern YD and Northern UBD
3.2. Decoupling Distribution of n-Alkanes in Aeolian Sand and Surrounding Vegetation
3.3. Implications for the Preservation of the Sedimentary n-Alkanes in the North UBD
4. Materials and Methods
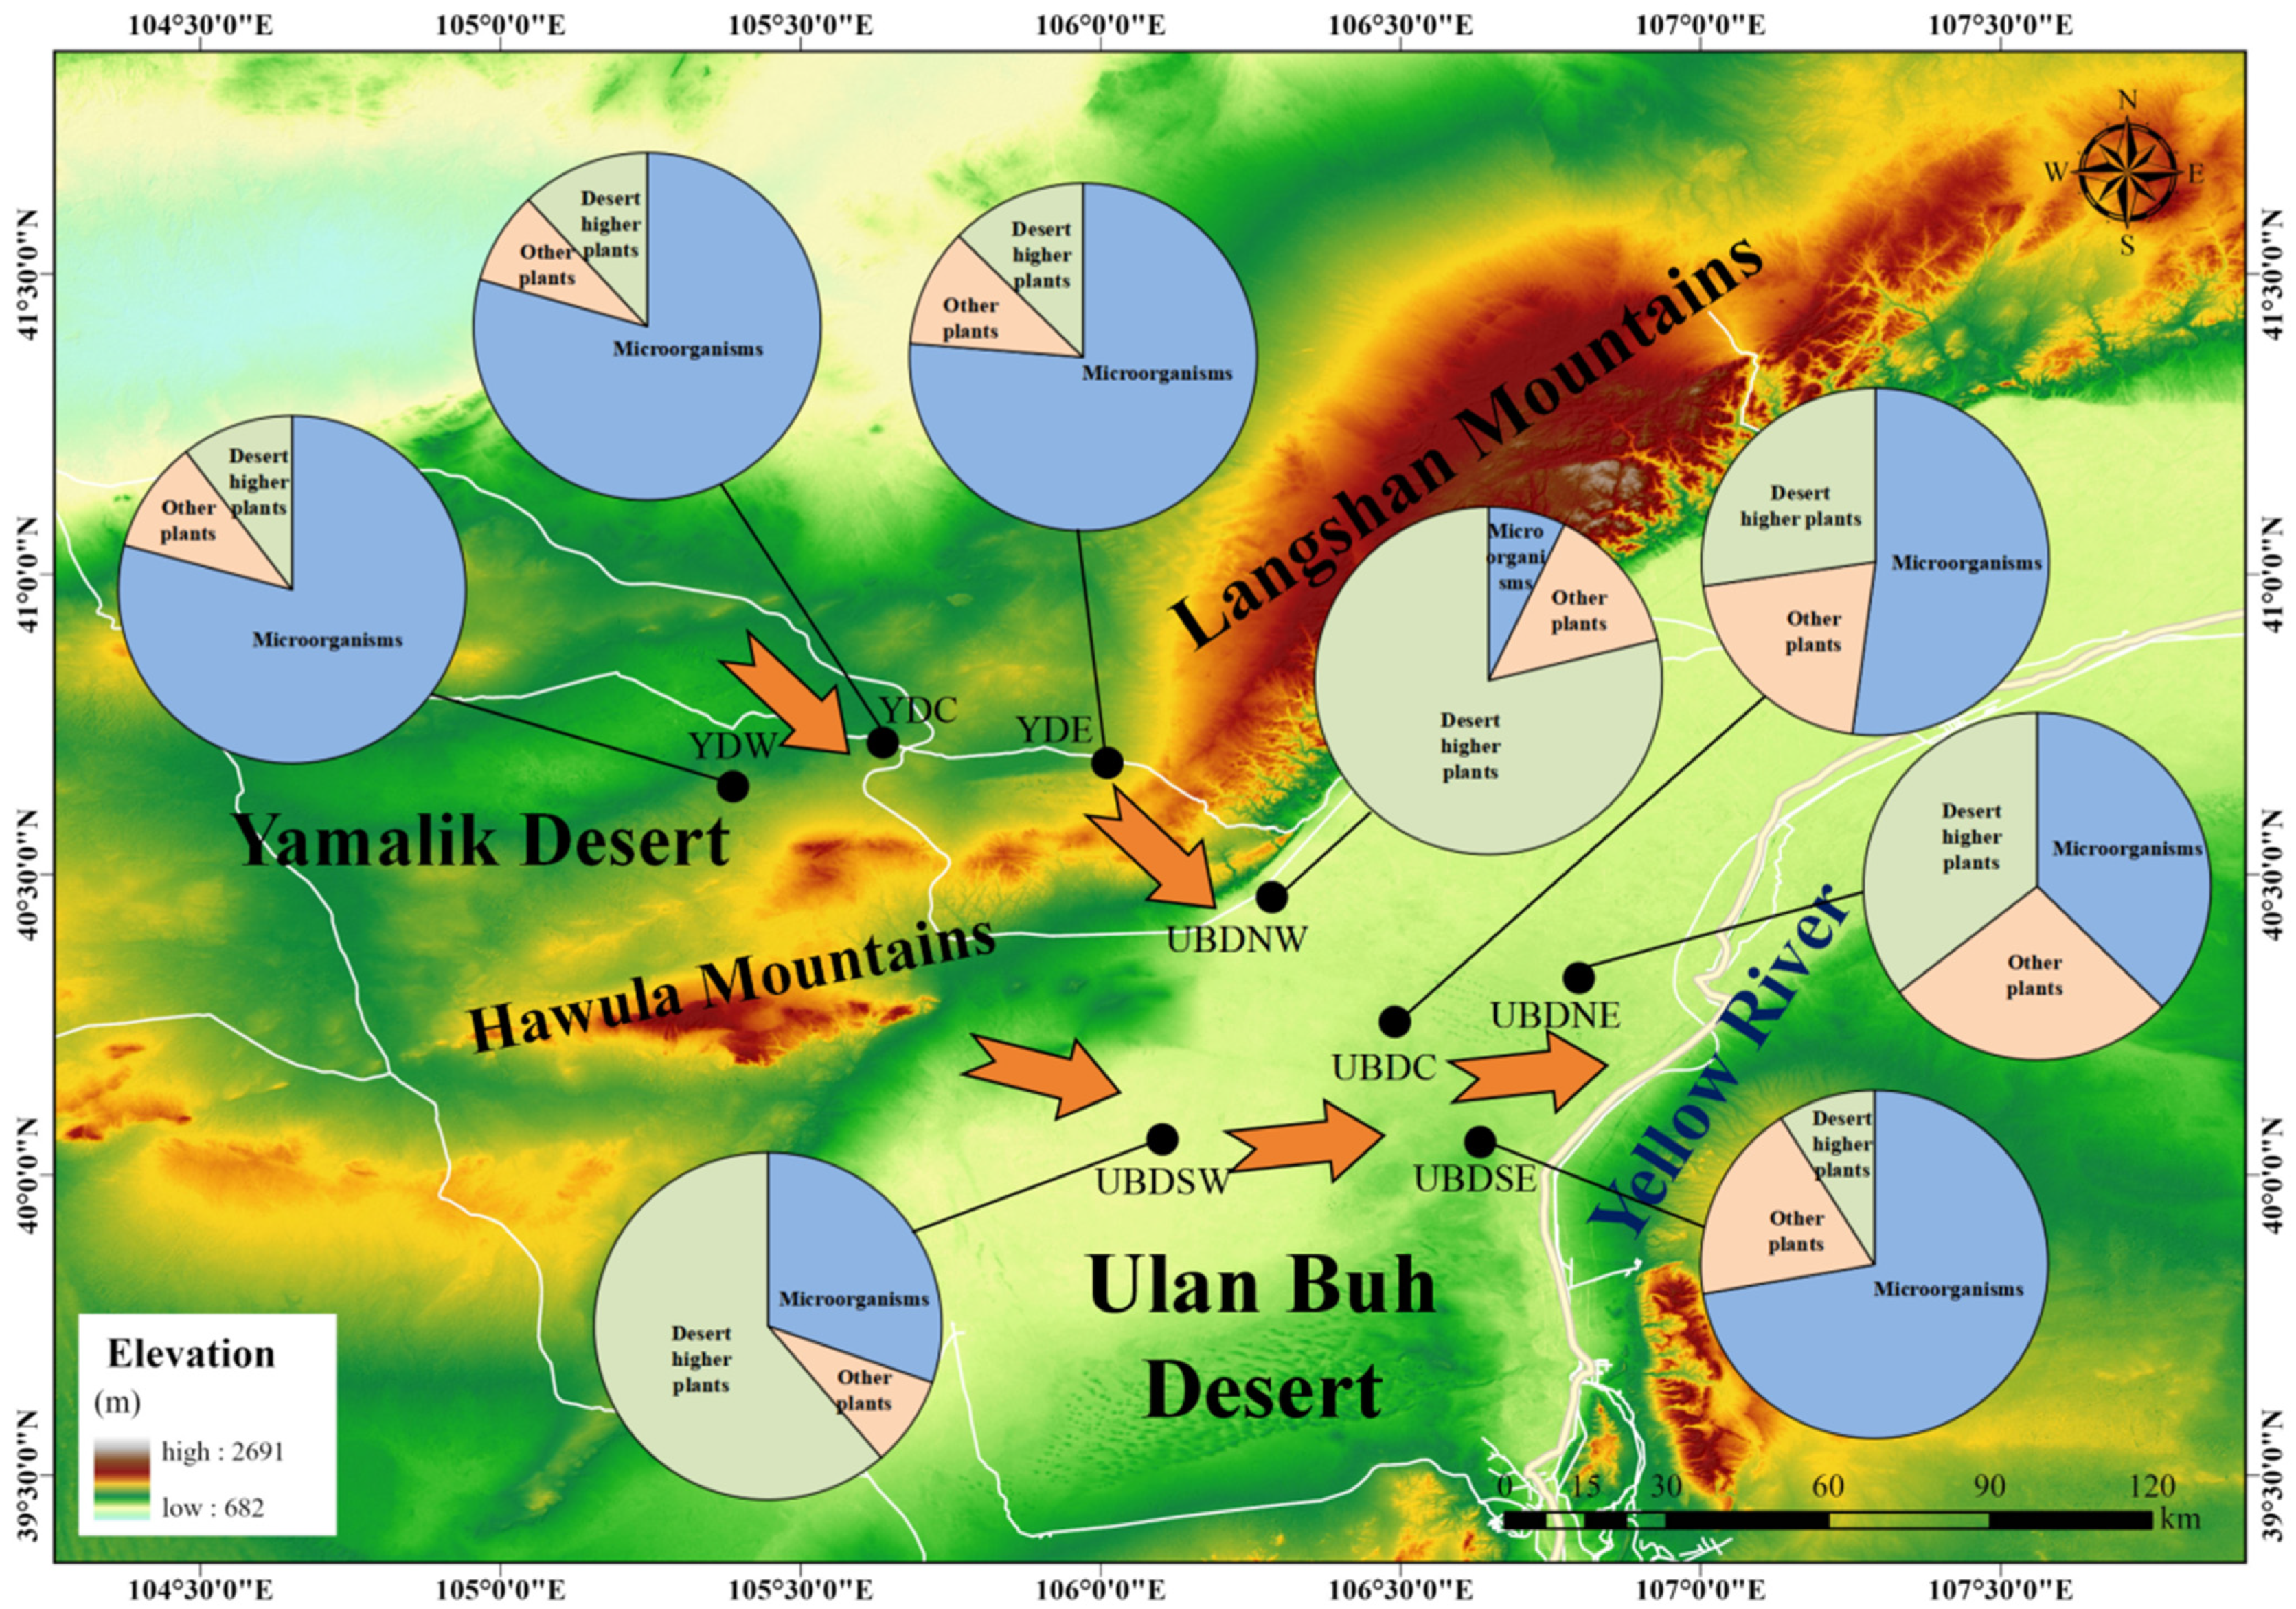
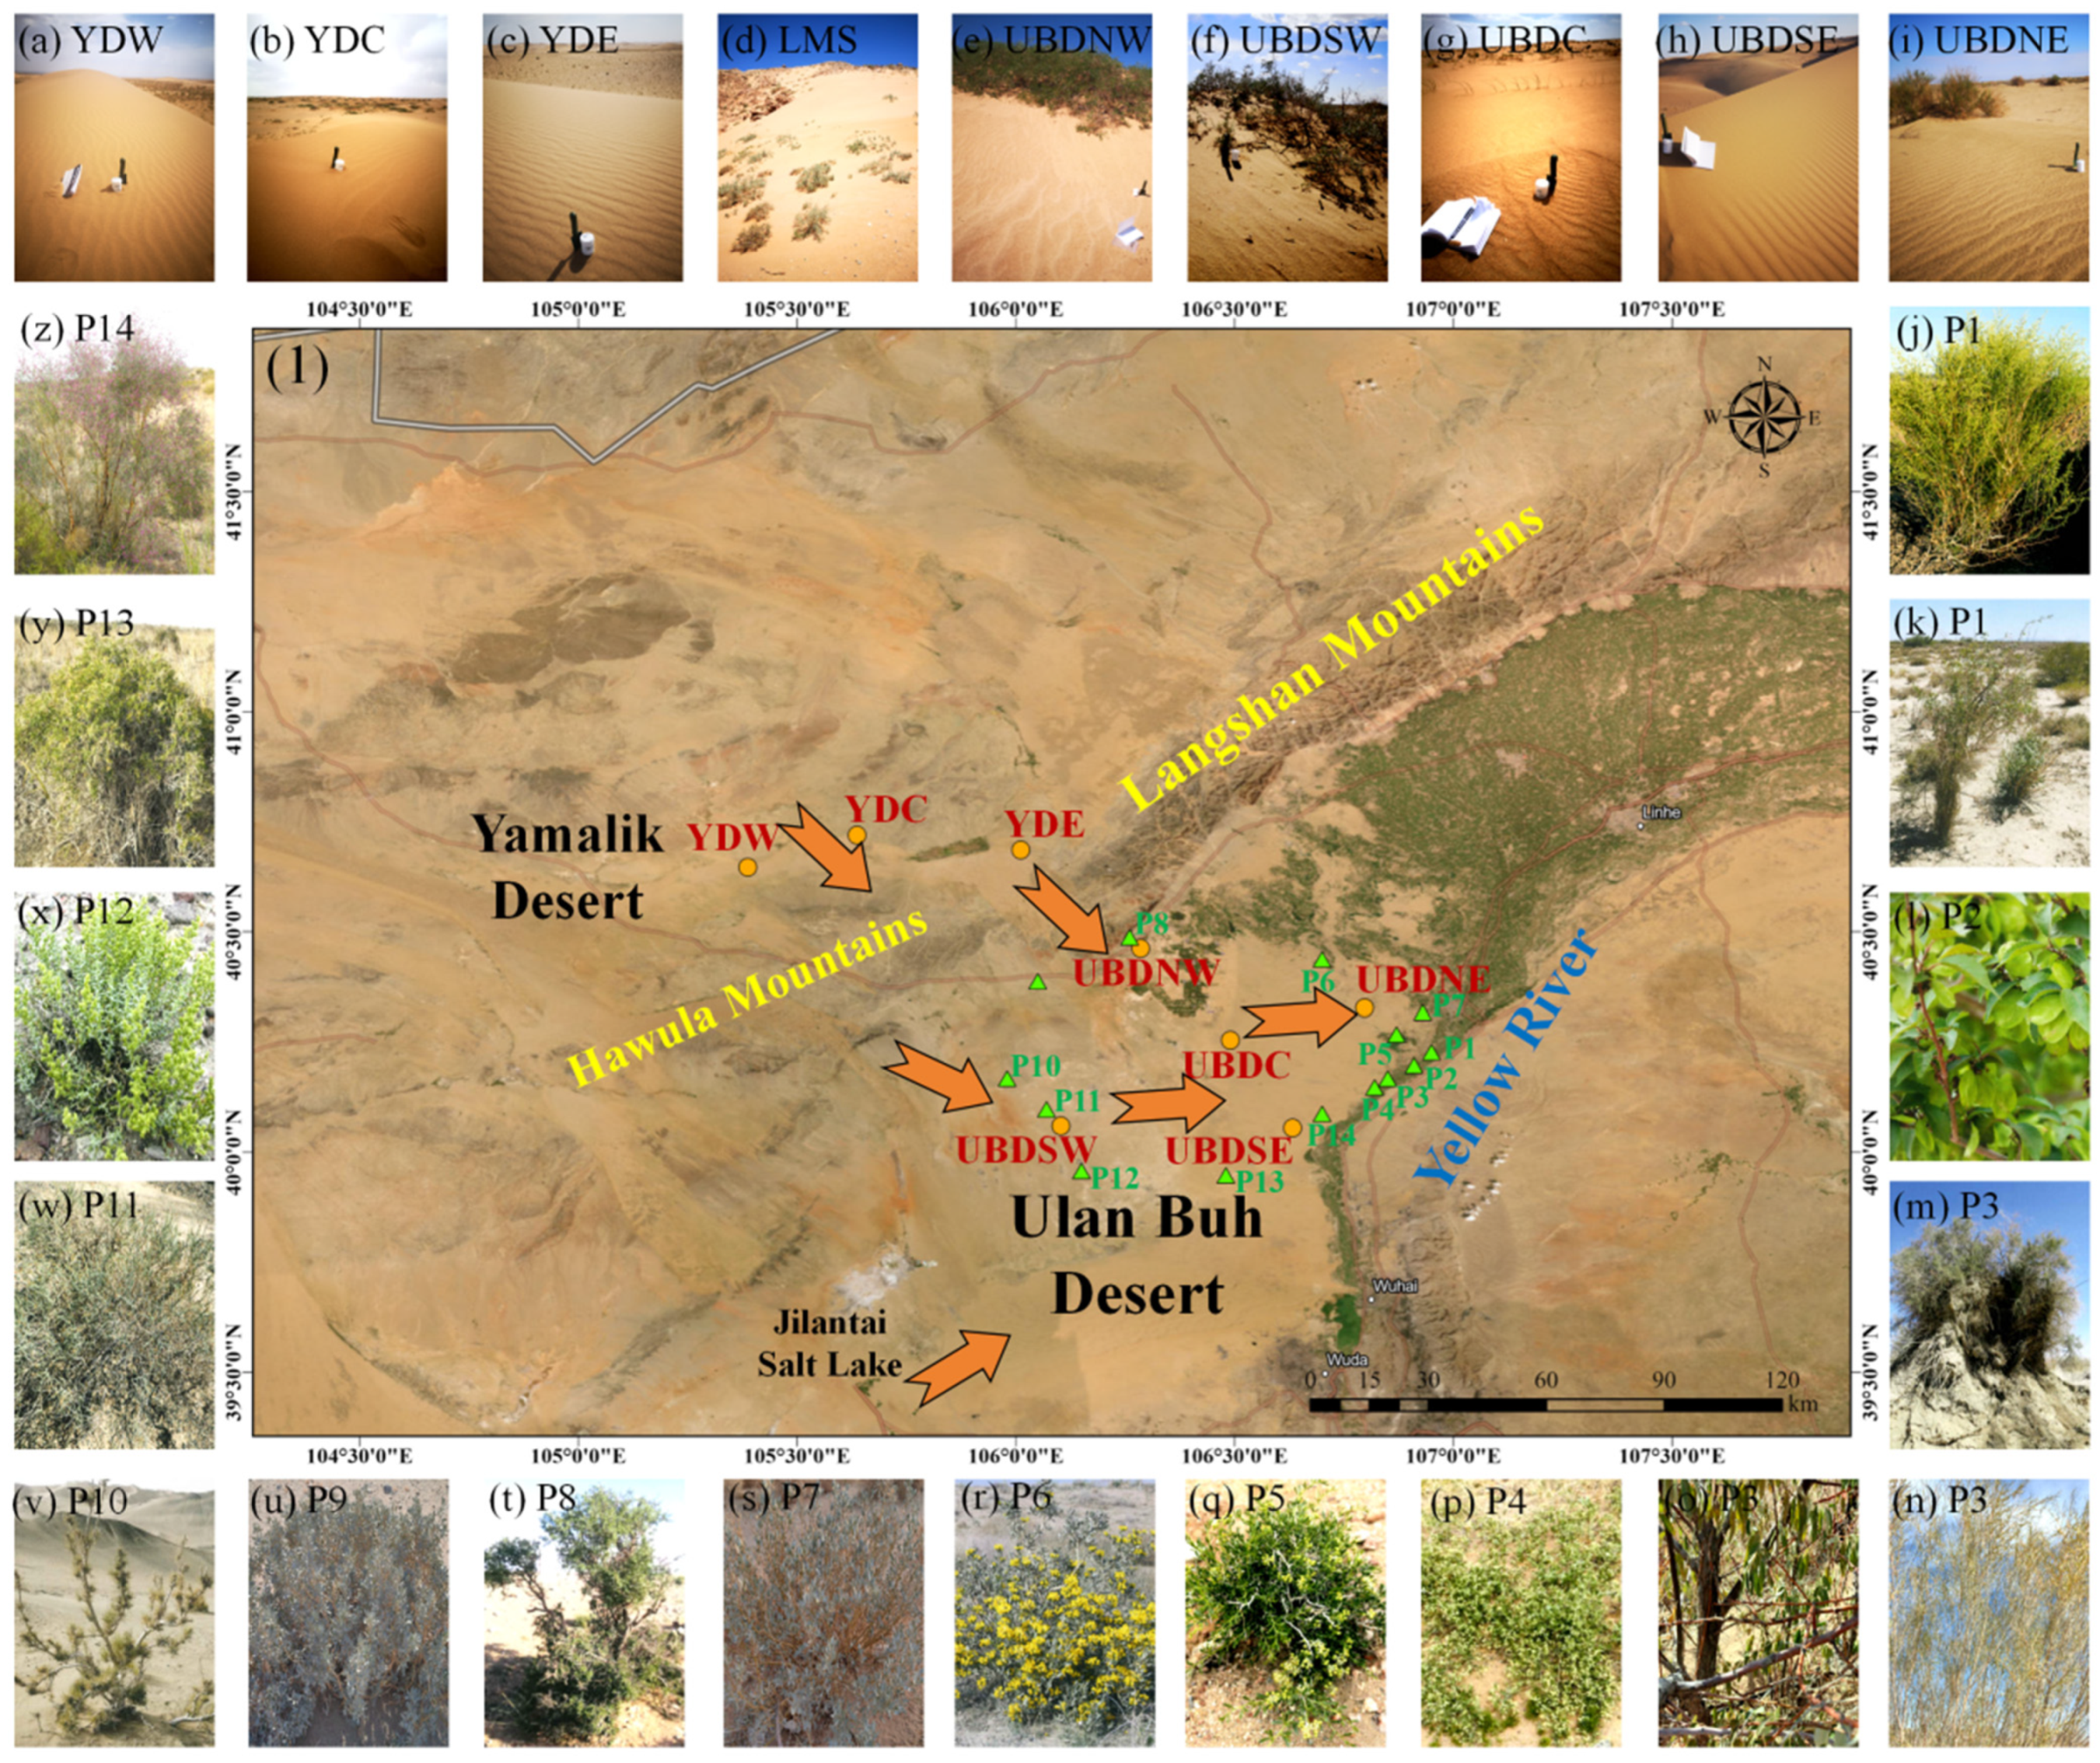
4.1. Study Area
4.2. Sampling
4.3. Extraction and Quantification of n-Alkanes
5. Conclusions
Author Contributions
Funding
Data Availability Statement
Acknowledgments
Conflicts of Interest
References
- Eglinton, G.; Hamilton, R. Leaf epicuticular waxes. Science 1967, 156, 1322–1335. [Google Scholar] [CrossRef] [PubMed]
- Eigenbrode, S.; Espelie, K. Effects of plant epicuticular lipids on insect herbivores. Annu. Rev. Entomol. 1995, 40, 171–194. [Google Scholar] [CrossRef]
- Dodd, R.; Poveda, M. Environmental gradients and population divergence contribute to variation in cuticular wax composition in Juniperus communis. Biochem. Syst. Ecol. 2003, 31, 1257–1270. [Google Scholar] [CrossRef]
- Koch, K.; Dommisse, A.; Niemietz, A.; Barthlott, W.; Wandelt, K. Nanostructure of epicuticular plant waxes: Self-assembly of wax tubules. Surf. Sci. 2009, 603, 1961–1968. [Google Scholar] [CrossRef]
- Jetter, R.; Riederer, M. Localization of the transpiration barrier in the epi- and intracuticular waxes of eight plant species: Water transport resistances are associated with fatty acyl rather than alicyclic components. Plant Physiol. 2016, 170, 921–934. [Google Scholar] [CrossRef]
- Khan, A.; Kolattukudy, P. Decarboxylation of long chain fatty acids to alkanes by cell free preparations of pea leaves (Pisum sativum). Biochem. Biophys. Res. Commun. 1974, 61, 1379–1386. [Google Scholar] [CrossRef] [PubMed]
- Shepherd, T.; Wynne Griffiths, D. The effects of stress on plant cuticular waxes. New Phytol. 2006, 171, 469–499. [Google Scholar] [CrossRef]
- Gamarra, B.; Kahmen, A. Concentrations and δ2H values of cuticular n-alkanes vary significantly among plant organs, species and habitats in grasses from an alpine and a temperate European grassland. Oecologia 2015, 178, 981–998. [Google Scholar] [CrossRef]
- Angst, G.; John, S.; Mueller, C.; Kögel-Knabner, I.; Rethemeyer, J. Tracing the sources and spatial distribution of organic carbon in subsoils using a multi-biomarker approach. Sci. Rep. 2016, 6, 29478. [Google Scholar] [CrossRef]
- Jansen, B.; Wiesenberg, G. Opportunities and limitations related to the application of plant-derived lipid molecular proxies in soil science. Soil 2017, 3, 211–234. [Google Scholar] [CrossRef]
- Cranwell, P. Diagenesis of free and bound lipids in terrestrial detritus deposited in a lacustrine sediment. Org. Geochem. 1981, 3, 79–89. [Google Scholar] [CrossRef]
- Lichtfouse, É.; Chenu, C.; Baudin, F.; Leblond, C.; Da Silva, M.; Behar, F.; Derenne, S.; Largeau, C.; Wehrung, P.; Albrecht, P. A novel pathway of soil organic matter formation by selective preservation of resistant straight-chain biopolymers: Chemical and isotope evidence. Org. Geochem. 1998, 28, 411–415. [Google Scholar] [CrossRef]
- Nichols, J.; Booth, R.; Jackson, S.; Pendall, E.; Huang, Y. Paleohydrologic reconstruction based on n-alkane distributions in ombrotrophic peat. Org. Geochem. 2006, 37, 1505–1513. [Google Scholar] [CrossRef]
- Zech, M.; Rass, S.; Buggle, B.; Löscher, M.; Zöller, L. Reconstruction of the late Quaternary paleoenvironment of the Nussloch loess paleosol sequence, Germany, using n-alkane biomarkers. Quat. Res. 2012, 78, 226–235. [Google Scholar] [CrossRef]
- Garcin, Y.; Schefuss, E.; Schwab, V.; Garreta, V.; Gleixner, G.; Vincens, A.; Todou, G.; Sene, O.; Onana, J.; Achoundong, G.; et al. Reconstructing C3 and C4 vegetation cover using n-alkane carbon isotope ratios in recent lake sediments from Cameroon, Western Central Africa. Geochim. Cosmochim. Acta 2014, 142, 482–500. [Google Scholar] [CrossRef]
- Feakins, S.; Wu, M.; Ponton, C.; Galy, V.; West, A. Dual isotope evidence for sedimentary integration of plant wax biomarkers across an Andes-Amazon elevation transect. Geochim. Cosmochim. Acta 2018, 242, 64–81. [Google Scholar] [CrossRef]
- Contreras, S.; Werne, J.; Araneda, A.; Tejos, E.; Moscoso, J. Abundance and distribution of plant derived leaf waxes (long chain n-alkanes & fatty acids) from lake surface sediments along the west coast of southern South America: Implications for environmental and climate reconstructions. Sci. Total Environ. 2023, 895, 165065. [Google Scholar] [CrossRef]
- Diefendorf, A.; Freimuth, E. Extracting the most from terrestrial plant-derived n-alkyl lipids and their carbon isotopes from the sedimentary record: A review. Org. Geochem. 2017, 103, 1–21. [Google Scholar] [CrossRef]
- Howard, S.; McInerney, F.; Caddy-Retalic, S.; Hall, A.; Andrae, J. Modelling leaf wax n-alkane inputs to soils along a latitudinal transect across Australia. Org. Geochem. 2018, 121, 126–137. [Google Scholar] [CrossRef]
- van Gardingen, P.; Grace, J.; Jeffree, C. Abrasive damage by wind to the needle surfaces of Picea sitchensis (Bong.) Carr. and Pinus sylvestris L. Plant Cell Environ. 1991, 14, 185–193. [Google Scholar] [CrossRef]
- Gao, L.; Burnier, A.; Huang, Y. Quantifying instantaneous regeneration rates of plant leaf waxes using stable hydrogen isotope labeling. Rapid Commun. Mass Spectrom. 2012, 26, 115–122. [Google Scholar] [CrossRef] [PubMed]
- Meyers, P.; Hites, R. Extractable organic compounds in midwest rain and snow. Atmos. Environ. 1982, 16, 2169–2175. [Google Scholar] [CrossRef]
- Bendle, J.; Kawamura, K.; Yamazaki, K.; Niwai, T. Latitudinal distribution of terrestrial lipid biomarkers and n-alkane compound-specific stable carbon isotope ratios in the atmosphere over the western Pacific and Southern Ocean. Geochim. Cosmochim. Acta 2007, 71, 5934–5955. [Google Scholar] [CrossRef]
- Yamamoto, S.; Kawamura, K. Compound-specific stable carbon and hydrogen isotopic compositions of n-alkanes in urban atmospheric aerosols from Tokyo. Geochem. J. 2010, 44, 419–430. [Google Scholar] [CrossRef]
- Nelson, D.; Knohl, A.; Sachse, D.; Schefuß, E.; Kahmen, A. Sources and abundances of leaf waxes in aerosols in central Europe. Geochim. Cosmochim. Acta 2017, 198, 299–314. [Google Scholar] [CrossRef]
- Rouillard, A.; Greenwood, P.; Grice, K.; Skrzypek, G.; Dogramaci, S.; Turney, C.; Grierson, P. Interpreting vegetation change in tropical arid ecosystems from sediment molecular fossils and their stable isotope compositions: A baseline study from the Pilbara region of northwest Australia. Palaeogeogr. Palaeoclimatol. Palaeoecol. 2016, 459, 495–507. [Google Scholar] [CrossRef]
- Wilhelm, M.; Davila, A.; Eigenbrode, J.; Parenteau, M.; Jahnke, L.; Liu, X.; Summons, R.; Wray, J.; Stamos, B.; O’Reilly, S.; et al. Xeropreservation of functionalized lipid biomarkers in hyperarid soils in the Atacama Desert. Org. Geochem. 2017, 103, 97–104. [Google Scholar] [CrossRef]
- Möchen, R.; Amelung, W.; Giese, C.; Böhnert, T.; Ruhm, J.; Lehndorff, E. Fingerprint of plant life in the Atacama Desert-Insight from n-alkane analyses. Org. Geochem. 2021, 151, 104145. [Google Scholar] [CrossRef]
- Yan, Y.; Zhao, B.; Xie, L.; Zhu, Z. Trend reversal of soil n-alkane Carbon Preference Index (CPI) along the precipitation gradient and its paleoclimatic implication. Chem. Geol. 2021, 581, 120402. [Google Scholar] [CrossRef]
- Chun, X.; Chen, F.; Fan, Y.; Xia, D.; Zhao, H. Formation of Ulan Buh desert and its environmental changes during the Holocene. Front. Earth Sci. China 2008, 2, 327–332. [Google Scholar] [CrossRef]
- Zhao, H.; Li, G.; Sheng, Y.; Jin, M.; Chen, F. Early-middle Holocene lake-desert evolution in northern Ulan Buh Desert, China. Palaeogeogr. Palaeoclimatol. Palaeoecol. 2012, 331–332, 31–38. [Google Scholar] [CrossRef]
- Chen, F.; Li, G.; Zhao, H.; Jin, M.; Chen, X.; Fan, Y.; Liu, X.; Wu, D.; Madsen, D. Landscape evolution of the Ulan Buh Desert in northern China during the late Quaternary. Quat. Res. 2014, 81, 476–487. [Google Scholar] [CrossRef]
- Rommerskirchen, F.; Plader, A.; Eglinton, G.; Chikaraishi, Y.; Rullkötter, J. Chemotaxonomic significance of distribution and stable carbon isotopic composition of long-chain alkanes and alkan-1-ols in C4 grass waxes. Org. Geochem. 2006, 37, 1303–1332. [Google Scholar] [CrossRef]
- Vogts, A.; Moossen, H.; Rommerskirchen, F.; Rullkötter, J. Distribution patterns and stable carbon isotopic composition of alkanes and alkan-1-ols from plant waxes of African rain forest and savanna C3 species. Org. Geochem. 2009, 40, 1037–1054. [Google Scholar] [CrossRef]
- Bush, R.; McInerney, F. Leaf wax n-alkane distributions in and across modern plants: Implications for paleoecology and chemotaxonomy. Geochim. Cosmochim. Acta 2013, 117, 161–179. [Google Scholar] [CrossRef]
- Carr, A.; Boom, A.; Grimes, H.; Chase, B.; Meadows, M.; Harris, A. Leaf wax n-alkane distributions in arid zone South African flora: Environmental controls, chemotaxonomy and palaeoecological implications. Org. Geochem. 2014, 67, 72–84. [Google Scholar] [CrossRef]
- Han, Y.; Wang, G.; Sun, Q.; Xie, M. Variability of leaf wax n-alkanes across gradients of environment and plant functional type in China. Glob. Planet. Chang. 2024, 237, 104441. [Google Scholar] [CrossRef]
- Clark, R.; Blumer, M. Distribution of n-paraffins in marine organisms and sediment. Limnol. Oceanogr. 1967, 12, 79–87. [Google Scholar] [CrossRef]
- Han, J.; Calvin, M. Hydrocarbon distribution of algae and bacteria, and microbiological activity in sediments. Proc. Natl. Acad. Sci. USA 1969, 64, 436–443. [Google Scholar] [CrossRef]
- Blumer, M.; Guillard, R.; Chase, T. Hydrocarbons of marine plankton. Mar. Biol. 1971, 8, 183–189. [Google Scholar] [CrossRef]
- Cranwell, P.; Eglinton, G.; Robinson, N. Lipids of aquatic organisms as potential contributors to lacustrine sediments—II. Org. Geochem. 1987, 6, 513–527. [Google Scholar] [CrossRef]
- Wakeham, S. Algal and bacterial hydrocarbons in particulate matter and interfacial sediment of the Cariaco Trench. Geochim. Cosmochim. Acta 1990, 54, 1325–1336. [Google Scholar] [CrossRef]
- Mügler, I.; Sachse, D.; Werner, M.; Xu, B.; Wu, G.; Yao, T.; Gleixner, G. Effect of lake evaporation on δD values of lacustrine n-alkanes: A comparison of Nam Co (Tibetan Plateau) and Holzmaar (Germany). Org. Geochem. 2008, 39, 711–729. [Google Scholar] [CrossRef]
- Ficken, K.; Li, B.; Swain, D.; Eglinton, G. An n-alkane proxy for the sedimentary input of submerged/floating freshwater aquatic macrophytes. Org. Geochem. 2000, 31, 745–749. [Google Scholar] [CrossRef]
- Nichols, J.; Walcott, M.; Bradley, R.; Pilcher, J.; Huang, Y. Quantitative assessment of precipitation seasonality and summer surface wetness using ombrotrophic sediments from an Arctic Norwegian peatland. Quat. Res. 2009, 72, 443–451. [Google Scholar] [CrossRef]
- Bingham, E.; McClymont, E.; Väliranta, M.; Mauquoy, D.; Roberts, Z.; Chambers, F.; Pancost, R.; Evershed, R. Conservative composition of n-alkane biomarkers in Sphagnum species: Implications for palaeoclimate reconstruction in ombrotrophic peat bogs. Org. Geochem. 2010, 41, 214–220. [Google Scholar] [CrossRef]
- Duan, Y.; Xu, L. Distributions of n-alkanes and their hydrogen isotopic composition in plants from Lake Qinghai (China) and the surrounding area. Appl. Geochem. 2012, 27, 806–814. [Google Scholar] [CrossRef]
- Peng, T.; Li, J.; Song, C.; Zhao, Z.; Zhang, J.; Hui, Z.; King, J. Biomarker challenge early Miocene loess and inferred Asian desertification. Geophys. Res. Lett. 2012, 39, L06702. [Google Scholar] [CrossRef]
- Yu, X.; Lü, X.; Meyers, P.; Huang, X. Comparison of molecular distributions and carbon and hydrogen isotope compositions of n-alkanes from aquatic plants in shallow freshwater lakes along the middle and lower reaches of the Yangtze River, China. Org. Geochem. 2021, 158, 104270. [Google Scholar] [CrossRef]
- Zech, M.; Buggle, B.; Leiber, K.; Marković, S.; Glaser, B.; Hambach, U.; Huwe, B.; Stevens, T.; Sümegi, P.; Wiesenberg, G.; et al. Reconstructing Quaternary vegetation history in the Carpathian Basin, SE Europe, using n-alkane biomarkers as molecular fossils: Problems and possible solutions, potential and limitations. EG Quat. Sci. J. 2009, 58, 148–155. [Google Scholar] [CrossRef]
- Ceccopieri, M.; Scofield, A.; Almeida, L.; Araújo, M.; Hamacher, C.; Farias, C.; Soares, M.; Carreira, R.; Wagener, A. Carbon isotopic composition of leaf wax n-alkanes in mangrove plants along a latitudinal gradient in Brazil. Org. Geochem. 2021, 161, 104299. [Google Scholar] [CrossRef]
- Belnap, J. The world at your feet: Desert biological soil crusts. Front. Ecol. Environ. 2003, 1, 181–189. [Google Scholar] [CrossRef]
- Jones, J. Studies on lipids of soil micro-organisms with particular reference to hydrocarbons. J. Gen. Microbiol. 1969, 59, 145–152. [Google Scholar] [CrossRef] [PubMed]
- Gelpi, E.; Schneider, H.; Mann, J.; Oró, J. Hydrocarbons of geochemical significance in microscopic algae. Phytochemistry 1970, 9, 603–612. [Google Scholar] [CrossRef]
- Fisher, D.; Holloway, P.; Richmond, D. Fatty acid and hydrocarbon constituents of the surface and wall lipids of some fungal spores. J. Gen. Microbiol. 1972, 72, 71–78. [Google Scholar] [CrossRef]
- Dembitsky, V. Lipids of bryophytes. Prog. Lipid Res. 1993, 32, 281–356. [Google Scholar] [CrossRef]
- Zygadlo, J.; Pignata, M.; Gonzalez, C.; Levin, A. Alkanes in lichens. Phytochemistry 1993, 32, 1453–1456. [Google Scholar] [CrossRef]
- Yang, X.; Liang, P.; Fang, Y.; Fu, X.; Li, H.; Zhang, D. Chinese Deserts and Environmental Changes, 1st ed.; Science Press: Beijing, China, 2024; pp. 1–349. [Google Scholar]
- Johnson, R.; Calder, J. Early diagenesis of fatty acids and hydrocarbons in a salt marsh environment. Geochim. Cosmochim. Acta 1973, 37, 1943–1955. [Google Scholar] [CrossRef]
- Huang, Y.; Bol, R.; Harkness, D.; Ineson, P.; Eglinton, G. Post-glacial variations in distributions, 13C and 14C contents of aliphatic hydrocarbons and bulk organic matter in three types of British acid upland soils. Org. Geochem. 1996, 34, 273–287. [Google Scholar] [CrossRef]
- Xie, S.; Guo, J.; Huang, J.; Chen, F.; Wang, H.; Farrimond, P. Restricted utility of δ13C of bulk organic matter as a record of paleovegetation in some loess-paleosol sequences in the Chinese Loess Plateau. Quat. Res. 2004, 62, 86–93. [Google Scholar] [CrossRef]
- Zech, M.; Andreev, A.; Zech, R.; Müller, S.; Hambach, U.; Frechen, M.; Zech, W. Quaternary vegetation changes derived from a loess-like permafrost paleosol sequence in northeast Siberia using alkane biomarker and pollen analyses. Boreas 2010, 39, 540–550. [Google Scholar] [CrossRef]
- Buggle, B.; Wiesenberg, G.; Glaser, B. Is there a possibility to correct fossil n-alkane data for postsedimentary alteration effects? Appl. Geochem. 2010, 25, 947–957. [Google Scholar] [CrossRef]
- Lange, O.; Meyer, A.; Zellner, H.; Heber, U. Photosynthesis and water relations of lichen soil crusts: Field measurements in the coastal fog zone of the Namib Desert. Funct. Ecol. 1994, 8, 253–264. [Google Scholar] [CrossRef]
- Austin, A.; Yahdjian, L.; Stark, J.; Belnap, J.; Porporato, A.; Norton, U.; Ravetta, D.; Schaeffer, S. Water pulses and biogeochemical cycles in arid and semiarid ecosystems. Oecologia 2004, 141, 221–235. [Google Scholar] [CrossRef]
- Laronne, J.; Reid, L. Very high rates of bedload sediment transport by ephemeral desert rivers. Nature 1993, 366, 148–150. [Google Scholar] [CrossRef]
- Zhu, Z.; Wu, Z.; Liu, S.; Di, X. An Overview of Chinese Deserts (Revised Edition), 2nd ed.; Science Press: Beijing, China, 1980; pp. 1–101. [Google Scholar]
- Kong, W.; Zhou, S.; Cui, G.; Gao, P.; Li, S.; Lu, Q. Tracing provenance of eolian sands in the northern Ulan Buh Desert, China: Evidence from the REE geochemical characteristics. Heliyon 2023, 9, e22904. [Google Scholar] [CrossRef]
- Kong, W.; Zhou, S.; Cui, G.; Gao, P.; Li, S.; Lu, Q. Sr-Nd isotopic compositions of aeolian sand in the northern Ulan Buh Desert and Yamalik Desert: Implications for provenance and transport process. Catena 2024, 234, 107609. [Google Scholar] [CrossRef]
- Wu, L. Desert vegetation in Wulanbuhe and protection measures. Shaanxi For. Sci. Technol. 2007, 4, 133–137, (In Chinese with English abstract). [Google Scholar] [CrossRef]
- Zhang, D.; Ma, Q.; Jin, H.; Liu, Y.; Zhang, J.; Yuan, H.; Ding, F.; Sun, T.; Wei, H.; Zheng, Q.; et al. Composition and diversity of herbage in Ulanbuh Dsert. Grassl. Turf 2011, 31, 7–11, (In Chinese with English abstract). [Google Scholar] [CrossRef]
- Ma, Q.; Zhang, D.; Yuan, H.; Zheng, Q.; Ding, F.; Zhang, J.; Wei, H.; Jin, H.; Liu, Y.; Sun, T.; et al. Numerical classification and environmental interpretation of desert vegetation in the Ulan Buh Desert. J. Arid. Land Resour. Environ. 2019, 33, 160–167, (In Chinese with English abstract). [Google Scholar] [CrossRef]
- Bray, E.; Evans, E. Distribution of n-paraffins as a clue to recognition of source beds. Geochim. Cosmochim. Acta 1961, 22, 2–15. [Google Scholar] [CrossRef]
- Cranwell, P. Chain-length distribution of n-alkanes from lake sediments in relation to post-glacial environmental change. Freshw. Biol. 1973, 3, 259–265. [Google Scholar] [CrossRef]
- Jeng, W. Higher plant n-alkane average chain length as an indicator of petrogenic hydrocarbon contamination in marine sediments. Mar. Chem. 2006, 102, 242–251. [Google Scholar] [CrossRef]
- Feakins, S.; Peters, T.; Wu, M.; Shenkin, A.; Salinas, N.; Girardin, C.; Bentley, L.; Blonder, B.; Enquist, B.; Martin, R.; et al. Production of leaf wax n-alkanes across a tropical forest elevation transect. Org. Geochem. 2016, 100, 89–100. [Google Scholar] [CrossRef]


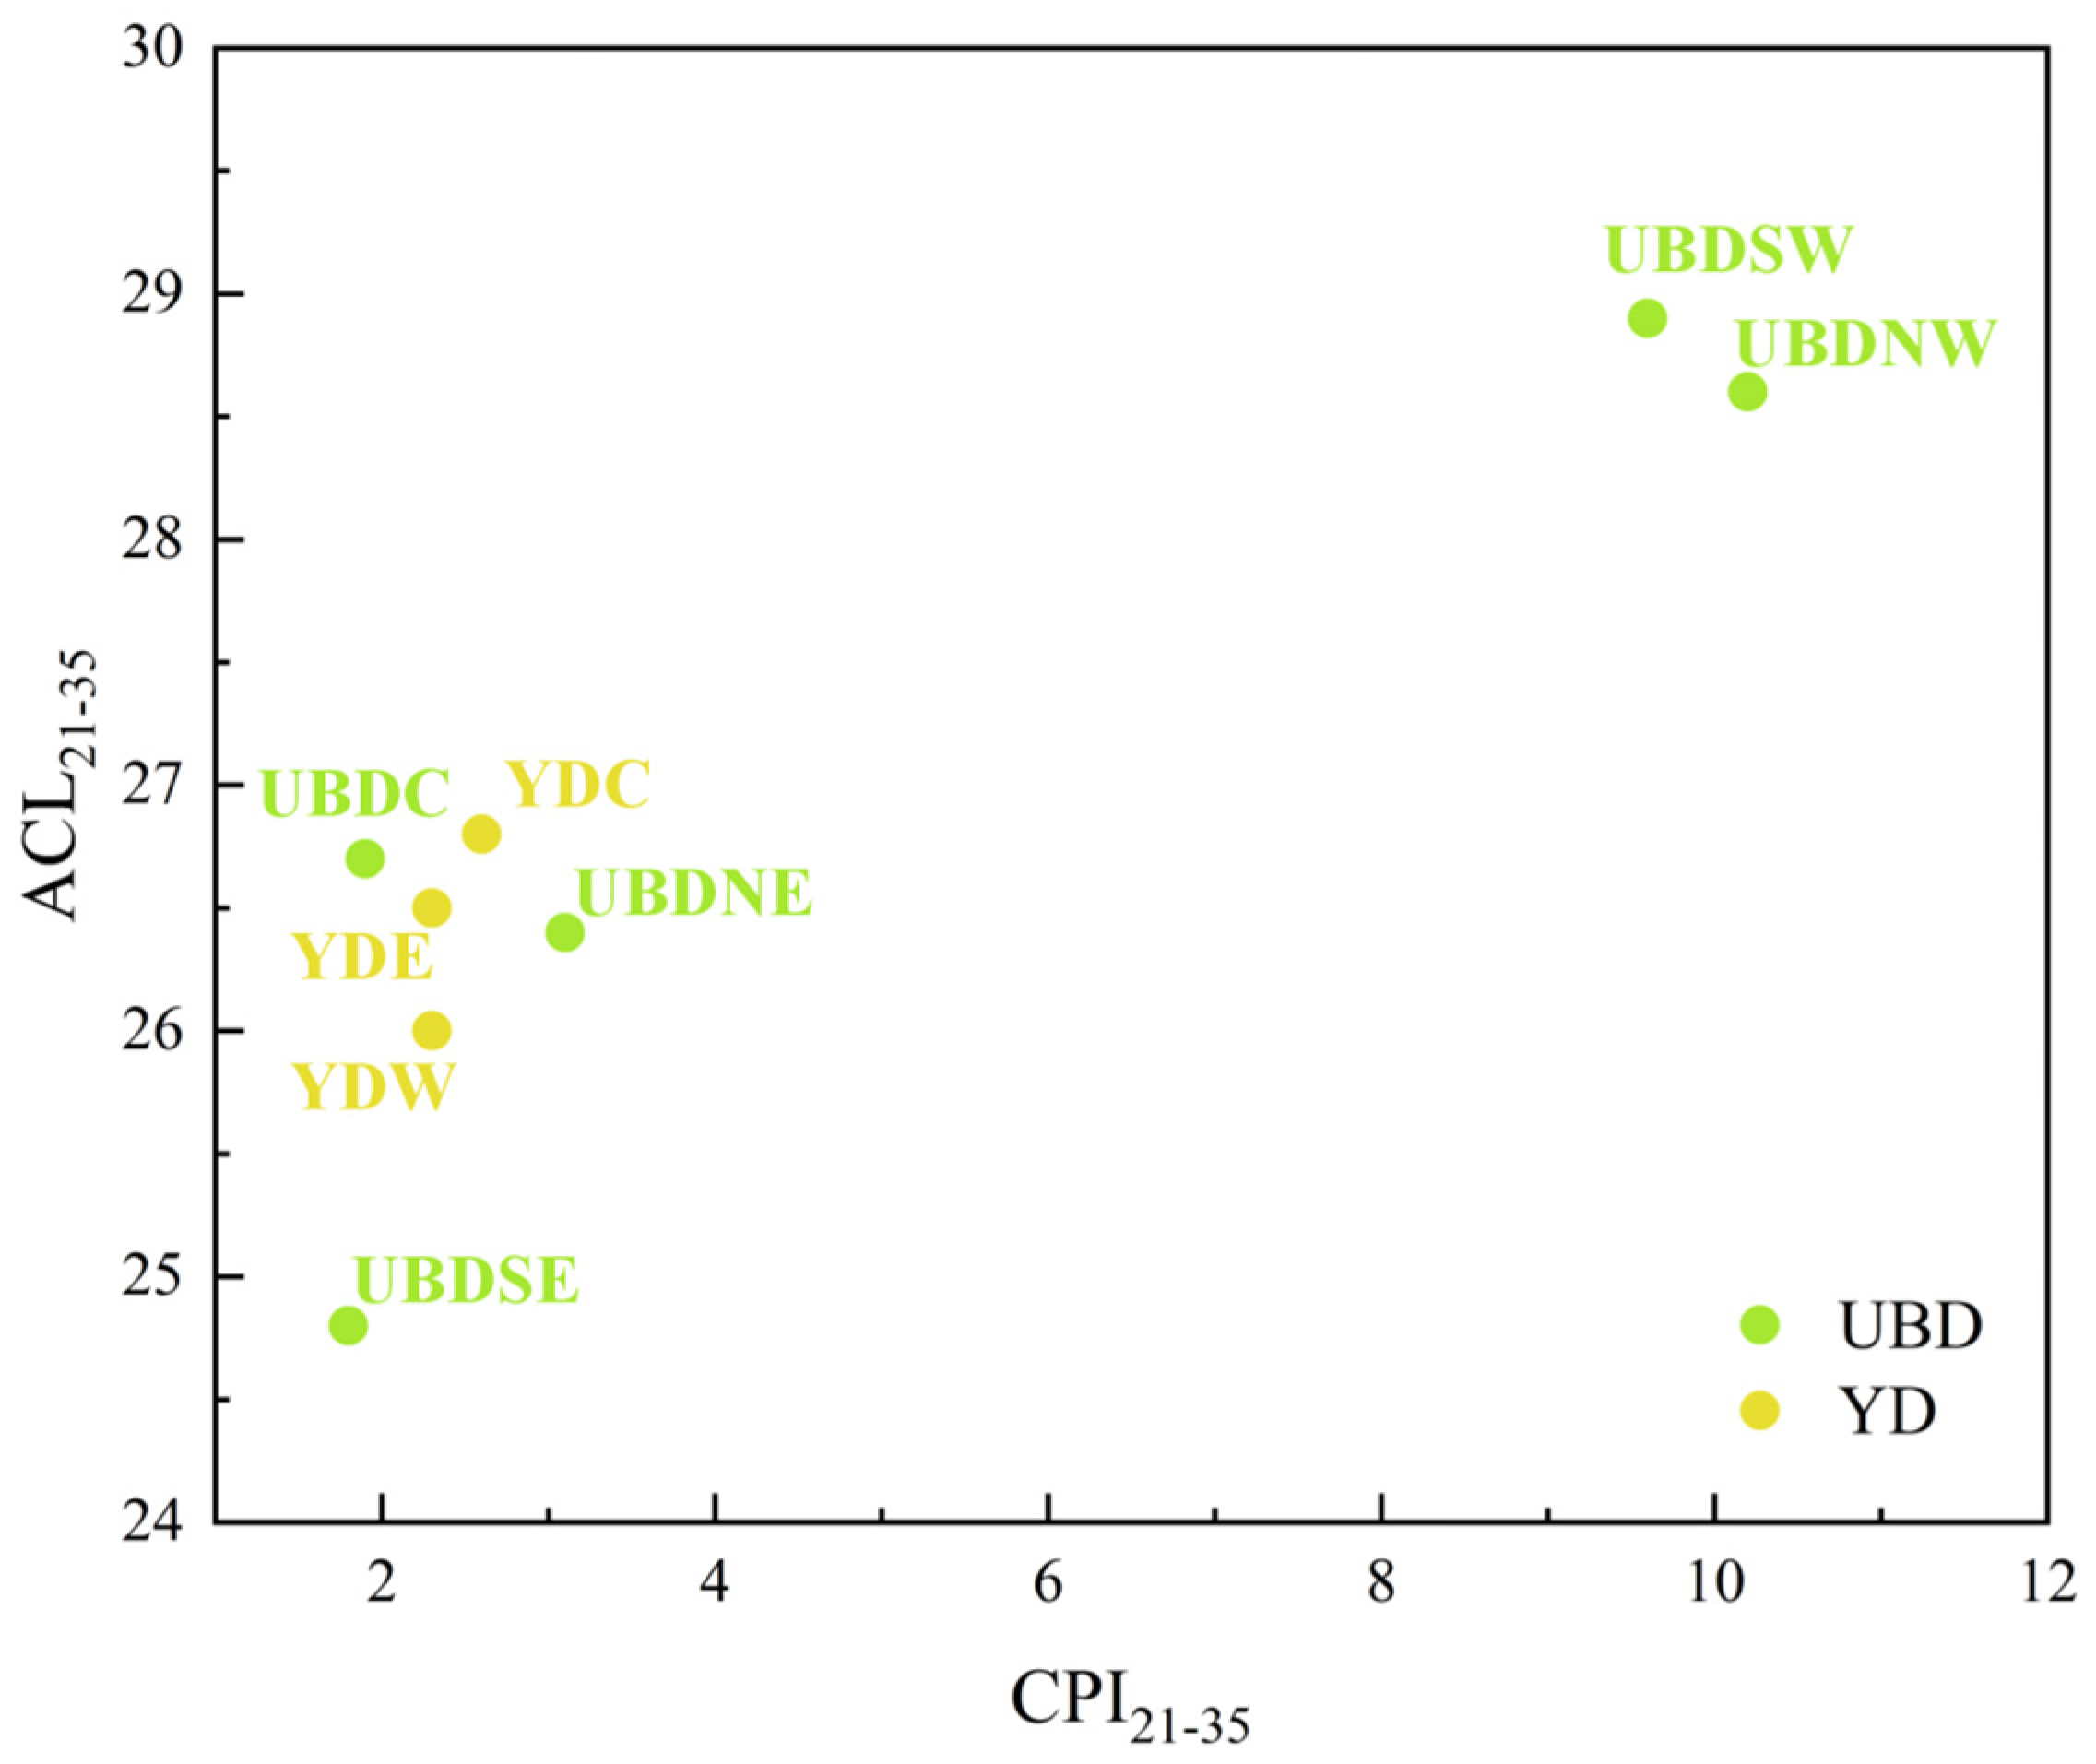
| Samples | ΣALK (μg/g) | Σ16–20/ΣALK (%) | Σ27–35/ΣALK (%) | CMAX of Long-Chain n-Alkanes | ACL21–35 | CPI21–35 |
|---|---|---|---|---|---|---|
| UBDNE | 0.05 | 37 | 35 | 29 | 26.4 | 3.1 |
| UBDNW | 0.31 | 7 | 79 | 31 | 28.6 | 10.2 |
| UBDSW | 0.92 | 30 | 61 | 29 | 28.9 | 9.6 |
| UBDSE | 0.06 | 72 | 9 | 29, 31 | 24.8 | 1.8 |
| UBDC | 0.10 | 52 | 27 | 29 | 26.7 | 1.9 |
| YDW | 0.20 | 79 | 10 | 29, 31 | 26.0 | 2.3 |
| YDC | 0.24 | 79 | 12 | 31 | 26.8 | 2.6 |
| YDE | 0.11 | 76 | 13 | 31 | 26.5 | 2.3 |
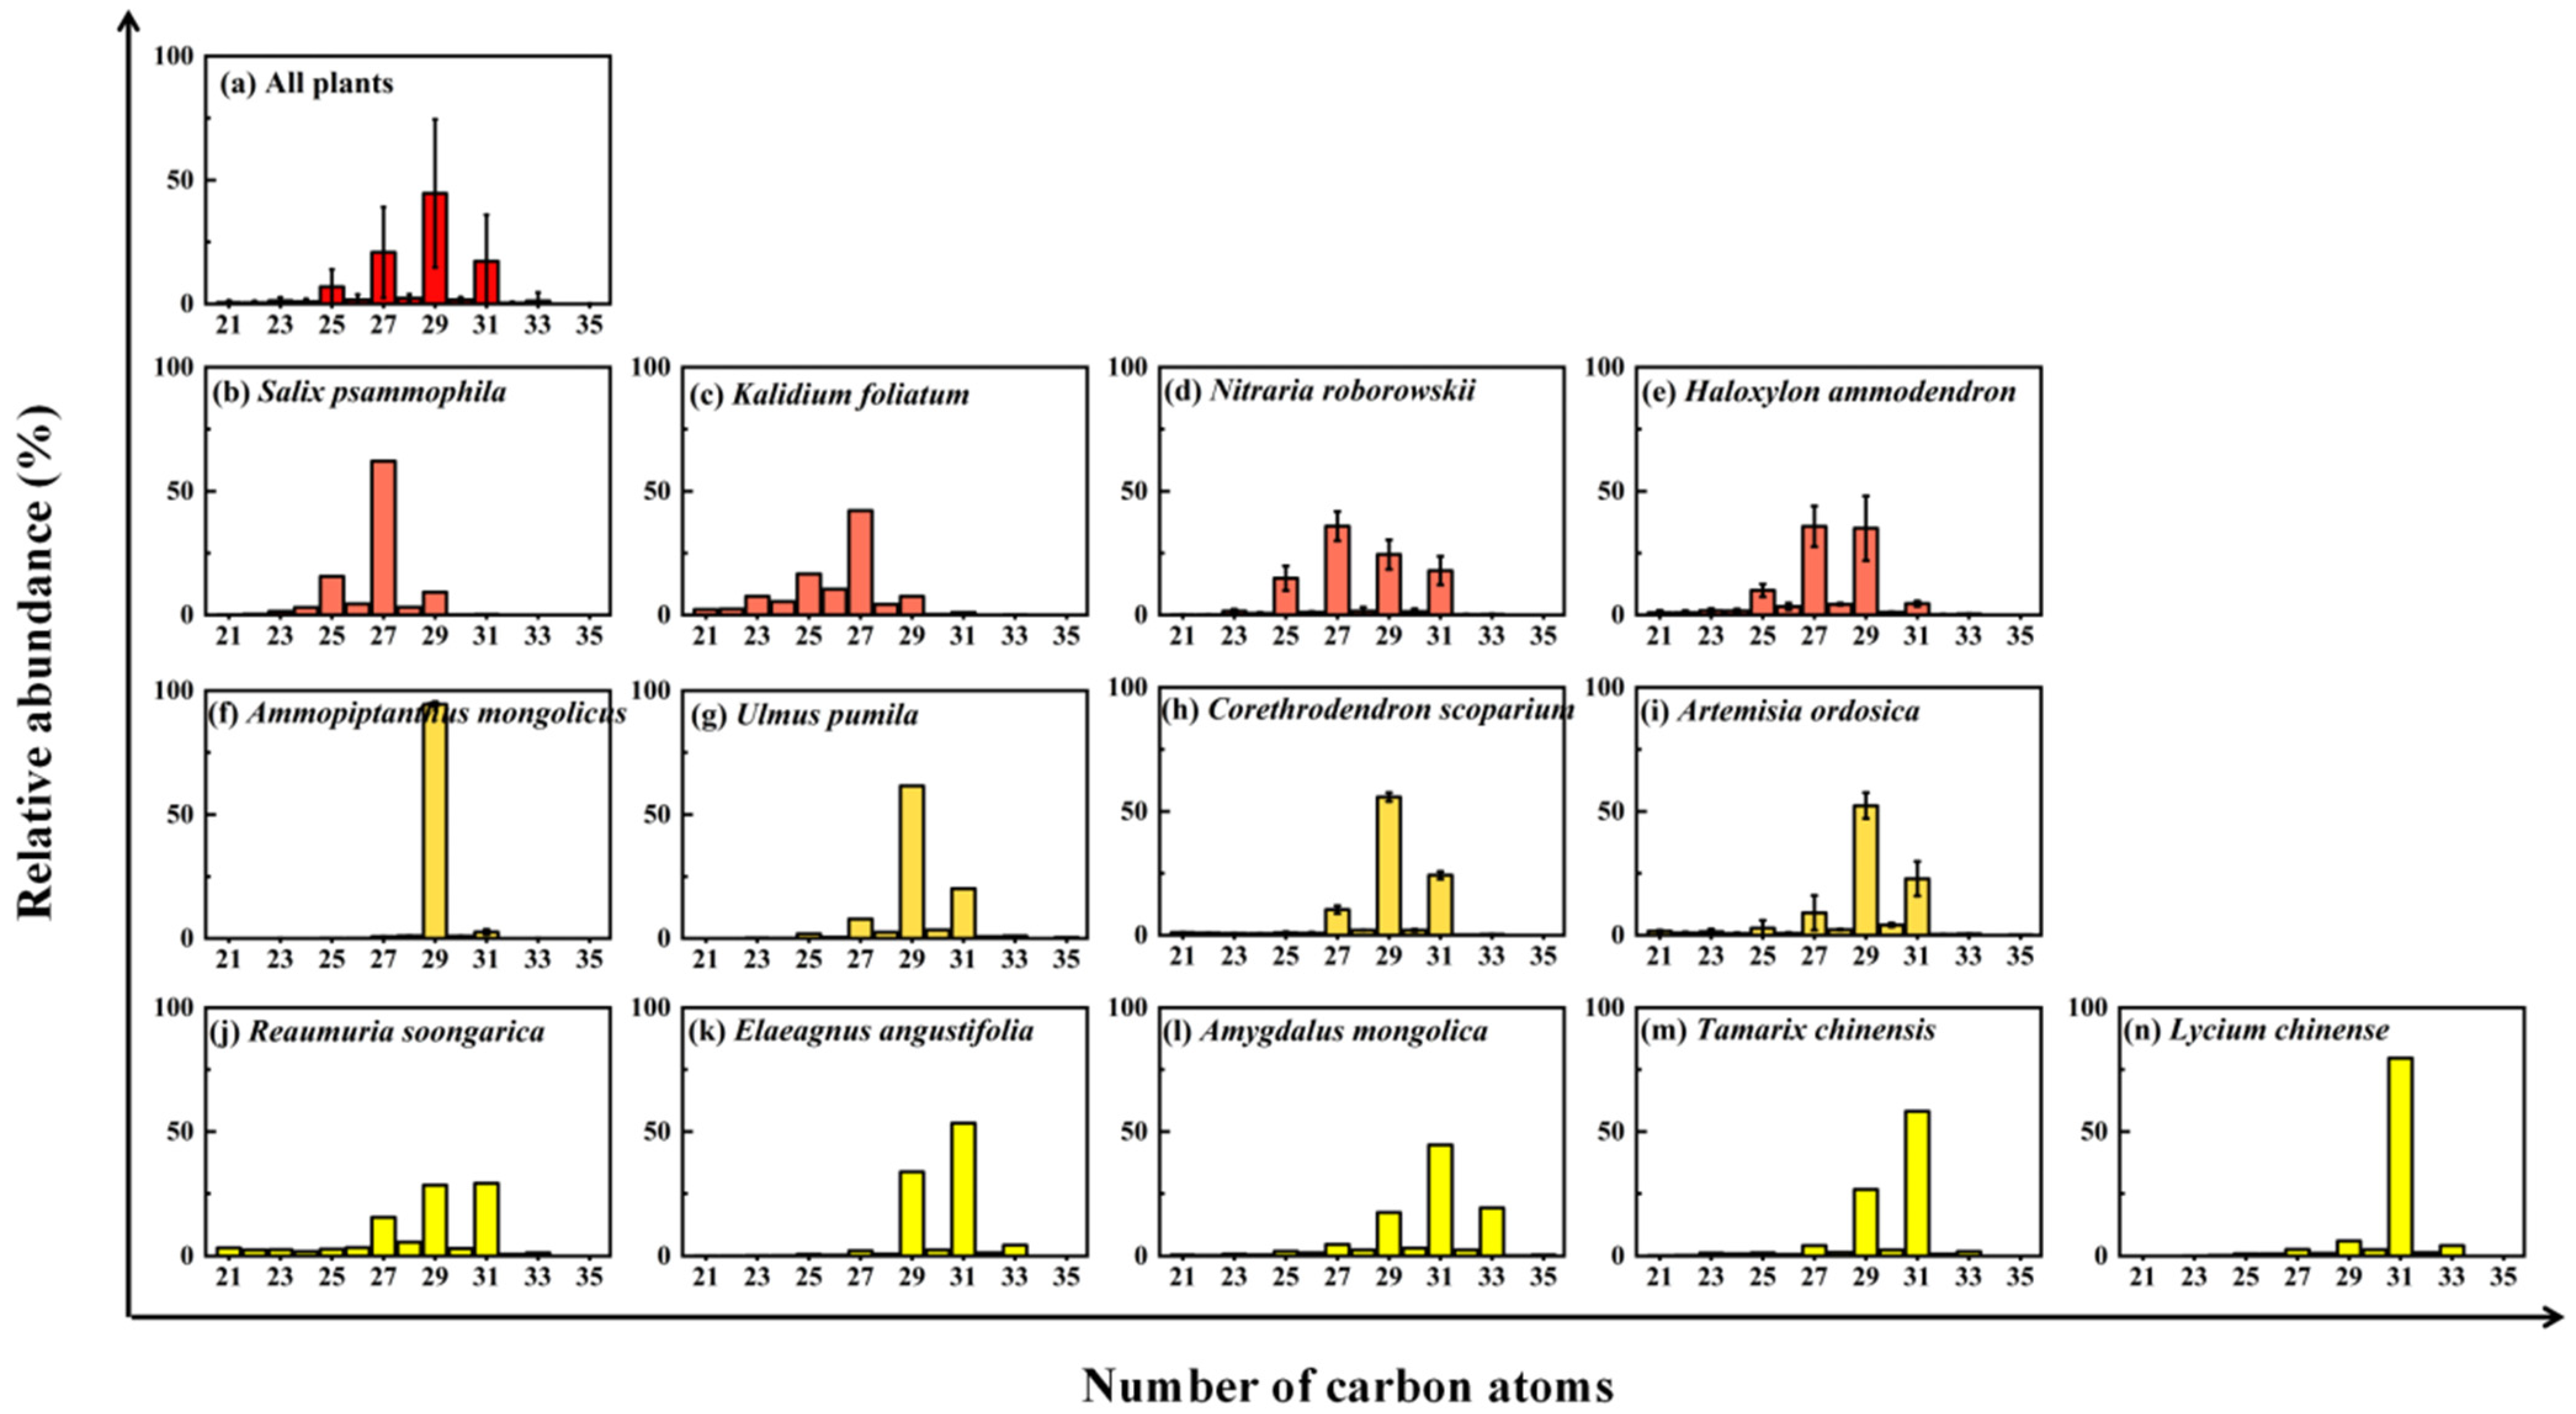
| Desert Plant Species | ΣALK (μg/g) | CMAX | ACL21–35 | CPI21–35 |
|---|---|---|---|---|
| Salix psammophila | 1572 | 27 | 26.7 | 8.0 |
| Kalidium foliatum | 114 | 27 | 26.1 | 3.3 |
| Nitraria roborowskii | 410 ± 168 (201–653) 1 | 27 | 27.9 ± 0.3 (27.3–28.2) | 23.2 ± 8.2 (6.5–33.7) |
| Haloxylon ammodendron | 86 ± 32 (51–131) | 27, 29 | 27.5 ± 0.4 (27.3–28.2) | 10.4 ± 1.6 (8.3–12.3) |
| Ammopiptanthus mongolicus | 7383 ± 2742 (2452–10,111) | 29 | 29.0 ± 0.0 (29.0–29.1) | 47.1 ± 3.2 (44.1–53.4) |
| Ulmus pumila | 169 | 29 | 29.2 | 12.9 |
| Corethrodendron scoparium | 154 ± 9 (147–160) | 29 | 29.0 ± 0.0 (29.0–29.0) | 14.2 ± 2.6 (12.4–16.0) |
| Artemisia ordosica | 152 ± 81 (95–209) | 29 | 28.9 ± 0.6 (28.5–29.3) | 9.8 ± 0.5 (9.5–10.2) |
| Reaumuria soongarica | 35 | 29, 31 | 28.4 | 4.8 |
| Elaeagnus angustifolia | 1233 | 31 | 30.2 | 17.9 |
| Amygdalus mongolica | 697 | 31 | 30.4 | 8.5 |
| Tamarix chinensis | 209 | 31 | 30.0 | 14.3 |
| Lycium chinense | 1975 | 31 | 30.7 | 14.9 |
Disclaimer/Publisher’s Note: The statements, opinions and data contained in all publications are solely those of the individual author(s) and contributor(s) and not of MDPI and/or the editor(s). MDPI and/or the editor(s) disclaim responsibility for any injury to people or property resulting from any ideas, methods, instructions or products referred to in the content. |
© 2024 by the authors. Licensee MDPI, Basel, Switzerland. This article is an open access article distributed under the terms and conditions of the Creative Commons Attribution (CC BY) license (https://creativecommons.org/licenses/by/4.0/).
Share and Cite
Zhou, S.; Xi, L.; Cui, M.; Cui, G.; Gao, P.; Zhu, J.; Kong, W.; Jia, Y.; Lu, Q. Decoupling Distribution of n-Alkanes in Aeolian Sand and Vegetation of the Northern Ulan Buh Desert, China: Insight into Organic Matter Preservation in Arid Regions. Plants 2024, 13, 2898. https://doi.org/10.3390/plants13202898
Zhou S, Xi L, Cui M, Cui G, Gao P, Zhu J, Kong W, Jia Y, Lu Q. Decoupling Distribution of n-Alkanes in Aeolian Sand and Vegetation of the Northern Ulan Buh Desert, China: Insight into Organic Matter Preservation in Arid Regions. Plants. 2024; 13(20):2898. https://doi.org/10.3390/plants13202898
Chicago/Turabian StyleZhou, Shangzhe, Lei Xi, Mengchun Cui, Guipeng Cui, Pan Gao, Jinlei Zhu, Weiyuan Kong, Yufu Jia, and Qi Lu. 2024. "Decoupling Distribution of n-Alkanes in Aeolian Sand and Vegetation of the Northern Ulan Buh Desert, China: Insight into Organic Matter Preservation in Arid Regions" Plants 13, no. 20: 2898. https://doi.org/10.3390/plants13202898
APA StyleZhou, S., Xi, L., Cui, M., Cui, G., Gao, P., Zhu, J., Kong, W., Jia, Y., & Lu, Q. (2024). Decoupling Distribution of n-Alkanes in Aeolian Sand and Vegetation of the Northern Ulan Buh Desert, China: Insight into Organic Matter Preservation in Arid Regions. Plants, 13(20), 2898. https://doi.org/10.3390/plants13202898