
Species Survey of Leaf Hyponasty Responses to Warming Plus Elevated CO2


Abstract
1. Introduction
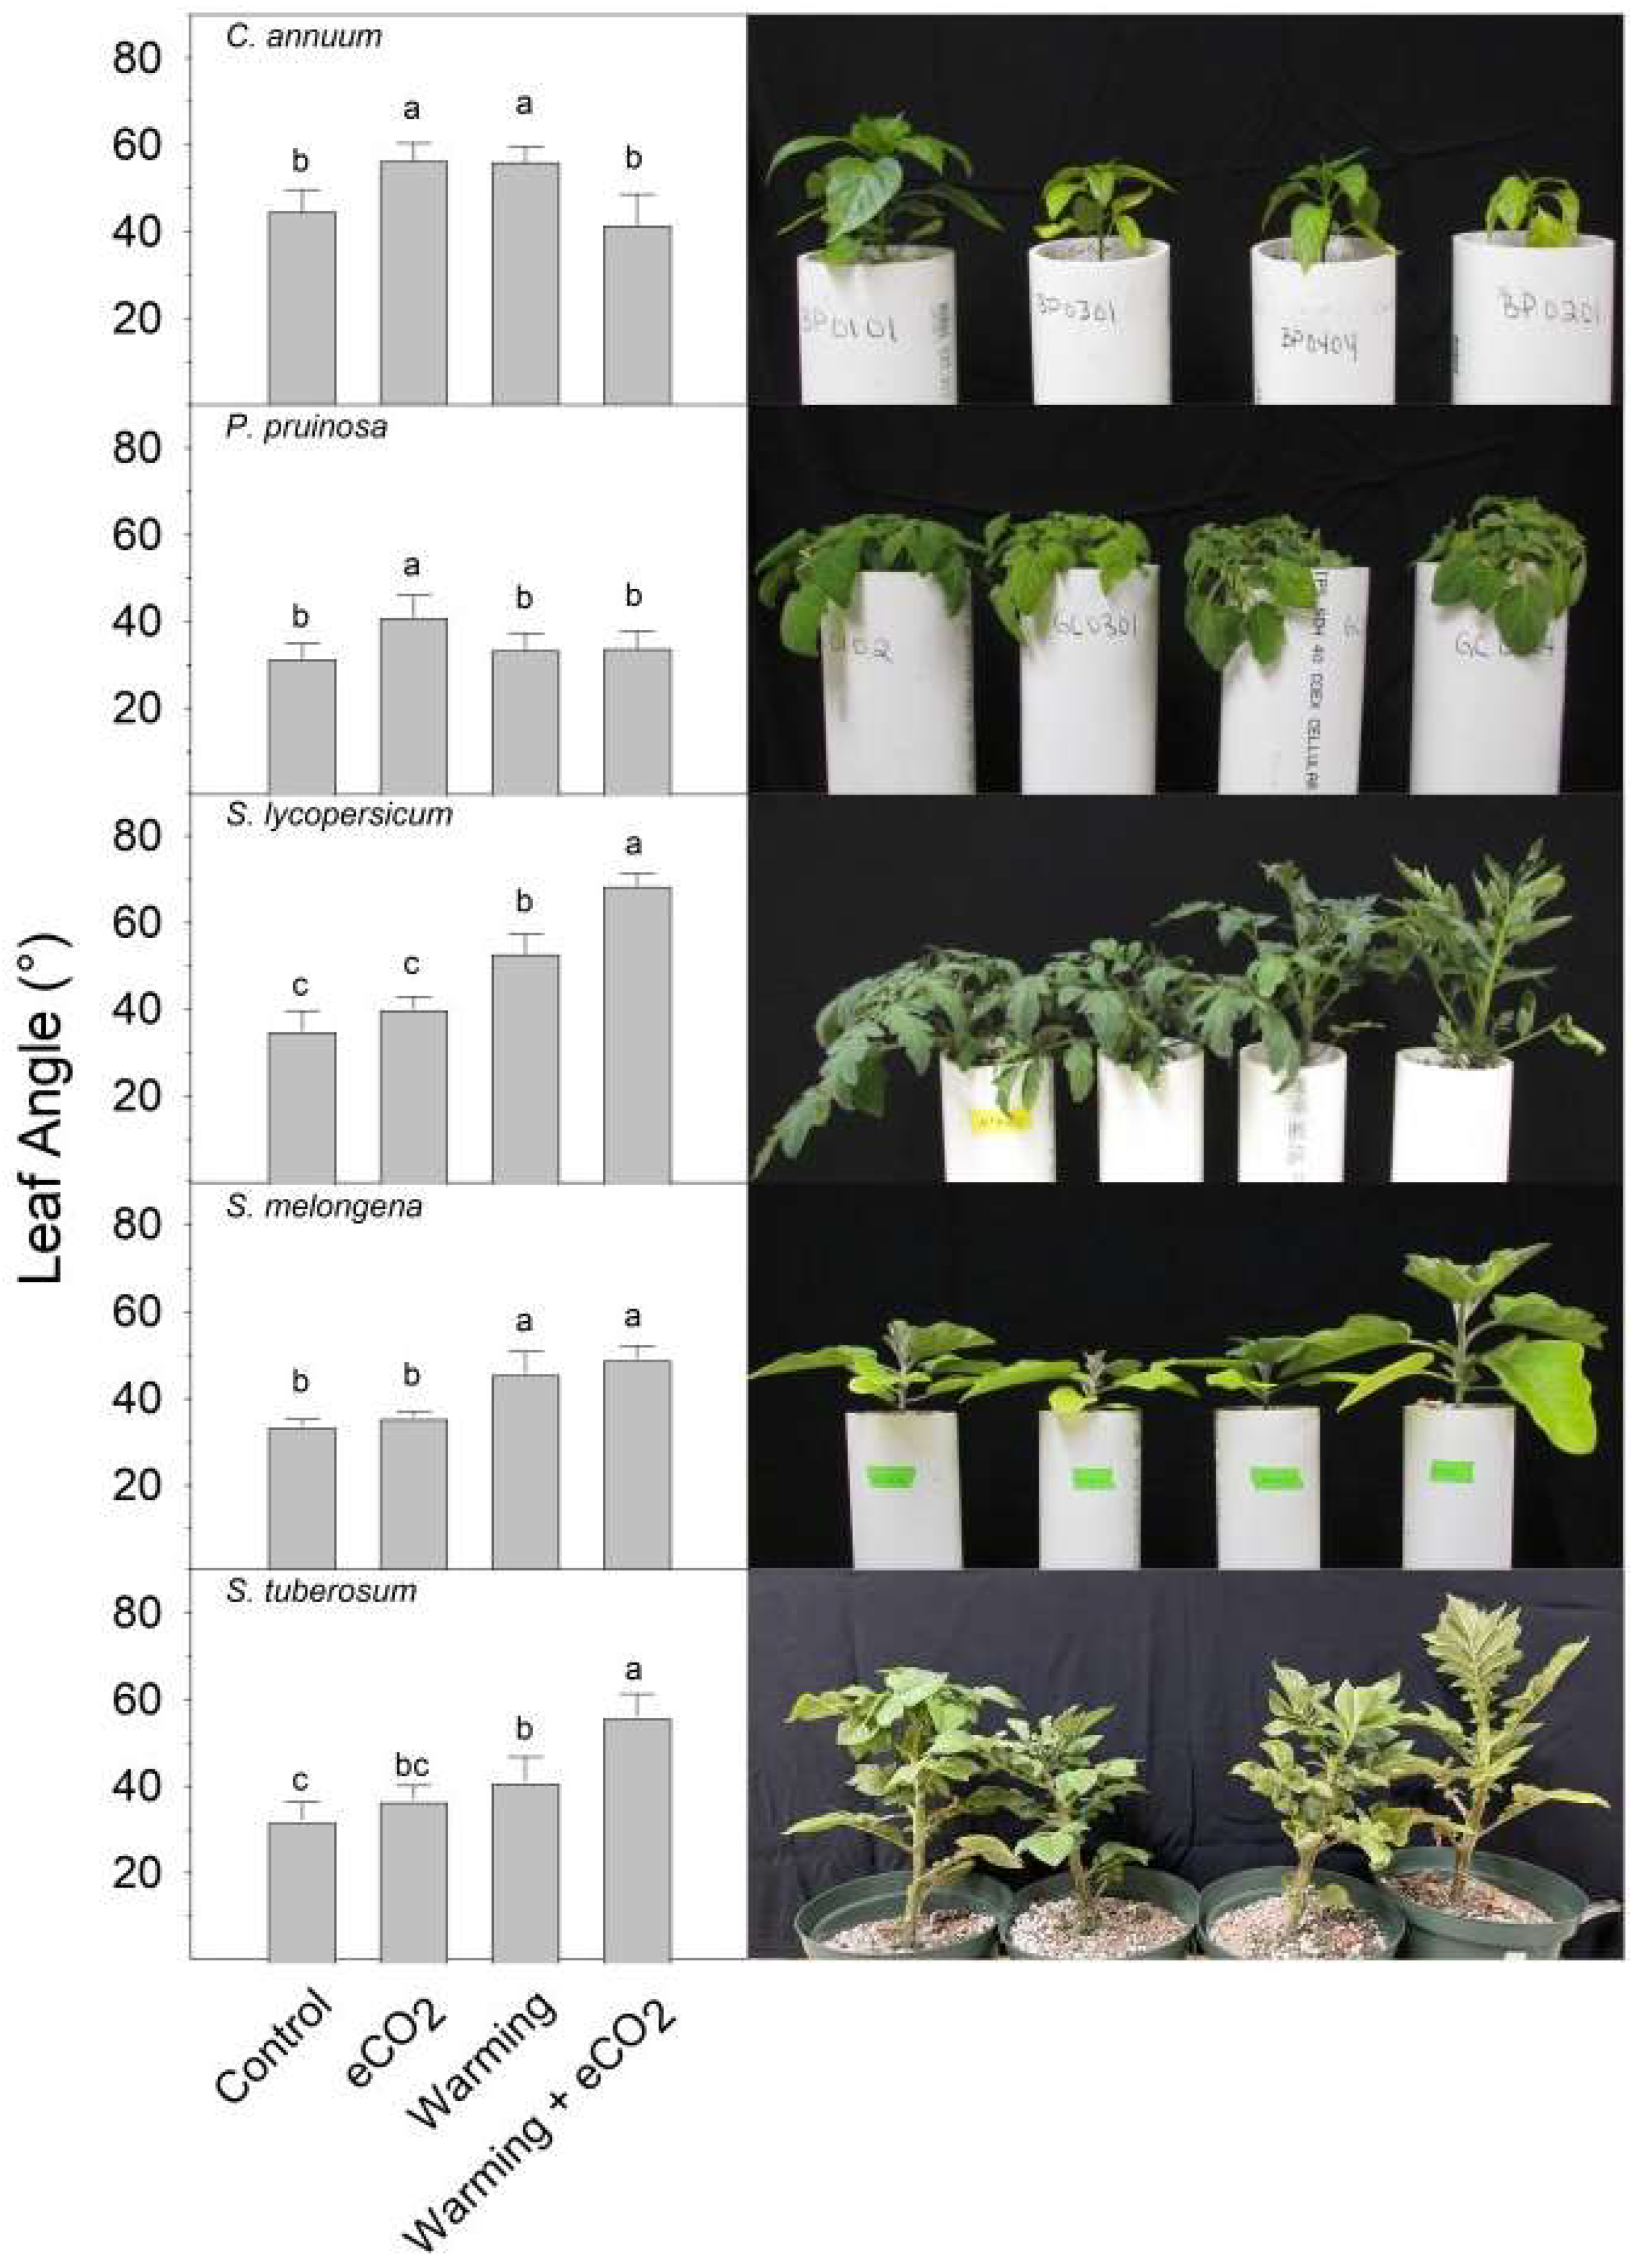
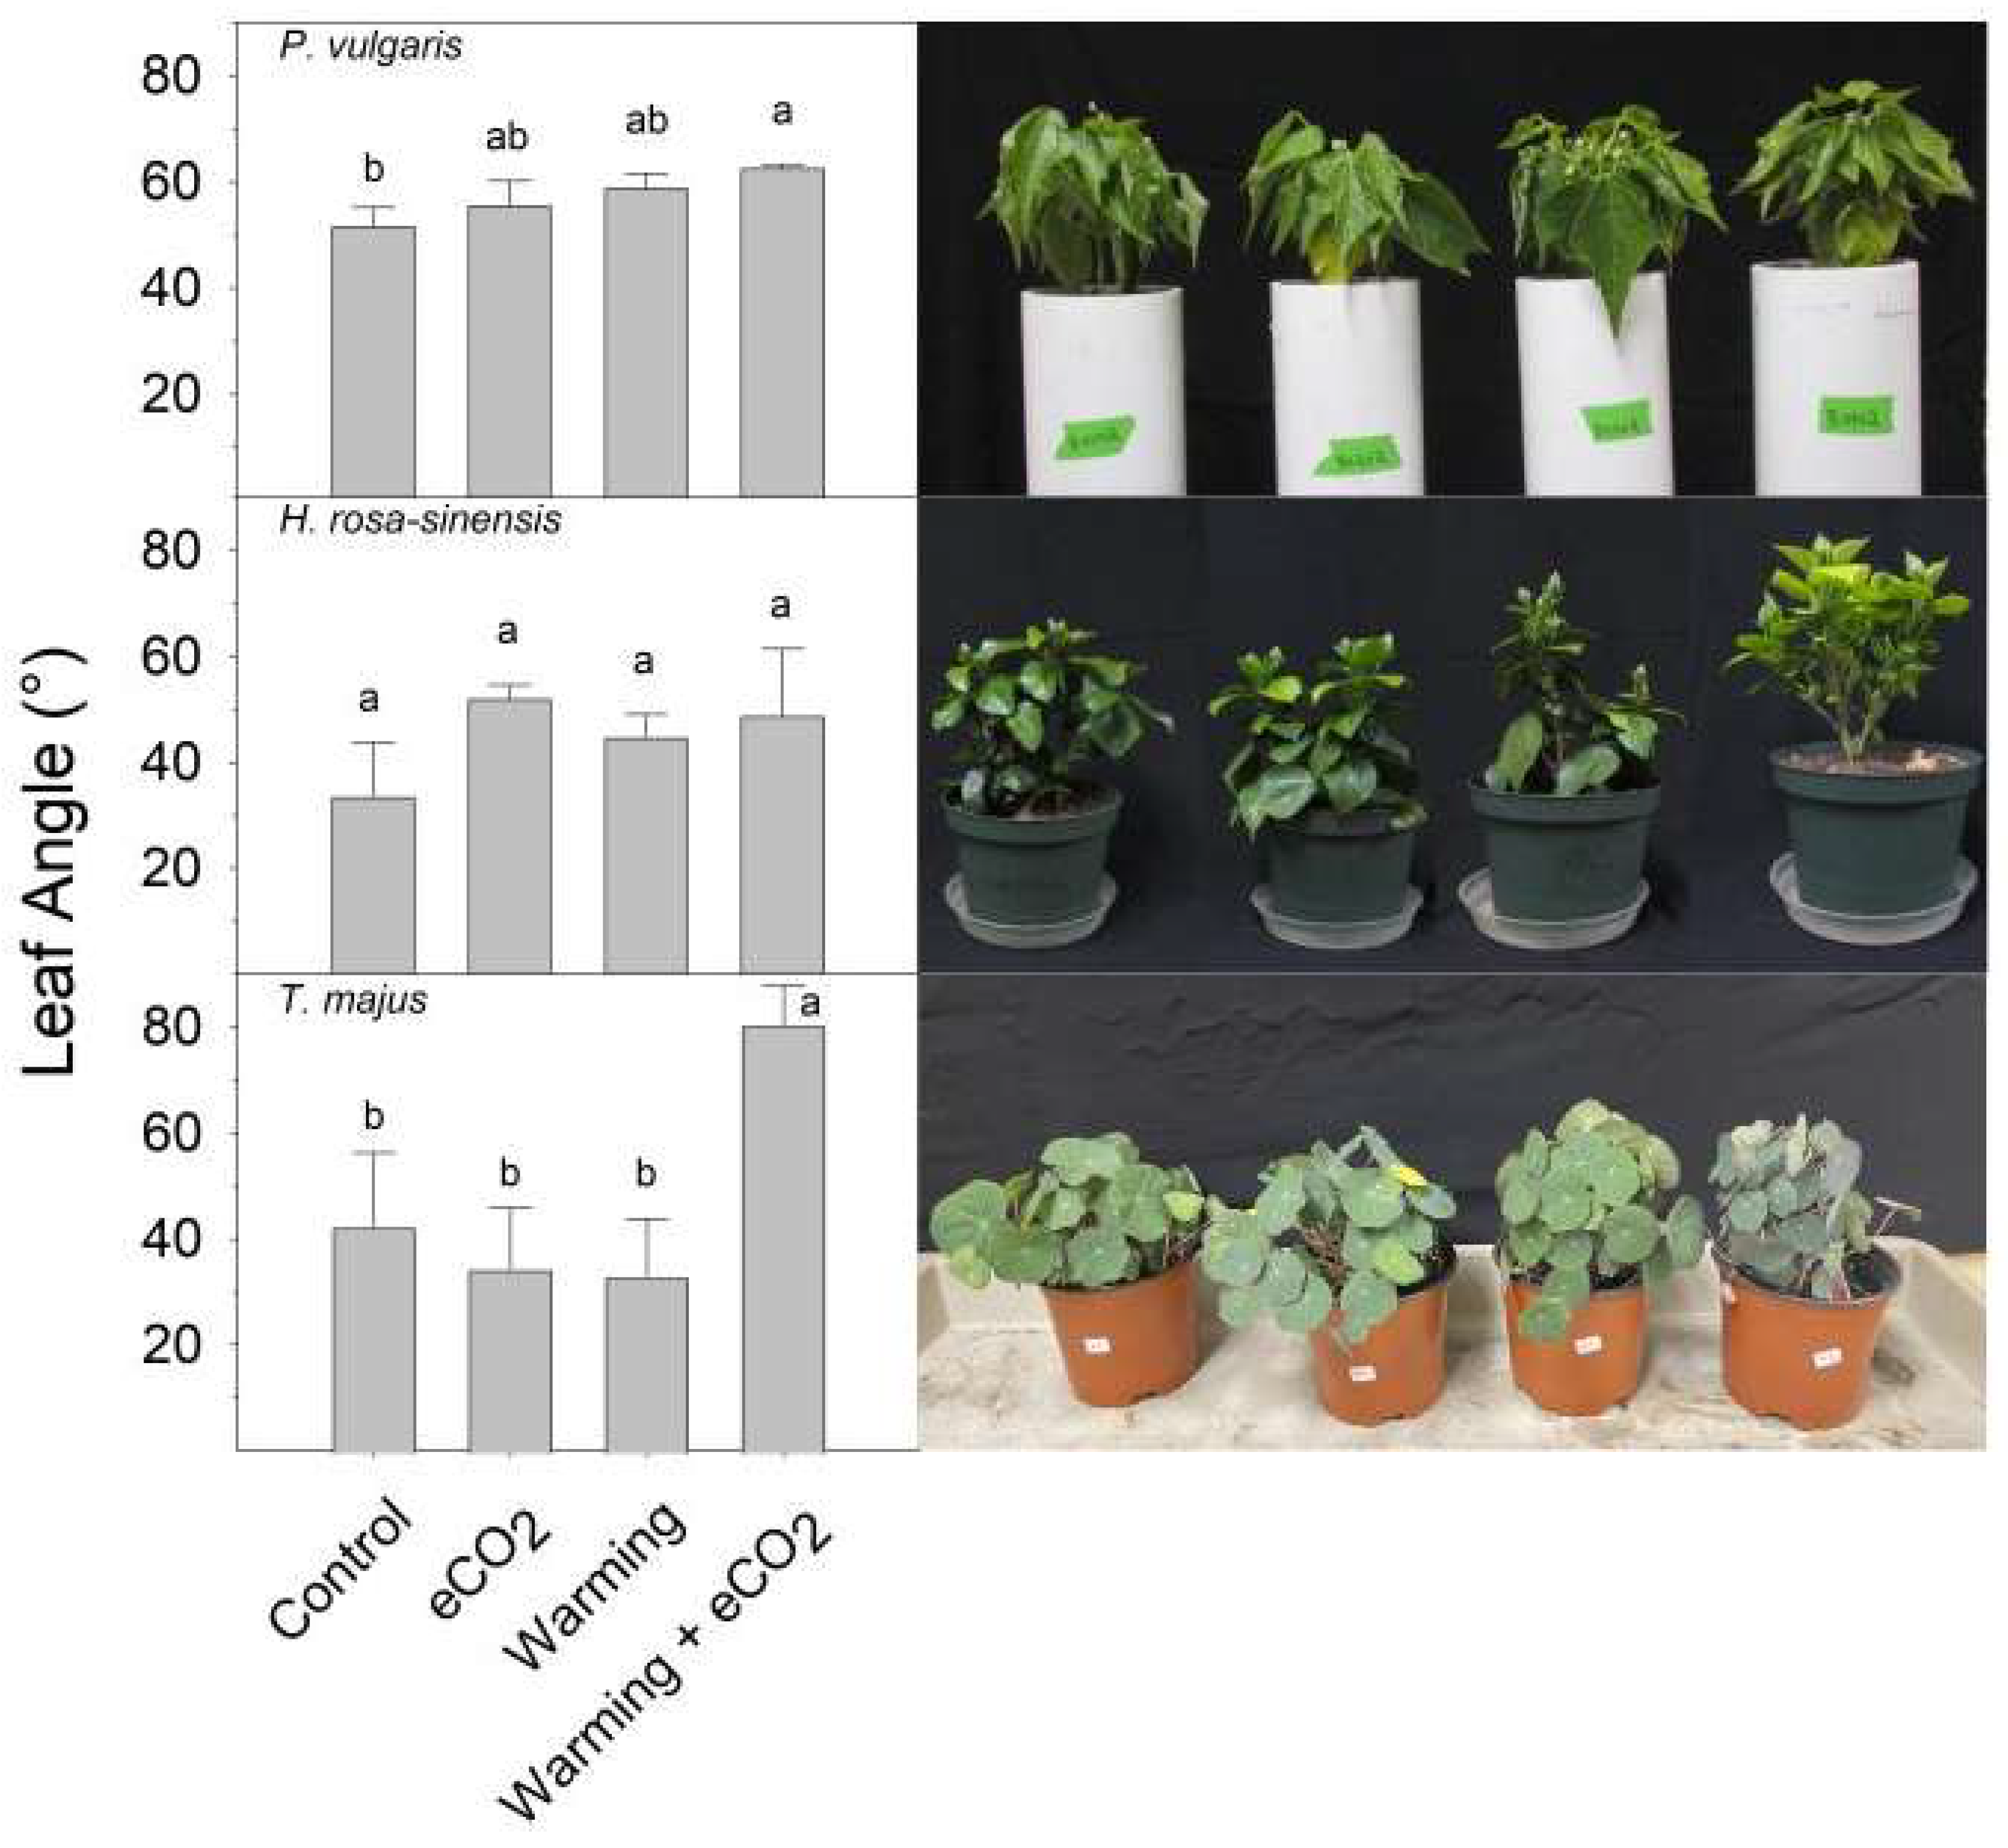
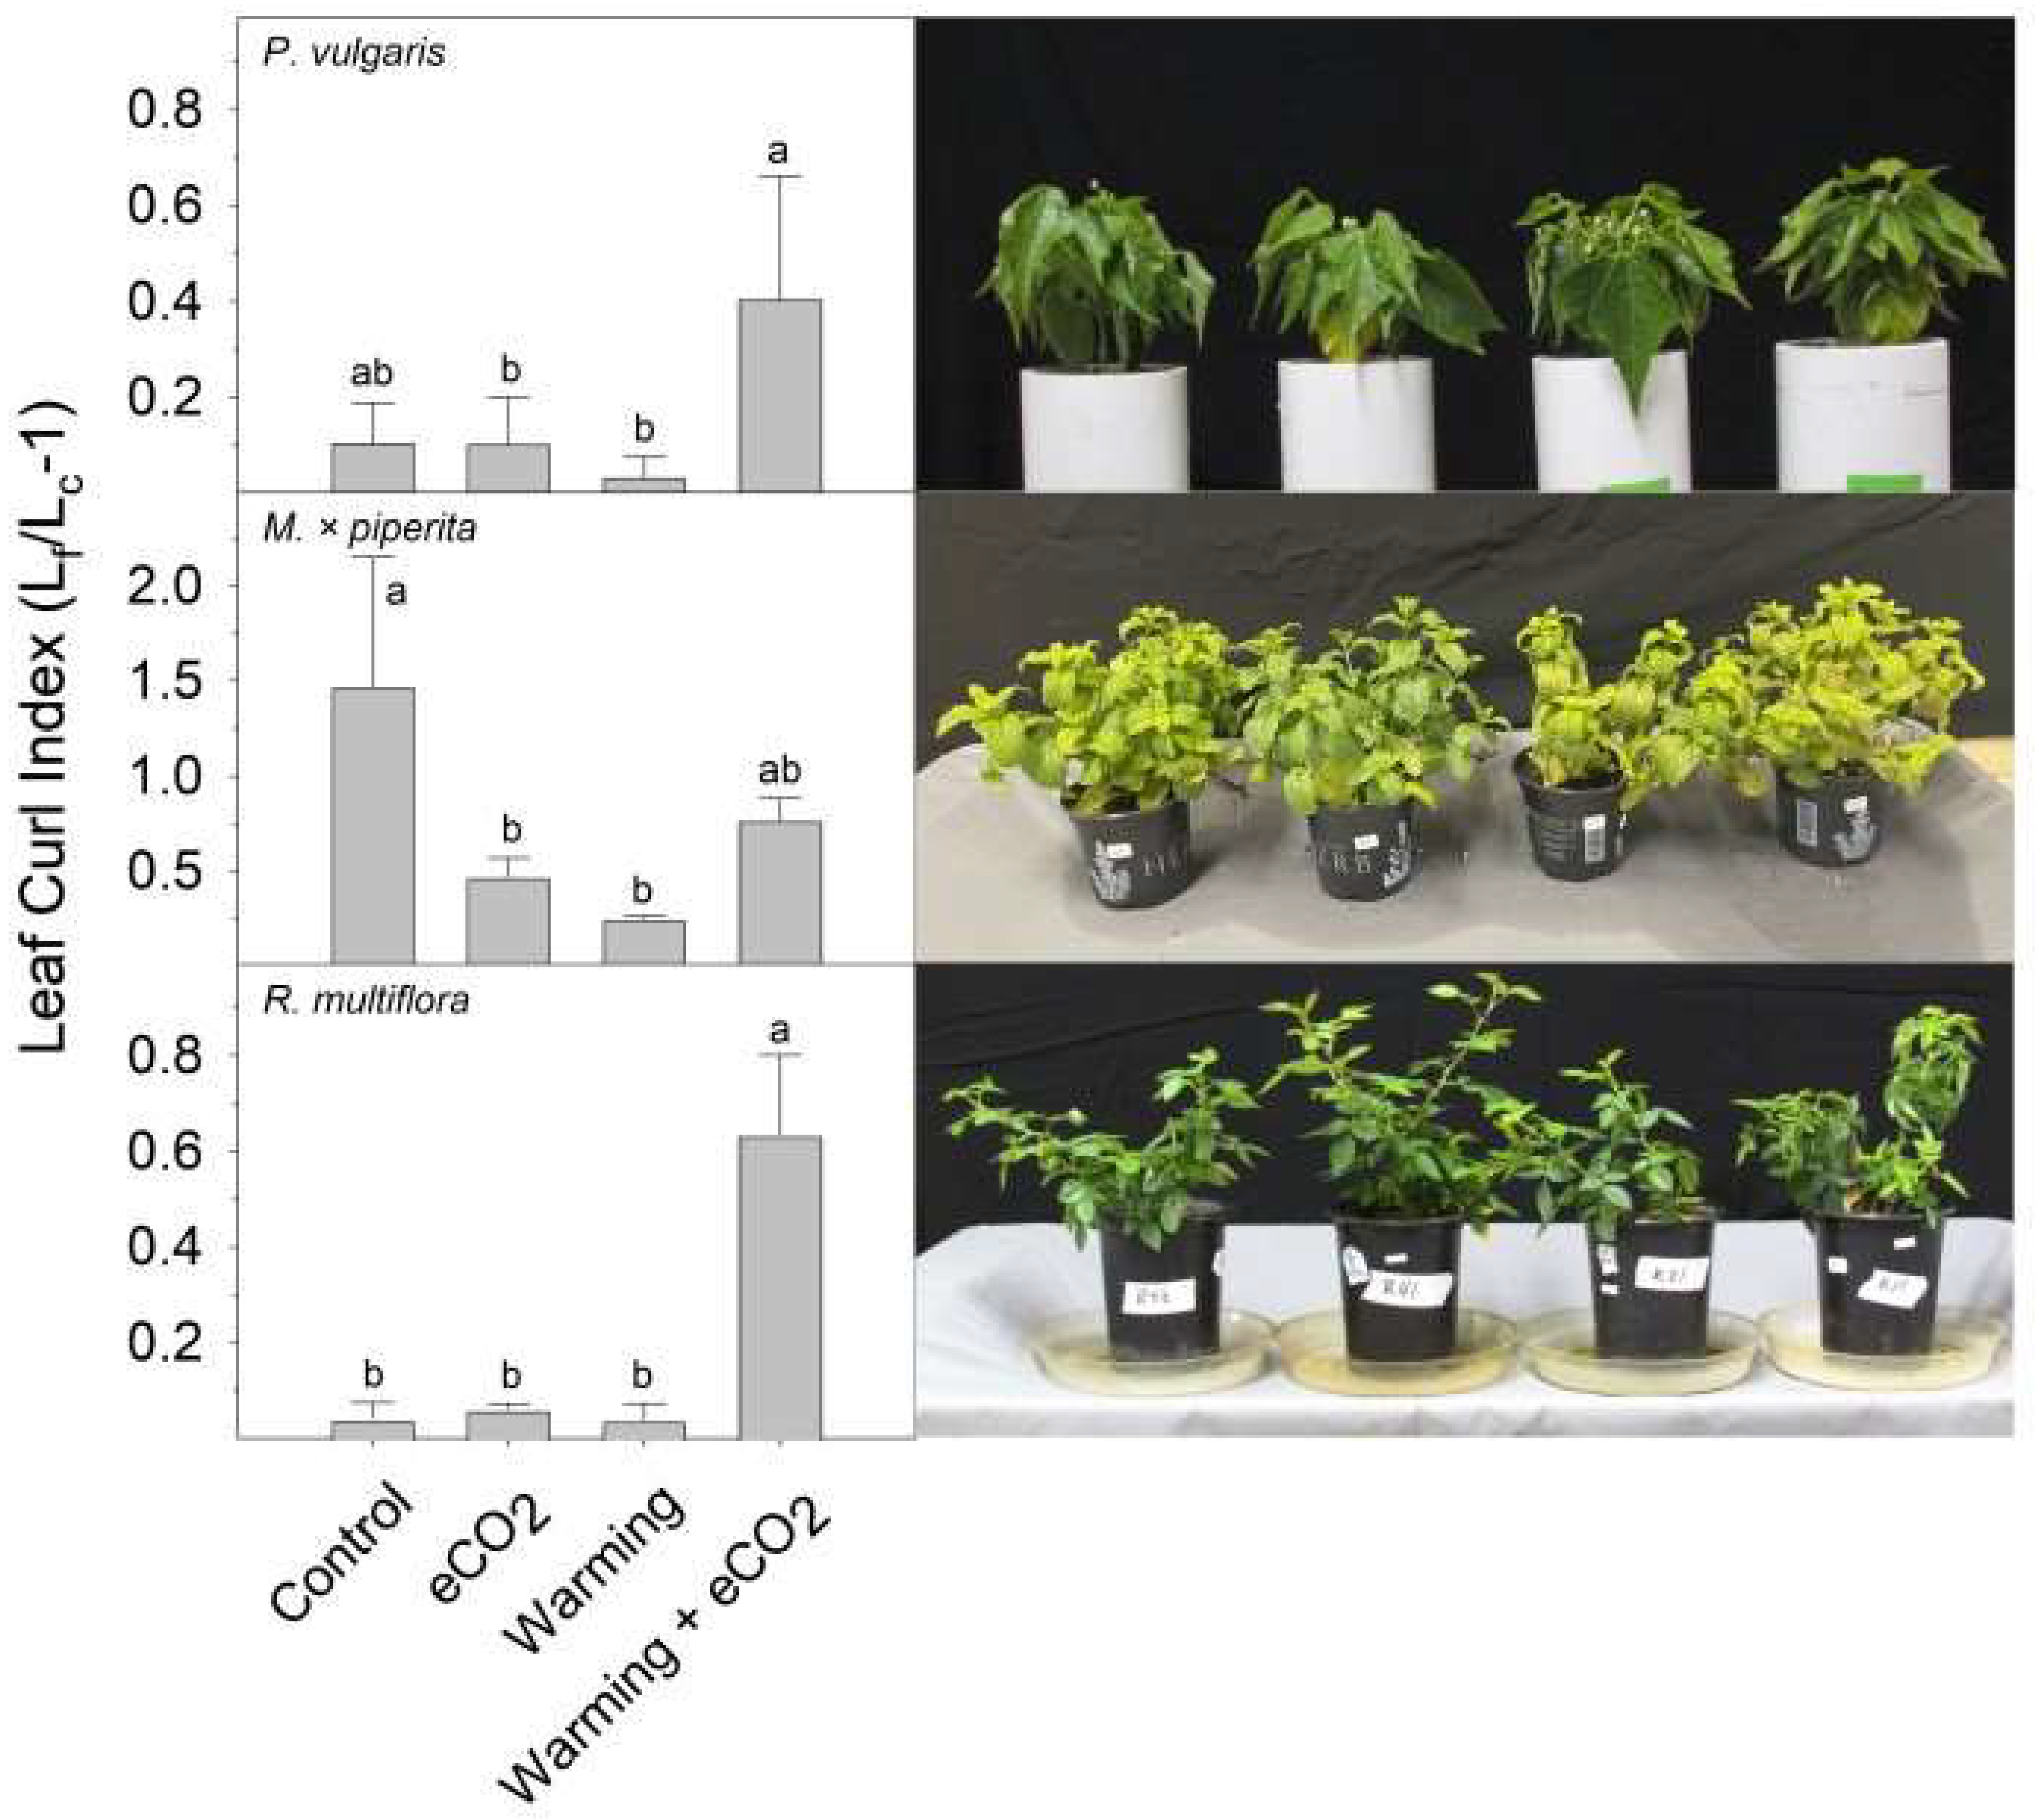
2. Results
3. Discussion
4. Conclusions
5. Materials and Methods
5.1. Growing Conditions
5.2. Treatments
5.3. Measurements
5.4. Data Analysis
Author Contributions
Funding
Data Availability Statement
Acknowledgments
Conflicts of Interest
References
- Intergovernmental Panel on Climate Change. Summary for Policymakers: Climate Change 2021: The Physical Science Basis; Contribution of Working Group I to the Sixth Assessment Report of the Intergovernmental Panel on Climate Change; Masson-Delmotte, V., Zhai, P.M., Pirani, S.L., Connors, C., Péan, S., Berger, N., Caud, Y., Chen, L., Goldfarb, M.I., Gomis, M.I., et al., Eds.; IPCC: Geneva, Switzerland, 2021; pp. 1–31. [Google Scholar]
- Zhao, C.; Liu, B.; Piao, S.; Wang, X.; Lobell, D.; Huang, Y.; Huang, M.; Yao, Y.; Bassu, S.; Ciais, P.; et al. Temperature increase reduces global yields of major crops in four independent estimates. Proc. Natl. Acad. Sci. USA 2017, 114, 9326–9331. [Google Scholar] [CrossRef] [PubMed]
- Schleussner, C.; Deryng, D.; Müller, C.; Elliott, J.; Saeed, F.; Folberth, C.; Liu, W.; Wang, X.; Pugh, T.; Thiery, W.; et al. Crop productivity changes in 1.5 °C and 2 °C worlds under climate sensitivity uncertainty. Environ. Res. Lett. 2019, 13, 064007. [Google Scholar] [CrossRef]
- Wang, D.; Heckathorn, S.; Hamilton, E.; Frantz, J. Effects of CO2 on the tolerance of photosynthesis to heat stress can be affected by photosynthetic pathway and nitrogen. Am. J. Bot. 2014, 101, 34–44. [Google Scholar] [CrossRef] [PubMed]
- Xu, Z.; Jiang, Y.; Jia, B.; Zhou, G. Elevated-CO2 response of stomata and its dependence on environmental factors. Front. Plant Sci. 2016, 7, 657. [Google Scholar] [CrossRef] [PubMed]
- Wang, Y.; Du, S.; Li, L.; Huang, L.; Fang, P.; Lin, X.; Zhang, Y.; Wang, H. Effect of CO2 elevation on root growth and its relationship with indole acetic acid and ethylene in tomato seedlings. Pedosphere 2009, 19, 570–576. [Google Scholar] [CrossRef]
- Zhang, S.; Li, S.; Sun, Z.; Shao, S.; Hu, L.; Ye, M.; Zhou, Y.; Xia, X.; Yu, J.; Shi, K. Antagonism between phytohormone signaling underlies the variation of disease susceptibility of tomato plants under elevated CO2. J. Exp. Bot. 2015, 66, 1951–1963. [Google Scholar] [CrossRef]
- Pan, C.; Zhang, H.; Ma, Q.; Fan, F.; Fu, R.; Ahammed, G.; Yu, J.; Shi, K. Role of ethylene biosynthesis and signaling in elevated CO2-induced heat stress response of tomato. Planta 2019, 250, 563–572. [Google Scholar] [CrossRef]
- Li, N.; Euring, D.; Cha, J.; Lin, Z.; Lu, M.; Huang, L.; Kim, W. Plant hormone-mediated regulation of heat tolerance in response to global climate change. Front. Plant Sci. 2021, 11, 627969. [Google Scholar] [CrossRef]
- Wang, D.; Heckathorn, S.; Wang, X.; Philpott, S. A meta-analysis of plant physiological and growth response to temperature and elevated CO2. Oecologia 2012, 169, 1–3. [Google Scholar] [CrossRef]
- Pandey, P.; Ramegowda, V.; Senthil-Kumar, M. Shared and unique responses of plants to multiple individual stresses and stress combinations: Physiological and molecular mechanisms. Front. Plant Sci. 2015, 6, 723. [Google Scholar] [CrossRef]
- Jayawardena, D.; Heckathorn, S.; Boldt, J. A meta-analysis of the combined effects of elevated carbon dioxide and chronic warming on plant %N, protein content and N-uptake rate. AoB Plants 2021, 13, plab031. [Google Scholar] [CrossRef] [PubMed]
- Zandalinas, S.; Fritschi, F.; Mittler, R. Global warming, climate change, and environmental pollution: Recipe for a multifactorial stress combination disaster. Trends Plant Sci. 2021, 26, 588–599. [Google Scholar] [CrossRef]
- Jayawardena, D.; Heckathorn, S.; Bista, D.; Boldt, J. Elevated carbon dioxide plus chronic warming causes dramatic increases in leaf angle in tomato, which correlates with reduced plant growth. Plant Cell Environ. 2018, 42, 1247–1256. [Google Scholar] [CrossRef] [PubMed]
- Thomas, M.; Heckathorn, S.; Boldt, J. Elevated CO2 increases severity of thermal hyponasty in leaves of tomato. Horticulturae 2023, 9, 907. [Google Scholar] [CrossRef]
- Quint, M.; Delker, C.; Franklin, K.; Wigge, P.; Halliday, K.; van Zanten, M. Molecular and genetic control of plant thermomorphogenesis. Nat. Plants 2016, 2, 15190. [Google Scholar] [CrossRef] [PubMed]
- Lippmann, R.; Babben, S.; Menger, A.; Delker, C.; Quint, M. Development of wild and cultivated plants under global warming conditions. Curr. Biol. 2019, 29, R1326–R1338. [Google Scholar] [CrossRef]
- Ludwig, W.; Hayes, S.; Trenner, J.; Delker, C.; Quint, M. On the evolution of plant thermomorphogenesis. J. Exp. Bot. 2021, 72, 7345–7358. [Google Scholar] [CrossRef]
- Casal, J.; Balasubramanian, S. Thermomorphogenesis. Annu. Rev. Plant Biol. 2019, 70, 321–346. [Google Scholar] [CrossRef]
- Ding, Y.; Shi, Y.; Yang, S. Molecular regulation of plant responses to environmental temperatures. Mol. Plant 2020, 13, 544–564. [Google Scholar] [CrossRef]
- Lee, J.; Kim, J.; Kim, J.; Park, Y.; Park, C. Plant Thermomorphogenic adaptation to global warming. J. Plant Biol. 2020, 63, 1–9. [Google Scholar] [CrossRef]
- Nicotra, A.; Atkin, O.; Bonser, A.; Davidson, A.; Finnegan, E.; Mathesius, U.; Poot, P.; Purugganan, M.; Richards, C.; Valladares, F.; et al. Plant phenotypic plasticity in a changing climate. Trends Plant Sci. 2010, 15, 684–692. [Google Scholar] [CrossRef] [PubMed]
- Abo Gamar, M.; Kisiala, A.; Emery, R.; Yeung, E.; Stone, S.; Qaderi, M. Elevated carbon dioxide decreases the adverse effects of higher temperature and drought stress by mitigating oxidative stress and improving water status in Arabidopsis thaliana. Planta 2019, 250, 1191–1214. [Google Scholar] [CrossRef] [PubMed]
- Loladze, I.; Nolan, J.; Ziska, L.; Knobbe, A. Rising atmospheric CO2 lowers concentrations of plant carotenoids essential to human health: A meta-analysis. Mol. Nutr. Food Res. 2019, 63, 1801047. [Google Scholar] [CrossRef] [PubMed]
- Xiong, D.; Chen, J.; Yu, T.; Gao, W.; Ling, X.; Li, Y.; Peng, S.; Huang, J. SPAD-based leaf nitrogen estimation is impacted by environmental factors and crop leaf characteristics. Sci. Rep. 2015, 5, 13389. [Google Scholar] [CrossRef]
- Bianchetti, R.; Luca, B.; Haro, L.; Rosado, D.; Demarco, D.; Conte, M.; Bermudez, L.; Freschi, L.; Fernie, A.; Michaelson, L.; et al. Phytochrome-dependent temperature perception modulates isoprenoid metabolism. Plant Physiol. 2020, 183, 869–882. [Google Scholar] [CrossRef]

| Species | Family | Leaf Type | Optimal Temperature (Day/Night) | Supraoptimal Temperature (Day/Night) |
|---|---|---|---|---|
| Pepper (C. annuum) | Solanaceae | Simple | 28 °C/23 °C | 36 °C/31 °C |
| Hibiscus (H. rosa-sinesnis) | Malvaceae | Compound | 30 °C/25 °C | 37 °C/32 °C |
| Mint (M. × piperita) | Lamiaceae | Simple | 22 °C/17 °C | 28 °C/23 °C |
| Bush bean (P. vulgaris) | Fabaceae | Compound | 29 °C/24 °C | 37 °C/32 °C |
| Ground cherry (P. pruinosa) | Solanaceae | Simple | 30 °C/25 °C | 38 °C/33 °C |
| Rose (R. multiflora) | Rosaceae | Compound | 30 °C/25 °C | 38 °C/33 °C |
| Tomato (S. lycopersicum) | Solanaceae | Compound | 30 °C/25 °C | 38 °C/33 °C |
| Eggplant (S. melongena) | Solanaceae | Simple | 30 °C/25 °C | 38 °C/33 °C |
| Potato (S. tuberosum) | Solanaceae | Compound | 24 °C/19 °C | 32 °C/29 °C |
| Nasturtium (T. majus) | Tropaeolacaeae | Peltate | 22 °C/17 °C | 28 °C/23 °C |
Disclaimer/Publisher’s Note: The statements, opinions and data contained in all publications are solely those of the individual author(s) and contributor(s) and not of MDPI and/or the editor(s). MDPI and/or the editor(s) disclaim responsibility for any injury to people or property resulting from any ideas, methods, instructions or products referred to in the content. |
© 2024 by the authors. Licensee MDPI, Basel, Switzerland. This article is an open access article distributed under the terms and conditions of the Creative Commons Attribution (CC BY) license (https://creativecommons.org/licenses/by/4.0/).
Share and Cite
Thomas, M.D.; Roberts, R.; Heckathorn, S.A.; Boldt, J.K. Species Survey of Leaf Hyponasty Responses to Warming Plus Elevated CO2. Plants 2024, 13, 204. https://doi.org/10.3390/plants13020204
Thomas MD, Roberts R, Heckathorn SA, Boldt JK. Species Survey of Leaf Hyponasty Responses to Warming Plus Elevated CO2. Plants. 2024; 13(2):204. https://doi.org/10.3390/plants13020204
Chicago/Turabian StyleThomas, Michael D., Reagan Roberts, Scott A. Heckathorn, and Jennifer K. Boldt. 2024. "Species Survey of Leaf Hyponasty Responses to Warming Plus Elevated CO2" Plants 13, no. 2: 204. https://doi.org/10.3390/plants13020204
APA StyleThomas, M. D., Roberts, R., Heckathorn, S. A., & Boldt, J. K. (2024). Species Survey of Leaf Hyponasty Responses to Warming Plus Elevated CO2. Plants, 13(2), 204. https://doi.org/10.3390/plants13020204