
Changes in the Aroma Profile and Phenolic Compound Contents of Different Strawberry Cultivars during Ripening

 ,
,  ,
,  , , , ,
  ,
,
Abstract
1. Introduction
2. Results
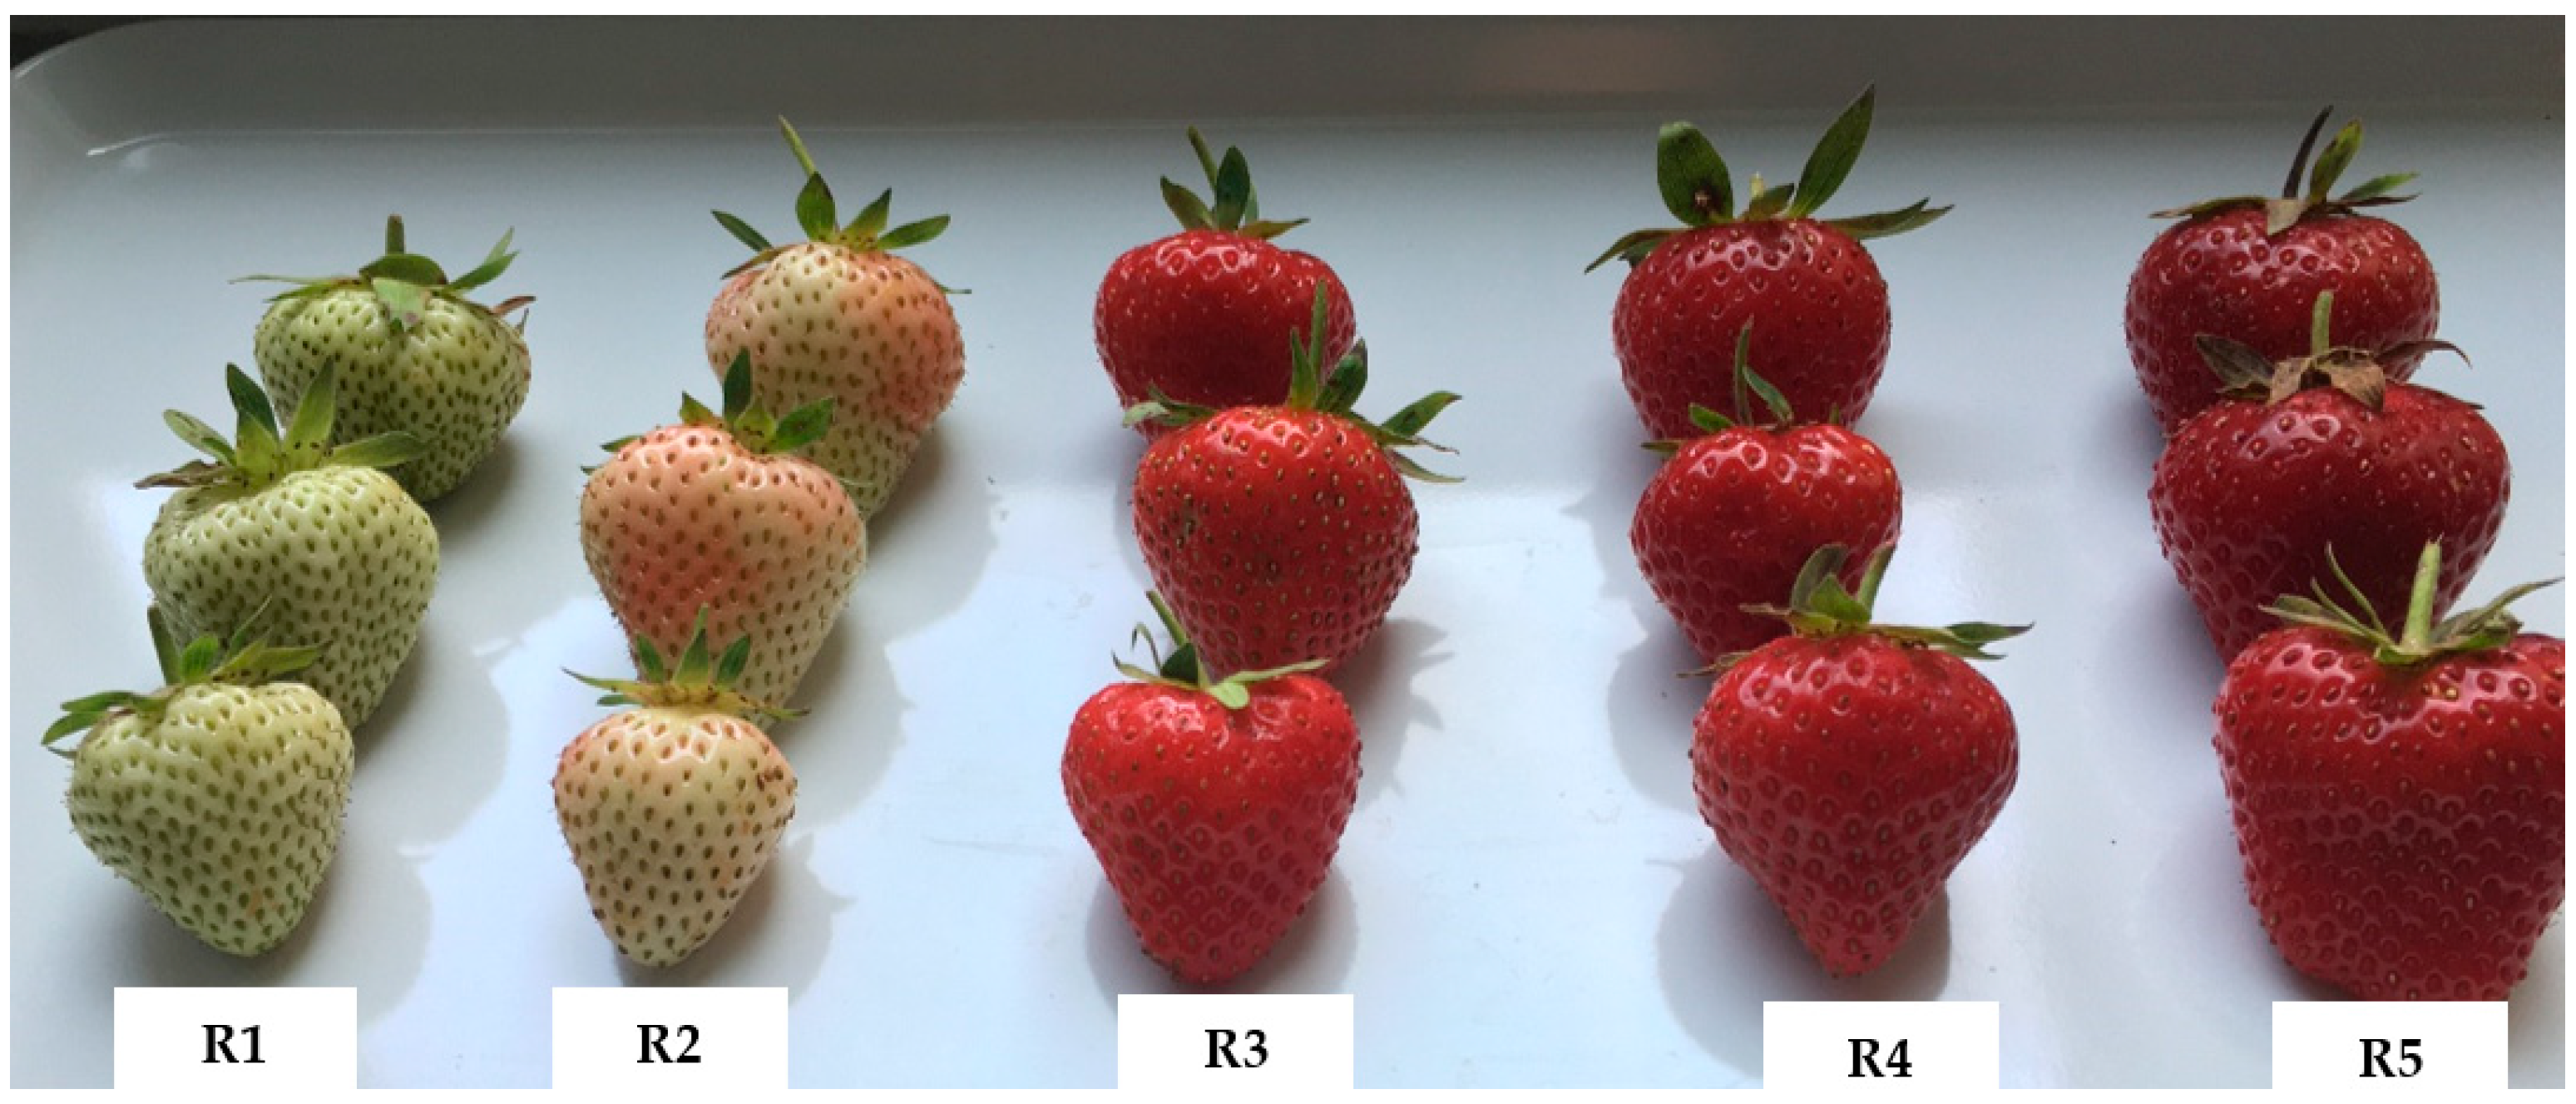
2.1. Colour
2.2. Phenolic Compounds
Anthocyanin Content
2.3. Enzyme Activity
2.4. Aroma Profile
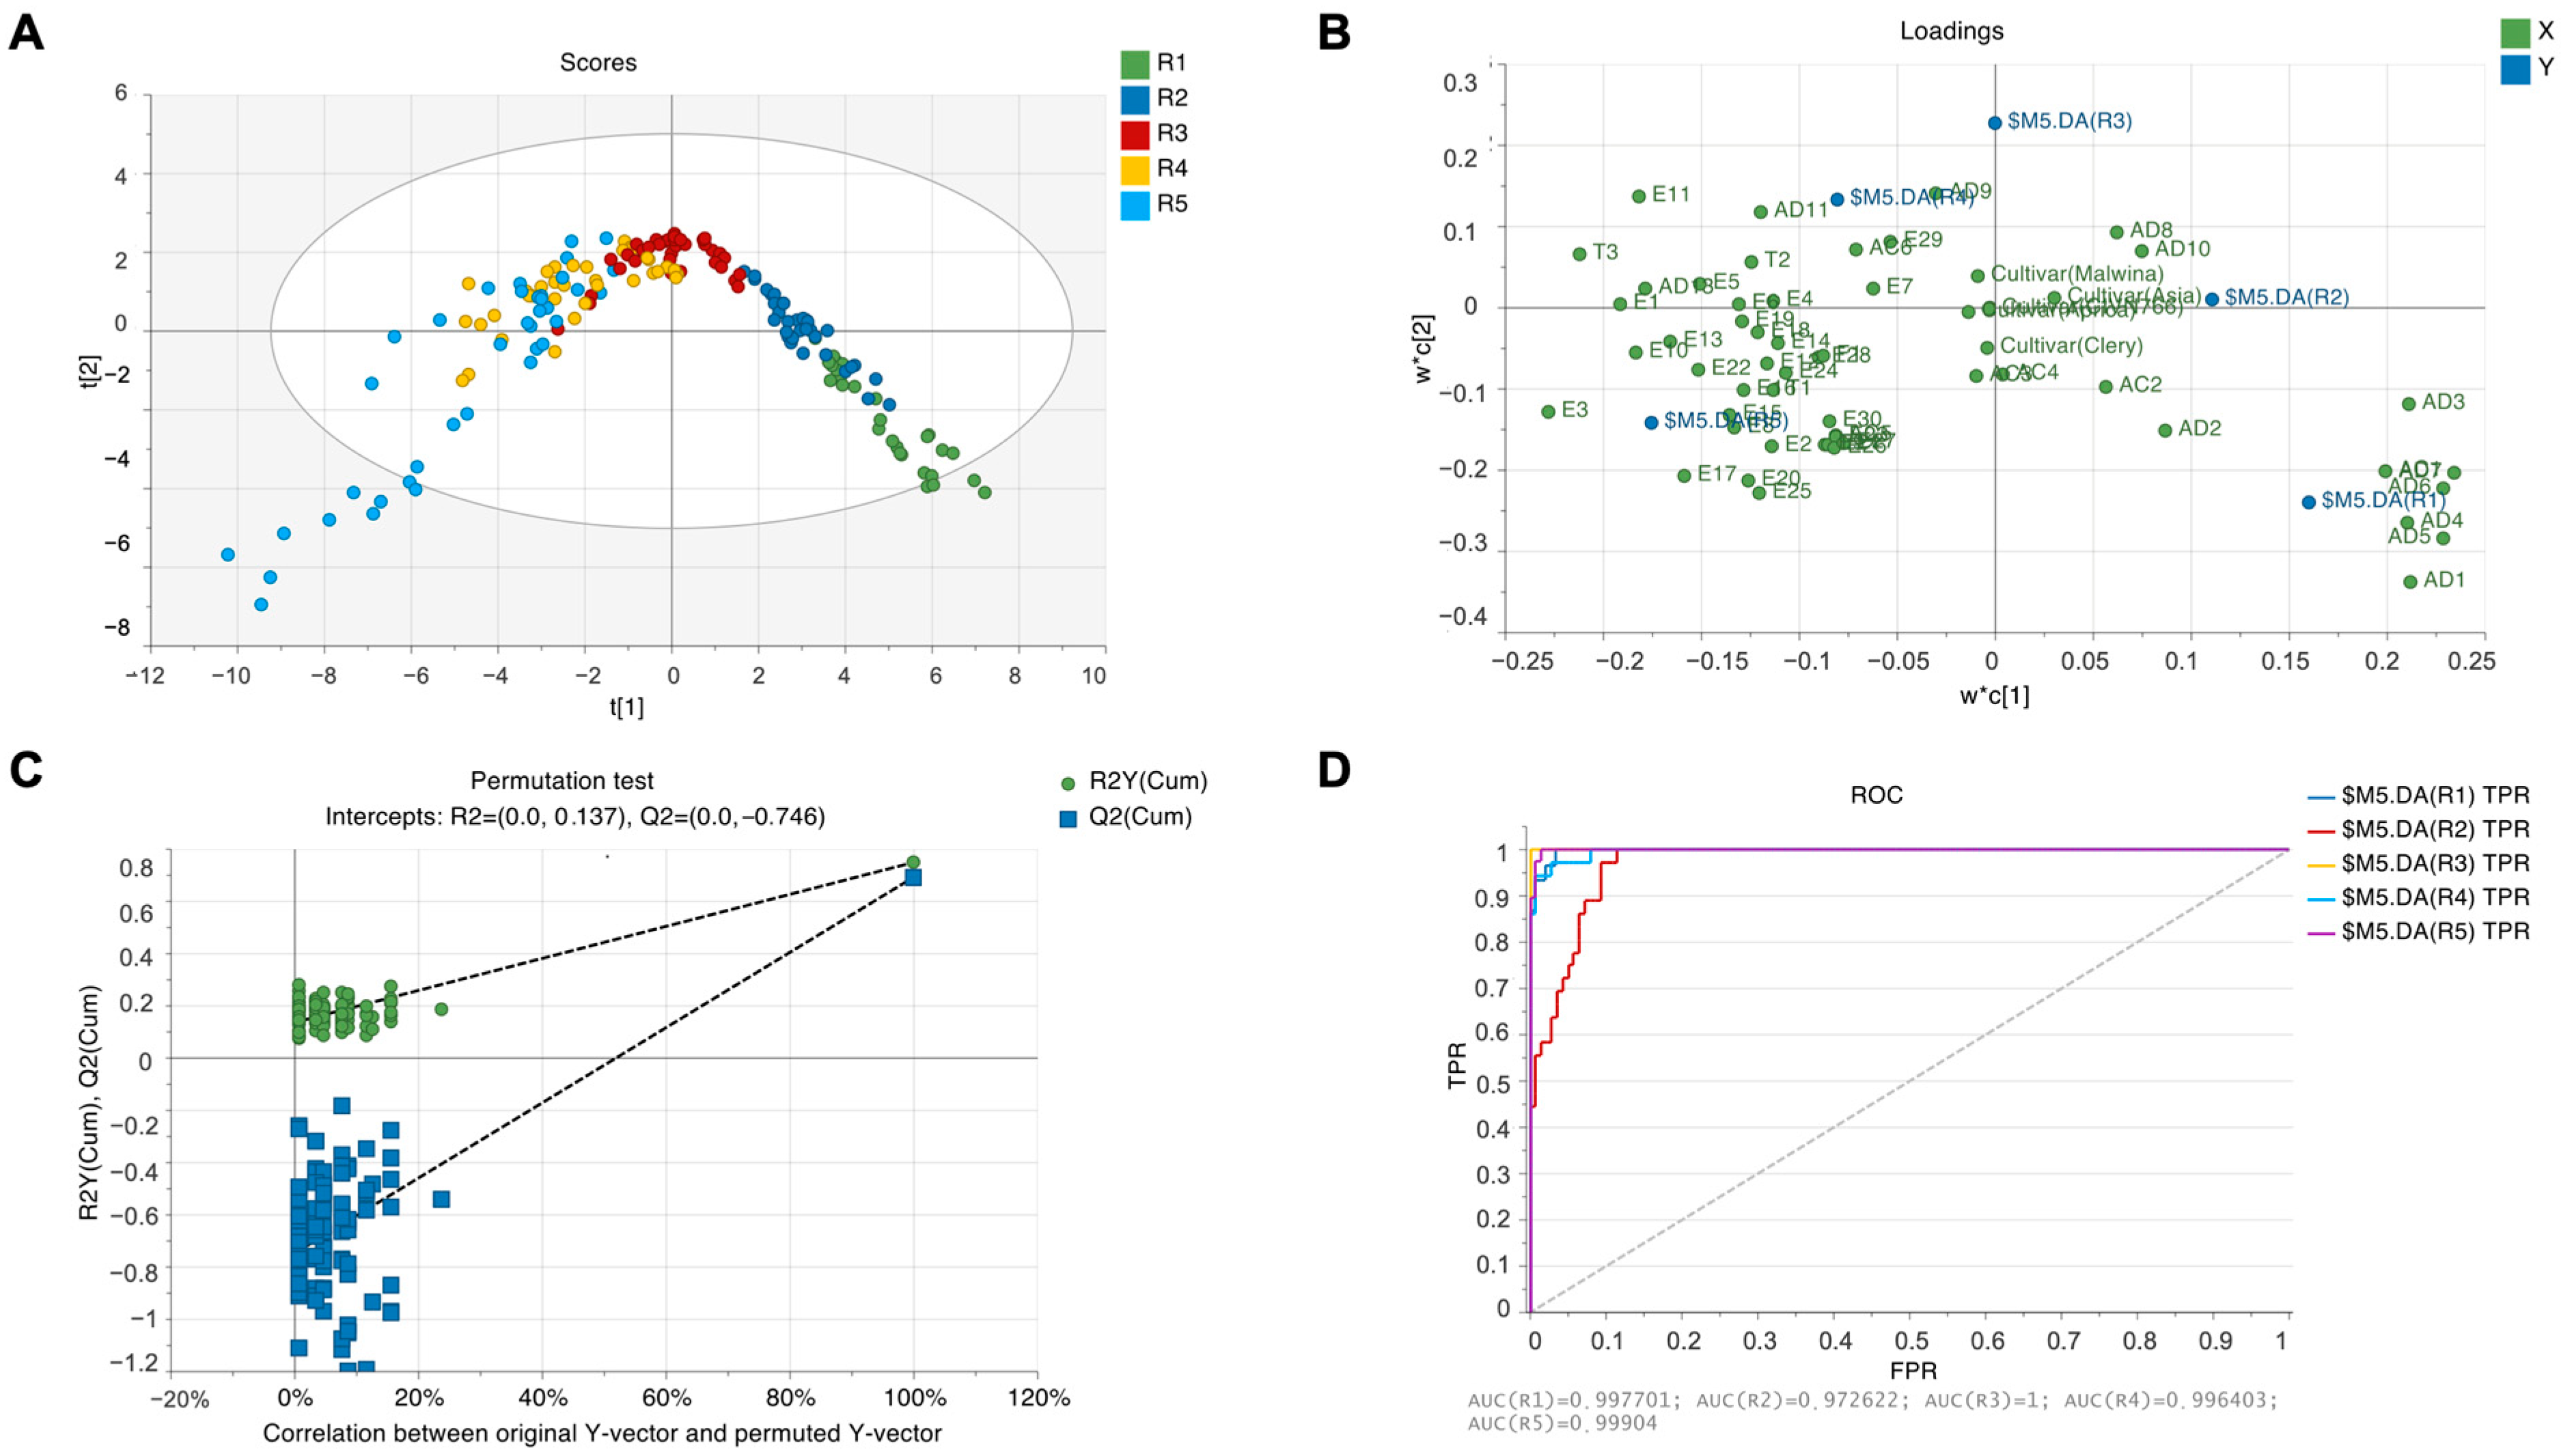
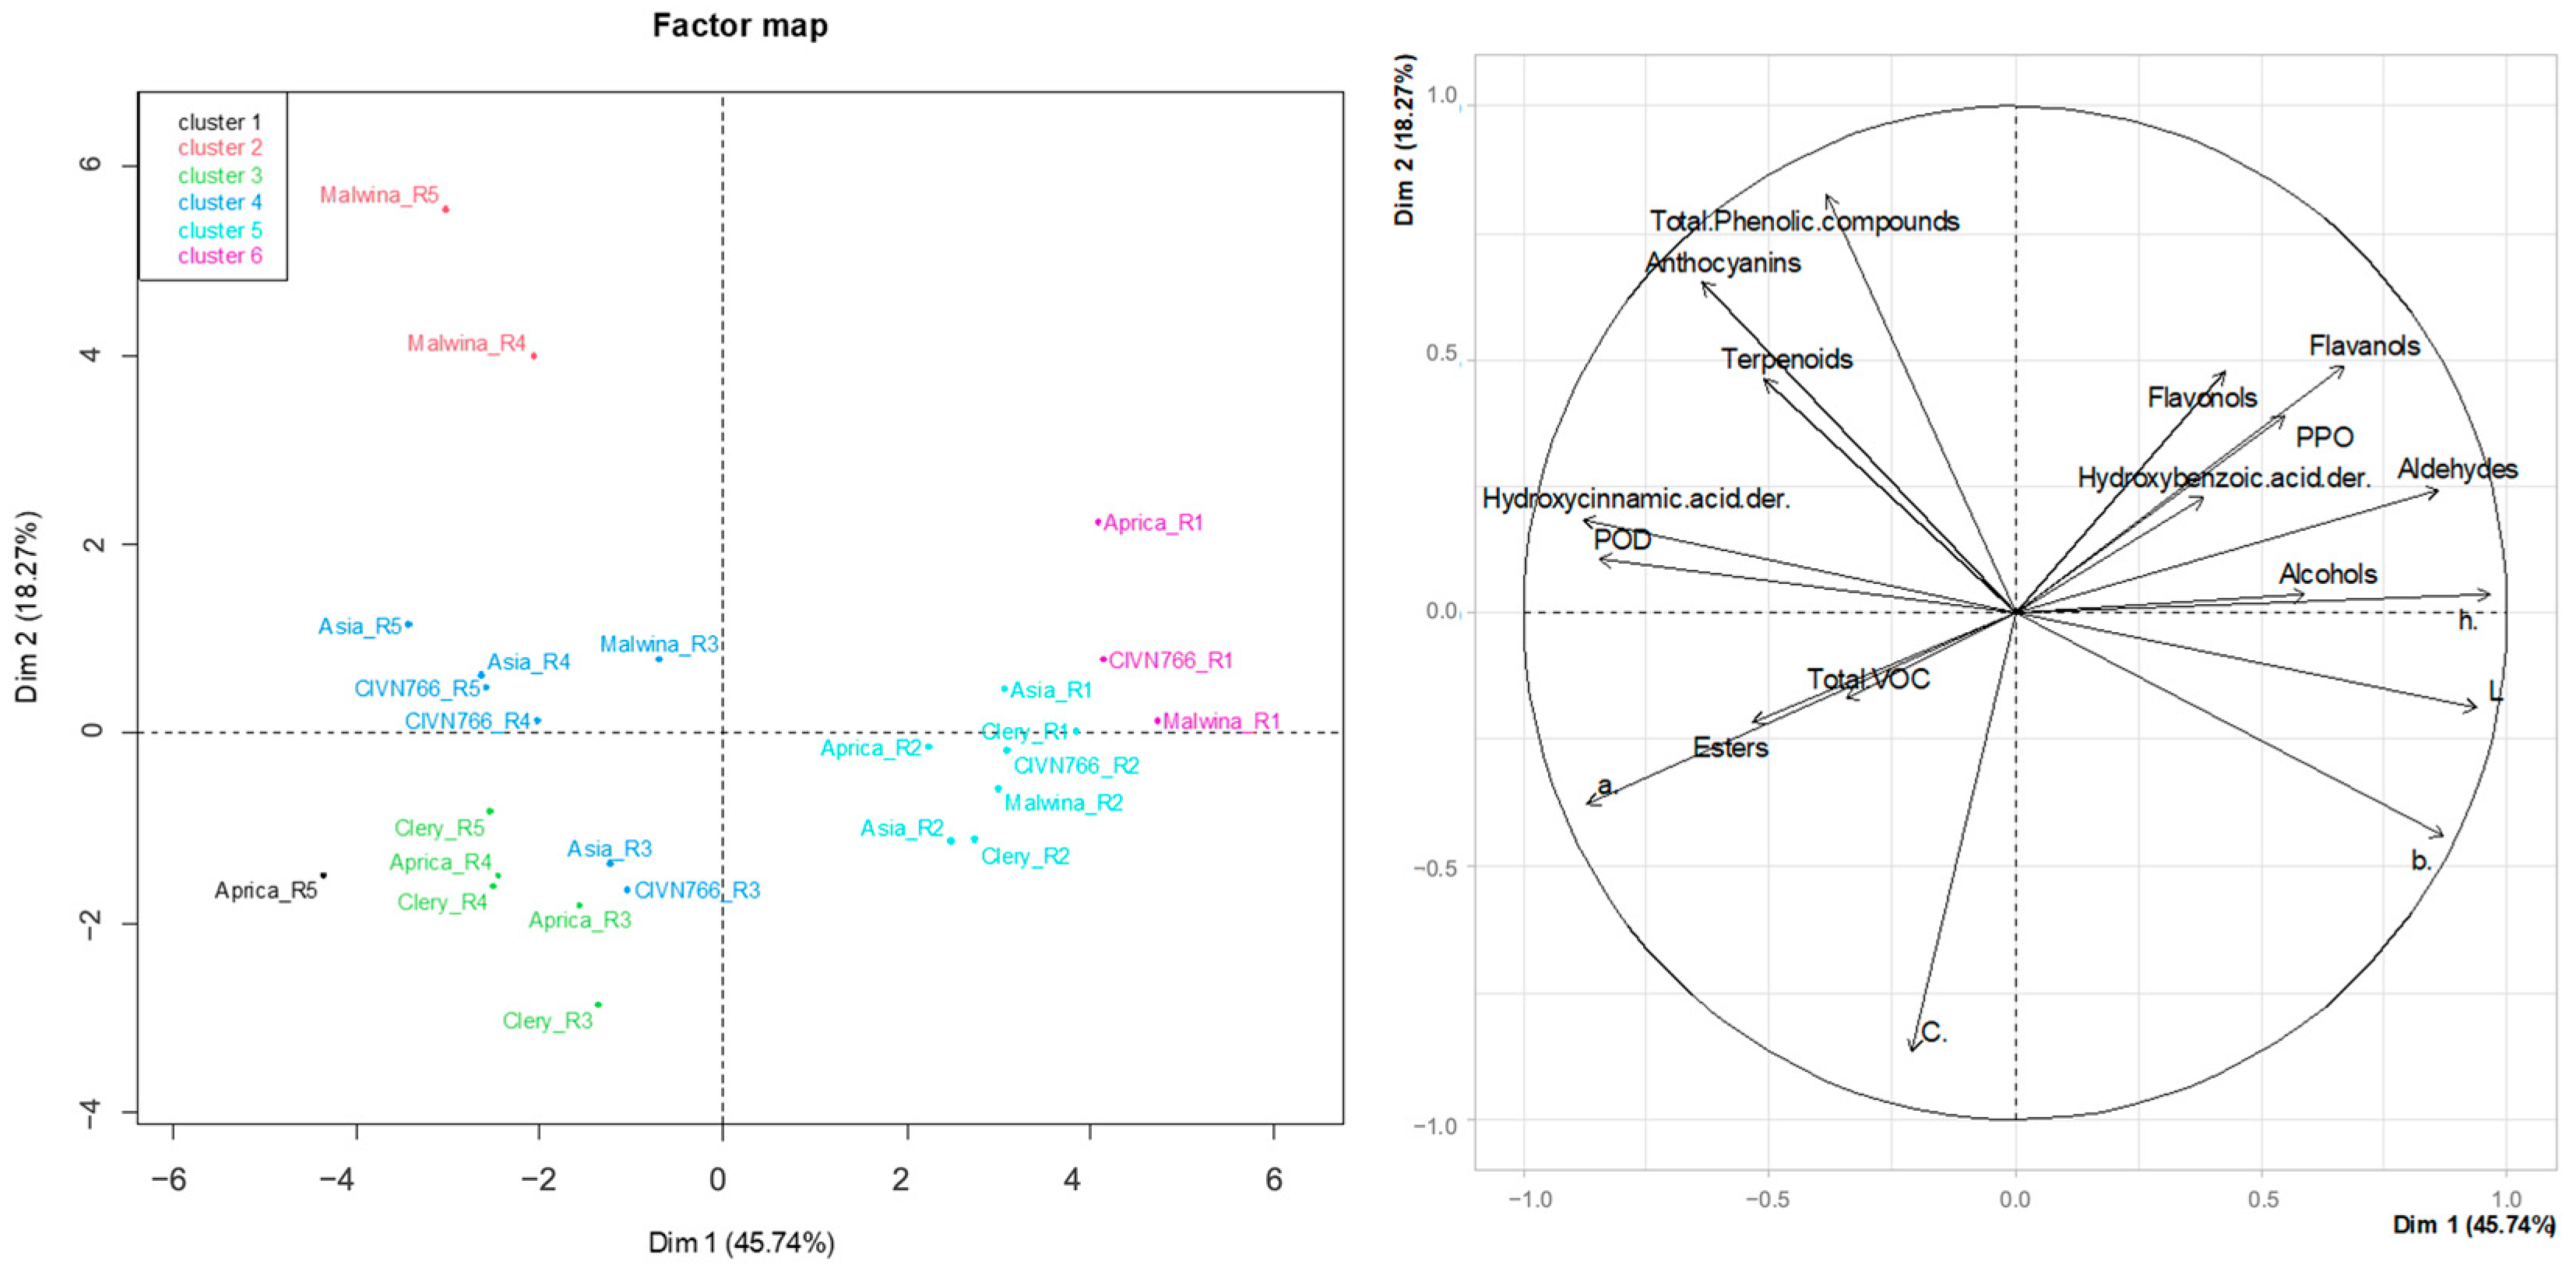
2.5. Principal Component Analysis (PCA)
3. Discussion
4. Materials and Methods
4.1. Plant Material
4.2. Colour
4.3. Dry Matter
4.4. Sample Preparation
4.5. Analysis of Anthocyanins and Other Phenolic Compounds
4.6. Enzyme Activity
4.7. Aroma Profile Analysis
4.8. Statistical Analysis
5. Conclusions
Supplementary Materials
Author Contributions
Funding
Data Availability Statement
Conflicts of Interest
References
- Haugeneder, A.; Trinkl, J.; Härtl, K.; Hoffmann, T.; Allwood, J.W.; Schwab, W. Answering Biological Questions by Analysis of the Strawberry Metabolome. Metabolomics 2018, 1, 145. [Google Scholar] [CrossRef]
- Pillet, J.; Folta, K.M. Pigments in Strawberry. In Pigments in Fruits and Vegetables; Springer: New York, NY, USA, 2015; pp. 205–216. [Google Scholar]
- Carbone, F.; Preuss, A.; De Vos, R.C.H.; D’Amico, E.; Perrotta, G.; Bovy, A.G.; Martens, S.; Rosati, C. Developmental, Genetic and Environmental Factors Affect the Expression of Flavonoid Genes, Enzymes and Metabolites in Strawberry Fruits. Plant Cell Environ. 2009, 32, 1117–1131. [Google Scholar] [CrossRef] [PubMed]
- Kosar, M.; Kafkas, E.; Paydas, S.; Baser, K.H.C. Phenolic Composition of Strawberry Genotypes at Different Maturation Stages. J. Agric. Food Chem. 2004, 52, 1586–1589. [Google Scholar] [CrossRef]
- Cassidy, A.; Mukamal, K.J.; Liu, L.; Franz, M.; Eliassen, A.H.; Rimm, E.B. High Anthocyanin Intake Is Associated with a Reduced Risk of Myocardial Infarction in Young and Middle-Aged Women. Circulation 2013, 127, 188–196. [Google Scholar] [CrossRef]
- da Silva Pinto, M.; de Carvalho, J.E.; Lajolo, F.M.; Genovese, M.I.; Shetty, K. Evaluation of Antiproliferative, Anti-Type 2 Diabetes, and Antihypertension Potentials of Ellagitannins from Strawberries (Fragaria × Ananassa Duch.) Using In Vitro Models. J. Med. Food 2010, 13, 1027–1035. [Google Scholar] [CrossRef]
- Afrin, S.; Gasparrini, M.; Forbes-Hernandez, T.Y.; Reboredo-Rodriguez, P.; Mezzetti, B.; Varela-López, A.; Giampieri, F.; Battino, M. Promising Health Benefits of the Strawberry: A Focus on Clinical Studies. J. Agric. Food Chem. 2016, 64, 4435–4449. [Google Scholar] [CrossRef]
- Agarwal, P.; Holland, T.M.; James, B.D.; Cherian, L.J.; Aggarwal, N.T.; Leurgans, S.E.; Bennett, D.A.; Schneider, J.A. Pelargonidin and Berry Intake Association with Alzheimer’s Disease Neuropathology: A Community-Based Study. J. Alzheimers Dis. 2022, 88, 653–661. [Google Scholar] [CrossRef]
- Yan, J.W.; Ban, Z.J.; Lu, H.Y.; Li, D.; Poverenov, E.; Luo, Z.S.; Li, L. The Aroma Volatile Repertoire in Strawberry Fruit: A Review. J. Sci. Food Agric. 2018, 98, 4395–4402. [Google Scholar] [CrossRef]
- Ulrich, D.; Kecke, S.; Olbricht, K. What Do We Know about the Chemistry of Strawberry Aroma? J. Agric. Food Chem. 2018, 66, 3291–3301. [Google Scholar] [CrossRef]
- Pérez, A.G.; Sanz, C. Strawberry Flavor. In Handbook of Fruit and Vegetable Flavors; John Wiley & Sons Inc.: Hoboken, NJ, USA, 2010; pp. 431–449. [Google Scholar] [CrossRef]
- Jetti, R.R.; Yang, E.; Kurnianta, A.; Finn, C.; Qian, M.C. Quantification of Selected Aroma-Active Compounds in Strawberries by Headspace Solid-Phase Microextraction Gas Chromatography and Correlation with Sensory Descriptive Analysis. J. Food Sci. 2007, 72, S487–S496. [Google Scholar] [CrossRef] [PubMed]
- Vandendriessche, T.; Vermeir, S.; Mayayo Martinez, C.; Hendrickx, Y.; Lammertyn, J.; Nicolaï, B.M.; Hertog, M.L.A.T.M. Effect of Ripening and Inter-Cultivar Differences on Strawberry Quality. LWT-Food Sci. Technol. 2013, 52, 62–70. [Google Scholar] [CrossRef]
- Zhang, J.; Wang, X.; Yu, O.; Tang, J.; Gu, X.; Wan, X.; Fang, C. Metabolic Profiling of Strawberry (Fragaria × Ananassa Duch.) during Fruit Development and Maturation. J. Exp. Bot. 2011, 62, 1103–1118. [Google Scholar] [CrossRef]
- Mahmood, T.; Anwar, F.; Abbas, M.; Saari, N. Effect of Maturity on Phenolics (Phenolic Acids and Flavonoids) Profile of Strawberry Cultivars and Mulberry Species from Pakistan. Int. J. Mol. Sci. 2012, 13, 4591–4607. [Google Scholar] [CrossRef]
- Williner, M.R.; Pirovani, M.E.; Güemes, D.R. Ellagic Acid Content in Strawberries of Different Cultivars and Ripening Stages. J. Sci. Food Agric. 2003, 83, 842–845. [Google Scholar] [CrossRef]
- Aaby, K.; Mazur, S.; Nes, A.; Skrede, G. Phenolic Compounds in Strawberry (Fragaria × Ananassa Duch.) Fruits: Composition in 27 Cultivars and Changes during Ripening. Food Chem. 2012, 132, 86–97. [Google Scholar] [CrossRef]
- Cozzolino, R.; Pace, B.; Palumbo, M.; Laurino, C.; Picariello, G.; Siano, F.; De Giulio, B.; Pelosi, S.; Cefola, M. Profiles of Volatile and Phenolic Compounds as Markers of Ripening Stage in Candonga Strawberries. Foods 2021, 10, 3102. [Google Scholar] [CrossRef]
- Xiao, W.; Liu, A.; Lai, W.; Zha, Y.; Li, X.; Wang, J.; Yu, H.; Fang, X. Metabolomic and Transcriptomic Integration Reveals the Mechanism of Aroma Formation as Strawberries Naturally Turn Colors While Ripening. SSRN 2023. preprint. [Google Scholar] [CrossRef]
- Gil i Cortiella, M.; Vasquez-Rojas, C.; Castro, R.I.; Muñoz-Vera, M.; Parra-Palma, C.; Méndez-Yáñez, Á.; Sáez, D.; Ramos, P.; Morales-Quintana, L. Evolution of the Fruit Ripening and Development of the Strawberry ‘Aroma’; through Transcriptional, Physiological and Chemicals Analysis. J. Food Meas. Charact. 2024, 1–16. [Google Scholar] [CrossRef]
- Padilla-Jiménez, S.M.; Angoa-Pérez, M.V.; Mena-Violante, H.G.; Oyoque-Salcedo, G.; Montañez-Soto, J.L.; Oregel-Zamudio, E. Identification of Organic Volatile Markers Associated with Aroma during Maturation of Strawberry Fruits. Molecules 2021, 26, 504. [Google Scholar] [CrossRef]
- Olbricht, K.; Ulrich, D. Domestication Effects in European Breeding History of Strawberry Demonstrated by Aroma Compound Pattern. Acta Hortic. 2017, 1156, 61–68. [Google Scholar] [CrossRef]
- Milosavljević, D.M.; Maksimović, V.M.; Milivojević, J.M.; Nakarada, Đ.J.; Mojović, M.D.; Dragišić Maksimović, J.J. Rich in Phenolics—Strong Antioxidant Fruit? Comparative Study of 25 Strawberry Cultivars. Plants 2022, 11, 3566. [Google Scholar] [CrossRef]
- Mazzoni, L.; Di Vittori, L.; Balducci, F.; Forbes-Hernández, T.Y.; Giampieri, F.; Battino, M.; Mezzetti, B.; Capocasa, F. Sensorial and Nutritional Quality of Inter and Intra—Specific Strawberry Genotypes Selected in Resilient Conditions. Sci. Hortic. 2020, 261, 108945. [Google Scholar] [CrossRef]
- Fecka, I.; Nowicka, A.; Kucharska, A.Z.; Sokół-Łętowska, A. The Effect of Strawberry Ripeness on the Content of Polyphenols, Cinnamates, L-Ascorbic and Carboxylic Acids. J. Food Compos. Anal. 2021, 95, 103669. [Google Scholar] [CrossRef]
- Fait, A.; Hanhineva, K.; Beleggia, R.; Dai, N.; Rogachev, I.; Nikiforova, V.J.; Fernie, A.R.; Aharoni, A. Reconfiguration of the Achene and Receptacle Metabolic Networks during Strawberry Fruit Development. Plant Physiol. 2008, 148, 730–750. [Google Scholar] [CrossRef]
- Aaby, K.; Remberg, S.F. Strawberry Phenolics and Impact of Ripening. In Processing and Impact on Active Components in Food; Elsevier: Amsterdam, The Netherlands, 2015; pp. 157–164. [Google Scholar]
- Lunkenbein, S.; Bellido, M.; Aharoni, A.; Salentijn, E.M.J.; Kaldenhoff, R.; Coiner, H.A.; Muñoz-Blanco, J.; Schwab, W. Cinnamate Metabolism in Ripening Fruit. Characterization of a UDP-Glucose:Cinnamate Glucosyltransferase from Strawberry. Plant Physiol. 2006, 140, 1047–1058. [Google Scholar] [CrossRef]
- Simkova, K.; Veberic, R.; Hudina, M.; Grohar, M.C.; Pelacci, M.; Smrke, T.; Ivancic, T.; Cvelbar Weber, N.; Jakopic, J. Non-Destructive and Destructive Physical Measurements as Indicators of Sugar and Organic Acid Contents in Strawberry Fruit during Ripening. Sci. Hortic. 2024, 327, 112843. [Google Scholar] [CrossRef]
- Parra-Palma, C.; Morales-Quintana, L.; Ramos, P. Phenolic Content, Color Development, and Pigment−Related Gene Expression: A Comparative Analysis in Different Cultivars of Strawberry during the Ripening Process. Agronomy 2020, 10, 588. [Google Scholar] [CrossRef]
- Hernanz, D.; Recamales, Á.F.; Meléndez-Martínez, A.J.; González-Miret, M.L.; Heredia, F.J. Multivariate Statistical Analysis of the Color—Anthocyanin Relationships in Different Soilless-Grown Strawberry Genotypes. J. Agric. Food Chem. 2008, 56, 2735–2741. [Google Scholar] [CrossRef]
- Chisari, M.; Barbagallo, R.N.; Spagna, G. Characterization of Polyphenol Oxidase and Peroxidase and Influence on Browning of Cold Stored Strawberry Fruit. J. Agric. Food Chem. 2007, 55, 3469–3476. [Google Scholar] [CrossRef]
- López, A.P.; Gochicoa, M.T.N.; Franco, A.R. Activities of Antioxidant Enzymes during Strawberry Fruit Development and Ripening. Biol. Plant 2010, 54, 349–352. [Google Scholar] [CrossRef]
- De Los, M.; Serradell, A.; Rozenfeld, P.A.; Martínez, G.A.; Civello, P.M.; Chaves, A.R.; Añón, M.C. Polyphenoloxidase Activity from Strawberry Fruit (Fragaria Ananassa, Duch., Cv Selva): Characterisation and Partial Purification. J. Sci. Food Agric. 2000, 80, 1421–1427. [Google Scholar] [CrossRef]
- Jia, H.; Zhao, P.; Wang, B.; Tariq, P.; Zhao, F.; Zhao, M.; Wang, Q.; Yang, T.; Fang, J. Overexpression of Polyphenol Oxidase Gene in Strawberry Fruit Delays the Fungus Infection Process. Plant Mol. Biol. Rep. 2016, 34, 592–606. [Google Scholar] [CrossRef]
- López-Serrano, M.; Ros Barceló, A. Histochemical Localization and Developmental Expression of Peroxidase and Polyphenol Oxidase in Strawberries. J. Am. Soc. Hortic. Sci. 2001, 126, 27–32. [Google Scholar] [CrossRef]
- Fan, Z.; Hasing, T.; Johnson, T.S.; Garner, D.M.; Schwieterman, M.L.; Barbey, C.R.; Colquhoun, T.A.; Sims, C.A.; Resende, M.F.R.; Whitaker, V.M. Strawberry Sweetness and Consumer Preference Are Enhanced by Specific Volatile Compounds. Hortic. Res. 2021, 8, 66. [Google Scholar] [CrossRef] [PubMed]
- Ozcan, G.; Barringer, S. Effect of Enzymes on Strawberry Volatiles during Storage, at Different Ripeness Level, in Different Cultivars, and during Eating. J. Food Sci. 2011, 76, C324–C333. [Google Scholar] [CrossRef] [PubMed]
- Song, J.; Forney, C.F.; Song, J.; Forney, C.F. Flavour Volatile Production and Regulation in Fruit. Can. J. Plant Sci. 2011, 88, 537–550. [Google Scholar] [CrossRef]
- Lavid, N.; Schwab, W.; Kafkas, E.; Koch-Dean, M.; Bar, E.; Larkov, O.; Ravid, U.; Lewinsohn, E. Aroma Biosynthesis in Strawberry: S-Adenosylmethionine:Furaneol O-Methyltransferase Activity in Ripening Fruits. J. Agric. Food Chem. 2002, 50, 4025–4030. [Google Scholar] [CrossRef] [PubMed]
- Simkova, K.; Veberic, R.; Hudina, M.; Grohar, M.C.; Ivancic, T.; Smrke, T.; Pelacci, M.; Jakopic, J. Variability in ‘Capri’ Everbearing Strawberry Quality during a Harvest Season. Foods 2023, 12, 1349. [Google Scholar] [CrossRef] [PubMed]
- Kruger, N.J. The Bradford Method for Protein Quantitation. Methods Mol. Biol. 1994, 32, 9–15. [Google Scholar] [CrossRef] [PubMed]
- Baluszynska, U.B.; Licznar-Malanczuk, M.; Medic, A.; Veberic, R.; Grohar, M.C. Influence of Living Mulch and Nitrogen Dose on Yield and Fruit Quality Parameters of Malus domestica Borkh. Cv. ‘Sampion’. Agriculture 2023, 13, 921. [Google Scholar] [CrossRef]
- Garg, N.; Sethupathy, A.; Tuwani, R.; NK, R.; Dokania, S.; Iyer, A.; Gupta, A.; Agrawal, S.; Singh, N.; Shukla, S.; et al. FlavorDB: A Database of Flavor Molecules. Nucleic Acids Res. 2018, 46, D1210–D1216. [Google Scholar] [CrossRef] [PubMed]
- Acree, T.; Arn, H. Flavornet and Human Odor Space. Available online: https://www.flavornet.org/index.html (accessed on 6 April 2023).
- Lê, S.; Josse, J.; Husson, F. FactoMineR: An R Package for Multivariate Analysis. J. Stat. Softw. 2008, 25, 1–18. [Google Scholar] [CrossRef]

| Cultivar | Ripening Stage | Colour Parameters | ||||
|---|---|---|---|---|---|---|
| L* | a* | b* | C* | h° | ||
| ‘Aprica’ | Green (R1) | 53.7 ± 0.6 a | 1.9 ± 0.3 d | 30.9 ± 0.4 a | 30.9 ± 0.4 c | 86.5 ± 0.6 a |
| White (R2) | 56.5 ± 0.9 a | 9.7 ± 1.6 c | 27.4 ± 0.7 b | 29.7 ± 0.5 c | 70.5 ± 3.1 b | |
| Ripe (R3) | 34.9 ± 0.7 b | 38.6 ± 0.9 a | 26.6 ± 0.9 b | 46.9 ± 1.2 a | 34.5 ± 0.6 c | |
| Fully ripe (R4) | 32.6 ± 0.7 b | 36.9 ± 1.1 ab | 23.6 ± 0.9 c | 44.4 ± 1.1 a | 32.0 ± 0.7 cd | |
| Overripe (R5) | 28.3 ± 2.0 c | 34.3 ± 0.9 b | 19.4 ± 0.8 d | 39.5 ± 1.2 b | 29.3 ± 0.4 d | |
| ‘Asia’ | Green (R1) | 56.1 ± 0.6 b | 1.4 ± 0.3 c | 31.3 ± 0.6 a | 31.4 ± 0.6 bc | 88.0 ± 0.9 a |
| White (R2) | 62.2 ± 0.7 a | 3.4 ± 0.3 c | 28.4 ± 0.3 b | 28.6 ± 0.3 c | 84.5 ± 1.1 b | |
| Ripe (R3) | 33.2 ± 1.0 c | 33.2 ± 0.8 a | 24.4 ± 1.2 c | 40.7 ± 1.4 a | 36.0 ± 0.9 c | |
| Fully ripe (R4) | 29.2 ± 0.7 d | 28.6 ± 1.2 b | 17.7 ± 1.0 d | 33.7 ± 1.5 b | 31.5 ± 0.7 d | |
| Overripe (R5) | 27.3 ± 0.7 d | 26.8 ± 1.4 b | 15.3 ± 0.8 d | 30.3 ± 1.3 c | 30.3 ± 0.6 d | |
| ‘CIVN766’ | Green (R1) | 54.4 ± 0.8 b | 2.0 ± 0.4 c | 33.9 ± 0.6 a | 34.0 ± 0.6 bc | 86.7 ± 0.6 a |
| White (R2) | 60.7 ± 0.5 a | 2.2 ± 0.3 c | 32.2 ± 0.3 a | 32.3 ± 0.3 c | 86.1 ± 0.6 a | |
| Ripe (R3) | 33.4 ± 0.9 c | 35.6 ± 0.9 a | 24.2 ± 0.9 b | 43.5 ± 1.1 a | 35.8 ± 2.1 b | |
| Fully ripe (R4) | 29.2 ± 0.8 d | 30.8 ± 1.2 b | 18.4 ± 0.8 c | 35.9 ± 1.4 b | 30.8 ± 0.6 c | |
| Overripe (R5) | 29.5 ± 0.3 d | 30.7 ± 0.8 b | 17.2 ± 0.6 c | 35.1 ± 1.0 bc | 29.2 ± 0.4 c | |
| ‘Clery’ | Green (R1) | 59.8 ± 0.5 a | 1.3 ± 0.2 c | 32.8 ± 0.5 a | 32.8 ± 0.5 c | 87.8 ± 0.4 a |
| White (R2) | 57.7 ± 1.6 a | 13.6 ± 3.4 b | 30.1 ± 0.5 b | 34.8 ± 1.5 c | 68.1 ± 5.2 b | |
| Ripe (R3) | 35.2 ± 0.6 b | 38.3 ± 1.1 a | 28.9 ± 0.8 b | 48.9 ± 1.0 a | 36.2 ± 0.5 c | |
| Fully ripe (R4) | 30.2 ± 0.6 c | 32.7 ± 2.5 a | 21.1 ± 0.6 c | 41.3 ± 1.1 b | 30.7 ± 0.4 c | |
| Overripe (R5) | 30.2 ± 0.6 c | 33.5 ± 1.1 a | 19.1 ± 0.9 d | 38.6 ± 1.4 b | 29.6 ± 0.5 c | |
| ‘Malwina’ | Green (R1) | 54.7 ± 1.0 a | 1.9 ± 0.3 d | 35.5 ± 0.8 a | 35.5 ± 0.8 a | 86.9 ± 0.5 a |
| White (R2) | 52.5 ± 2.3 a | 12.4 ± 3.3 c | 30.6 ± 0.9 b | 34.9 ± 1.2 a | 69.5 ± 5.1 b | |
| Ripe (R3) | 29.9 ± 1.6 b | 28.0 ± 2.0 a | 20.4 ± 2.2 c | 34.8 ± 2.8 a | 33.6 ± 1.5 c | |
| Fully ripe (R4) | 22.3 ± 0.6 c | 20.7 ± 0.8 b | 11.9 ± 0.6 d | 23.9 ± 1.0 b | 29.8 ± 0.7 c | |
| Overripe (R5) | 22.0 ± 0.5 c | 15.2 ± 0.8 c | 10.0 ± 0.5 d | 17.6 ± 0.7 c | 33.6 ± 1.8 c | |
| Variance | Cultivar | 31.9 *** | 33.4 *** | 25.1 *** | 62.2 *** | 5.2 *** |
| Ripening stage | 1144.3 *** | 541.4 *** | 350.9 *** | 79.5 *** | 1158.3 *** | |
| Cultivar: Ripening stage | 4.9 *** | 9.8 *** | 11.5 *** | 19.0 *** | 5.2 *** | |
| Cultivar | Ripening Stage | Phenolic Compound Content (mg kg−1 Dry Weight) | |||||
|---|---|---|---|---|---|---|---|
| Anthocyanins | Hydroxycinnamic Acid Der. | Flavanols | Hydroxybenzoic Acid Der. | Flavonols | Total | ||
| ‘Aprica’ | Green (R1) | nd | 147 ± 9 d | 6961 ± 305 a | 5949 ± 293 a | 461 ± 21 a | 13,519 ± 606 a |
| White (R2) | 5 ± 1 c | 269 ± 18 c | 4219 ± 289 b | 2024 ± 129 b | 429 ± 25 a | 6946 ± 449 b | |
| Ripe (R3) | 3372 ± 234 b | 777 ± 58 b | 1346 ± 64 c | 672 ± 46 c | 466 ± 38 a | 6631 ± 231 b | |
| Fully ripe (R4) | 4462 ± 290 a | 797 ± 33 b | 1343 ± 52 c | 608 ± 35 c | 400 ± 43 a | 7610 ± 222 b | |
| Overripe (R5) | 4053 ± 457 ab | 1233 ± 49 a | 1522 ± 73 c | 951 ± 60 c | 290 ± 20 b | 8048 ± 615 b | |
| ‘Asia’ | Green (R1) | nd | 79 ± 1 e | 2627 ± 90 a | 1673 ± 65 a | 585 ± 48 a | 4965 ± 143 d |
| White (R2) | 13 ± 1 c | 266 ± 17 d | 1754 ± 56 b | 786 ± 24 c | 226 ± 11 c | 3044 ± 66 e | |
| Ripe (R3) | 3307 ± 240 b | 938 ± 27 c | 1035 ± 47 d | 456 ± 25 d | 253 ± 6 c | 5988 ± 293 c | |
| Fully ripe (R4) | 5492 ± 319 a | 1330 ± 75 b | 1142 ± 34 cd | 699 ± 33 c | 284 ± 5 bc | 8945 ± 288 b | |
| Overripe (R5) | 5220 ± 286 a | 1976 ± 101 a | 1279 ± 53 c | 1024 ± 22 b | 338 ± 14 b | 9836 ± 400 a | |
| ‘CIVN766’ | Green (R1) | 28 ± 4 c | 114 ± 4 c | 3389 ± 192 a | 5267 ± 203 a | 685 ± 64 a | 9485 ± 275 b |
| White (R2) | 32 ± 4 c | 193 ± 11 c | 3094 ± 101 a | 2370 ± 102 c | 510 ± 19 b | 6199 ± 182 c | |
| Ripe (R3) | 2129 ± 267 b | 994 ± 42 b | 1172 ± 102 c | 1913 ± 111 c | 406 ± 25 bc | 6614 ± 502 c | |
| Fully ripe (R4) | 3314 ± 266 a | 1975 ± 107 a | 1462 ± 174 bc | 3695 ± 273 b | 403 ± 45 bc | 10,849 ± 727 b | |
| Overripe (R5) | 3496 ± 283 a | 2169 ± 91 a | 1643 ± 131 b | 5085 ± 345 a | 328 ± 18 c | 12,721 ± 637 a | |
| ‘Clery’ | Green (R1) | nd | 110 ± 4 e | 1729 ± 45 b | 1745 ± 73 a | 395 ± 30 a | 3978 ± 127 d |
| White (R2) | 14 ± 1 c | 403 ± 25 d | 2464 ± 81 a | 688 ± 30 d | 284 ± 15 b | 3854 ± 137 d | |
| Ripe (R3) | 3460 ± 133 b | 1057 ± 38 c | 138 ± 15 d | 770 ± 12 cd | 292 ± 15 b | 5717 ± 106 c | |
| Fully ripe (R4) | 4142 ± 408 b | 1521 ± 60 b | 265 ± 25 cd | 924 ± 87 c | 298 ± 15 b | 7150 ± 474 b | |
| Overripe (R5) | 5074 ± 292 a | 1805 ± 75 a | 290 ± 32 c | 1138 ± 53 b | 389 ± 17 a | 8696 ± 304 a | |
| ‘Malwina’ | Green (R1) | 5 ± 1 d | 208 ± 11 d | 5108 ± 131 a | 2701 ± 30 a | 540 ± 36 ab | 8563 ± 84 c |
| White (R2) | 79 ± 6 d | 329 ± 24 d | 2786 ± 89 bc | 694 ± 63 b | 598 ± 36 a | 4481 ± 182 d | |
| Ripe (R3) | 4716 ± 469 c | 985 ± 80 c | 1958 ± 152 d | 700 ± 66 b | 549 ± 30 ab | 8909 ± 496 c | |
| Fully ripe (R4) | 10,662 ± 449 b | 1246 ± 61 b | 2423 ± 115 cd | 738 ± 25 b | 597 ± 28 a | 15,664 ± 446 b | |
| Overripe (R5) | 13,190 ± 964 a | 1877 ± 111 a | 3223 ± 283 b | 757 ± 27 b | 498 ± 20 b | 19,546 ± 1252 a | |
| Variance | Cultivar | 112.7 *** | 42.0 *** | 249.7 *** | 401.8 *** | 58.2 *** | 123.7 *** |
| Ripening stage | 345.0 *** | 706.7 *** | 406.0 *** | 289.0 *** | 28.5 *** | 164.8 *** | |
| Cultivar:Ripening stage | 35.4 *** | 13.7 *** | 44.4 *** | 55.7 *** | 8.4 *** | 31.5 *** | |
| Cultivar | Ripening Stage | Anthocyanin Content (mg kg−1 Dry Weight) | |||||||||
|---|---|---|---|---|---|---|---|---|---|---|---|
| Cy-3-O-gal | Cy-3-O-glc | Plg-3-O-glc | Plg-3-O-rut | Plg-3-O-ara | Cy-3-(6″malonyl)glc | Plg Der. | Plg-3-(6″malonyl)glc | 5-Pyranoplg-3-glc | Plg-3-O-acetylglc | ||
| ‘Aprica’ | Green (R1) | nd | nd | nd | nd | nd | nd | nd | nd | nd | nd |
| White (R2) | nd | nd | 5 ± 1 c | nd | nd | nd | nd | nd | nd | nd | |
| Ripe (R3) | 119 ± 10 a | 21 ± 3 a | 2389 ± 186 b | 110 ± 10 b | nd | 15 ± 1 b | 5 ± 1 b | 713 ± 40 b | nd | nd | |
| Fully ripe (R4) | 131 ± 12 a | 29 ± 3 a | 3175 ± 266 a | 142 ± 17 ab | nd | 19 ± 2 ab | 9 ± 2 ab | 955 ± 31 a | nd | nd | |
| Overripe (R5) | 130 ± 15 a | 22 ± 5 a | 2724 ± 356 ab | 192 ± 23 a | nd | 25 ± 3 a | 18 ± 5 a | 942 ± 75 a | nd | nd | |
| ‘Asia’ | Green (R1) | nd | nd | nd | nd | nd | nd | nd | nd | nd | nd |
| White (R2) | nd | nd | 13 ± 1 c | nd | nd | nd | nd | nd | nd | nd | |
| Ripe (R3) | 48 ± 3 b | 19 ± 2 b | 3008 ± 226 b | 155 ± 9 b | nd | nd | nd | 4 ± 1 c | nd | 73 ± 8 a | |
| Fully ripe (R4) | 115 ± 9 a | 33 ± 3 a | 4973 ± 289 a | 272 ± 31 a | nd | nd | nd | 11 ± 1 b | nd | 87 ± 7 a | |
| Overripe (R5) | 120 ± 14 a | 36 ± 2 a | 4688 ± 259 a | 266 ± 16 a | nd | nd | nd | 17 ± 2 a | nd | 92 ± 10 a | |
| ‘CIVN766’ | Green (R1) | 5 ± 1 b | nd | 23 ± 3 c | nd | nd | nd | nd | nd | nd | nd |
| White (R2) | 10 ± 1 b | nd | 19 ± 3 c | nd | nd | 3 ± 0 b | nd | nd | nd | nd | |
| Ripe (R3) | 77 ± 9 a | 15 ± 2 a | 1444 ± 220 b | nd | nd | 16 ± 2 a | 4 ± 1 b | 572 ± 43 b | nd | nd | |
| Fully ripe (R4) | 83 ± 10 a | 15 ± 2 a | 2320 ± 215 a | nd | nd | 19 ± 3 a | 10 ± 1 a | 868 ± 49 a | nd | nd | |
| Overripe (R5) | 70 ± 8 a | 14 ± 1 a | 2388 ± 220 a | nd | nd | 18 ± 2 a | 10 ± 2 a | 997 ± 58 a | nd | nd | |
| ‘Clery’ | Green (R1) | nd | nd | nd | nd | nd | nd | nd | nd | nd | nd |
| White (R2) | 7 ± 0 b | nd | 7 ± 1 c | nd | nd | nd | nd | nd | nd | nd | |
| Ripe (R3) | 109 ± 8 a | 20 ± 1 b | 2557 ± 96 b | 114 ± 9 b | nd | 7 ± 1 b | 5 ± 1 b | 648 ± 30 b | nd | nd | |
| Fully ripe (R4) | 109 ± 7 a | 26 ± 2 ab | 3153 ± 338 ab | 132 ± 15 ab | nd | 9 ± 1 b | 9 ± 1 b | 704 ± 62 b | nd | nd | |
| Overripe (R5) | 121 ± 18 a | 32 ± 4 a | 3698 ± 251 a | 169 ± 14 a | nd | 19 ± 2 a | 21 ± 4 a | 1013 ± 62 a | nd | nd | |
| ‘Malwina’ | Green (R1) | 4 ± 1 c | nd | 2 ± 0 d | nd | nd | nd | nd | nd | nd | nd |
| White (R2) | 9 ± 1 c | nd | 66 ± 6 d | nd | nd | 4 ± 1 c | nd | nd | nd | nd | |
| Ripe (R3) | 181 ± 20 b | 28 ± 4 c | 3966 ± 413 c | 195 ± 16 c | 10 ± 1 c | 9 ± 1 b | 3 ± 1 b | 314 ± 23 c | 6 ± 1 c | 5 ± 1 b | |
| Fully ripe (R4) | 279 ± 21 a | 55 ± 3 b | 9151 ± 389 b | 393 ± 30 b | 22 ± 1 b | 16 ± 2 a | 8 ± 1 b | 701 ± 27 b | 21 ± 1 b | 15 ± 0 a | |
| Overripe (R5) | 324 ± 33 a | 68 ± 5 a | 11,328 ± 880 a | 553 ± 41 a | 36 ± 4 a | 16 ± 2 a | 20 ± 3 a | 798 ± 24 a | 35 ± 2 a | 14 ± 0 a | |
| Variance | Cultivar | 62.2 *** | 54.5 *** | 131.0 *** | 81.1 *** | na | 11.9 *** | ns | 213.3 *** | na | 209.5 *** |
| Ripening stage | 111.2 *** | 27.9 *** | 294.5 *** | 50.2 *** | na | 34.8 *** | 32.2 *** | 67.5 *** | na | ns | |
| Cultivar:Ripening stage | 16.3 *** | 7.5 *** | 39.2 *** | 11.2 *** | na | 2.9 ** | ns | 7.4 *** | na | ns | |
| Cultivar | Ripening Stage | Enzyme Activity (A min−1 mg−1 Protein) | |
|---|---|---|---|
| POD | PPO | ||
| ‘Aprica’ | Green (R1) | 4.0 ± 0.2 c | 0.62 ± 0.05 a |
| White (R2) | 3.9 ± 0.1 c | 0.44 ± 0.02 b | |
| Ripe (R3) | 5.5 ± 0.2 b | 0.45 ± 0.02 b | |
| Fully ripe (R4) | 5.4 ± 0.1 b | 0.41 ± 0.03 b | |
| Overripe (R5) | 6.9 ± 0.4 a | 0.32 ± 0.02 c | |
| ‘Asia’ | Green (R1) | 3.1 ± 0.2 c | 0.72 ± 0.03 a |
| White (R2) | 3.8 ± 0.3 b | 0.67 ± 0.11 a | |
| Ripe (R3) | 4.5 ± 0.3 a | 0.57 ± 0.03 ab | |
| Fully ripe (R4) | 5.0 ± 0.2 a | 0.42 ± 0.02 bc | |
| Overripe (R5) | 5.2 ± 0.2 a | 0.34 ± 0.02 c | |
| ‘CIVN766’ | Green (R1) | 2.6 ± 0.3 d | 0.47 ± 0.02 a |
| White (R2) | 3.3 ± 0.2 c | 0.48 ± 0.02 a | |
| Ripe (R3) | 4.6 ± 0.2 b | 0.37 ± 0.02 b | |
| Fully ripe (R4) | 4.9 ± 0.2 b | 0.30 ± 0.02 b | |
| Overripe (R5) | 6.2 ± 0.1 a | 0.34 ± 0.03 b | |
| ‘Clery’ | Green (R1) | 2.2 ± 0.2 d | 0.96 ± 0.05 a |
| White (R2) | 2.6 ± 0.1 d | 0.68 ± 0.04 b | |
| Ripe (R3) | 3.1 ± 0.2 c | 0.36 ± 0.03 c | |
| Fully ripe (R4) | 4.1 ± 0.1 b | 0.33 ± 0.02 c | |
| Overripe (R5) | 4.9 ± 0.2 a | 0.27 ± 0.01 c | |
| ‘Malwina’ | Green (R1) | 2.8 ± 0.2 c | 0.47 ± 0.04 b |
| White (R2) | 3.0 ± 0.2 c | 0.63 ± 0.05 ab | |
| Ripe (R3) | 4.0 ± 0.3 b | 0.62 ± 0.07 ab | |
| Fully ripe (R4) | 5.0 ± 0.2 a | 0.66 ± 0.04 a | |
| Overripe (R5) | 5.3 ± 0.3 a | 0.72 ± 0.08 a | |
| Variance | Cultivar | 38.5 *** | 26.7 *** |
| Ripening stage | 134.2 *** | 40.2 *** | |
| Cultivar: Ripening stage | 2.2 * | 12.8 *** | |
| Cultivar | Ripening Stage | Content of Volatile Organic Compounds (µg g−1 Dry Weight) | |||||
|---|---|---|---|---|---|---|---|
| Esters | Aldehydes | Alcohols | Terpenoids | Furanones | Total | ||
| ‘Aprica’ | Green (R1) | nd | 64.0 ± 3.3 a | 0.85 ± 0.03 a | 0.11 ± 0.01 b | nd | 65.0 ± 3.3 c |
| White (R2) | nd | 36.8 ± 2.6 b | 0.43 ± 0.03 b | 0.14 ± 0.01 b | nd | 37.4 ± 2.6 d | |
| Ripe (R3) | 35.0 ± 1.1 c | 22.8 ± 1.4 c | 0.32 ± 0.04 b | 0.20 ± 0.02 b | nd | 58.3 ± 2.3 cd | |
| Fully ripe (R4) | 80.9 ± 5.6 b | 25.9 ± 1.0 c | 0.43 ± 0.03 b | 0.39 ± 0.04 a | nd | 107.5 ± 5.8 b | |
| Overripe (R5) | 143.1 ± 14.1 a | 15.3 ± 1.7 d | 0.36 ± 0.05 b | 0.47 ± 0.05 a | nd | 159.2 ± 15.7 a | |
| ‘Asia’ | Green (R1) | nd | 43.0 ± 2.7 a | 0.42 ± 0.04 a | nd | nd | 43.4 ± 2.7 b |
| White (R2) | 0.2 ± 0.0 d | 33.6 ± 2.5 b | 0.38 ± 0.03 a | 0.12 ± 0.02 b | nd | 34.3 ± 2.5 bc | |
| Ripe (R3) | 3.5 ± 0.3 c | 23.2 ± 2.7 c | 0.33 ± 0.03 a | 0.27 ± 0.04 b | nd | 27.3 ± 3.0 c | |
| Fully ripe (R4) | 16.5 ± 1.3 b | 24.9 ± 2.6 c | 0.39 ± 0.06 a | 0.78 ± 0.09 a | nd | 42.6 ± 3.7 b | |
| Overripe (R5) | 35.2 ± 2.1 a | 21.2 ± 3.2 c | 0.37 ± 0.03 a | 0.86 ± 0.07 a | nd | 57.6 ± 4.9 a | |
| ‘CIVN766’ | Green (R1) | 0.1 ± 0.0 c | 42.7 ± 1.9 a | 0.94 ± 0.07 a | nd | nd | 43.8 ± 2.0 a |
| White (R2) | 0.5 ± 0.1 c | 34.8 ± 2.1 b | 0.49 ± 0.04 b | nd | nd | 35.8 ± 2.2 b | |
| Ripe (R3) | 5.3 ± 0.4 b | 21.6 ± 1.5 c | 0.39 ± 0.05 b | 0.11 ± 0.01 b | nd | 27.3 ± 1.5 c | |
| Fully ripe (R4) | 14.3 ± 0.5 a | 20.3 ± 1.1 c | 0.47 ± 0.05 b | 0.20 ± 0.02 a | 0.149 ± 0.020 a | 35.4 ± 1.6 b | |
| Overripe (R5) | 15.8 ± 0.8 a | 14.6 ± 0.8 d | 0.43 ± 0.04 b | 0.15 ± 0.01 b | 0.154 ± 0.017 a | 31.1 ± 1.5 bc | |
| ‘Clery’ | Green (R1) | 0.2 ± 0.0 b | 43.4 ± 1.0 a | 0.79 ± 0.04 ab | nd | nd | 44.4 ± 1.0 b |
| White (R2) | 0.6 ± 0.0 b | 40.6 ± 2.6 a | 0.88 ± 0.14 a | nd | nd | 42.1 ± 2.7 b | |
| Ripe (R3) | 42.1 ± 4.0 a | 22.7 ± 0.9 b | 0.55 ± 0.06 bc | 0.24 ± 0.02 a | nd | 65.6 ± 4.7 a | |
| Fully ripe (R4) | 51.8 ± 5.1 a | 20.2 ± 1.6 b | 0.45 ± 0.04 c | 0.27 ± 0.02 a | nd | 72.7 ± 4.9 a | |
| Overripe (R5) | 53.5 ± 4.7 a | 19.4 ± 1.9 b | 0.96 ± 0.13 a | 0.29 ± 0.03 a | nd | 74.2 ± 4.5 a | |
| ‘Malwina’ | Green (R1) | nd | 73.2 ± 3.0 a | 1.12 ± 0.02 a | 0.09 ± 0.01 d | nd | 74.4 ± 3.0 a |
| White (R2) | 0.1 ± 0.0 d | 47.7 ± 3.5 b | 0.58 ± 0.06 b | 0.10 ± 0.02 d | nd | 48.5 ± 3.6 c | |
| Ripe (R3) | 7.1 ± 1.6 c | 31.9 ± 2.2 cd | 0.45 ± 0.02 c | 0.35 ± 0.03 c | nd | 39.8 ± 1.1 d | |
| Fully ripe (R4) | 14.7 ± 1.0 b | 33.9 ± 1.9 c | 0.46 ± 0.02 c | 0.52 ± 0.05 b | nd | 49.6 ± 2.8 c | |
| Overripe (R5) | 29.6 ± 0.9 a | 26.6 ± 1.3 d | 0.38 ± 0.02 c | 0.71 ± 0.06 a | nd | 57.3 ± 2.2 b | |
| Variance | Cultivar | 135.7 *** | 40.5 *** | 29.4 *** | 69.4 *** | na | 99.9 *** |
| Ripening stage | 167.7 *** | 194.5 *** | 40.3 *** | 115.7 *** | na | 46.2 *** | |
| Cultivar: Ripening stage | 32.5 *** | 5.7 *** | 7.6 *** | 10.6 *** | na | 20.3 *** | |
Disclaimer/Publisher’s Note: The statements, opinions and data contained in all publications are solely those of the individual author(s) and contributor(s) and not of MDPI and/or the editor(s). MDPI and/or the editor(s) disclaim responsibility for any injury to people or property resulting from any ideas, methods, instructions or products referred to in the content. |
© 2024 by the authors. Licensee MDPI, Basel, Switzerland. This article is an open access article distributed under the terms and conditions of the Creative Commons Attribution (CC BY) license (https://creativecommons.org/licenses/by/4.0/).
Share and Cite
Simkova, K.; Veberic, R.; Grohar, M.C.; Pelacci, M.; Smrke, T.; Ivancic, T.; Medic, A.; Cvelbar Weber, N.; Jakopic, J. Changes in the Aroma Profile and Phenolic Compound Contents of Different Strawberry Cultivars during Ripening. Plants 2024, 13, 1419. https://doi.org/10.3390/plants13101419
Simkova K, Veberic R, Grohar MC, Pelacci M, Smrke T, Ivancic T, Medic A, Cvelbar Weber N, Jakopic J. Changes in the Aroma Profile and Phenolic Compound Contents of Different Strawberry Cultivars during Ripening. Plants. 2024; 13(10):1419. https://doi.org/10.3390/plants13101419
Chicago/Turabian StyleSimkova, Kristyna, Robert Veberic, Mariana Cecilia Grohar, Massimiliano Pelacci, Tina Smrke, Tea Ivancic, Aljaz Medic, Nika Cvelbar Weber, and Jerneja Jakopic. 2024. "Changes in the Aroma Profile and Phenolic Compound Contents of Different Strawberry Cultivars during Ripening" Plants 13, no. 10: 1419. https://doi.org/10.3390/plants13101419
APA StyleSimkova, K., Veberic, R., Grohar, M. C., Pelacci, M., Smrke, T., Ivancic, T., Medic, A., Cvelbar Weber, N., & Jakopic, J. (2024). Changes in the Aroma Profile and Phenolic Compound Contents of Different Strawberry Cultivars during Ripening. Plants, 13(10), 1419. https://doi.org/10.3390/plants13101419