Article

Genome-Wide Development of Polymorphic Microsatellite Markers and Genetic Diversity Analysis for the Halophyte Suaeda aralocaspica (Amaranthaceae)

1
State Key Laboratory of Desert and Oasis Ecology, Xinjiang Institute of Ecology and Geography, Chinese Academy of Sciences, Urumqi 830011, China
2
University of Chinese Academy of Sciences, Beijing 100049, China
3
Turpan Eremophytes Botanical Garden, Chinese Academy of Sciences, Turpan 838008, China
*
Authors to whom correspondence should be addressed.
Plants 2023, 12(9), 1865; https://doi.org/10.3390/plants12091865
Submission received: 20 March 2023 / Revised: 14 April 2023 / Accepted: 28 April 2023 / Published: 30 April 2023

Abstract

:
Suaeda aralocaspica, which is an annual halophyte, grows in saline deserts in Central Asia with potential use in saline soil reclamation and salt tolerance breeding. Studying its genetic diversity is critical for effective conservation and breeding programs. In this study, we aimed to develop a set of polymorphic microsatellite markers to analyze the genetic diversity of S. aralocaspica. We identified 177,805 SSRs from the S. aralocaspica genome, with an average length of 19.49 bp, which were present at a density of 393.37 SSR/Mb. Trinucleotide repeats dominated (75.74%) different types of motifs, and the main motif was CAA/TTG (44.25%). We successfully developed 38 SSR markers that exhibited substantial polymorphism, displaying an average of 6.18 alleles with accompanying average polymorphism information content (PIC) value of 0.516. The markers were used to evaluate the genetic diversity of 52 individuals collected from three populations of S. aralocaspica in Xinjiang, China. The results showed that the genetic diversity was moderate to high, with a mean expected heterozygosity (He) of 0.614, a mean Shannon’s information index (I) of 1.23, and a mean genetic differentiation index (Fst) of 0.263. The SSR markers developed in this study provide a valuable resource for future genetic studies and breeding programs of S. aralocaspica, and even other species in Suaeda.

1. Introduction

Suaeda spp., which has more than 100 species, is a genus of flowering plants that belongs to the family Amaranthaceae [1]. These plants are halophytic herbs or shrubs commonly found in Asia, Europe, North America, and seashores worldwide [2]. Suaeda plants are highly adapted to extreme salt and water conditions [3]. They have a unique structure that allows them to store water and tolerate high levels of salinity in the soil [4]. In addition to their medicinal properties, some species of Suaeda are used for reclamation of degraded saline lands, as well as in the production of biofuels due to their high oil content [5]. Suaeda represents a significant ecological and economic resource for many countries around the world [3].
Suaeda aralocaspica is a plant species with succulent leaves that belongs to the family Amaranthaceae. This annual halophyte plant is native to Central Asia and can be found in the salty deserts of the region. In China, this plant is found in the cold desert regions of the Junggar Basin in Xinjiang [6,7]. It carries out complete C4 photosynthesis within individual cells but lacks the characteristic leaf anatomy of other C4 plants. These features make it potentially valuable in biotechnology of higher photosynthetic efficiencies in agriculturally important C3 carbon fixation species such as rice [8]. Seed heteromorphism, which refers to the presence of two distinct types of seeds within a single plant, is a unique characteristic of this species. The two types of seeds are black and brown, and they differ in their size, color, and germination behavior [9,10,11,12]. Conservation measures are imperative for the survival of S. aralocaspica, as its population is rapidly diminishing, requiring urgent protection against further decline and potential extinction.
Genetic diversity, also known as gene diversity, is the total range of genetic variation present in different individuals among various populations as well as within the same population [13]. It is considered a fundamental and essential component of biodiversity. Genetic diversity level is critical in determining the long-term survivability and evolutionary capacity of a specific species [14]. A decrease in genetic diversity can lead to a reduction in species’ fitness, ultimately increasing their risk of extinction. For this reason, genetic diversity is often utilized as a predictive tool in studies concerning endangered species and species trend analysis [15,16].
There are several methods for studying genetic diversity, such as morphological tests, cytological markers, biochemical markers, and molecular markers [17,18]. However, molecular markers, in particular, have become one of the most prevalent methods due to their high reliability, independence from environmental factors, and high number [19]. Among molecular markers, microsatellite markers are increasingly popular for conducting genetic studies. Microsatellite markers, also known as simple sequence repeats (SSR) or short tandem repeat (STR) data, a segment of DNA consisting of 1-6bp repeat units in tandem, offer several advantages, including high information content, co-dominance, and multiple alleles. Therefore, they are widely used in various genetic studies as an effective molecular marker [20,21].
There have been limited research efforts focused on exploring the genetic diversity of Suaeda species [22,23]. This could be attributed to the fact that molecular markers specific to the Suaeda genus have not been extensively developed. Genetic diversity of S. corniculata from Bunge in Eastern Siberia was analyzed by using five inter-simple sequence repeats (ISSRs) markers [24]. In a study conducted by Prinz (2013), the genetic diversity and differentiation of 31 populations of S. maritima from coastal and inland areas of Central Europe were compared using 10 polymorphic microsatellite markers. The findings revealed that there were significant differences in the genetic diversity between populations of S. maritima from coastal and inland areas. This suggests that the addition of anthropogenic salt sites may have a facilitative effect on gene flow in inland populations of saline plants [25]. Prinz (2009) also developed a set of 12 polymorphic microsatellite markers specifically designed for analyzing the genetic diversity of S. maritima. These polymorphic markers were also found to be cross-amplifiable across related species, such as S. glauca and S. salsa. Of the 12 markers, 11 were shown to be reproducible and effective for conducting genetic analyses of Suaeda populations [8]. The limited research on genetic diversity in Suaeda species suggests moderate to high levels of genetic diversity within populations and variable levels of diversity among populations. The genome of S. aralocaspica, comprising 452 Mb, has been sequenced to provide a data base for the analysis and development of SSR markers for S. aralocaspica and even the genus Suaeda [26].
The habitat of S. aralocaspica is facing significant fragmentation and degradation caused by human activities and climate change in China. This fragmentation is posing a potential threat to the species as it may reduce gene flow among isolated populations. The primary aim of this research is to conduct a comprehensive genome-wide study to characterize and develop SSR markers in S. aralocaspica. This study also aims to analyze the genetic diversity of SSRs in S. aralocaspica populations to understand the species’ population structures. The developed SSR markers can be used to identify genetic variations and patterns in different populations of S. aralocaspica, which may be useful in conservation planning and germplasm management in the future.

2. Results

2.1. Analysis of the Distribution of SSRs in the Genome of S. aralocaspica

MISA software was utilized to screen 452 Mb of the entire genome of S. aralocaspica, which led to the detection of 177,805 SSR markers. The total length of these markers amounted to 3,465,418 bp. The frequency and density of SSR in the entire genome were determined to be 393.37SSR/Mb and 7666.85 bp/Mb, respectively, representing approximately 0.77% of the whole genome sequence (Table 1).
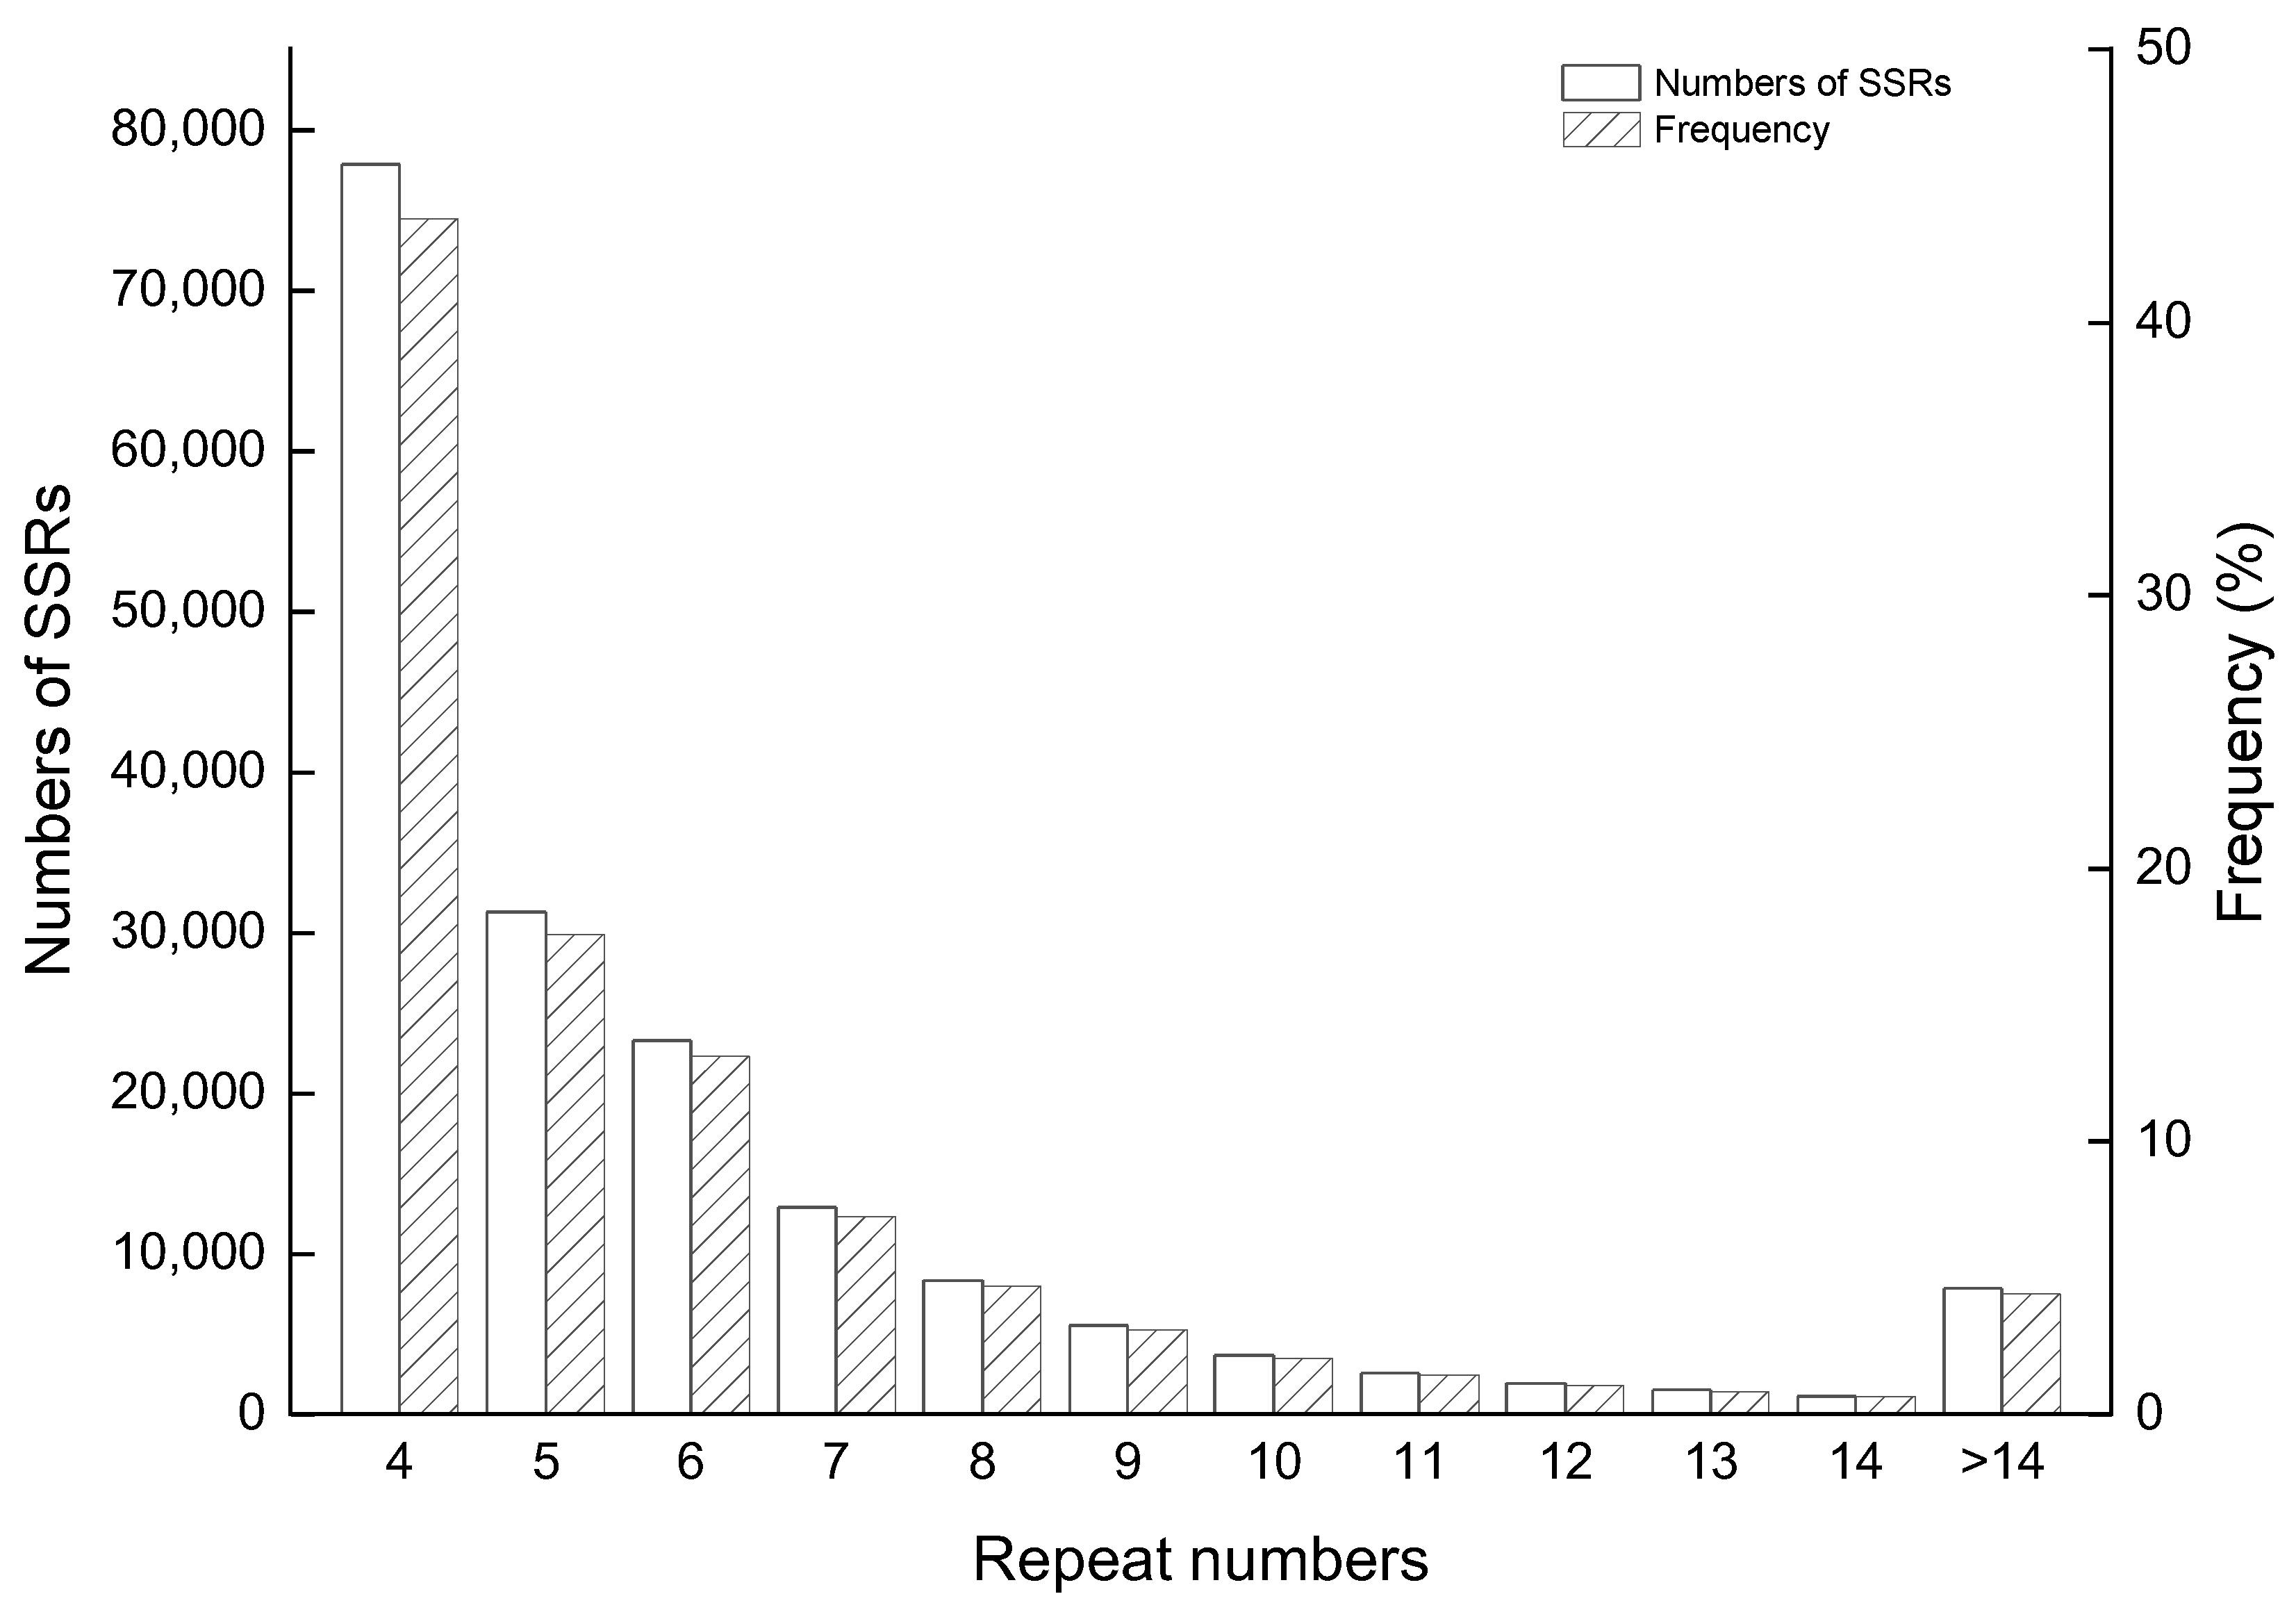
The length of SSRs found on the complete genome of S. aralocaspica was from 12 bp to 9862 bp, with an average length of 19.49 bp. The most frequently occurring repeat length was 12 bp, which appeared 73,445 times, and was followed by 15 bp, 18 bp, and 16 bp, occurring at frequencies of 28,116, 17,288, and 10,626, respectively (Figure 1). An analysis of the repeated motifs at each SSR locus revealed that the number of repeats ranged from 4 to 1551, and the majority of loci had four tandem repeats (43.77%), followed by those with five tandem repeats (17.57%) (Figure 2).
Trinucleotide repeats were the most common, followed by dinucleotide, tetranucleotide, pentanucleotide, and hexanucleotide repeats in the whole genome of S. aralocaspica. The total length of SSRs in the genome was found to be 3,465,418 bp, and the total length of SSRs with di-, tri-, tetra-, penta-, and hexanucleotide repeats was 473,878 bp, 2,383,446 bp, 337,516 bp, 113,540 bp, and 157,038 bp, respectively. The average length of each basic sequence was 18.76 bp, 17.70 bp, 30.27 bp, 30.11 bp, and 52.96 bp, respectively (Table 2).
In the entire genome of S. aralocaspica, a total of 177,805 SSRs were identified, which contained 355 nucleotide repeats. These repeats were categorized into di-, tri-, tetra-, penta-, and hexanucleotide repeats, with 4, 10, 32, 88, and 221 nucleotide repeats, respectively. The most commonly used repeat motif was AAC/GTT (44.25%), followed by AT/AT (10.08%), AAAT/ATTT (2.85%), AAAAT/ATTTT (0.54%), and AACAAT/ATTGTT (0.15%). Among all the repeat motifs, di-, tri-, and tetranucleotide repeats were found to be the most prevalent types, while the proportion of five- and six-nucleotide repeats was considerably smaller, accounting for only 3.79% of the total 309 nucleotide repeats (Table 3).

2.2. Development of Genome SSR Markers for S. aralocaspica

A set of 100 candidate SSR pairs was chosen for S. aralocaspica, out of which, 88 were successful in producing clear bands with eight or more SSR loci. These loci were further tested for polymorphism using UV observation of PCR products and 2% agar gel electrophoresis. The resulting data was analyzed using Cervus v3.0.7, which identified 38 highly polymorphic SSR loci (Table S1). These loci were then used to amplify three distinct populations of S. aralocaspica.
A total of 52 samples were collected from three populations of S. aralocaspica and were analyzed using 38 SSR loci (Table 4). The results indicated that these loci contained a total of 235 alleles, with an average of 6.18 Na (number of alleles) per individual locus, ranging between 3 and 12. Locus SA-di-63 and SA-te-94 had the highest number of alleles, while SA-te-29 and SA-te-98 had the lowest. The average value of Ne (effective alleles) across all loci was 2.96, with a maximum of 5.131 observed at locus SA-tri-85 and a minimum of 1.405 at locus SA-di-65. The range of variation for I was 0.596 to 1.827, with the highest value observed at locus SA-tri-85 and the lowest at SA-di-65. The Ho values ranged from 0 to 1, while the He values ranged from 0.288 to 0.805. The uHe values ranged from 0.291 to 0.813, and the Fst values ranged from 0.027 to 0.548, with an average value of 0.263, indicating a significant genetic divergence among the collected S. aralocaspica samples. The range of PIC values was 0.272 to 0.773, with a mean value of 0.568. The majority of the loci had PIC values above 0.5, indicating good polymorphism in the 38 primer pairs that were screened.

2.3. Genetic Diversity Analysis of S. aralocaspica Populations

The Na values of the selected markers amplified for the three populations of S. aralocaspica ranged from 2.921 to 4.447, while Ne ranged from 1.794 to 2.667. The values for I ranged from 0.642 to 1.085, Ho ranged from 0.207 to 0.299, He ranged from 0.365 to 0.573, uHe ranged from 0.376 to 0.591, and F ranged between 0.515 and 0.602 (Table 5).
The analysis of molecular variation (AMOVA) in the S. aralocaspica population revealed that 35% of the genetic variation was present within individuals, 32% varied between populations, and 33% was seen between individuals.
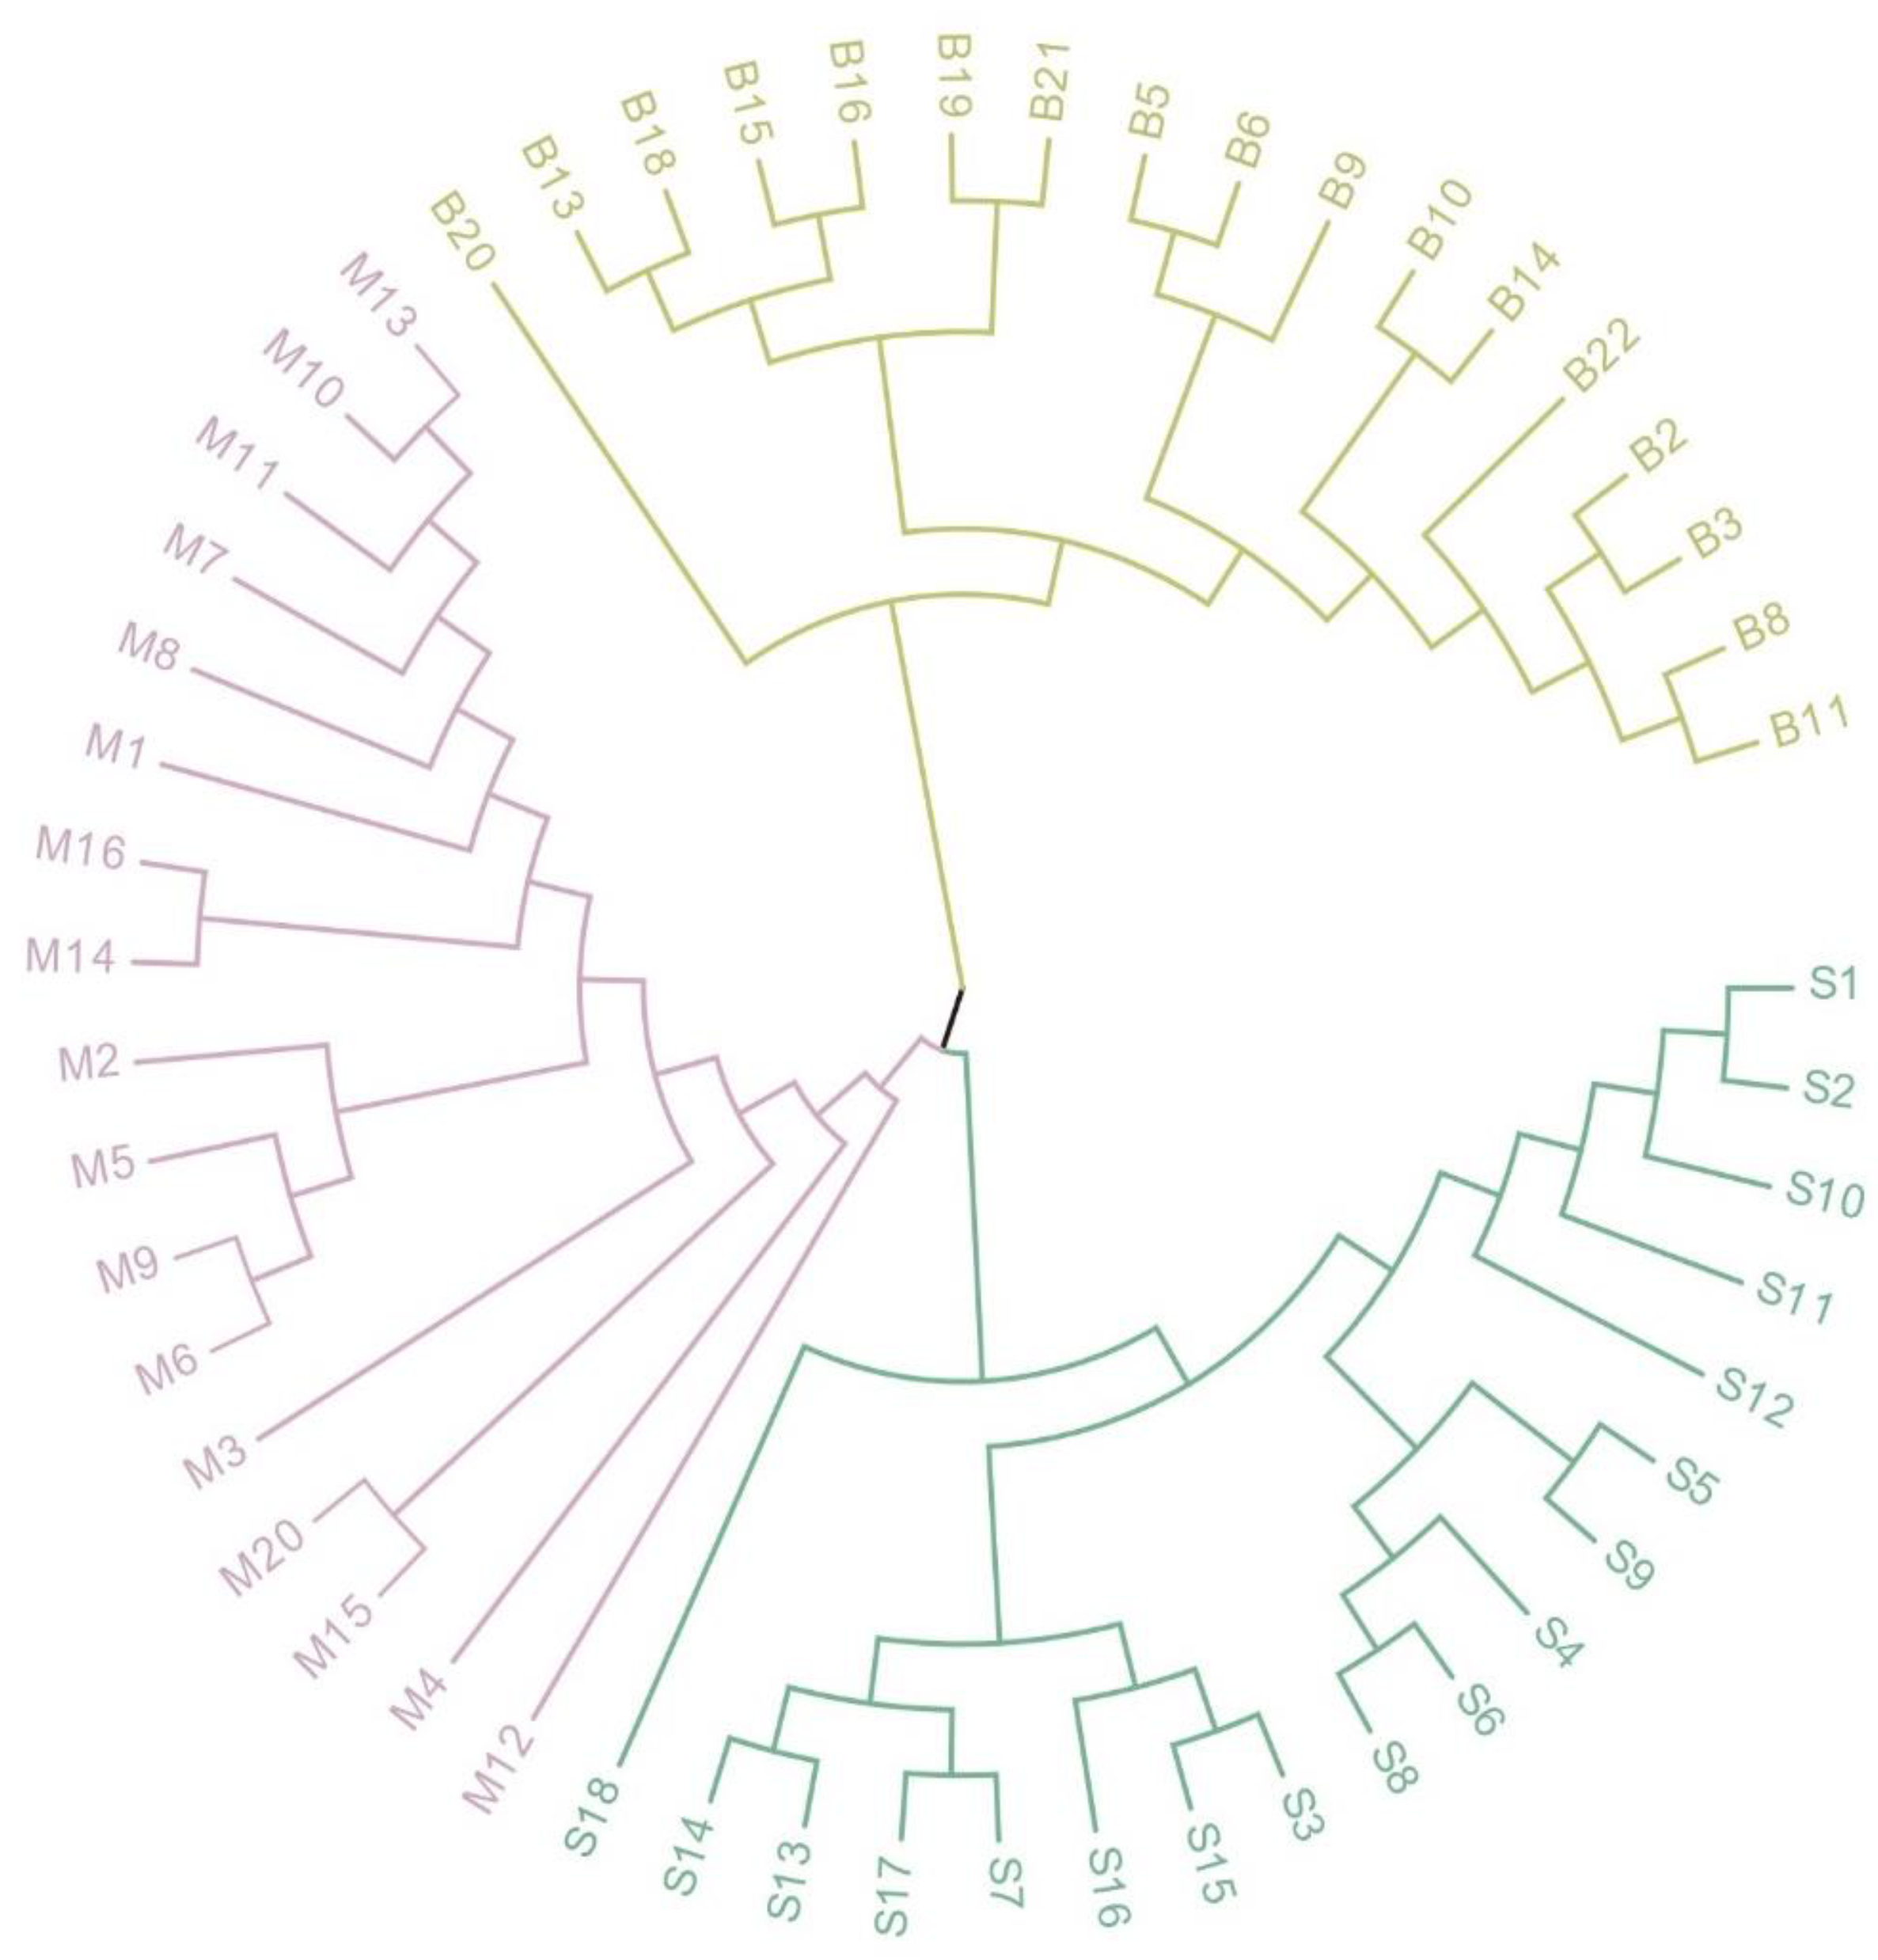
In the populations studied, the genetic identity between the Shawan and Shihezi S. aralocaspica populations was found to be the highest, at 0.654. On the other hand, the genetic identity between Fukang-Shawan and Fukang-Shihezi pairs was lower, at 0.438 and 0.548, respectively (Table 6). This was further supported by the UPGMA analysis, where the Shawan and Shihezi populations were found to be genetically distant from each other, while the Fuakang and Shawan populations showed the most differences in genetic identity (Figure 3).
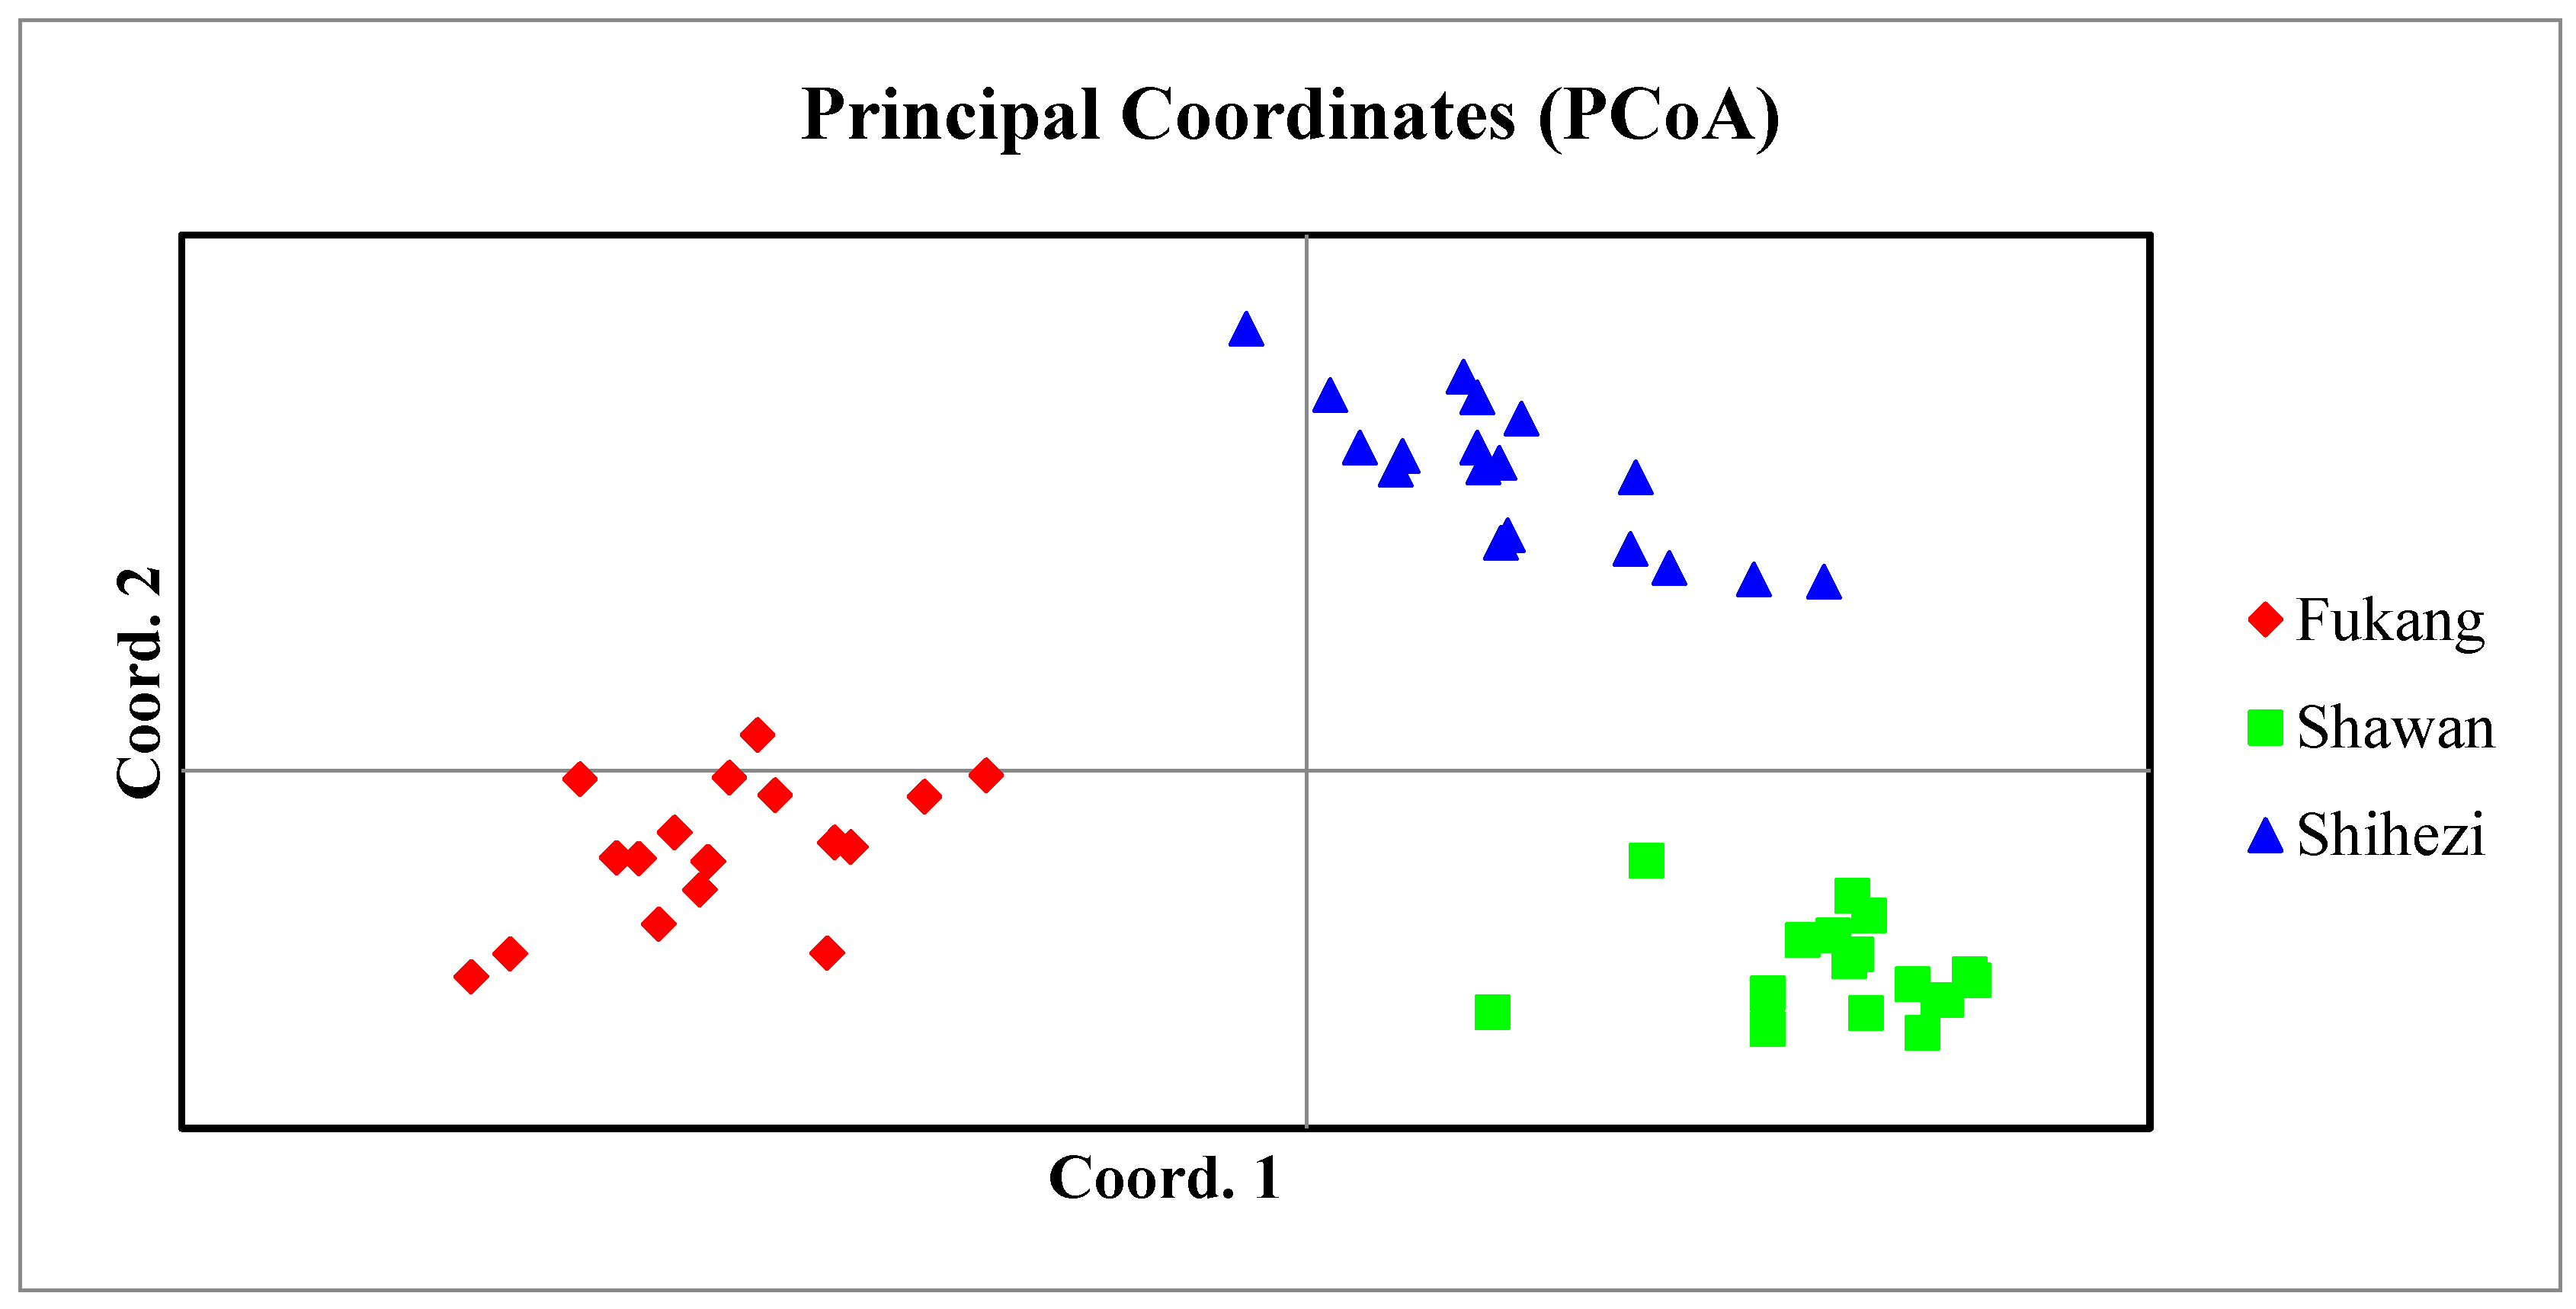
The analysis using PCoA indicated that the initial principal coordinate encompassed 31.91% of the overall genetic variation, with the second and third principal coordinates accounting for 14.72% and 12.60%, respectively. The combined eigen-values for the three principal coordinates reached 59.22% (Figure 4).

3. Discussion

Suaeda is a valuable representative plant species among saline plants, with significant research potential. However, the development of molecular markers for Suaeda has been limited, hindering the progress of molecular ecology and population genetics studies on this genus. To address this gap, we utilized the sequencing data of S. aralocaspica to identify SSRs on its genome and subsequently developed 38 SSR markers with good polymorphism. These markers can be used to analyze the genetic diversity of S. aralocaspica and contribute to the study of genetic diversity and structure of the Suaeda plants.
After performing the analysis, we discovered that the frequency of SSRs in S. aralocaspica’s entire genome was 393.37 SSRs/Mb. This amount was significantly higher when compared to Anemone coronaria (65.52 SSRs/Mb), Solanum melongena (120 SSRs/Mb), and Triticum aestivum (36.68 SSRs/Mb) [27,28,29]. Therefore, it can be inferred that SSRs were abundant in the whole genome of S. aralocaspica. Dinucleotide and trinucleotide repeats were the most common SSRs in the genome of S. aralocaspica, similar to Tartary buckwheat [30]. However, there is a difference in abundance between the two, as dinucleotide repeats were the most common in Tartary buckwheat (63.95%), whereas trinucleotide repeats were more common in S. aralocaspica (75.74%).
In this study, we examined the genetic diversity of S. aralocaspica using 38 pairs of SSR primers developed for various populations. We found that the expected heterozygosity (He) and Shannon’s information index (I) values for the three populations ranged from 0.288 to 0.805 and 0.642 to 1.085, respectively. A comparison of our results with those obtained for other species, such as S. maritima (He = 0.37, I = 0.97) [25], S. corniculata subsp. mongolica (I = 0.1688), S. “jacutica” (I = 0.0878), and S. corniculata s. str [23]. Nuphar submersa (He = 0.42), Pedicularis kansuensis (He = 0.441, I = 0.781), Ruta oreojasme (He = 0.687), Vincetoxicum atratum (He = 0.67), Ammi seubertianum (He = 0.66, I = 1.28), Ammi trifoliatum (He = 0.67, I = 1.35), and Tapiscia sinensis (He = 0.6904, I = 1.4368), revealed some variation in values [31,32,33,34,35,36]. It is essential to note that different plants and SSR loci, as well as the number of markers used, can all affect genetic diversity analysis results.
The genetic diversity analysis of S. aralocaspica populations from three distinct regions revealed differences in their genetic diversity. Specifically, the genetic diversity of S. aralocaspica populations in Fukang was significantly greater than that of populations in Shihezi and Shawan. This may be due to the different habitats of the three populations. For instance, the S. aralocaspica population in Fukang is located near a protected reservoir, making it less susceptible to human activities and boasting relatively stable conditions. It also has a larger habitat area and population size compared to those in Shihezi and Shawan. Conversely, the S. aralocaspica populations in Shihezi and Shawan are more frequently impacted by human activities and experience greater environmental volatility. This may explain the significant differences in genetic diversity observed between the three populations.
In this study, we compared the genetic identity and actual geographic distance of three distinct S. aralocaspica populations. Our findings revealed that the S. aralocaspica populations of Shihezi and Shawan had the closest geographic distance and the highest genetic identity. Conversely, the Fukang and Shawan populations showed the greatest geographic distance and the lowest genetic similarity. These results indicate an inverse relationship between genetic identity and geographic distance among the three S. aralocaspica populations. This suggests that geographic distance may play a vital role in influencing gene flow among different S. aralocaspica populations.
Gene flow has a reducing effect on genetic differentiation between populations, particularly where gene flow is greater than 1 number of migrants (Nm). However, when Nm is less than 1, local differentiation between populations tends to occur. Despite this, the collected samples of S. aralocaspica indicate greater genetic differentiation, with mean Fst values above 0.25. This suggests that S. aralocaspica may have undergone local adaptation due to high selection pressure, which can occur even in the presence of high levels of gene flow, according to Endler et al. [37]. In combination with other data, it is possible that high selection pressure has contributed to the local adaptation of S. aralocaspica [38]. Factors that influence plant genetic diversity include species-related factors such as mating systems, bottleneck effects, evolution, and life history, as well as anthropogenic factors.
Heterozygous species typically exhibit greater genetic diversity than self-incompatible species [39,40]. Although there is no definitive evidence on the mating system of S. aralocaspica, its monoecious annual nature and inbreeding coefficients exceeding 0.5 in all three populations suggest a likelihood of more pronounced inbreeding. Further analysis is necessary to determine the exact mating system. Mating among close relatives in small populations often happens out of necessity and results in high inbreeding coefficients and a decline in genetic diversity [41]. S. aralocaspica populations exhibit high genetic diversity and this may be attributed to natural or anthropogenic factors that have caused severe habitat fragmentation and a significant reduction in population size, with the small populations inheriting a fraction of the genetic variation from the original large populations. Further investigation is needed to establish the exact causes of this phenomenon.

4. Materials and Methods

4.1. Plant Material

The 52 fresh plant samples utilized were obtained from three distinct populations of S. aralocaspica (17 individuals from Fukang (87°40′ E, 44°13′ N), 17 individuals from Shihezi (87°14′ E, 44°45′ N), and 18 individuals from Shawan (85°50′ E, 44°36′ N)) in July 2021 from Xinjiang, China. Fresh leaves of S. aralocaspica within different habitats were collected using the quadrat method. After collection, the samples were carefully wrapped in tinfoil and preserved in liquid nitrogen to maintain their freshness. Subsequently, the plant materials were stored in an ultra-low-temperature refrigerator at −80 °C until they were utilized for subsequent experiments.

4.2. Genome SSR Identification and Development

This study utilized whole genome sequencing results of S. aralocaspica, obtained from the open access data of NCBI (with project registration number PRJNA428881), as a basis for developing a set of SSR primers with high polymorphism. In order to achieve this, our study considered microsatellite markers with a standard size of 2–6 bp, excluding single nucleotides. To determine the microsatellite loci, the MISA software was utilized, focusing on nucleotide microsatellites with a minimum repeat number of 4. We then used Primer 3 software to design primers specific to flanking genomic sequences based on the read parameters of the microsatellite regions. The expected amplicon length of our design ranged from 100 to 300 bp.

4.3. PCR Amplification, and Electrophoresis Detection

Genomic DNA from S. aralocaspica plant material was extracted using the DNAsecure Plant Kit (Tiangen Biotechnology, Beijing, China), following the manufacturer’s guidelines. From all genomic SSRs, 100 candidate primer pairs were randomly selected based on the minimum lengths of 14, 18, and 20 bp for di-, tri-, and tetranucleotide repeats [42,43], respectively. The forward primers’ 5′ ends were labeled with FAM blue, a fluorescent dye (Shanghai General Biotechnology, Shanghai, China), for easy scoring in genotyping. PCR amplification was performed using the selected primers for all sample DNA in a 25 μL reaction system containing 1 μL of template DNA, 1 μL each of upstream and downstream primers, 2 × EasyTaq PCR SuperMix 12.5 μL, and ddH2O 9.5 μL. The amplification reaction procedure consisted of three stages: pre-denaturation at 94 °C for 3 min in the first stage and, in the second stage, 30 cycles of denaturation at 94 °C for 30 s, annealing at 58 °C for 30 s, and extension at 72 °C for 30 s. Successful amplification was confirmed by analyzing at least eight or more of the ten individuals’ bright bands using 2% agarose gel electrophoresis. Alleles (.FSA) generated after the PCR amplification experiment were analyzed using GeneMarker v2.2.0 (SoftGenetics LLC., State College, PA, USA) genotyping software. Primers with good polymorphism were selected for amplification of the collected S. aralocaspica population material by data analysis, followed by analysis of the amplification results.

4.4. Data Analysis

Various genetic diversity indices were computed using different software packages. Popgene 32 [44], Cervus v3.0.7, and GenAlEx 6.5 were used to calculate the number of alleles (Na), number of effective alleles (Ne), Shannon information index (I), observed heterozygosity (Ho), expected heterozygosity (He), and polymorphism information content (PIC) [45]. The Nei’s gene diversity index was also calculated using the Nei’s genetic distance. Subsequently, UPGMA clustering was performed for all S. aralocaspica samples using Mega6 [46]. Principal coordinate analysis and genetic similarity analysis were carried out using GenAlEx 6.5 software. DataFormater 2010 was used to convert the data types [47].

5. Conclusions

Based on the sequencing of the whole genome of S. aralocaspica, this study has successfully developed a large set of polymorphic microsatellite markers that can be used for the genetic diversity analysis of halophyte S. aralocaspica. The results of the genetic diversity analysis showed that the populations of S. aralocaspica had moderate levels of genetic differentiation and high levels of genetic diversity within each population. The microsatellite markers developed in this study provide a valuable tool for future population genetics studies and conservation efforts, not just for this species but also for other Suaeda species. Overall, this study highlights the importance of genetic diversity analysis in understanding the adaptive potential and conservation of halophyte species in changing environments.

Supplementary Materials

The following supporting information can be downloaded at: https://www.mdpi.com/article/10.3390/plants12091865/s1, Table S1. Characteristics of the 38 polymorphic SSR primer pairs of S. aralocaspica. (supplementary material).

Author Contributions

Conceptualization, L.W. and W.S.; methodology, W.X. and W.S.; software, W.X. and J.W.; validation, L.W. and W.X.; formal analysis, W.X. and J.W.; investigation, W.X. and J.W.; resources, W.S.; data curation, W.X.; writing—original draft preparation, W.X.; writing—review and editing, L.W., C.T., W.X. and W.S.; visualization, W.X.; supervision, L.W.; project administration, C.T.; funding acquisition, L.W. and J.W. All authors have read and agreed to the published version of the manuscript.

Funding

This research was funded by the Xinjiang Natural Science Foundation—The Outstanding Young Scientist Fund (grant number 2022D01E98) and the Strategic Biological Resources Capacity Building Project, CAS (grant number KFJ-BRP-017-72).

Data Availability Statement

The data presented in this study are available on request from the corresponding author.

Conflicts of Interest

The authors declare no conflict of interest.

References

  1. Huang, J.X.; Cheng, W.N.; Li, Y.L.; Yao, G. Reconstruction of phylogenetic relationships of Amaranthaceae based on multiple chloroplast gene sequence fragments. Chin. Bull. Botany 2022, 55, 457–467, (In Chinese with English Abstract). [Google Scholar]
  2. Wang, X.Y.; Shao, X.T.; Zhang, W.J.; Sun, T.; Ding, Y.L.; Lin, Z.; Li, Y. Genus Suaeda: Advances in phytology, chemistry, pharmacology and clinical application (1895–2021). Pharmacol. Res. 2022, 179, 106203. [Google Scholar] [CrossRef] [PubMed]
  3. Yadav, S.; Elansary, H.O.; Mattar, M.A.; Elhindi, K.M.; Alotaibi, M.A.; Mishra, A. Differential accumulation of metabolites in Suaeda species provides new insights into abiotic stress tolerance in C4-halophytic species in elevated CO2 conditions. Agronomy 2021, 11, 131. [Google Scholar] [CrossRef]
  4. Zhang, A.Q.; Pang, Q.Y.; Yan, A.F. Advances in salt-tolerance mechanisms of Suaeda plants. Acta Ecol. Sin. 2013, 33, 3575–3583, (In Chinese with English Abstract). [Google Scholar] [CrossRef]
  5. Wang, L.; Zhao, Z.Y.; Zhang, K.; Tian, C.Y. Oil content and fatty acid composition of dimorphic seeds of desert halophyte Suaeda aralocaspica. Afr. J. Agric. Res. 2012, 7, 1910–1914. [Google Scholar]
  6. Schütze, P.; Freitag, H.; Weising, K. An integrated molecular and morphological study of the subfamily Suaedoideae Ulbr. (Chenopodiaceae). Plant Syst. Evol. 2003, 239, 257–286. [Google Scholar] [CrossRef]
  7. Zhao, K.F.; Li, F.Z.; Fan, S.J.; Feng, L.T. Salt plants of China. Chin. Bull. Botany 1993, 3, 10–16, (In Chinese with English Abstract). [Google Scholar]
  8. Prinz, K.; Hensen, I.; Schie, S.; Debener, T.; Weising, K. Microsatellite markers for the tetraploid halophyte Suaeda maritima (L.) Dumort. (Chenopodiaceae) and cross-species amplification in related taxa. Mol. Ecol. Resour. 2009, 9, 1247–1249. [Google Scholar] [CrossRef]
  9. Park, J.; Okita, T.W.; Edwards, G.E. Salt tolerant mechanisms in single-cell C4 species Bienertia sinuspersici and Suaeda aralocaspica (Chenopodiaceae). Plant Sci. 2009, 176, 616–626. [Google Scholar] [CrossRef]
  10. Lara, M.V.; Offermann, S.; Smith, M.; Okita, T.W.; Andreo, C.S.; Edwards, G.E. Leaf development in the single-cell C4 system in Bienertia sinuspersici: Expression of genes and peptide levels for C4 metabolism in relation to chlorenchyma structure under different light conditions. Plant Physiol. 2008, 148, 593–610. [Google Scholar] [CrossRef]
  11. Edwards, G.E.; Voznesenskaya, E.V. Chapter 4 C4 photosynthesis: Kranz forms and single-cell C4 in terrestrial plants. C4 Photosynth. Relat. CO2 Conc. Mech. 2011, 32, 29–61. [Google Scholar]
  12. Sharpe, R.M.; Offermann, S. One decade after the discovery of single-cell C4 species in terrestrial plants: What did we learn about the minimal requirements of C4 photosynthesis? Photosynth Res. 2014, 119, 169–180. [Google Scholar] [CrossRef] [PubMed]
  13. Hughes, A.R.; Inouye, B.D.; Johnson, M.T.J.; Underwood, N.; Vellend, M. Ecological consequences of genetic diversity. Ecol. Lett. 2008, 11, 609–623. [Google Scholar] [CrossRef] [PubMed]
  14. Booy, G.; Hendriks, R.J.J.; Smulders, M.J.M.; Groenendael, J.M.V.; Vosman, B. Genetic diversity and the survival of populations. Plant Biol. 2000, 2, 379–395. [Google Scholar] [CrossRef]
  15. Frankham, R. Genetics and conservation biology. Comptes Rendus Biol. 2003, 326, s22–s29. [Google Scholar] [CrossRef]
  16. Allendorf, F.W.; Ryman, N. The role of genetics in population viability analysis. Popul. Viability Anal. 2002, 50, 85. [Google Scholar]
  17. Cheng, T.F.; Wang, H.; Zhou, D.W.; Chen, S.L.; Wang, J.L.; Shi, S.B.; Shen, J.W.; Lei, T.X. Progress in the study of genetic diversity of Gentiana macrophylla Radix. Chin. Tradit. Herb. Drugs 2019, 15, 3720–3728, (In Chinese with English Abstract). [Google Scholar]
  18. Mcintosh, R.A. Catalogue of Gene Symbols for Wheat; University Extension Press, University of Saskatchewan: Saskatoon, SK, Canada, 1998; Volume 5, pp. 119–120. [Google Scholar]
  19. Grover, A.; Sharma, P.C. Development and use of molecular markers: Past and present. Crit. Rev. Biotechnol. 2016, 36, 290–302. [Google Scholar] [CrossRef]
  20. Morgante, M.; Olivieri, A. PCR-amplified microsatellites as markers in plant genetics. Plant J. 1993, 3, 175–182. [Google Scholar] [CrossRef]
  21. Vieira, M.L.C.; Santini, L.; Diniz, A.L.; Munhozl, C.F. Microsatellite markers: What they mean and why they are so use-ful. Genet. Mol. Biol. 2016, 39, 312–328. [Google Scholar] [CrossRef]
  22. Park, J.S.; Takayama, K.; Suyama, Y.; Choi, B.H. Distinct phylogeographic structure of the halophyte Suaeda malacosperma (Chenopodiaceae/Amaranthaceae), endemic to Korea–Japan region, influenced by historical range shift dynamics. Plant Syst. Evol. 2019, 305, 193–203. [Google Scholar] [CrossRef]
  23. Prinz, K.; Weising, K.; Hensen, I. Genetic structure of coastal and inland populations of the annual halophyte Suaeda maritima (L.) dumort. in Central Europe, inferred from amplified fragment length polymorphism markers. Plant Biol. 2009, 11, 812–820. [Google Scholar] [CrossRef] [PubMed]
  24. Lomonosova, M.N.; Nikonova, D.E.; Kutsev, M.G.; Dorogina, O.V.; Korolyuk, A.Y. Genetic differentiation in the polyploid complex of Suaeda corniculata (CA Mey.) Bunge in Eastern Siberia. Russ. J. Genet. 2017, 53, 596–605. [Google Scholar] [CrossRef]
  25. Prinz, K.; Weising, K.; Hensen, I. Habitat fragmentation and recent bottlenecks influence genetic diversity and differentiation of the central European halophyte Suaeda maritima (Chenopodiaceae). Am. J. Bot. 2013, 100, 2210–2218. [Google Scholar] [CrossRef] [PubMed]
  26. Wang, L.; Ma, G.L.; Wang, H.L.; Cheng, C.; Mu, S.Y.; Quan, W.L.; Jiang, L.; Zhao, Z.Y.; Zhang, Y.; Tian, C.Y.; et al. A draft genome assembly of halophyte Suaeda aralocaspica, a plant that performs C4 photosynthesis within individual cells. GigaScience 2019, 8, giz116. [Google Scholar] [CrossRef]
  27. Martina, M.; Acquadro, A.; Barchi, L.; Gulino, D.; Brusco, F.; Rabaglio, M.; Portis, F.; Portis, E.; Lanteri, S. Genome-wide survey and development of the first microsatellite markers database (AnCorDB) in Anemone coronaria L. Int. J. Mol. Sci. 2022, 23, 3126. [Google Scholar] [CrossRef]
  28. Han, B.; Wang, C.B.; Tang, Z.H.; Ren, Y.K.; Li, Y.L.; Zhang, D.Y.; Dong, Y.H.; Zhao, X.H. Genome-wide analysis of microsatellite markers based on sequenced database in Chinese spring wheat (Triticum aestivum L.). PLoS ONE 2015, 10, e0141540. [Google Scholar] [CrossRef]
  29. Portis, E.; Lanteri, S.; Barchi, L.; Portis, F.; Valente, L.; Toppino, L.; Rotino, G.L.; Acquadro, A. Comprehensive characterization of simple sequence repeats in eggplant (Solanum melongena L.) genome and construction of a web resource. Front. Plant Sci. 2018, 9, 401. [Google Scholar] [CrossRef]
  30. Hou, S.; Ren, X.M.; Yang, Y.; Wang, D.H.; Du, W.; Wang, X.F.; Li, H.Y.; Han, Y.H.; Liu, L.L.; Sun, Z.X. Genome-wide development of polymorphic microsatellite markers and association analysis of major agronomic traits in core germplasm resources of tartary buckwheat. Front. Plant Sci. 2022, 13, 357. [Google Scholar] [CrossRef]
  31. Shiga, T.; Yokogawa, M.; Kaneko, S.; Isagi, Y. Genetic diversity and population structure of Nuphar submersa (Nymphaeaceae), a critically endangered aquatic plant endemic to Japan, and implications for its conservation. J. Plant Res. 2017, 130, 83–93. [Google Scholar] [CrossRef]
  32. Li, W.J.; Su, Z.H.; Li, A.R.; Guan, K.Y.; Feng, Y. Isolation and characterization of 18 microsatellites for the invasive native Pedicularis kansuensis (Orobanchaceae). Grassl. Sci. 2019, 65, 135–138. [Google Scholar] [CrossRef]
  33. Meloni, M.; Reid, A.; Caujapé-Castells, J.; Moisés, S.; Fernández-Palacios, J.M.; Conti, E. High genetic diversity and population structure in the endangered Canarian endemic Ruta oreojasme (Rutaceae). Genetica 2015, 143, 571–580. [Google Scholar] [CrossRef]
  34. Yamashiro, T.; Yamashiro, A.; Inoue, M.; Maki, M. Genetic diversity and divergence in populations of the threatened grassland perennial Vincetoxicum atratum (Apocynaceae-Asclepiadoideae) in Japan. J. Hered. 2016, 107, 455–462. [Google Scholar] [CrossRef] [PubMed]
  35. Vieira, Â.F.; Dias, E.F.; Moura, M. Geography, geology and ecology influence population genetic diversity and structure in the endangered endemic Azorean Ammi (Apiaceae). Plant Syst. Evol. 2018, 304, 163–176. [Google Scholar] [CrossRef]
  36. Zhou, X.J.; Ren, X.L.; Liu, W.Z. Genetic diversity of SSR markers in wild populations of Tapiscia sinensis, an endangered tree species. Biochem. Syst. Ecol. 2016, 69, 1–5. [Google Scholar] [CrossRef]
  37. Endler, J.A. Geographic Variation, Speciation, and Clines; Princeton University Press, Princeton University: Princeton, NJ, USA, 1977; pp. 97–139. [Google Scholar]
  38. Freeland, J.R. Molecular Ecology; John Wiley & Sons: New York, NY, USA, 2020; pp. 457–458. [Google Scholar]
  39. Zhang, D.Y.; Jiang, X.H. Evolution of plant mating systems, resource allocation responses and genetic diversity. Acta Phytoecol. Sin. 2001, 2, 130–143, (In Chinese with English abstract). [Google Scholar]
  40. Nybom, H. Comparison of different nuclear DNA markers for estimating intraspecific genetic diversity in plants. Mol. Ecol. 2004, 13, 1143–1155. [Google Scholar] [CrossRef]
  41. Reed, D.H.; Briscoe, D.A.; Frankham, R. Inbreeding and extinction: The effect of environmental stress and lineage. Conserv. Genet. 2002, 3, 301–307. [Google Scholar] [CrossRef]
  42. Vít, P.; Krak, K.; Douda, J.; Mandák, B. Microsatellite markers for Anthericum ramosum: Development, characterization, and cross-species amplification. Appl. Plant Sci. 2020, 8, e11323. [Google Scholar] [CrossRef]
  43. Krak, K.; Vít, P.; Douda, J.; Mandák, B. Development of 18 microsatellite markers for Salvia pratensis. Appl. Plant Sci. 2020, 8, e11316. [Google Scholar] [CrossRef]
  44. Su, X.N.; Wang, H.M.; Huang, X.X.; Xie, X.Y.; Zhang, X.T.; Niu, L.; Dong, L.; Jiang, S.L.; Wu, J.L.; Jiang, S.M. Analysis of genetic diversity and genetic structure of wild mizuna in Northeast China using SSR markers. Acta Agric. Univ. Jiangxiensis 2018, 40, 579–589, (In Chinese with English Abstract). [Google Scholar]
  45. Peakall, R.; Smouse, P.E. GenAlEx 6.5: Genetic analysis in Excel. Population genetic software for teaching and research—An update. Bioinformatics 2012, 28, 2537–2539. [Google Scholar] [CrossRef] [PubMed]
  46. Tamura, K.; Stecher, G.; Peterson, D.; Filipski, A.; Kumar, S. MEGA6: Molecular Evolutionary Genetics Analysis Version 6.0. Mol. Biol. Evol. 2013, 30, 2725–2729. [Google Scholar] [CrossRef]
  47. Fan, W.Q.; Gai, H.M.; Sun, X.; Yang, A.G.; Zhang, Z.F.; Ren, M. SSR data format conversion software DataFormater. Mol. Plant Breed. 2016, 14, 265–270, (In Chinese with English Abstract). [Google Scholar]
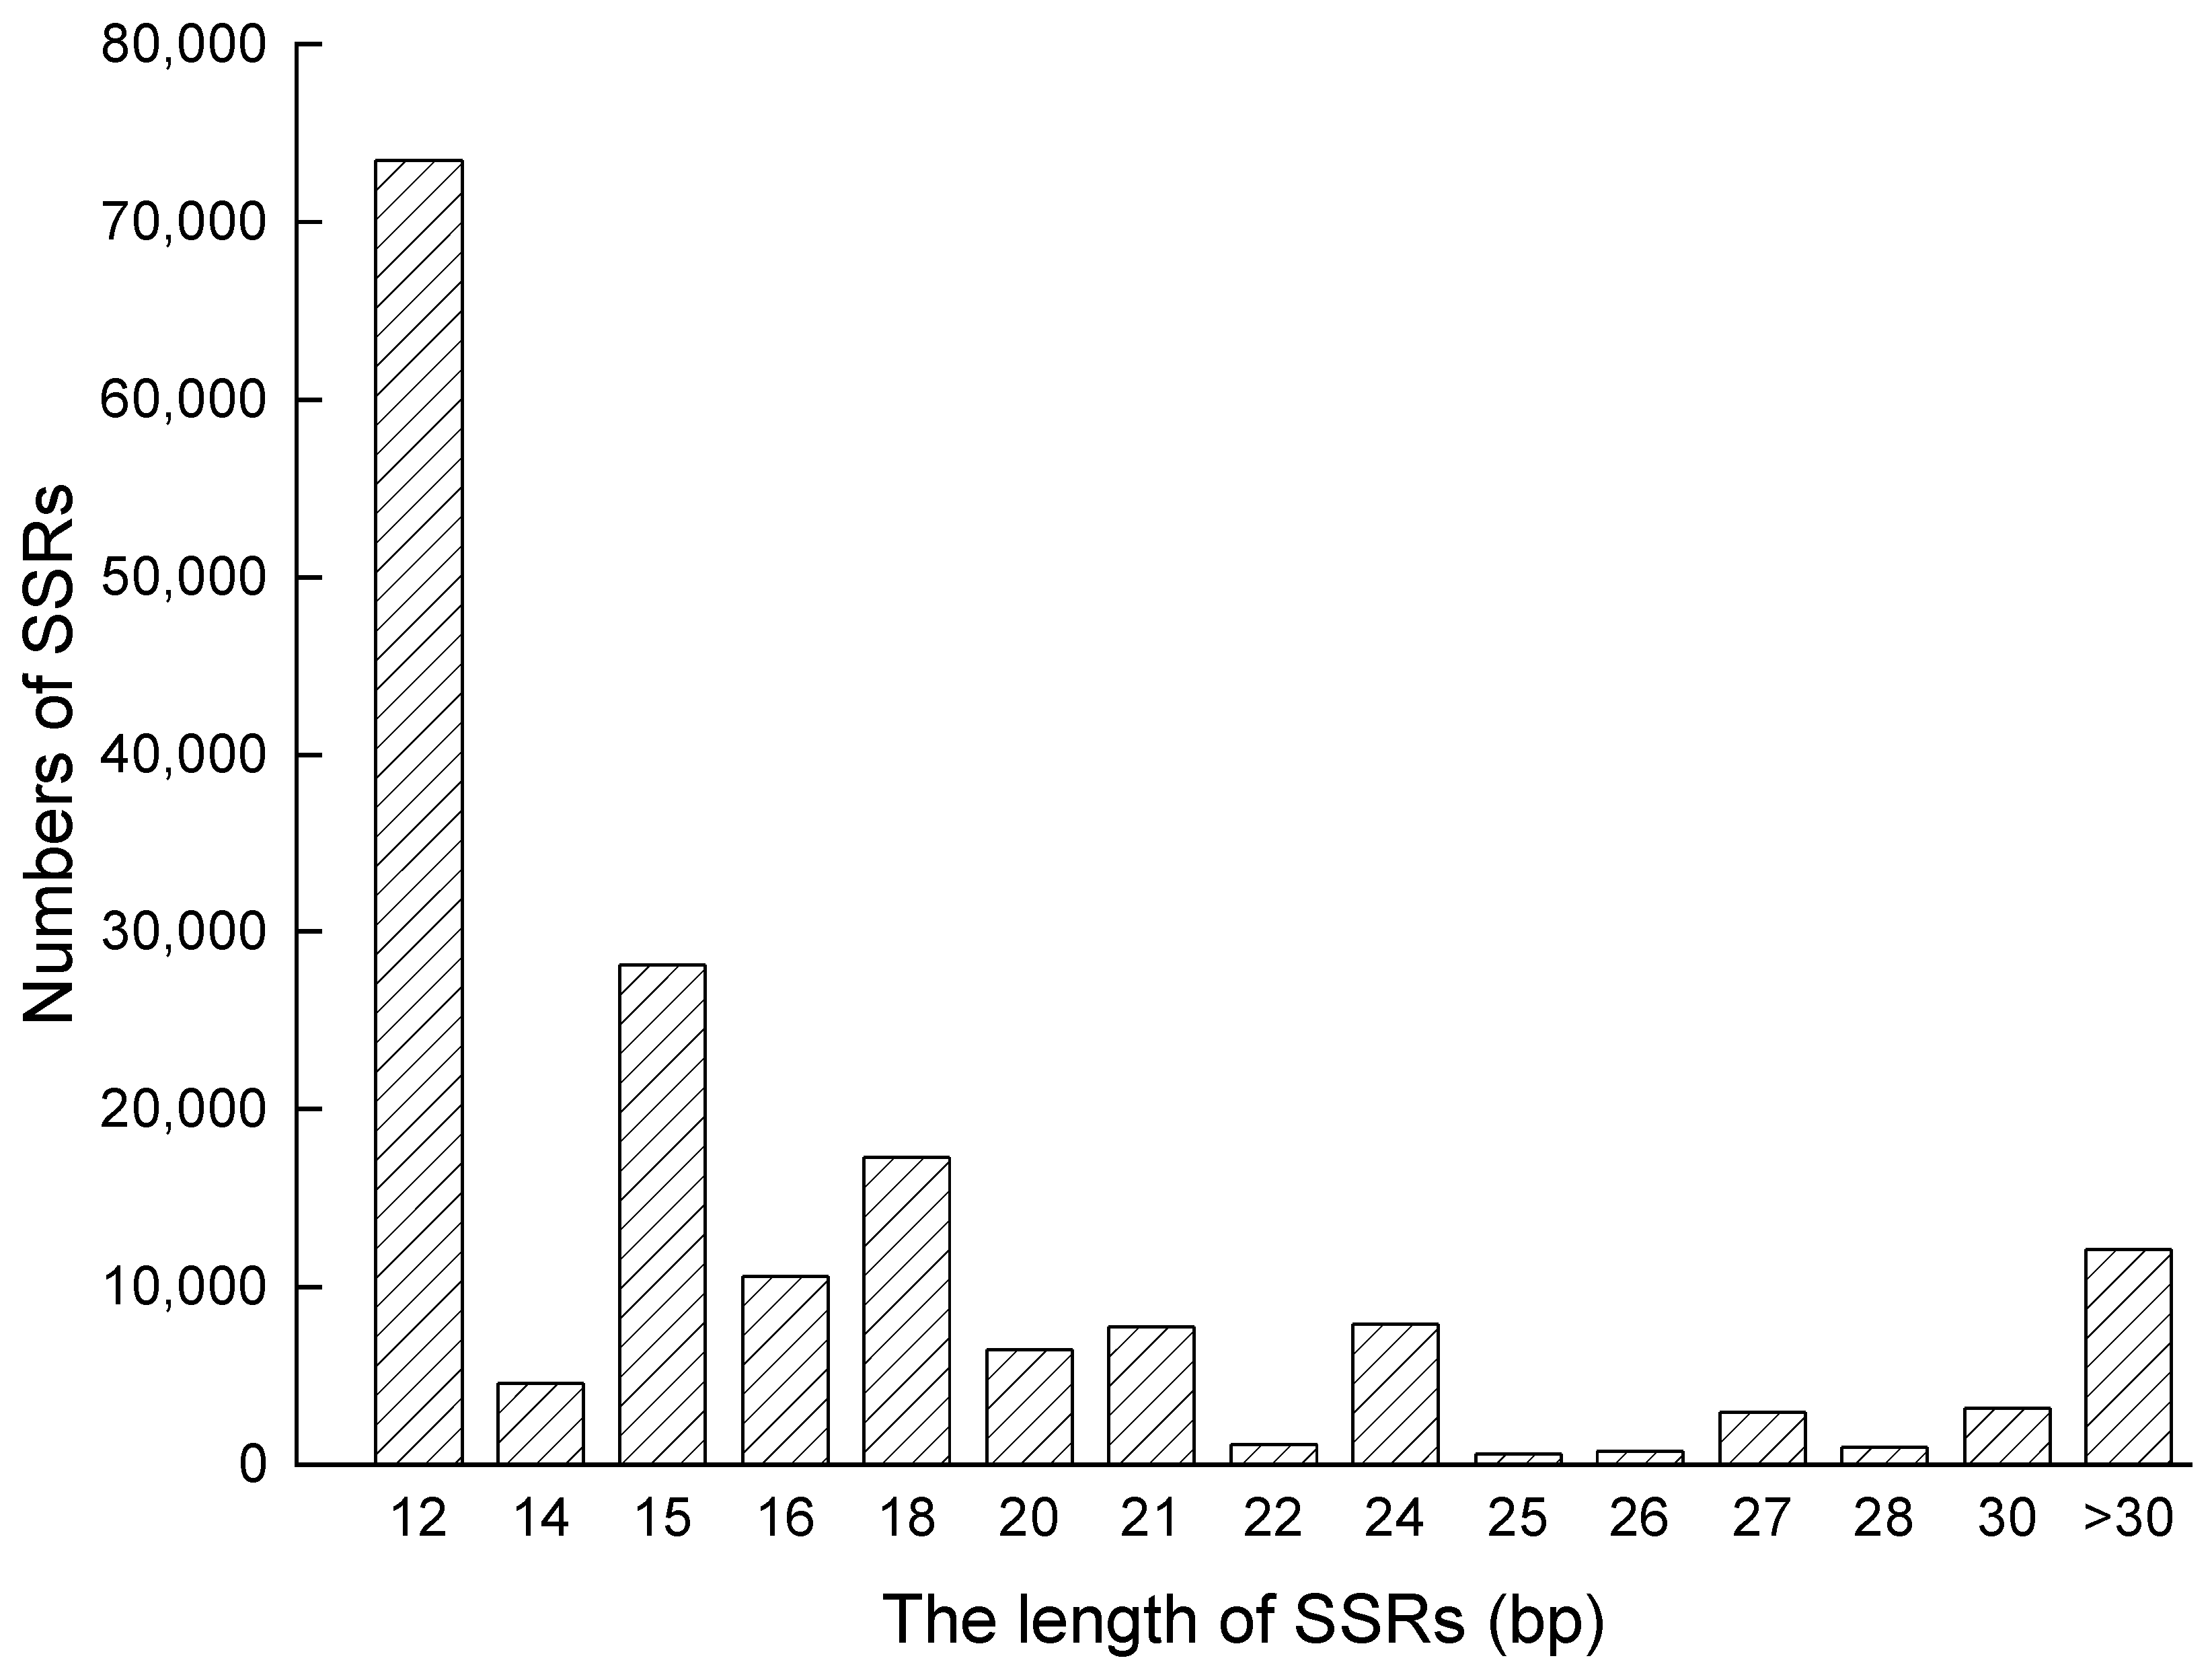
Figure 1. Length distribution of SSRs in the S. aralocaspica genome.
Plants 12 01865 g001
Figure 2. Distribution of repeat numbers of SSRs in the S. aralocaspica genome.
Plants 12 01865 g002
Figure 3. Unweighted pair group method with arithmetic mean (UPGMA) tree based on Nei’genetic distances calculated for S. aralocaspica. UPGMA circular dendrograms based on Nei’s genetic distances using Mega 6, with different colors representing different populations, population Shawan (S1–S18) in green, population Shihezi (M1–M16, M20) in pink, and population Fukang (B2–B22, missing B4, B7, B12, B17) in yellow.
Plants 12 01865 g003
Figure 4. Principal coordinate analysis of three groups of S. aralocaspica based on SSR genetic distance. The different colors and shapes represent the different populations: red diamonds for the Fukang population, green squares for the Shawan population, and blue triangles for the Shihezi population. The axis labels list the percentage of explained variance for each principal coordinate.
Plants 12 01865 g004
Table 1. Overview of SSRs in the S. aralocaspica genome.
ItemsNumbers
Total size of genome (Mb)452
Total number of identified SSRs 177,805
Total length of SSRs (bp)3,465,418
Frequency (SSRs/Mb)393.37
Density (bp/Mb)7666.85
Total content of genome SSRs(%)0.77
Table 2. SSR markers analysis of S. aralocaspica.
Repeat TypePredominant TypeNumberProportion (%)Frequency (SSRs/Mb)Total Length (bp)Average Length (bp)
DiAT25,25614.20 55.88473,87818.76
TriAAC/GTT134,66375.74 297.932,383,44617.70
TetraAAAT/ATTT11,1506.27 24.67337,51630.27
PentaAAAAT/ATTTT37712.12 8.34113,54030.11
HexaAACAAT/ATTGTT29651.67 6.56157,03852.96
Total177,805100393.373,465,41819.49
Table 3. Main motif of S. aralocaspica genome SSRs.
The Motif of RepeatRepeat NumbersTotalPercentage (%)
45678>8
AT/AT00459530652511775117,92210.08
AG/CT001594913549135944152.48
AC/GT00111062540174828841.62
AAC/GTT34,60018,32710,38354763172672878,68644.25
AAT/ATT10,890389321081243904549124,52913.80
ACC/GGT5994221796643824815510,0185.63
AAG/CTT611913384391657031784484.75
ATC/ATG4297124548121910720765563.69
ACT/AGT12294812731307323724231.36
AGC/CTG1429277763092018411.04
AGG/CCT10682629547314715500.87
AAAT/ATTT2861103745722011137550612.85
AATC/ATTG9621423484411540.65
AATT/AATT5621514728247940.45
AAAAT/ATTTT7091823810769520.54
Total70,72029,55222,69612,617819923,449167,23394.05
Percentage (%)39.77 16.62 12.76 7.10 4.61 13.19 94.05
Table 4. Genetic diversity parameters of 38 polymorphic SSR loci developed for S. aralocaspica.
LocusNNaNeIHoHeuHeFstPIC
SA-di-115242.116 1.004 0.000 0.527 0.532 0.243 0.488
SA-di-135242.392 1.007 0.808 0.582 0.588 0.100 0.517
SA-tri-245274.989 1.755 0.038 0.800 0.807 0.390 0.773
SA-tri-265263.462 1.354 0.385 0.711 0.718 0.287 0.658
SA-te-295231.702 0.730 0.173 0.413 0.417 0.261 0.369
SA-di-345042.417 1.057 0.060 0.586 0.592 0.158 0.526
SA-di-355262.973 1.294 0.019 0.664 0.670 0.548 0.609
SA-di-395252.818 1.276 0.038 0.645 0.651 0.278 0.605
SA-di-405232.000 0.791 0.038 0.500 0.505 0.198 0.408
SA-tri-415263.485 1.400 0.231 0.713 0.720 0.096 0.664
SA-tri-425242.094 0.942 0.019 0.522 0.527 0.342 0.469
SA-tri-435141.676 0.689 0.020 0.403 0.407 0.152 0.343
SA-tri-465283.634 1.553 0.212 0.725 0.732 0.314 0.69
SA-te-505282.917 1.331 0.212 0.657 0.664 0.258 0.597
SA-di-5352104.650 1.809 0.154 0.785 0.793 0.415 0.757
SA-di-545252.528 1.093 0.038 0.604 0.610 0.407 0.528
SA-di-595252.367 1.063 0.077 0.577 0.583 0.528 0.516
SA-di-615193.315 1.433 0.961 0.698 0.705 0.127 0.648
SA-di-625072.244 1.177 0.080 0.554 0.560 0.456 0.524
SA-di-6351123.605 1.655 0.412 0.723 0.730 0.209 0.69
SA-di-645265.017 1.685 0.692 0.801 0.808 0.129 0.771
SA-di-655241.405 0.596 0.135 0.288 0.291 0.160 0.272
SA-di-675284.404 1.674 0.000 0.773 0.780 0.469 0.74
SA-di-695284.265 1.697 1.000 0.766 0.773 0.027 0.734
SA-di-735262.041 1.109 0.058 0.510 0.515 0.258 0.487
SA-di-745261.992 1.014 0.038 0.498 0.503 0.338 0.464
SA-tri-775263.453 1.373 1.000 0.710 0.717 0.096 0.664
SA-tri-785172.876 1.419 0.078 0.652 0.659 0.350 0.623
SA-tri-835274.765 1.649 0.019 0.790 0.798 0.265 0.757
SA-tri-8552105.131 1.827 0.135 0.805 0.813 0.398 0.778
SA-tri-865294.122 1.671 0.173 0.757 0.765 0.297 0.727
SA-tri-885242.687 1.122 0.981 0.628 0.634 0.063 0.559
SA-te-925262.098 0.964 0.654 0.523 0.528 0.162 0.456
SA-te-935252.155 0.904 0.173 0.536 0.541 0.350 0.444
SA-te-9452123.532 1.702 0.077 0.717 0.724 0.306 0.691
SA-te-965241.528 0.691 0.019 0.346 0.349 0.105 0.323
SA-te-975241.648 0.756 0.058 0.393 0.397 0.337 0.359
SA-te-985131.922 0.711 0.020 0.480 0.484 0.128 0.374
Note: N = number of individuals sampled; Na = number of alleles; Ne = effective alleles I = Shannon information index; Ho = observed heterozygosity; He = expected heterozygosity; uHe = unbiased expected heterozygosity; PIC = polymorphism information content; Fst = fixation index.
Table 5. Population genetic characteristics based on 38 SSR loci data in three populations of S. aralocaspica.
PopNNaNeIHoHeuHeF
FukangMean16.8954.4472.6671.0850.2990.5730.5910.515
SE0.0630.2690.1550.0620.0530.0270.0280.078
ShawanMean16.9742.9211.7940.6420.2070.3650.3760.602
SE0.0260.2650.1130.0660.0610.0350.0360.109
ShiheziMean17.8952.9471.9200.7120.2280.4160.4280.571
SE0.0630.1960.1140.0560.0580.0310.0320.098
Note: N = number of individuals sampled; Na = number of alleles; Ne = effective alleles I = Shannon information index; Ho = observed heterozygosity; He = expected heterozygosity; uHe = unbiased expected heterozygosity; F= inbreeding factor.
Table 6. Nei’s unbiased measures of genetic identity for three populations of S. aralocaspica.
FukangShawanShihezi
Fukang1
Shawan0.4381
Shihezi0.5480.6541
Disclaimer/Publisher’s Note: The statements, opinions and data contained in all publications are solely those of the individual author(s) and contributor(s) and not of MDPI and/or the editor(s). MDPI and/or the editor(s) disclaim responsibility for any injury to people or property resulting from any ideas, methods, instructions or products referred to in the content.