Article

Humulus lupulus L. Strobilus Photosynthetic Capacity and Carbon Assimilation

by
William L. Bauerle
Department of Horticulture and Landscape Architecture, 1173 Campus Delivery, Fort Collins, CO 80523-1173, USA
Plants 2023, 12(9), 1816; https://doi.org/10.3390/plants12091816
Submission received: 4 February 2023 / Revised: 16 April 2023 / Accepted: 25 April 2023 / Published: 28 April 2023
(This article belongs to the Special Issue Photosynthetic Activity of Non-Primary Photosynthetic Organs)

Abstract

:
The economic value of Humulus lupulus L. (hop) is recognized, but the primary metabolism of the hop strobilus has not been quantified in response to elevated CO2. The photosynthetic contribution of hop strobili to reproductive effort may be important for growth and crop yield. This component could be useful in hop breeding for enhanced performance in response to environmental signals. The objective of this study was to assess strobilus gas exchange, specifically the response to CO2 and light. Hop strobili were measured under controlled environment conditions to assess the organ’s contribution to carbon assimilation and lupulin gland filling during the maturation phase. Leaf defoliation and bract photosynthetic inhibition were deployed to investigate the glandular trichome lupulin carbon source. Strobilus-level physiological response parameters were extrapolated to estimate strobilus-specific carbon budgets under current and future atmospheric CO2 conditions. Under ambient atmospheric CO2, the strobilus carbon balance was 92% autonomous. Estimated strobilus carbon uptake increased by 21% from 415 to 600 µmol mol−1 CO2, 14% from 600 to 900 µmol mol−1, and another 8%, 4%, and 3% from 900 to 1200, 1500, and 1800 µmol mol−1, respectively. We show that photosynthetically active bracts are a major source of carbon assimilation and that leaf defoliation had no effect on lupulin production or strobilus photosynthesis, whereas individual bract photosynthesis was linked to lupulin production. In conclusion, hop strobili can self-generate enough carbon assimilation under elevated CO2 conditions to function autonomously, and strobilus bracts are the primary carbon source for lupulin biosynthesis.

1. Introduction

The atmospheric CO2 concentration is predicted to rise to approximately 500 ppm, reaching 600 ppm and 700 ppm by 2060 and 2075 [1] (pp. 673–816). Elevated atmospheric CO2 concentrations can increase a plant’s photosynthesis rate. Most studies of the mechanisms by which plants respond to environmental conditions, such as elevated atmospheric CO2, focus on leaves and overlook other green plant organs [2]. It has been shown that extra photosynthetic plant organs, such as the bracts found in abundance in Humulus lupulus L. (hop), are a source of assimilated carbon on the ecological and agricultural scales [2,3,4,5,6].
Like leaves, bracts contain chlorophyll and share similarities with leaf morphology and anatomy. However, bract surface area on the plant scale is frequently negligible in comparison to leaves. Hops are an exception, producing upwards of 80 superimposing bracts per strobilus, typically called a hop cone, during the generative growth phase. Each bract on the strobilus is accompanied by two adjacent considerably smaller bracteoles (secondary bracts) [7,8]. The hop bracts and bracteoles’ primary function is to subtend a small flower and glandular trichomes (micro-organs), which are concentrated at the base of each bract. Hop anatomical features are illustrated in Neve [7]. Although a few glandular trichomes exist elsewhere on hop vegetation (e.g., leaves), the bract contains the vast majority. The preponderance of glandular trichomes on bracts indicates that bracts could contribute a significant amount of carbon to their development, analogous to the bracts on cotton bolls [6].
To date, a literature survey reveals a single study on hop strobilus carbon assimilation [9]. Fifty years ago, ambient CO2 concentrations were approximately 28% lower, at 325 ppm vs. 416 ppm [1]. Consequently, the extent to which hop bract and bracteole photosynthetic activity responds to current and/or elevated atmospheric CO2 is not known. It may be that the strobilus can function autonomously regarding carbon accumulation, where bracts play a significant role in supplying carbohydrate to hop glandular trichomes, commonly known as ‘lupulin glands’. Studies designed to investigate this possibility have not been conducted.
Hop bracts can photosynthesize, and stomata exist on both the adaxial and abaxial surface [9]. The bract surface resembles leaf stoma distribution [10], though approximately 95% fewer stoma exist per surface area in two-sided amphistomatic bract anatomy as compared to on hypostomatic hop leaves [9]. Regardless, the hop bracts that comprise the strobilus contain everything that is of value to beer, predominantly lupulin gland resins, simply termed lupulin. Lupulin consists of a combination of essential oils and alpha and beta acids, which constitute the flavor and fragrance ingredients in beer. The lupulin accumulates during the strobilus maturation stage of the hop fruiting cycle. During this phase, hop strobili amass approximately half of the total aboveground dry matter [7,8]. Strobilus carbon assimilation, crucial to lupulin biosynthesis for beer production, thus warrants further investigation.
Understanding hop strobilus responses to CO2 and light would provide insight into their carbon assimilation, autonomy, and response to future and controlled-environment CO2 and light conditions. In the present study, we focused on strobilus carbon exchange responses to CO2 and light, two growth variables that change spatially and temporally. We hypothesized that under enriched CO2 and supplemental light conditions, strobilus function autonomously with respect to carbon assimilation. Simultaneously, we tested a second hypothesis that bracts autonomously generate carbohydrates for lupulin biosynthesis. By isolating individual bract lupulin gland development, bract-generated carbon for lupulin was separated from leaf-derived.

2. Results

2.1. Strobilus Gas Exchange

Net Photosynthesis Versus CO2 and Photosynthetically Active Radiation

Replicate strobilus net photosynthesis (An) values per intercellular CO2 (Ci) concentration and photosynthetically active radiation (PAR) levels were not different between the four measurement intervals (two-tailed t-tests; p > 0.16–0.8 and p > 0.23–0.84). Maximum Rubisco carboxylation rate (Vcmax) and light compensation point (Lc) values were also stable across the four collection intervals. Figure 1 shows the increase in An, with increases in estimated Ci for hop strobili. Ci estimates above 1500 μmol mol−1 showed increases in An variation. Nonetheless, strobilus CO2 saturation was still not achieved at 1900 ppm atmospheric CO2 (Figure 1). Carboxylation limited by the regeneration of inorganic phosphate requires a good estimate of the potential electron transport rate. Due to a lack of CO2 saturation in our An/Ci response curves, we do not report electron transport (Anj) or inorganic phosphate supply (Anp).
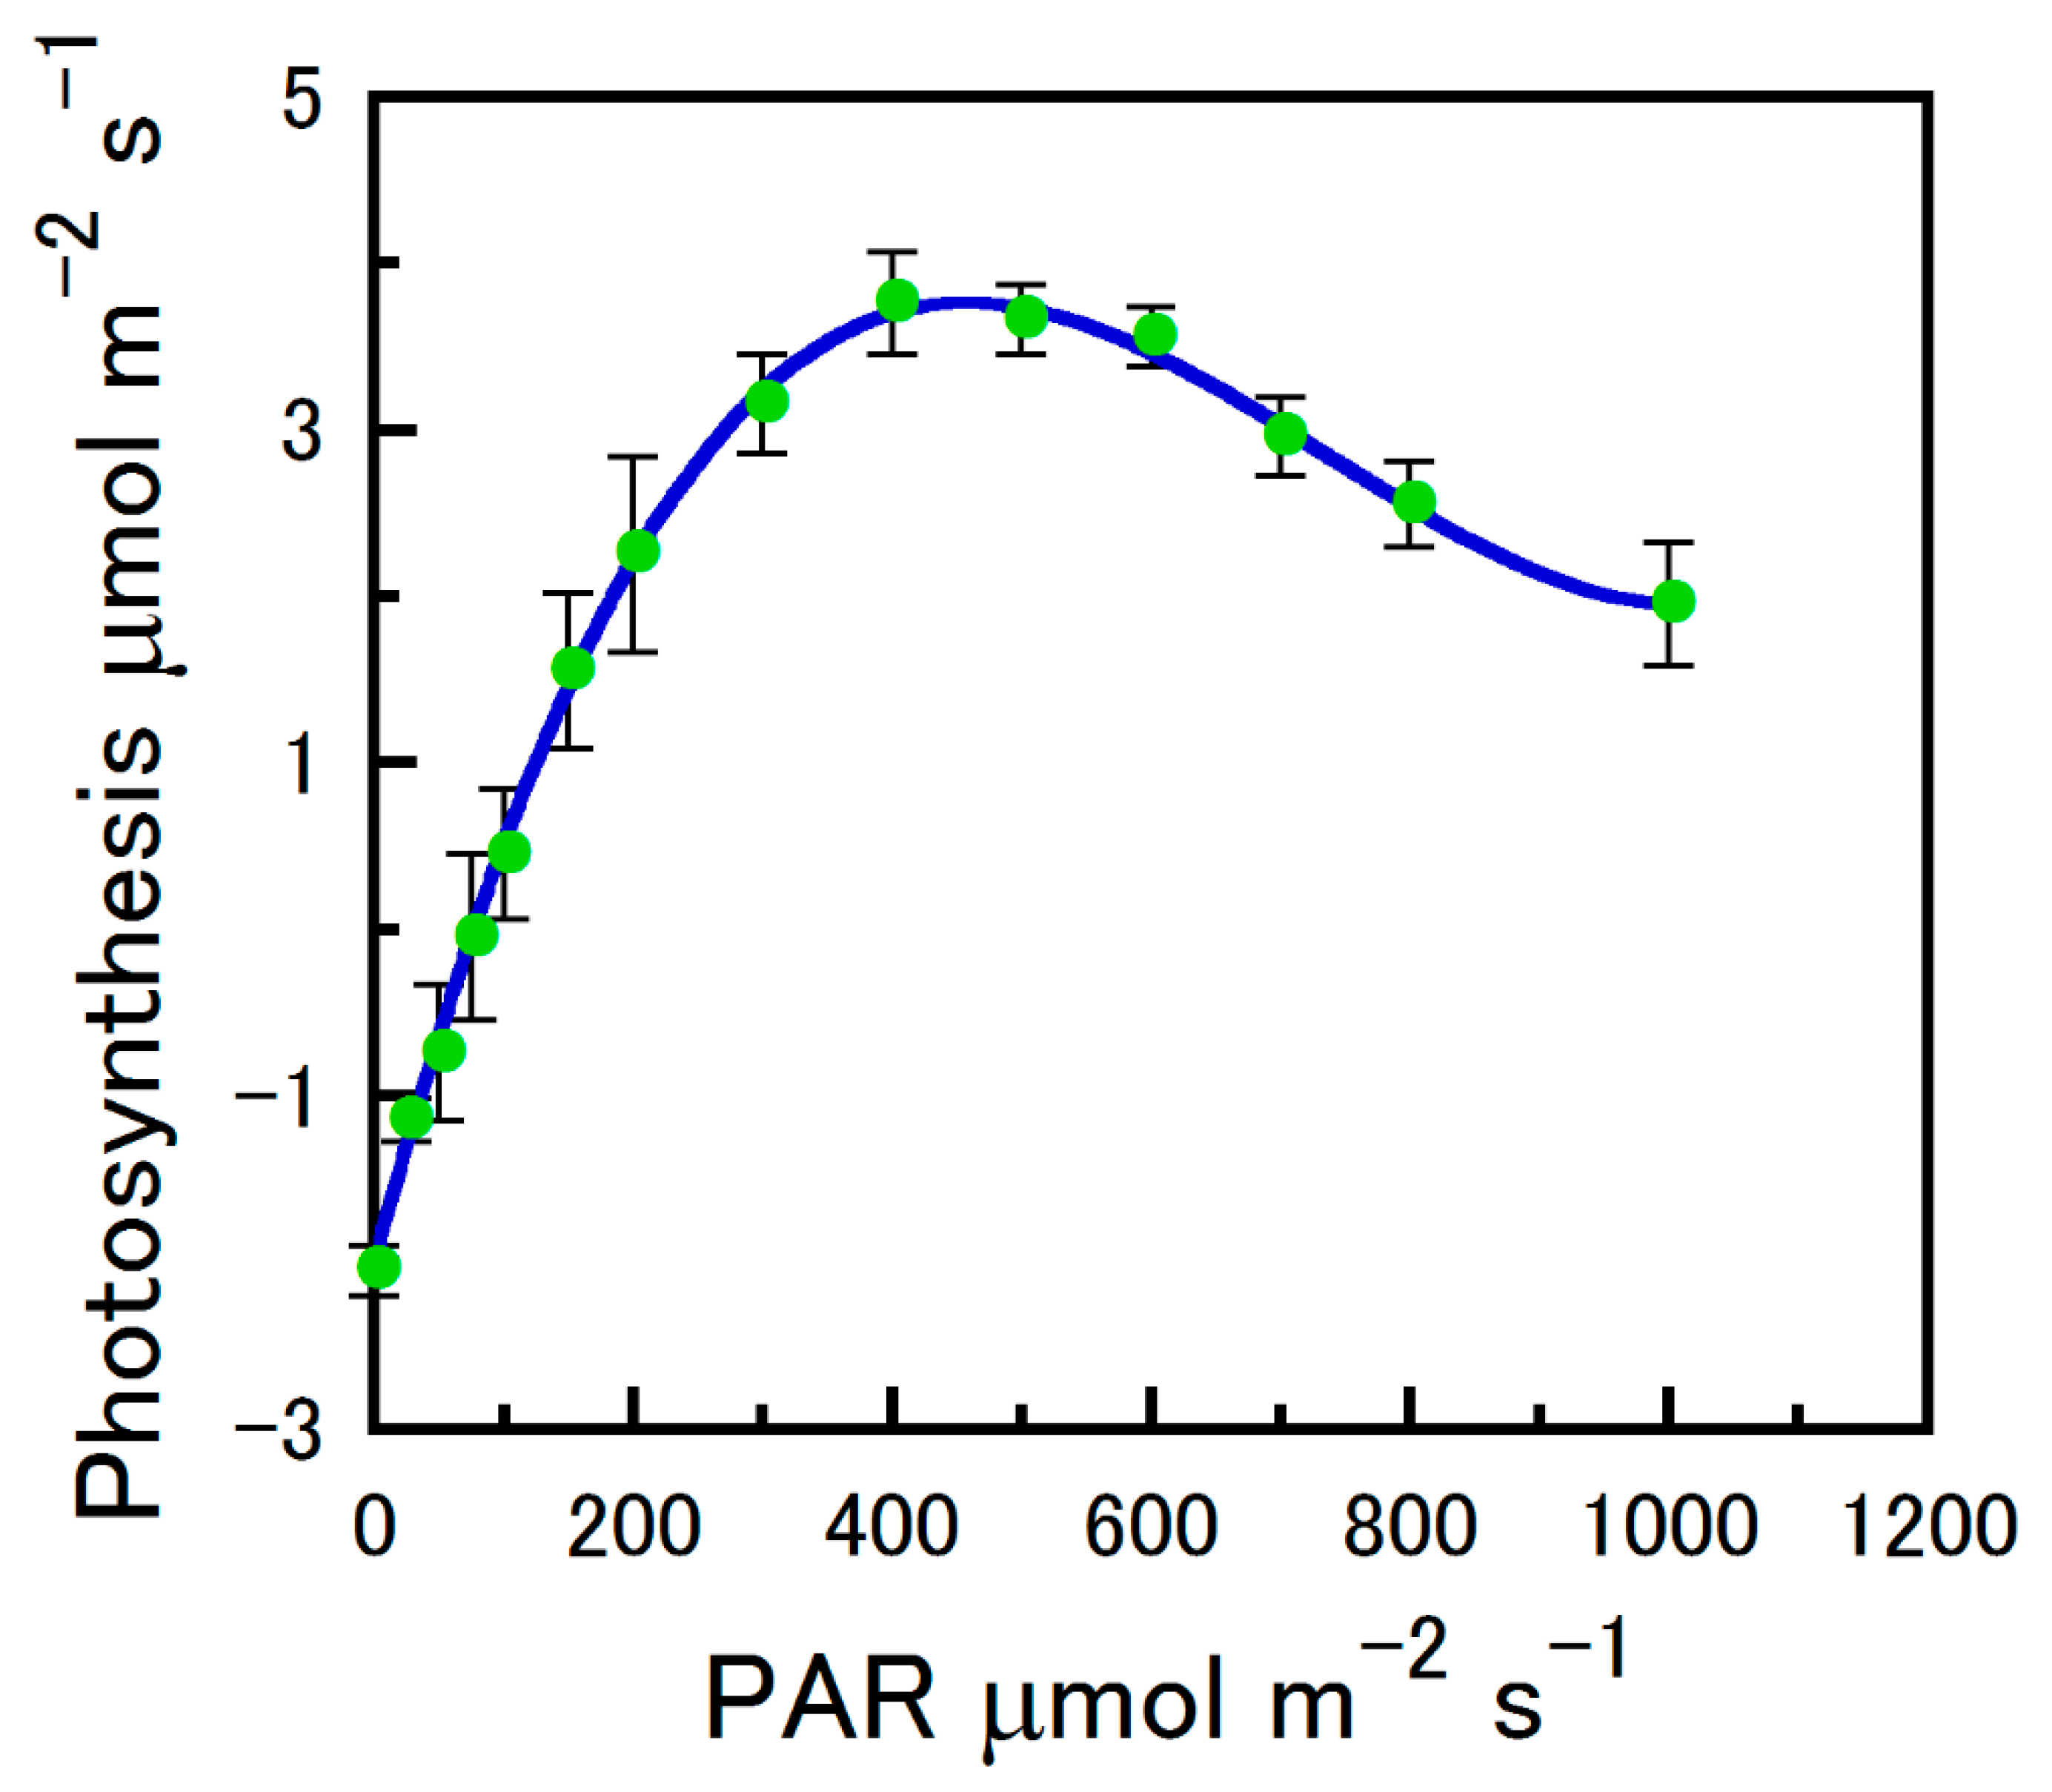
Compared to leaves, strobilus light saturation (Ls) occurred at 341 as opposed to 612 µmol m−2 s−1 (Table 1) [11]. It is probable that high light intensity reduces bract Vcmax in hop strobili. In our measurements, PAR above 600 µmol photons m−2 s−1 reduced An (Figure 2). Although we avoided this phenomenon by exposing strobili to light saturation at PAR below 600 µmol m−2 s−1 during the construction of our An/Ci curves, supraoptimal light effects could take place in outdoor conditions. For example, 500 µmol m−2 s−1 PAR represents approximately 25% of the sun intensity on the Earth’s surface. We discovered that approximately 400 µmol m−2 s−1 PAR is sufficient to achieve strobilus Ls and that levels higher that 600 µmol m−2 s−1 PAR can decrease An (Figure 2).
We observed a strobilus Lc approximately three times higher than that of leaves (76.7 vs. 26 µmol m−2 s−1 PAR) (Table 1) [11]. Light-saturated photosynthetic rate at ambient atmospheric CO2 (415 μmol mol−1) (Amax), on the other hand, was approximately four times lower in strobilus bracts under current ambient CO2 concentrations as compared to leaves (4.2 vs. 17.3 µmol m−2 s−1) (Table 1) [11]. Likewise, strobilus mean quantum yield (ϕ) was half that observed in leaves of the same cultivar (Table 1) [11]. Dark respiration (Rd) was slightly higher in strobilus as compared to leaf tissue (−2.1 vs. −1.7 µmol m−2 s−1) (Table 1) [11]. The CO2 compensation point (Γ) was higher than values generally observed in C3 leaves (Table 1) [11].

2.2. Diurnal Carbon Balance Estimates

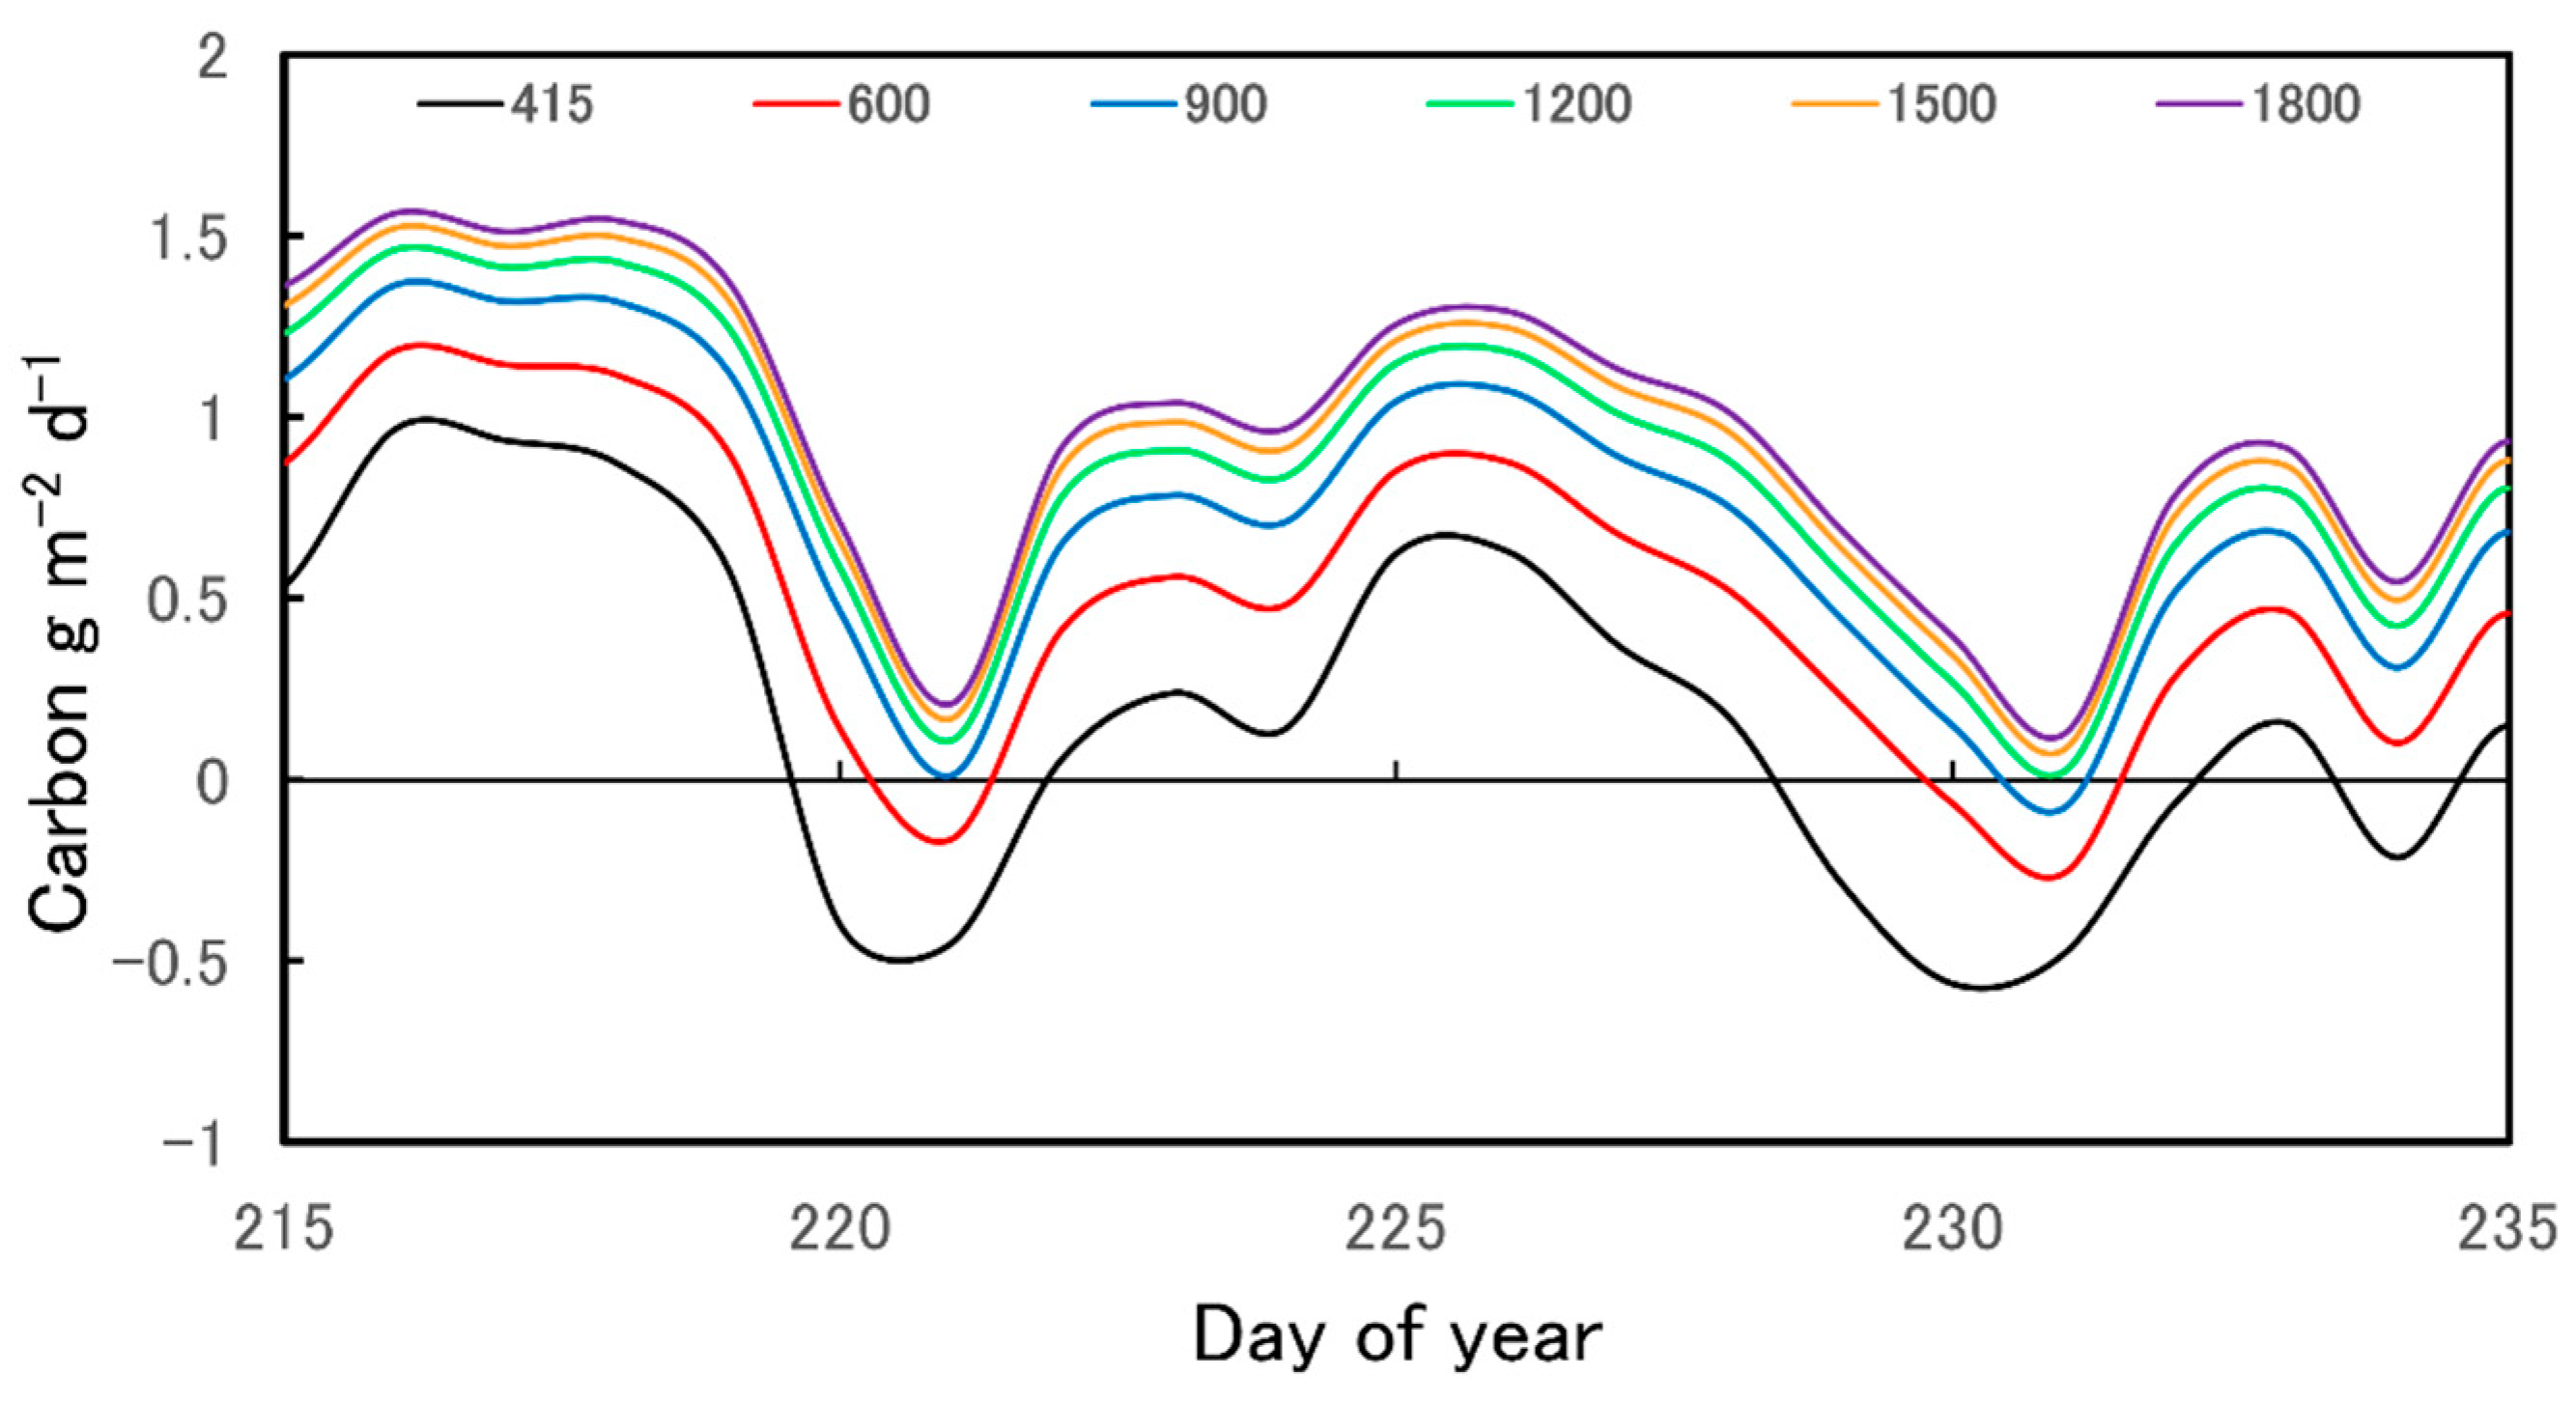
Figure 3 illustrates summed 30 min diurnal strobilus carbon estimates of net daily carbon per strobilus surface area, as described in Section 4.6. Apart from our strobilus gas exchange measurements not encompassing the earliest growth stage, we discovered that strobili exposed to 2022 Yakima, WA, weather variables maintain a close to autonomous carbon balance over the course of 30 days prior to harvest (e.g., Figure 3). On average, strobili generated 92% of their own carbon over the course of 30 days prior to harvest. The daily carbon uptake of strobili exposed to Yakima, WA, 2022 weather conditions at atmospheric CO2 of 600 μmol mol−1 increased (Figure 3). At 600 μmol mol−1, strobili generated 113% of their net carbon balance. Likewise, carbon uptake increased at atmospheric CO2 of 900, 1200, 1500, and 1800 μmol mol−1 (Figure 3). This resulted in a positive carbon balance of 128%, 136%, 140%, and 143% of net strobilus carbon supply, respectively.

2.3. Leaf Defoliation and Bract Carbon Assimilation Interruption

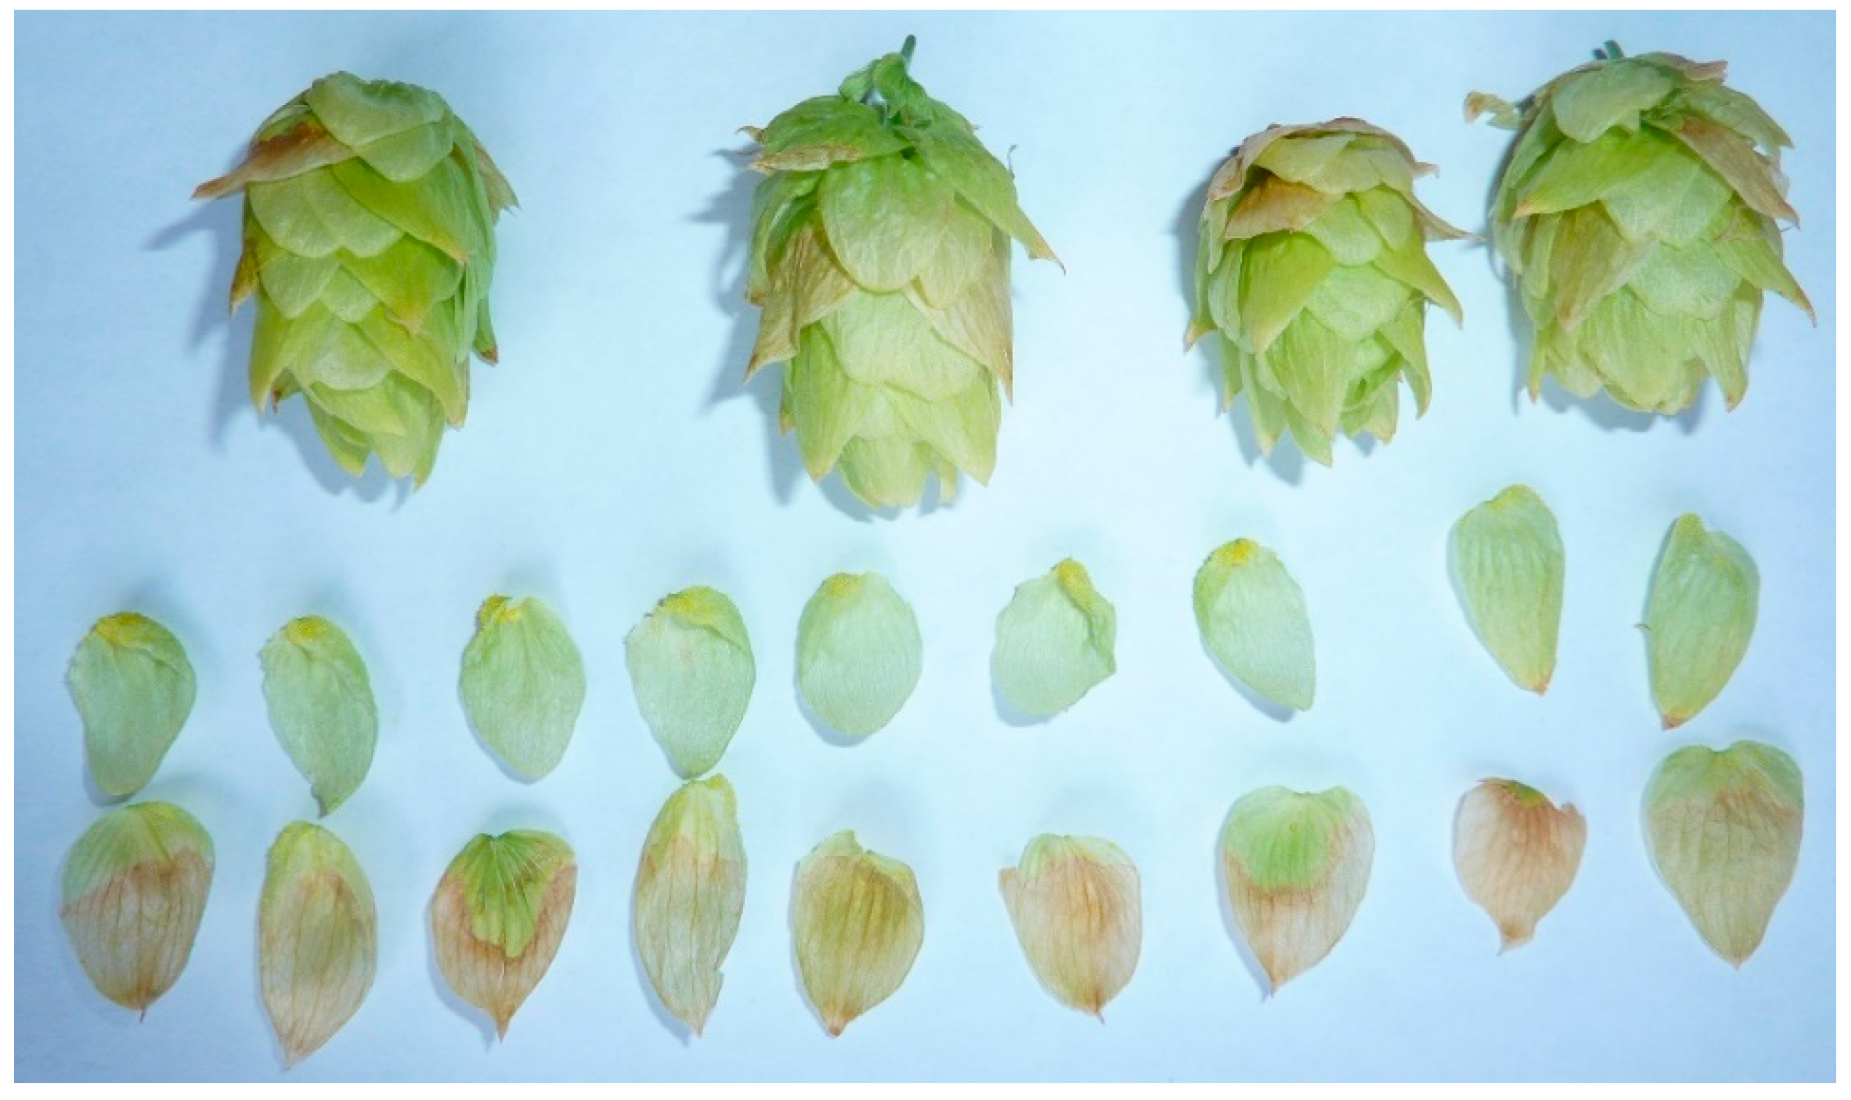
To test whether lupulin metabolite production in hops can be explained by a specific photosynthetic source, we removed all the hop leaves after the plants transitioned into reproduction and separately blocked bract photosynthesis from accepting electrons from photosystem I (PSI) via herbicide application. Defoliation did not affect strobilus photosynthetic activity or lupulin production. Blocking bract photosynthesis, to isolate the bract as the sole remaining photosynthetic organ within the strobilus, did prevent lupulin glands from filling. Lupulin glands were amassed approximately equally at the base of each bract in both treatments. Bracts that were not treated yet resided on the same strobilus as some with herbicide treatment filled their basal lupulin glands normally with no visual signs of chlorophyll degradation. Herbicide-treated bracts, however, visually expressed tissue mortality at the site of herbicide contact and failed to fill their lupulin glands (Figure 4). We note that the base of each bract was purposefully not treated with herbicide so as not to injure lupulin glands. Although lupulin glands were present in equal numbers on treated and untreated bracts, glands on bracts treated with herbicide did not fill with lupulin, whereas the glands on untreated bracts of the same strobilus filled (Figure 5). Our results indicate that there is a link between bract photosynthetic electron transport and lupulin biosynthesis, providing indirect support that the bract organ is the primary carbohydrate source of lupulin (Figure 5).

3. Discussion

Architecturally and geometrically, the hop strobilus arranges the bract leaf-like organs around a cylindrical axis. The arrangement is one of the most compact that can be achieved when positioning lateral leaf-like organs around a cylindric axis. This configuration not only wholly exposes the strobilus surface area to environmental resources, such as light, but it also allows for two strobilus photosynthesis CO2 sources: external atmospheric CO2 and internal CO2 released from organ respiration. Aschan and Pfanz [12] show that effective internal re-fixation of CO2 released from respiratory reactions supplements external atmospheric CO2 in extra photosynthetic plant organs [12]. Hop strobili are likely no exception due to the presence of stomata on both the bract adaxial and abaxial side [9]. Respiratory CO2 released within the strobilus would result in enrichment above ambient atmospheric conditions, resulting in a shift in the atmospheric CO2 to O2 ratio, which would reduce the O2 inhibition of carboxylation and photorespiration [13,14]. Although bracts possess fewer stomata per unit area compared to leaves [9], their thickness is substantially less than that of leaves. In fact, hop bracts are moist photosynthetic semi-translucent leaf-like structures (Figure 5). CO2 is very soluble in water and can quickly diffuse through moist permeable membranes. For example, as compared to other gases with significantly lower molecular weight (e.g., helium or hydrogen) CO2’s high solubility in water allows it to diffuse faster through moist membranes.
The net photosynthetic contribution of green reproductive organs to their carbon budget depends on ambient environmental conditions. However, substantial amounts of their carbon requirement can be fixed in situ [15,16]. On a chlorophyll basis, studies on green plant reproductive structures have shown a 1–3 times higher photosynthetic assimilatory capacity as compared to leaves of the same plant species [17,18,19,20,21]. However, the photosynthetic rates and stomatal densities of reproductive organs tend to be lower than those of leaves [2]. In 1970, with ambient atmospheric CO2 concentrations of approximately 325 ppm, Peat and Thomas [9] found hop cones ≥ 16 days of age to be capable of partly replacing respiratory losses. Measuring similarly aged strobilus, our An results match the findings of Peat and Thomas [9]. Measured at current ambient atmospheric concentrations (415 μmol mol−1 CO2), we found strobili to be capable of counterbalancing 92% of respiratory loss over the course of the month prior to strobilus harvest. When exposed to elevated CO2 concentrations, the strobilus carbon budget became positive, thus indicating a strong photosynthetic sugar-producing role in the later stage of the hop strobilus. Similar to prior studies on other reproductive structures, we found that the carbon cost in terms of a strobilus carbon balance may be fully compensated for by increasing photosynthetic rates of the reproductive structure [2,22,23]. Though leaves cannot be ruled out as a carbon source for strobilus development at the onset of the reproductive stage, leaves showed clear signs of senescence during the strobilus generative phase, whereas strobilus photosynthetic capacity did not decline during the hop flowering phase [24]. This indicates that under optimal environmental conditions, strobili can function autonomously with respect to carbon assimilation in the latter phase of the hop growing cycle.
Reproductive structure photosynthesis is common and can provide a source of assimilated carbon on the ecological and agricultural scales [2,3,4,5,6,25]. Under certain environmental conditions, we found strobilus photosynthesis to be capable of counterbalancing respiratory loss, which would decrease the carbon cost of the reproductive structure to the remaining portion of the plant. Moreover, the photosynthesis derived from the strobilus can generate significant amounts of photoassimilates, akin to the large body of evidence for other reproductive organs [2,12]. The hop strobilus is developed in the late stage of the growth cycle. Therefore, its younger photosynthetic machinery can remain photosynthetically active when older leaves have started to senesce (e.g., [26]). Compared to leaves, strobilus PAR Ls was >100 μmol m−2 s−1 lower, whereas the Lc was approximately two times higher [11]. Leaf and strobilus respiration rates were similar, but strobilus Vcmax decreased by approximately 71% and Γ increased by 43% [11]. Nonetheless, generating a source of carbon from photosynthesis when other source tissue, such as leaves, are senescing allows the strobili to positively contribute to the carbon requirement of reproduction.
Generative-phase defoliated versus leaf-intact plants showed no indication of an influence on trichome gland filling. This suggests that the bracts on strobili can compensate for the loss of sugars from leaves. In contrast, individual bract carbon assimilation interruption versus non-interruption had a clear influence on trichome gland filling. It was proposed that lupulin glands primarily synthesize hop bitter acids [27,28,29]. Due to glandular trichome lupulin accumulation in control bracts and the lack thereof in photosynthetically inhibited bracts, it appears that lupulin biosynthesis may be primarily dependent on bract as opposed to leaf carbon supply. This indicates that glandular trichome lupulin biosynthesis is linked to bract carbon assimilation. It may be that during the generative phase, the hop bine and laterals take on a fundamentally different purpose, mostly functioning as structural support and a pathway for water and nutrient transport [2,30]. In so doing, bine and lateral vegetative structures in the later strobilus development stages would primarily function to spatially disperse strobili throughout the crown to minimize their environmental resource competition, such as light foraging.
The consolidation of carbon-generating and reproductive parts within a strobilus inflorescence may optimize carbon partitioning. In addition, fewer stomata are required due to the higher level of carbon re-fixation from respiratory CO2 permeating the bract membrane. In this situation, a reduction in stomatal densities can increase water-use efficiency without a substantial reduction in photosynthetic capacity [31]. Given that hop bracts contain the majority of hop glandular trichomes, it would make sense that bracts provide a portion, if not all, of the carbon to biosynthesize lupulin. In fact, active sinks, such as trichomes, are generally fed by the nearest carbon source [32]. We found that the bract-intensive strobilus possessed a strong capacity to photosynthesize, and provided significant assimilatory products to lupulin under enriched CO2 conditions. In addition, strobili bracts showed a lower light saturation as compared to leaves [11]. Future research should investigate strobili chlorophyll fluorescence responses to PAR to possibly explain the observation that supraoptimal PAR lowered An.
In summary, we assessed the link between individual bract photosynthesis and lupulin biosynthesis. The results show unequivocally that the photosynthetic activity of the hop strobilus can maintain a high proportion of the hop plant’s fitness in the later generative phase of the hop. As atmospheric CO2 concentrations rise, autonomy of hop strobili could progress further, and one would expect moderate elevations in external CO2 concentrations to increase the strobilus carbon supply. However, the carbon gains may be offset by elevated respiration in the face of rising atmospheric temperatures. Nonetheless, our gas exchange results indicate that under current ambient CO2 conditions, mature hop strobili can function close to carbon autonomy in the early fall (August) weather of Yakima, WA [33]. Diurnally, the strobilus assimilation gain during daylight nearly counterbalanced the respiratory CO2 release in the dark at current ambient CO2 concentrations. At CO2 concentrations above ambient, the data presented show that ripening hop strobili are capable of a significantly higher proportion of carbohydrate generation.

4. Materials and Methods

4.1. Plant Material

Research experiments were conducted at the Colorado State University (CSU) Horticulture Center in Fort Collins, Colorado. Over the course of the study, female tissue culture-propagated plantlets were used (Summit Plant Labs Inc., Fort Collins, CO, USA). The public variety ‘Centennial’ was selected due to the representative genetic hop parentage (Brewers Gold + Fuggle + East Kent Golding + Bavarian) [34]. Centennial is ‘ripe to flower’ when ≥ 20 nodes are visible [7,35].
Plantlets were transplanted into 11 L bato buckets containing 100% horticulture-grade perlite. Plant spacing, irrigation, fertilization, and cultural growing condition procedures are outlined in Bauerle [36]. One bine per container was trained to a vertical net trellis at approximately 0.5 m bine length. We note that although there is not a ‘standard’ bine spacing per unit area for hops, the plant density in this study equated to 10,764 bines per ha−1, which is a plant density similar to manual field hop production [8]. Initially, all pots were watered to saturation and permitted to drain for 18 h. Thereafter, container moisture capacity was maintained daily. White plastic sheeting was cut and placed on the substrate surface to eliminate evaporation.

4.2. Environmental Conditions

Top lights and interlighting bars (suspended horizontally at 150 and 210 cm) (GreenPower LED®, Philips Lighting, Amsterdam, The Netherlands) provided supplemental photosynthetically active radiation (PAR) per plant row (100–700 umol m−2 s−1 during photoperiod). Day length was controlled at 18 and 15 h during the vegetative and generative phases. Controllers were programmed to permit the maximum amount of light penetration (shade cloth was only pulled when intense solar radiation and temperatures demanded additional cooling efforts), and daytime ambient PAR at the canopy surface was generally 800–1100 µmol m−2 s−1. Greenhouse conditions were programmed to a set point air temperature of 26 °C during the photoperiod and 20 °C during the dark period with a 45 min temperature step change between the two. Daytime temperatures over the experimental period averaged 26.4 °C, but in some instances, temperatures climbed higher despite continuous cooling. Supplemental humidity was provided via an evaporative cooling pad and the daytime saturation vapor pressure deficit (VPD) averaged 1.9 kPa. Air temperature and relative humidity (RH; %) were measured using EHT RH/temperature sensors mounted at the top of the canopy (Meter Devices, Pullman, WA, USA) and PAR using two quantum line sensors placed parallel to the north/south row orientation adjacent to the plant stems (model LI191R, Li-Cor Inc., Lincoln, NE, USA). A third quantum line sensor was placed 0.5 m above the canopy. The line sensors sampled PAR every minute and then recorded a 15 min average (CR10x; Campbell Scientific, Logan, UT, USA).

4.3. Strobilus Gas Exchange and Light Absorption Measurements

To examine the photosynthetic capacity characteristics, six replicate plants, located in the center of the plot, were sampled for strobilus gas exchange traits. Sixteen days after anthesis, ten-day interval repeated measurements began on fully expanded strobili using a portable gas exchange system (CIRAS-2, PP Systems, Haverhill, MA, USA). A PP Systems environmentally controlled conifer branchlet cuvette (Model PLC5 (C)) was used to measure whole strobili. PAR was controlled with a full-spectrum light-emitting diode and temperature by means of Peltier elements fitted with heat sinks and fans (Model PLC5 (C), PP Systems, Haverhill, MA, USA). The measurements were performed at a controlled VPD of 1.5 kPa and temperature of 25 °C. A preliminary experiment indicated An stability after 10 min per CO2 change and five minutes per PAR change.
Response curves of net photosynthesis (An) versus [CO2] (An/Ci) and PAR (An/PAR) were repeated four times at ten-day intervals. For the An/Ci curves, strobili were initially acclimated in the chamber until An was stable at a controlled CO2 concentration (415 μmol mol−1) and light level (400 μmol m−2 s−1). The CO2 response curve was constructed at CO2 levels of 415, 300, 200, 150, 100, 50, 25, 415, 600, 800, 1000, 1200, 1500, and 1900 μmol CO2 mol−1 with 10 min of stabilization per CO2 change. After the completion of the An/Ci curve, CO2 concentration was controlled at 415 μmol mol−1 until stabilization, and PAR was sequentially lowered to 1000, 800, 700, 600, 500, 400, 300, 200, 150, 100, 75, 50, 25, and 0 μmol m−2 s−1 with five minutes of stabilization per PAR change.
Immediately after gas exchange, five replicate light absorptance samples were recorded per strobilus on random bracts within the strobilus with an SPAD meter and averaged (model 502B, Minolta Inc., Ramsey, NJ, USA). The SPAD values were used to correct apparent quantum yield (ϕa) to ϕ, as described in Bauerle et al. [37]. For photosynthesis calculations, surface bract area (BA) per hop strobilus was measured and calculated as the total surface area of a cone:
BA = πr (r + l),
where radius (r) and slant height (l) account for the area of the cylinder base and the cone. (R2 = 0.968, n = 5; unpublished data).

4.4. An/Ci Curve Fitting

The model of Farquhar, von Caemmerer, and Berry [38] was used to estimate the maximum Rubisco carboxylation rate (Vcmax) under light saturation due to the capability of estimating in vivo Rubisco activity. The An/Ci data were analyzed as per the fitting method “fitaci” function of the “plantecophys” package [39] according to Wullschelger [40], where the minimum of any of the three factors Rubisco activity (Anc), electron transport (Anj), and inorganic phosphate supply (Anp) can limit CO2 assimilation, as summarized in von Caemmerer et al. [41]
An = min (Anc, Anj, Anp),
The partial pressure of CO2 in the chloroplast at which photorespiratory CO2 evolution equals the rate of carboxylation (Γ*; 38.6 umol m−2 s−1) at 25 °C and 21% O2 was as in von Caemmerer et al. [42], assuming an average atmospheric pressure of 847 mbar in Fort Collins, Colorado. The Γ was calculated from the fitted curve.

4.5. An/PAR Curve Fitting

Photosynthesis versus PAR data were fitted to the nonrectangular hyperbola model of Prioul and Chartier [43], as described in Parsons et al. [44]
A n = ϕ a   PAR + A max ( ϕ a   PAR + A max ) 2 4   ϕ a   PAR   ø   A max / 2 ø R d
where Amax is the light-saturated net photosynthetic rate, ϕa is the apparent quantum yield of assimilation, ø is the convexity of the curve, and Rd is the respiration rate. The parameter ϕa was calculated through linear regression analysis on the initial slope from 20–125 μmol m−2 s−1 to exclude the Kok effect region (≤20 μmol m−2 s−1) [45] and prevent ϕa underestimation from data in the non-linear region (≥125 μmol m−2 s−1) [46]. The light compensation point (Qc) was estimated from the intersection of the regression line with the x-axis (An = 0), and Rd was measured at the end of the An/PAR curve. The quantum yield for CO2 (ϕCO2) was derived from ϕa by correcting ϕa for the percentage leaf absorptance of PAR, as described in Bauerle et al. [29]. Equation (3) was fitted separately for the independent An/PAR curves (Photosyn Assistant, Ver. 1.1.2, Dundee Scientific, Dundee, UK).

4.6. Diurnal Strobilus Carbon Balance Estimates

Photosynthetic light response and An/Ci parameters were used to parameterize deterministic strobilus-level models for energy balance [47], stomatal conductance (e.g., [48,49]), and photosynthesis [38] (Table 1). A simulation of carbon gain was performed at light saturation to estimate the impacts of atmospheric elevated CO2. To place the strobilus CO2 responses in the context of strobilus diurnal carbon gain, the photoperiod was set at 15 h, the approximate day length for strobilus physiological functions in Yakima, WA, (46.6021° N, 120.5059° W) at the beginning of August (day of year 213). Half-hourly averages of incident PAR, temperature, RH, and wind speed in Yakima, WA, were downloaded from the Washington State University AgWeatherNet site. Atmospheric CO2 concentrations of 415, 600, 900, 1200, 1500, and 1800 μmol mol−1 were inputted to estimate strobilus carbon gain responses to CO2 enrichment.
Predicted strobilus carbon gain (Cg) is a direct estimate of carbohydrate biosynthesis:
Cg = (An;light − R;dark) × 12,
where An;light is the total An during the light period, R;dark is the total respiration during the dark period, and 12 is the molecular mass of C. We summed 30 min diurnal carbon estimates to arrive at net daily Cg per strobilus surface area.

4.7. Bine Defoliation and Bract Photosynthesis Interruption

To investigate the carbon source for lupulin biosynthesis on the plant scale, six replicates were randomly assigned to either the “defoliation” or “control” group. The control was left to grow normally, and the defoliation group had all leaves removed using scissors at the strobili stigma senescence stage. The strobili stigma senescence stage, described in the comprehensive strobilus developmental stage index of Kavalier et al. [50], is informative because it occurs in advance of biosecratory lupulin production (gland filling) [50]. On the strobilus scale, a photosynthetic inhibitor was used to assess the contribution of bract photosynthesis to lupulin biosynthesis. Paraquat (1,1′-dimethyl-4,4′-bipyridylium), an herbicide absorbed very quickly by leaves, was applied to random bracts at a concentration of 250 g/L via CCT2425 swabs (Chemtronics® Kennesaw, GA, USA) to inhibit electron transport and CO2 assimilation. Per strobilus, several random bracts were swabbed with Paraquat from the bract tip proceeding inward toward the strig, covering approximately two thirds of the top surface of an individual bract. Six replicate plants each per defoliation or control group were treated. Strobili were harvested upon maturity and lupulin gland secretions were visually assessed at 40× magnification on Paraquat-treated and untreated bracts per strobilus.

4.8. Statistical Analysis

The total sample size for An/PAR and An/Ci curves was six replicates (n = 6), with one strobilus per six replicate plants. Each strobilus was repeatedly measured at ten-day intervals over the course of four repeated measures (40 days). Each plant was an experimental unit treated as a replicate (n = 6). Two-tailed t-tests were used to analyze the significance between each combination of repeated time measurements. Plant response data were analyzed using SPSS (IBM Analytics, Armonk, NY, USA, www.ibm.com/analytics/ (accessed on 7 November 2022)). Differences between means were considered significant when the p value of the t-value was < 0.05.

Funding

This research was funded by the United States Department of Agriculture through the Colorado State specialty crop block grant program (135532), the Colorado State University Agriculture Experiment Station, and a financial gift from Mike Harsch and Mac McCreless.

Data Availability Statement

The data presented in this study are available on request from the corresponding author.

Acknowledgments

I would like to thank Jacob Fritz and Jennifer Shipp for their assistance with experimentation, Mike Hazlett and Daniel Oliver for plant care, Mike Hazlett for technically and mechanically controlled environmental assistance, Steve Newman for plant protection measures, and Kirsten Eilertson for statistical consultations. I thank Chandra Belassio and two anonymous reviewers for helpful comments on an earlier draft.

Conflicts of Interest

The author declares no conflict of interest.

References

  1. Canadell, J.G.; Monteiro, P.M.S.; Costa, M.H.; Cotrim da Cunha, L.; Cox, P.M.; Eliseev, A.V.; Henson, S.; Ishii, M.; Jaccard, S.; Koven, C.; et al. Global Carbon and other Biogeochemical Cycles and Feedbacks. In Climate Change 2021: The Physical Science Basis. Contribution of Working Group I to the Sixth Assessment Report of the Intergovernmental Panel on Climate Change; Masson-Delmotte, V., Zhai, P., Pirani, A., Connors, S.L., Péan, C., Berger, S., Caud, N., Chen, Y., Goldfarb, L., Gomis, M.I., et al., Eds.; Cambridge University Press: Cambridge, UK; New York, NY, USA, 2021; pp. 673–816. [Google Scholar] [CrossRef]
  2. Brazel, A.J.; Ó’Maoiléidigh, D.S. Photosynthetic activity of reproductive organs. J. Exp. Bot. 2019, 70, 1737–1754. [Google Scholar] [CrossRef] [PubMed]
  3. Tambussi, E.A.; Bort, J.; Guiamet, J.J.; Nogués, S.; Araus, J.L. The photosynthetic role of ears in C3 cereals: Metabolism, water use efficiency and contribution to grain yield. Crit. Rev. Plant Sci. 2007, 26, 1–6. [Google Scholar] [CrossRef]
  4. Redondo-Gómez, S.; Mateos-Naranjo, E.; Figueroa, M.E.; Davy, A.J. Salt stimulation of growth and photosynthesis in an extreme halophyte, Arthrocnemum macrostachyum. Plant Biol. 2010, 1, 79–87. [Google Scholar] [CrossRef] [PubMed]
  5. Pengelly, J.J.; Kwasny, S.; Bala, S.; Evans, J.R.; Voznesenskaya, E.V.; Koteyeva, N.K.; Edwards, G.E.; Furbank, R.T.; von Caemmerer, S. Functional analysis of corn husk photosynthesis. Plant Physiol. 2011, 156, 503–513. [Google Scholar] [CrossRef]
  6. Hu, Y.Y.; Zhang, Y.L.; Luo, H.H.; Li, W.; Oguchi, R.; Fan, D.Y.; Chow, W.S.; Zhang, W.F. Important photosynthetic contribution from the non-foliar green organs in cotton at the late growth stage. Planta 2012, 235, 325–336. [Google Scholar] [CrossRef]
  7. Neve, R.A. Hops; Chapman and Hall: Edmonds, UK, 1991; pp. 1–20. [Google Scholar]
  8. Rybaček, V. Hop Production; Development in Crop Science 16; Elsevier Science: Amsterdam, The Netherlands; New York, NY, USA, 1991; pp. 25–120. [Google Scholar]
  9. Peat, W.E.; Thomas, G.G. The photosynthetic activity of the developing hop cone. Ann. Appl. Biol. 1974, 76, 319–324. [Google Scholar] [CrossRef]
  10. Han, J.; Lei, Z.; Flexas, J.; Zhang, Y.; Carriquí, M.; Zhang, W.; Zhang, Y. Mesophyll conductance in cotton bracts: Anatomically determined internal CO2 diffusion constraints on photosynthesis. J. Exp. Bot. 2018, 69, 5433–5443. [Google Scholar] [CrossRef]
  11. Bauerle, W.L. Intracanopy CO2 and light interactions on Humulus lupulus L. net canopy carbon gain under current and future atmospheric CO2 concentrations. Agric. For. Meteorol. 2021, 310, 108621. [Google Scholar] [CrossRef]
  12. Aschan, G.; Pfanz, H. Non-foliar photosynthesis–a strategy of additional carbon acquisition. Flora-Morphol. Distrib. Funct. Ecol. Plants 2003, 198, 81–97. [Google Scholar] [CrossRef]
  13. Shi, X.; Bloom, A. Photorespiration: The Futile Cycle? Plants 2021, 10, 908. [Google Scholar] [CrossRef]
  14. Bellasio, C.; Beerling, D.J.; Griffiths, H. An Excel tool for deriving key photosynthetic parameters from combined gas exchange and chlorophyll fluorescence: Theory and practice. Plant Cell Environ. 2016, 39, 1180–1197. [Google Scholar] [CrossRef]
  15. Aschan, G.; Pfanz, H.; Vodnik, D.; Batič, F. Photosynthetic performance of vegetative and reproductive structures of green hellebore (Helleborus viridis L. agg.). Photosynthetica 2005, 43, 55–64. [Google Scholar] [CrossRef]
  16. Gnan, S.; Marsh, T.; Kover, P.X. Inflorescence photosynthetic contribution to fitness releases Arabidopsis thaliana plants from trade-off constraints on early flowering. PLoS ONE 2017, 12, e0185835. [Google Scholar] [CrossRef]
  17. Andrews, A.K.; Svec, L.V. Photosynthetic activity of soybean pods at different growth stages compared to leaves. Can. J. Plant Sci. 1975, 55, 501–505. [Google Scholar] [CrossRef]
  18. Luthra, Y.P.; Sheoran, I.S.; Rao, A.S.; Singh, R. Ontogenetic changes in the level of ureides and enzymes of their metabolism in various plant parts of pigeonpea (Cajanus cajan). J. Exp. Bot. 1983, 34, 1358–1370. [Google Scholar] [CrossRef]
  19. Werk, K.S.; Ehleringer, J.R. Photosynthesis by flowers in Encelia farinosa and Encelia californica (Asteraceae). Oecologia 1983, 57, 311–315. [Google Scholar] [CrossRef]
  20. Heilmeier, H.; Whale, D.M. Carbon dioxide assimilation in the flowerhead of Arctium. Oecologia 1987, 73, 109–115. [Google Scholar] [CrossRef]
  21. Smillie, R.M. Calvin cycle activity in fruit and the effect of heat stress. Sci. Hortic. 1992, 51, 83–95. [Google Scholar] [CrossRef]
  22. Leonardos, E.D.; Rauf, S.A.; Weraduwage, S.M.; Marillia, E.-F.; Taylor, D.C.; Micallef, B.J.; Grodzinski, B. Photosynthetic capacity of the inflorescence is a major contributor to daily-C-gain and the responsiveness of growth to elevated CO2 in Arabidopsis thaliana with repressed expression of mitochondrial-pyruvate-dehydrogenase-kinase. Environ. Exp. Bot. 2014, 107, 84–97. [Google Scholar] [CrossRef]
  23. Sawicki, M.; Courteaux, B.; Rabenoelina, F.; Baillieul, F.; Clement, C.; Ait Barka, E.; Jacquard, C.; Vaillant-Gaveau, N. Leaf vs. inflorescence: Differences in photosynthetic activity of grapevine. Photosynthetica 2017, 55, 58–68. [Google Scholar] [CrossRef]
  24. Kong, L.; Sun, M.; Xie, Y.; Wang, F.; Zhao, Z. Photochemical and antioxidative responses of the glume and flag leaf to seasonal senescence in wheat. Front. Plant Sci. 2015, 6, 358. [Google Scholar] [CrossRef] [PubMed]
  25. Raven, J.A.; Griffiths, H. Photosynthesis in reproductive structures: Costs and benefits. J. Exp. Bot. 2015, 66, 1699–1705. [Google Scholar] [CrossRef] [PubMed]
  26. Noodén, L.D.; Penney, J.P. Correlative controls of senescence and plant death in Arabidopsis thaliana (Brassicaceae). J. Exp. Bot. 2001, 52, 2151–2159. [Google Scholar] [CrossRef] [PubMed]
  27. Clark, S.M.; Vaitheeswaran, V.; Ambrose, S.J.; Purves, R.W.; Page, J.E. Transcriptome analysis of bitter acid biosynthesis and precursor pathways in hop (Humulus lupulus). BMC Plant Biol. 2013, 13, 12. [Google Scholar] [CrossRef]
  28. Patzak, J.; Krofta, K.; Henychová, A.; Nesvadba, V. Number and size of lupulin glands, glandular trichomes of hop (Humulus lupulus L.), play a key role in contents of bitter acids and polyphenols in hop cone. Int. J. Food Sci. Technol. 2015, 50, 1864–1872. [Google Scholar] [CrossRef]
  29. Xu, H.; Zhang, F.; Liu, B.; Huhman, D.V.; Sumner, L.W.; Dixon, R.A.; Wang, G. Characterization of the formation of branched short-chain fatty acid:CoAs for bitter acid biosynthesis in hop glandular trichomes. Mol. Plant 2013, 6, 1301–1317. [Google Scholar] [CrossRef]
  30. Kong, L.A.; Xie, Y.; Sun, M.Z.; Si, J.S.; Hu, L. Comparison of the photosynthetic characteristics in the pericarp and flag leaves during wheat (Triticum aestivum L.) caryopsis development. Photosynthetica 2016, 54, 40–46. [Google Scholar] [CrossRef]
  31. Franks, P.J.; W. Doheny-Adams, T.; Britton-Harper, Z.J.; Gray, J.E. Increasing water-use efficiency directly through genetic manipulation of stomatal density. New Phytol. 2015, 207, 188–195. [Google Scholar] [CrossRef]
  32. Denny, M.J. Translocation of nutrients and hormones. In Advanced Plant Physiology; Wilkins, M.B., Ed.; Pitman: London, UK, 1984; pp. 277–296. [Google Scholar]
  33. Hüve, K.; Bichele, I.; Ivanova, H.; Keerberg, O.; Pärnik, T.; Rasulov, B.; Tobias, M.; Niinemets, Ü. Temperature responses of dark respiration in relation to leaf sugar concentration. Physiol. Plant. 2012, 144, 320–334. [Google Scholar] [CrossRef]
  34. Kenny, S.T.; Zimmermann, C.E. Registration of Centennial hop. Crop Sci. 1991, 31, 1092–1093. [Google Scholar] [CrossRef]
  35. Bauerle, W.L. Disentangling photoperiod from hop vernalization and dormancy for global production and speed breeding. Sci. Rep. 2019, 9, 16003. [Google Scholar] [CrossRef]
  36. Bauerle, W.L. Internode elongation and strobili production of Humulus lupulus cultivars in response to local strain sensing. Sci. Rep. 2021, 11, 9017. [Google Scholar] [CrossRef]
  37. Bauerle, W.L.; Weston, D.J.; Bowden, J.D.; Dudley, J.B.; Toler, J.E. Leaf absorptance of photosynthetically active radiation in relation to chlorophyll meter estimates among woody plant species. Sci. Hortic. 2004, 101, 169–178. [Google Scholar] [CrossRef]
  38. Farquhar, G.D.; von Caemmerer, S.; Berry, J.A. A biochemical model of photosynthetic CO2 assimilation in leaves of C3 species. Planta 1980, 149, 78–90. [Google Scholar] [CrossRef]
  39. Duursma, R.A. Plantecophys—An R package for analyzing and modelling leaf gas exchange data. PLoS ONE 2015, 10, e0143346. [Google Scholar] [CrossRef]
  40. Wullschleger, S.D. Biochemical limitations of carbon assimilation in C3 plants—A retrospective analysis of the A/Ci curves of 109 species. J. Exp. Bot. 1993, 44, 907–920. [Google Scholar] [CrossRef]
  41. Von Caemmerer, S.; Farquhar, G.D.; Berry, J.A. Biochemical model of C3 photosynthesis. In Photosynthesis In Silico: Understanding Complexity from Molecules to Ecosystems; Laisk, A., Nedbal, L., Govindjee, G., Eds.; Spinger Science & Business Media, B.V.: Dordrecht, The Netherlands, 2009; pp. 209–230. [Google Scholar] [CrossRef]
  42. Von Caemmerer, S.; Evans, J.R.; Hudson, G.S.; Andrews, T.J. The kinetics of ribulose-1,5-bisphosphate carboxylase/oxygenase in vivo inferred from measurements of photosynthesis in leaves of transgenic tobacco. Planta 1994, 195, 88–97. [Google Scholar] [CrossRef]
  43. Prioul, J.L.; Chartier, P. Partitioning of transfer and carboxylation components of intercellular resistance to photosynthetic CO2 fixation: A critical analysis of the methods used. Ann. Bot. 1977, 41, 789–800. [Google Scholar] [CrossRef]
  44. Parsons, R.; Weyers, J.D.B.; Lawson, T.; Godber, I.M. Rapid and straightforward estimates of photosynthetic characteristics using a portable gas exchange system. Photosynthetica 1997, 34, 265–279. [Google Scholar] [CrossRef]
  45. Sharp, R.E.; Matthews, M.A.; Boyer, J.S. Kok effect and the quantum yield of photosynthesis: Light partially inhibits dark respiration. Plant Physiol. 1984, 75, 95–101. [Google Scholar] [CrossRef]
  46. Singsaas, E.L.; Ort, D.R.; DeLucia, E.H. Variation in measured values of photosynthetic quantum yield in ecophysiological studies. Oecologia 2001, 128, 15–23. [Google Scholar] [CrossRef] [PubMed]
  47. Leuning, R.; Kelliher, F.M.; De Pury, D.G.G.; Schulze, E.D. Leaf nitrogen, photosynthesis, conductance and transpiration: Scaling from leaves to canopies. Plant Cell Environ. 1995, 18, 1183–1200. [Google Scholar] [CrossRef]
  48. Leuning, R. A critical appraisal of a combined stomatal photosynthesis model for C3 plants. Plant Cell Environ. 1995, 18, 339–355. [Google Scholar] [CrossRef]
  49. Medlyn, B.E.; Duursma, R.A.; Eamus, D.; Ellsworth, D.E.; Prentice, I.C.; Barton, C.V.M.; Crous, K.Y.; De Angelis, P.; Freeman, M.; Wingate, L. Reconciling the optimal and empirical approaches to modelling stomatal conductance. Glob. Chang. Biol. 2012, 17, 2134–2144. [Google Scholar] [CrossRef]
  50. Kavalier, A.R.; Litt, A.; Ma, C.; Pitra, N.J.; Coles, M.C.; Kennelly, E.J.; Matthews, P.D. Phytochemical and morphological characterization of hop (Humulus lupulus L.) cones over five developmental stages using high performance liquid chromatography coupled to time-of-flight mass spectrometry, ultrahigh performance liquid chromatography photodiode array detection, and light microscopy techniques. J. Agric. Food Chem. 2011, 59, 4783–4793. [Google Scholar] [CrossRef]
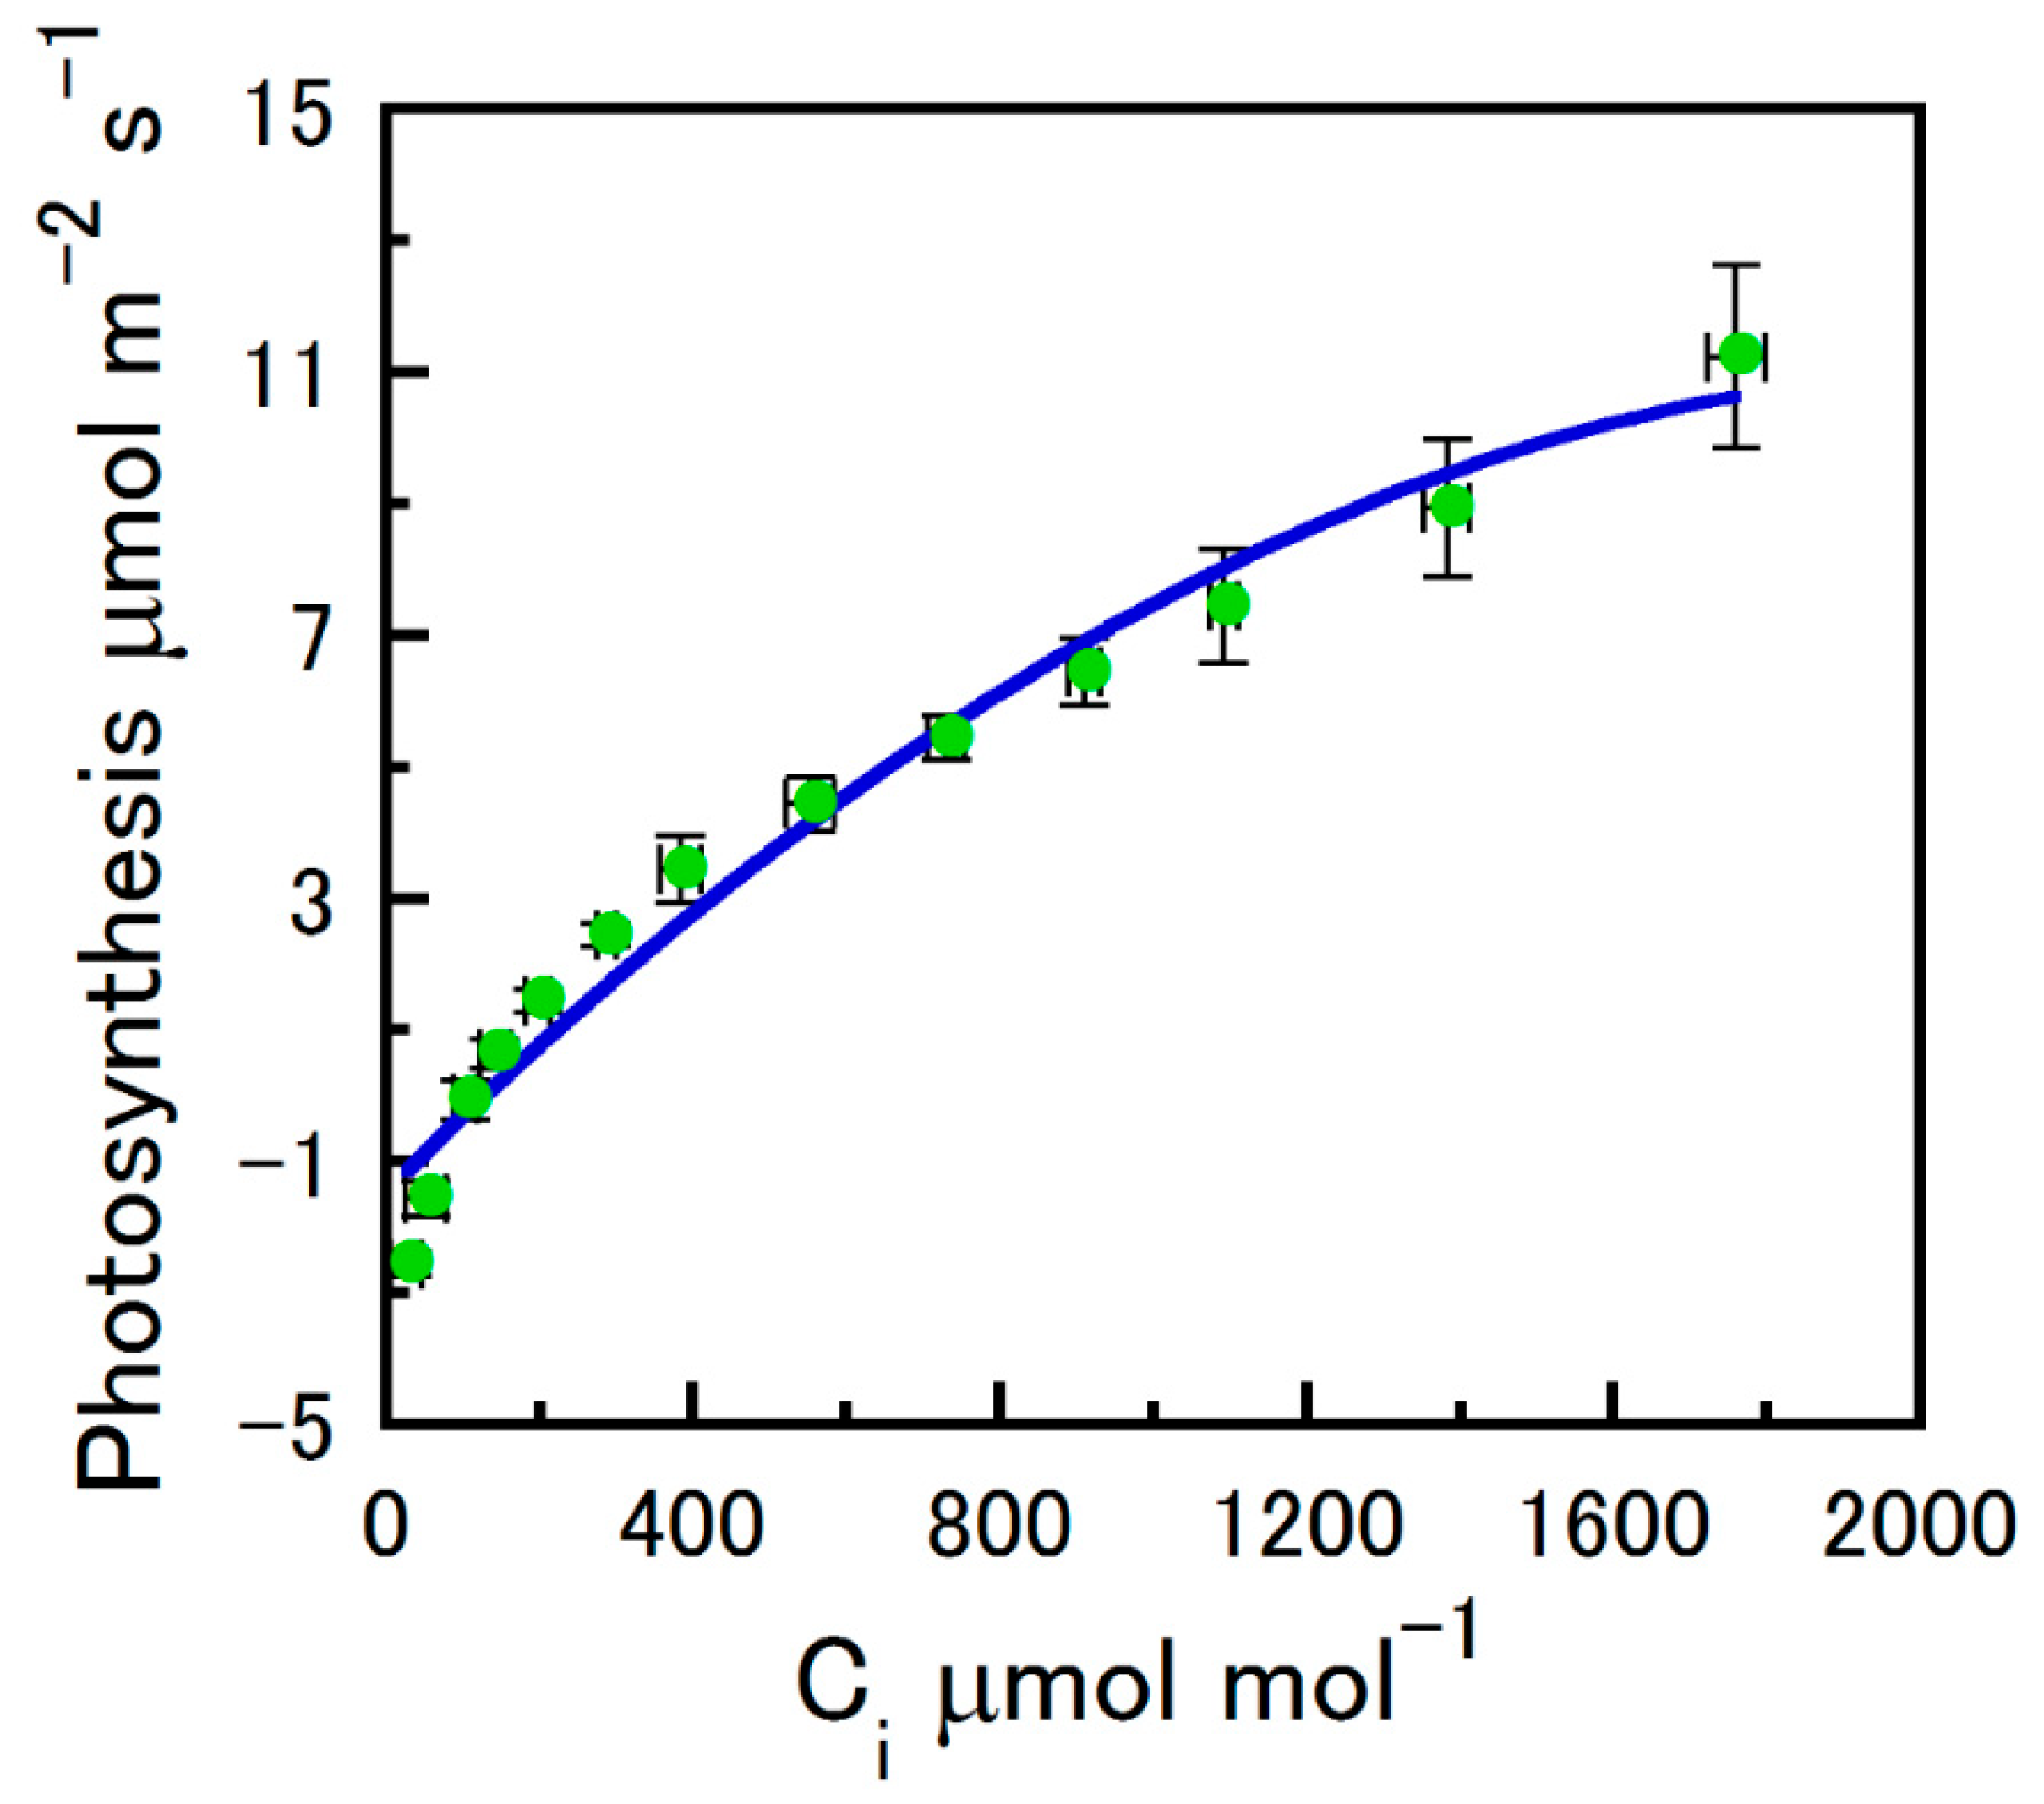
Figure 1. The net photosynthesis of hop strobili as a function of estimated intercellular CO2 concentration (Ci). Cuvette O2 was atmospheric ambient (~21%). Strobilus temperature was controlled at 25 °C and photosynthetically active radiation at 400 m−2 s−1. Samples were pooled across four measurement intervals (means ± SE).
Plants 12 01816 g001
Figure 2. The net photosynthesis of hop strobili as a function of photosynthetically active radiation (PAR). Cuvette O2 was atmospheric ambient (~21%). Strobilus temperature was controlled at 25 °C and CO2 at approximately atmospheric ambient (415 μmol mol−1). Samples were pooled across four measurement intervals (means ± SE).
Plants 12 01816 g002
Figure 3. Hop strobili daily carbon gain estimates per m2 in Yakima, WA, (representative days of year 215–235, 2022) at ambient (415) and 600, 900, 1200, 1500, and 1800 μmol mol−1 CO2.
Plants 12 01816 g003
Figure 4. The hop strobili bracts without (top row) and with (bottom row) contact herbicide treatment. Brown tissue illustrates the contact herbicide treatment and green tissue represents the control. Treated and control bracts on the strobili above the bracts illustrate the random individual treatment of bracts within a strobilus.
Plants 12 01816 g004
Figure 5. Isolation of hop bracts with (left) and without (right) contact herbicide treatment. Brown tissue illustrates the contact herbicide treatment and green tissue represents the control. Glandular trichomes are visible at the lower inner surface of each bract. Unlike control bracts, bracts treated with contact herbicide did not fill their glands with yellow lupulin.
Plants 12 01816 g005
Table 1. Photosynthetic response parameters for hop strobili of cv. ‘Centennial’ measured at 25 °C. Means ± standard error (SE). Photosynthetically active radiation response parameters are light-saturated photosynthetic rate at 415 μmol mol−1 CO2 (Amax, µmol m−2 s−1), dark respiration rate (Rd, µmol m−2 s−1), quantum yield (ϕ, mol C mol−1), and light saturation point (Ls, µmol m−2 s−1) at 415 μmol mol−1 and 25 °C. CO2 response parameters are maximum Rubisco carboxylation rate (Vcmax) (μmol m−2 s−1) and CO2 compensation point (Γ, μmol mol−1) at 25 °C. Samples were pooled across four measurement intervals. Number of strobili n = 24.
ParameterMean ± SE
Rd−2.1 ± 0.3
Amax4.2 ± 0.3
ϕ0.033 ± 0.002
Ls341.0 ± 16.5
Lc76.7 ± 12.6
Vcmax14.1 ± 1.1
Γ110.3 ± 13.3
Disclaimer/Publisher’s Note: The statements, opinions and data contained in all publications are solely those of the individual author(s) and contributor(s) and not of MDPI and/or the editor(s). MDPI and/or the editor(s) disclaim responsibility for any injury to people or property resulting from any ideas, methods, instructions or products referred to in the content.