
Effects of Soil Nutrients on Plant Nutrient Traits in Natural Pinus tabuliformis Forests


Abstract
:1. Introduction
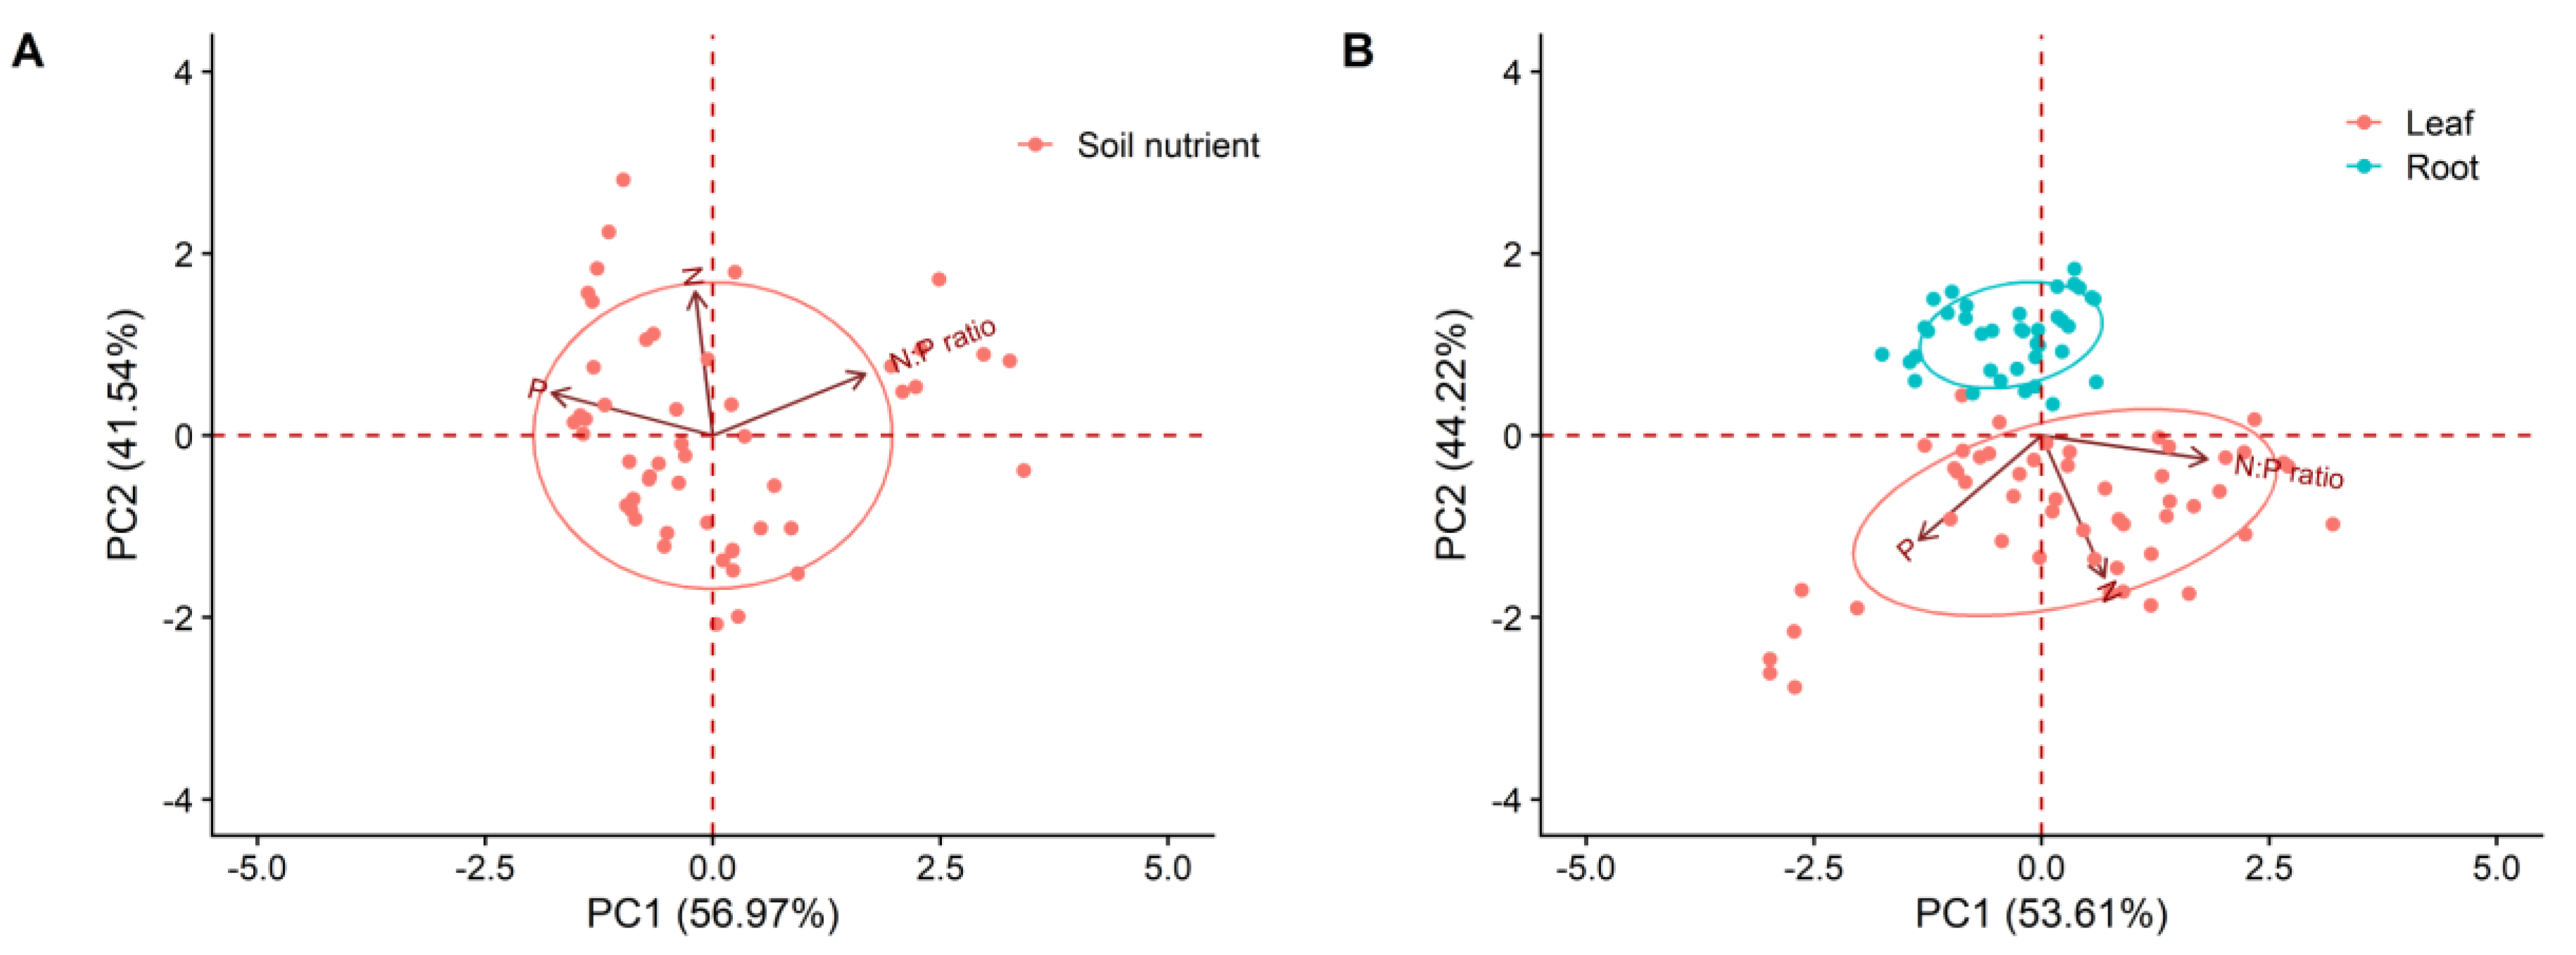
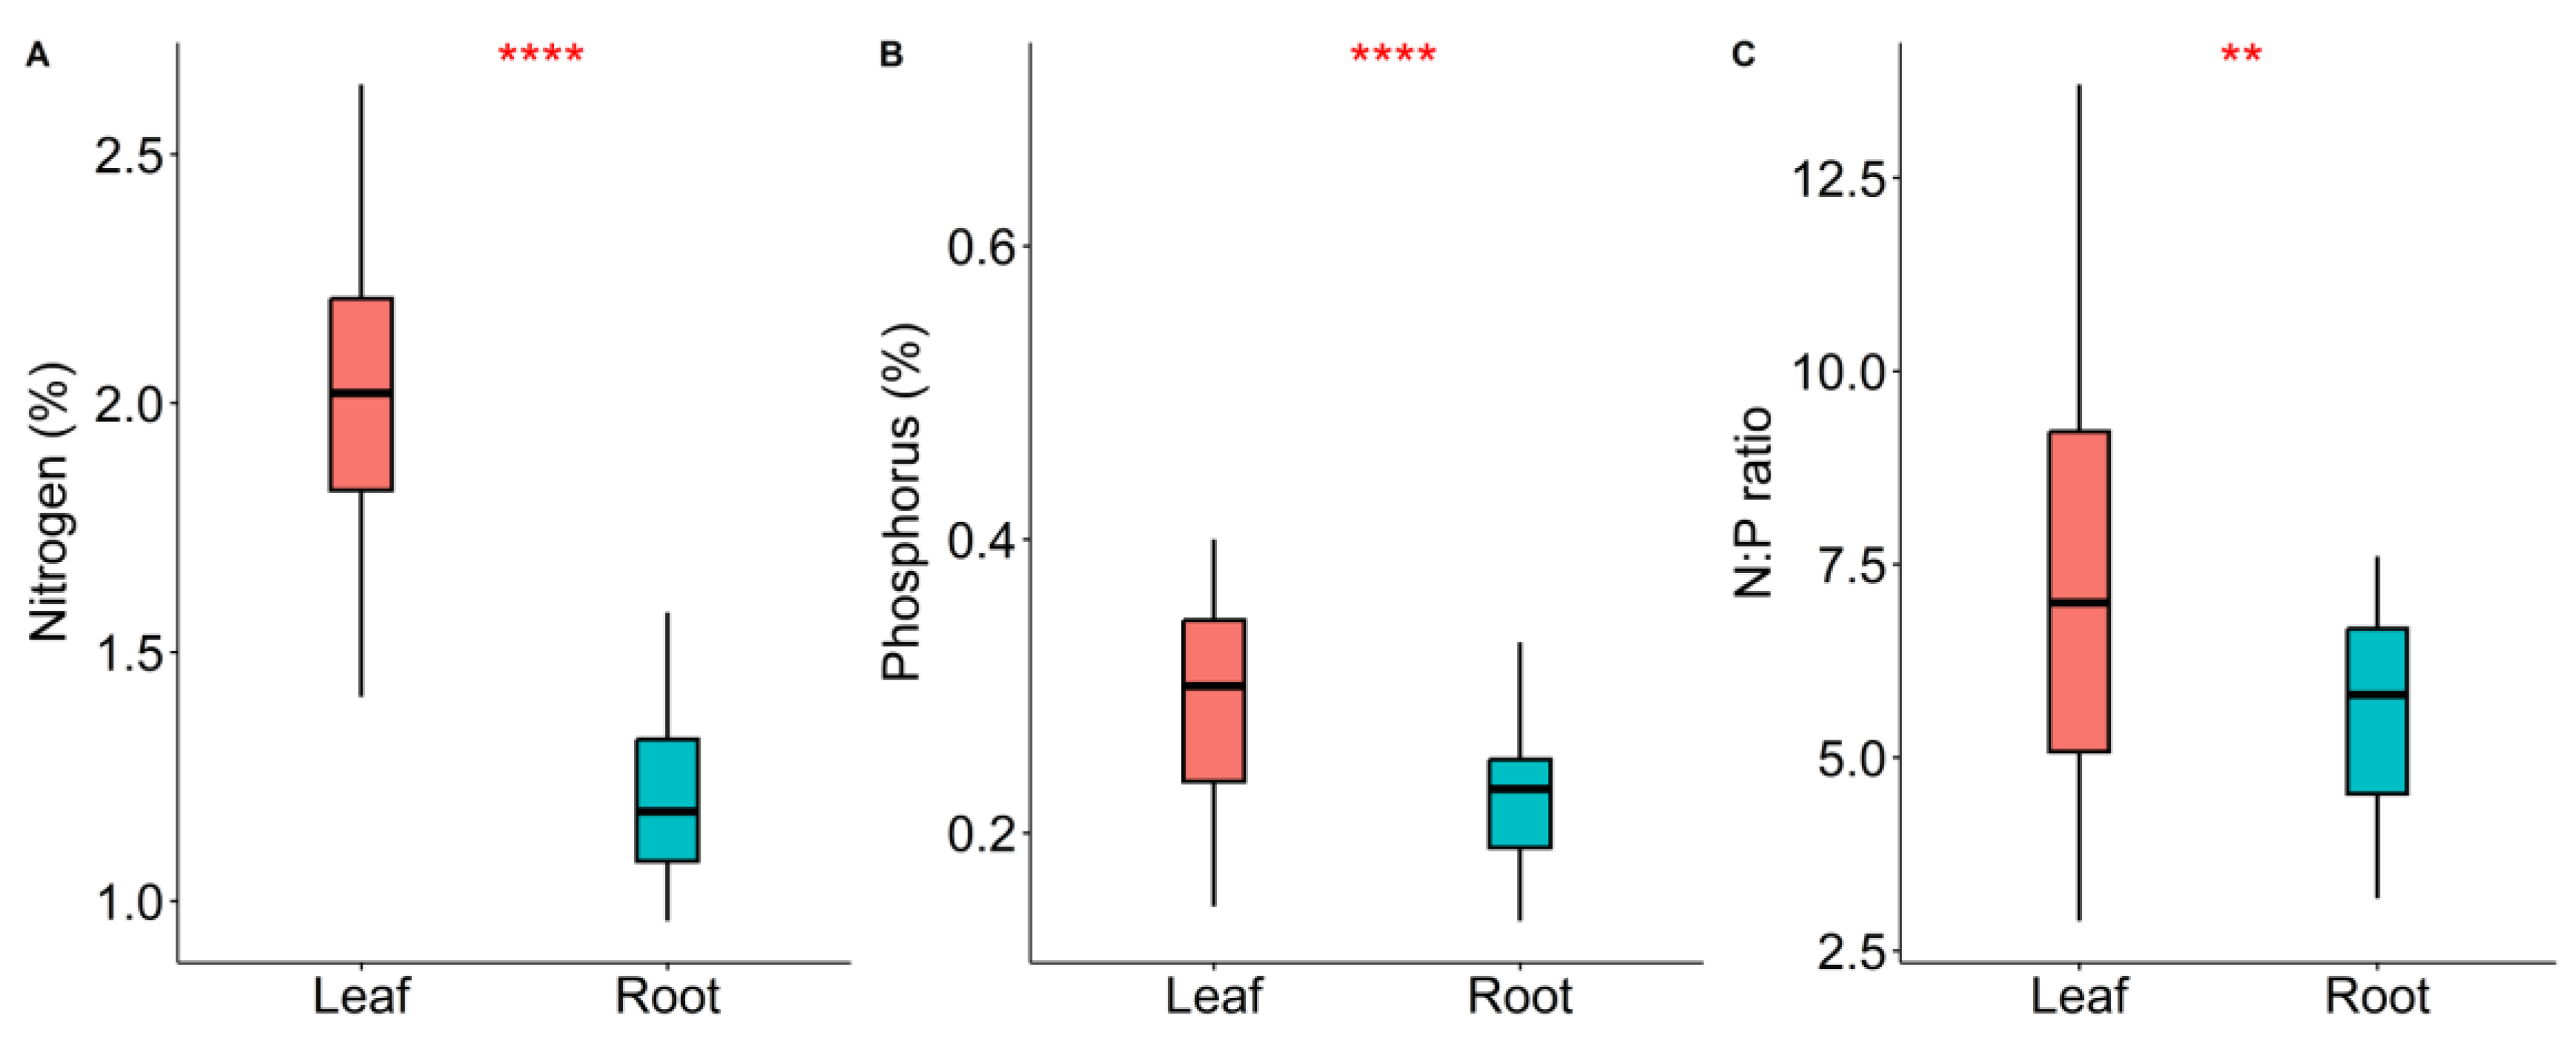
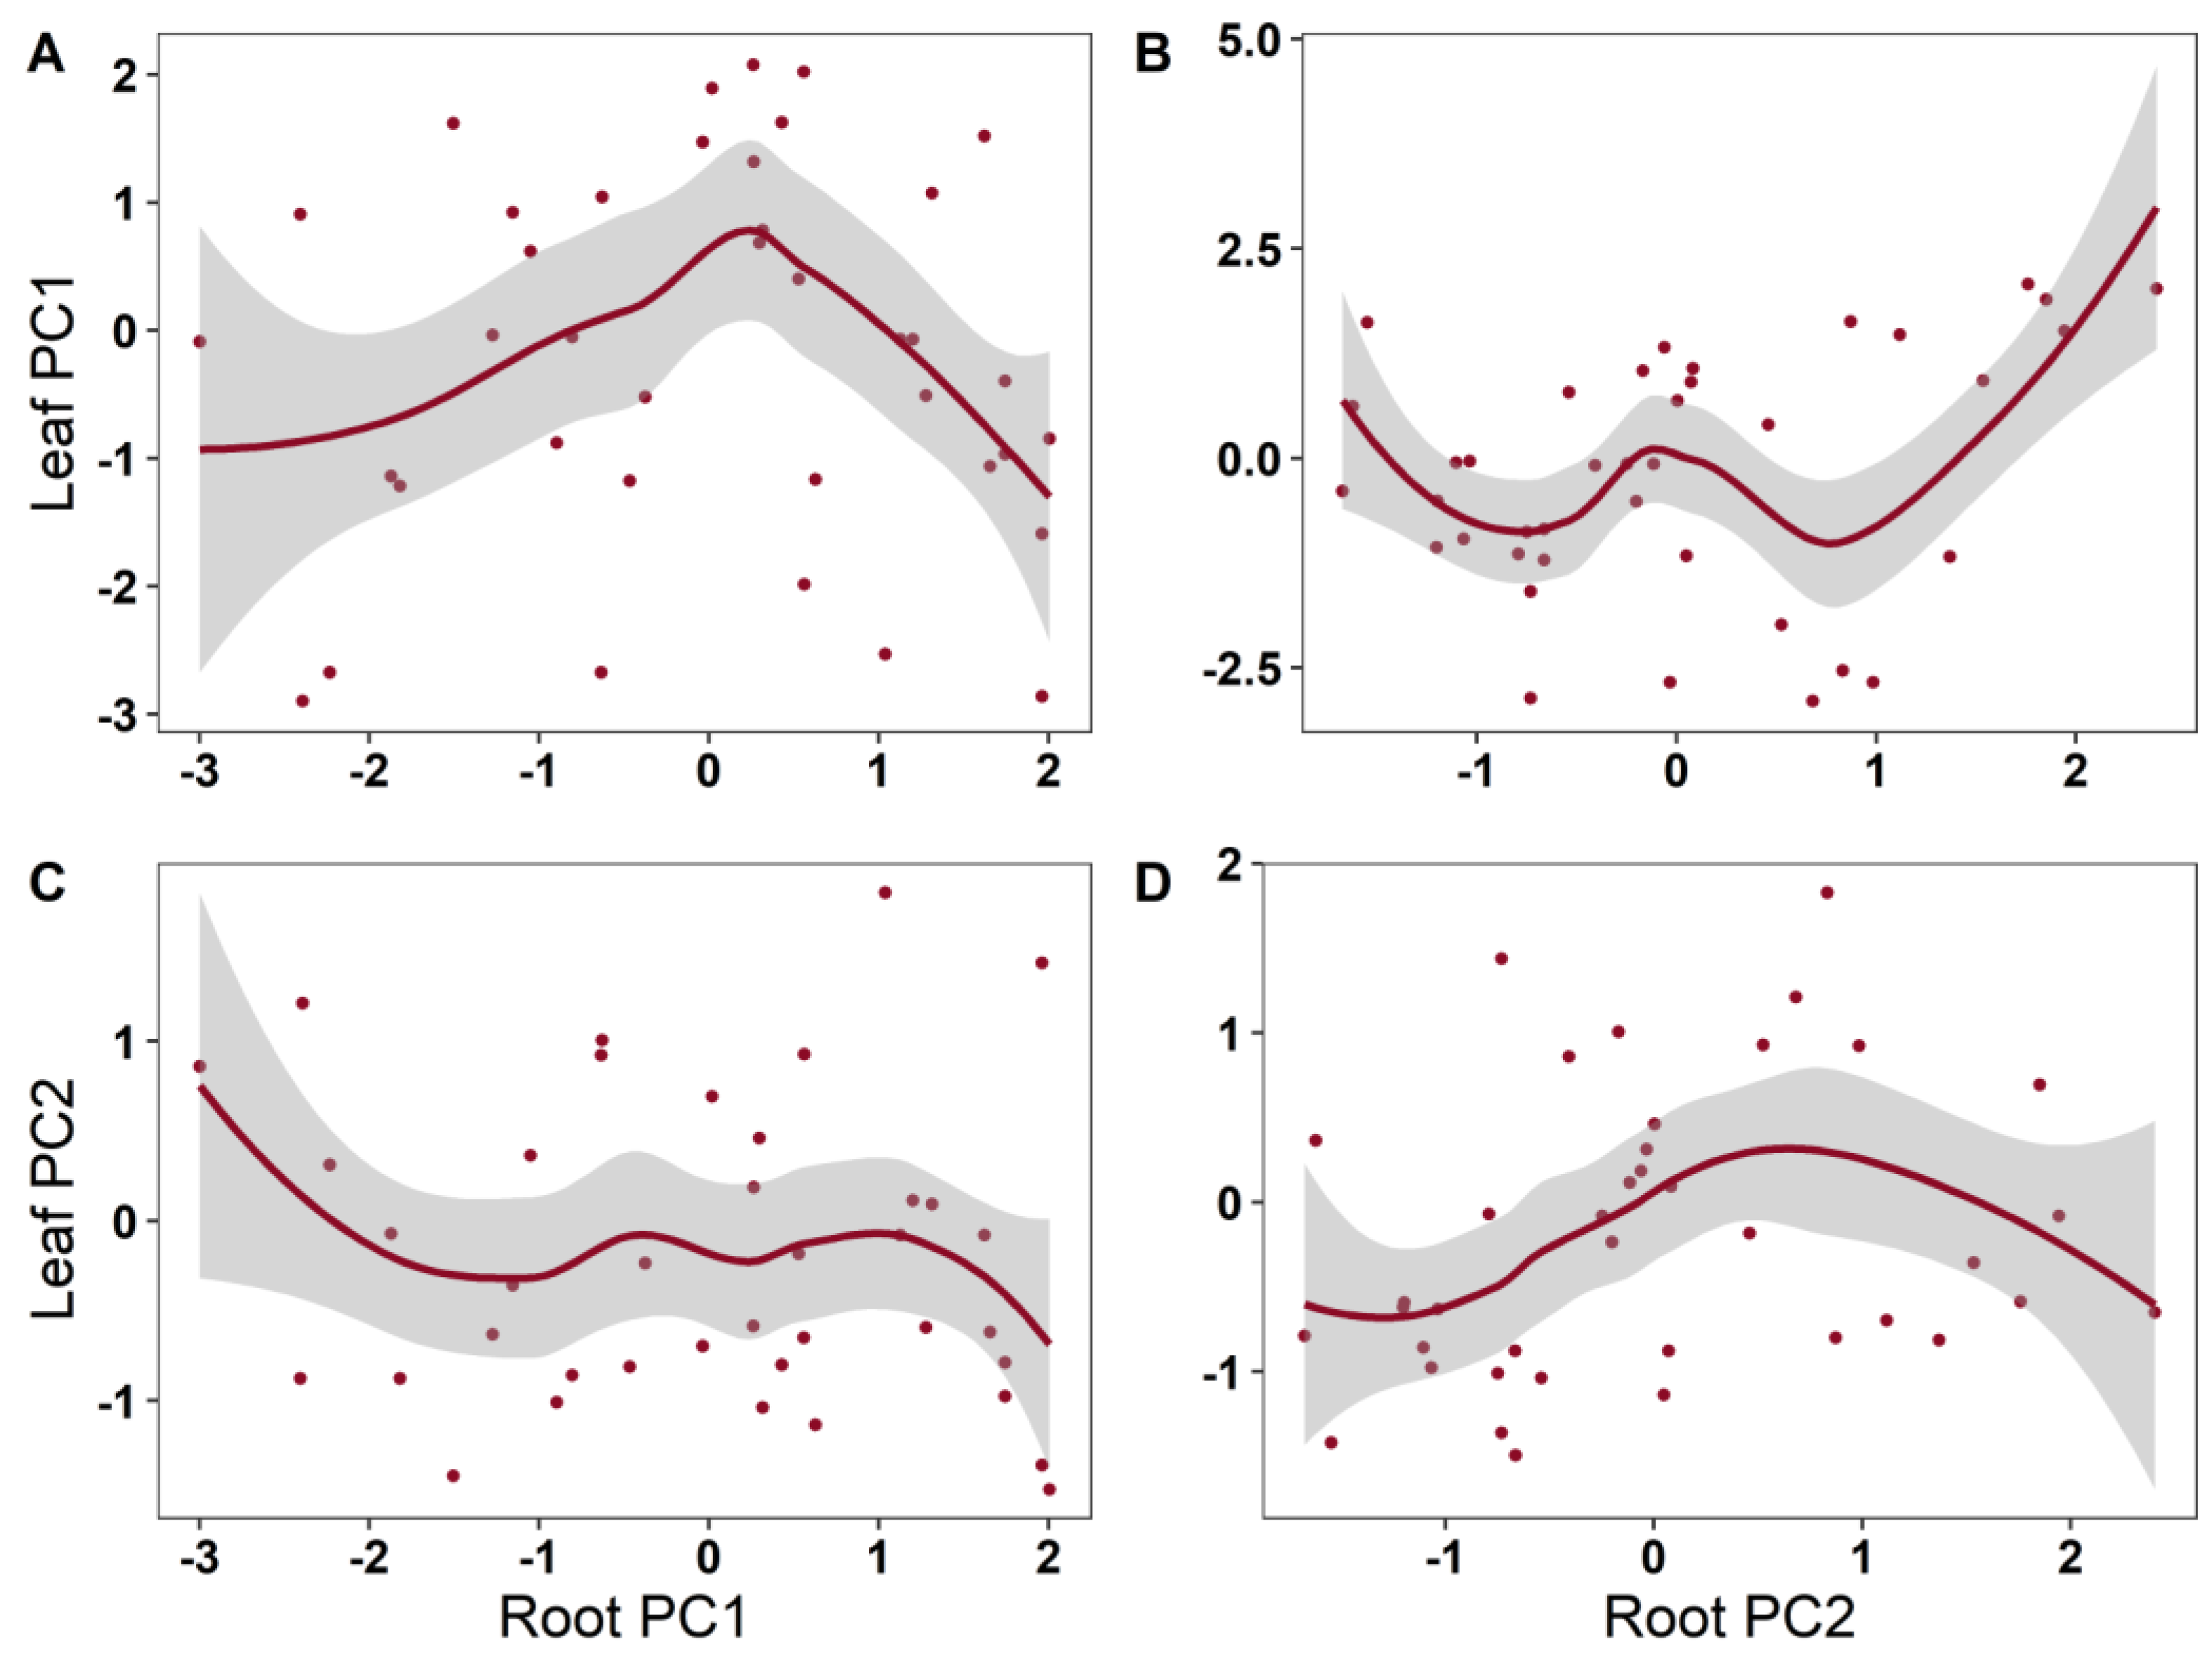
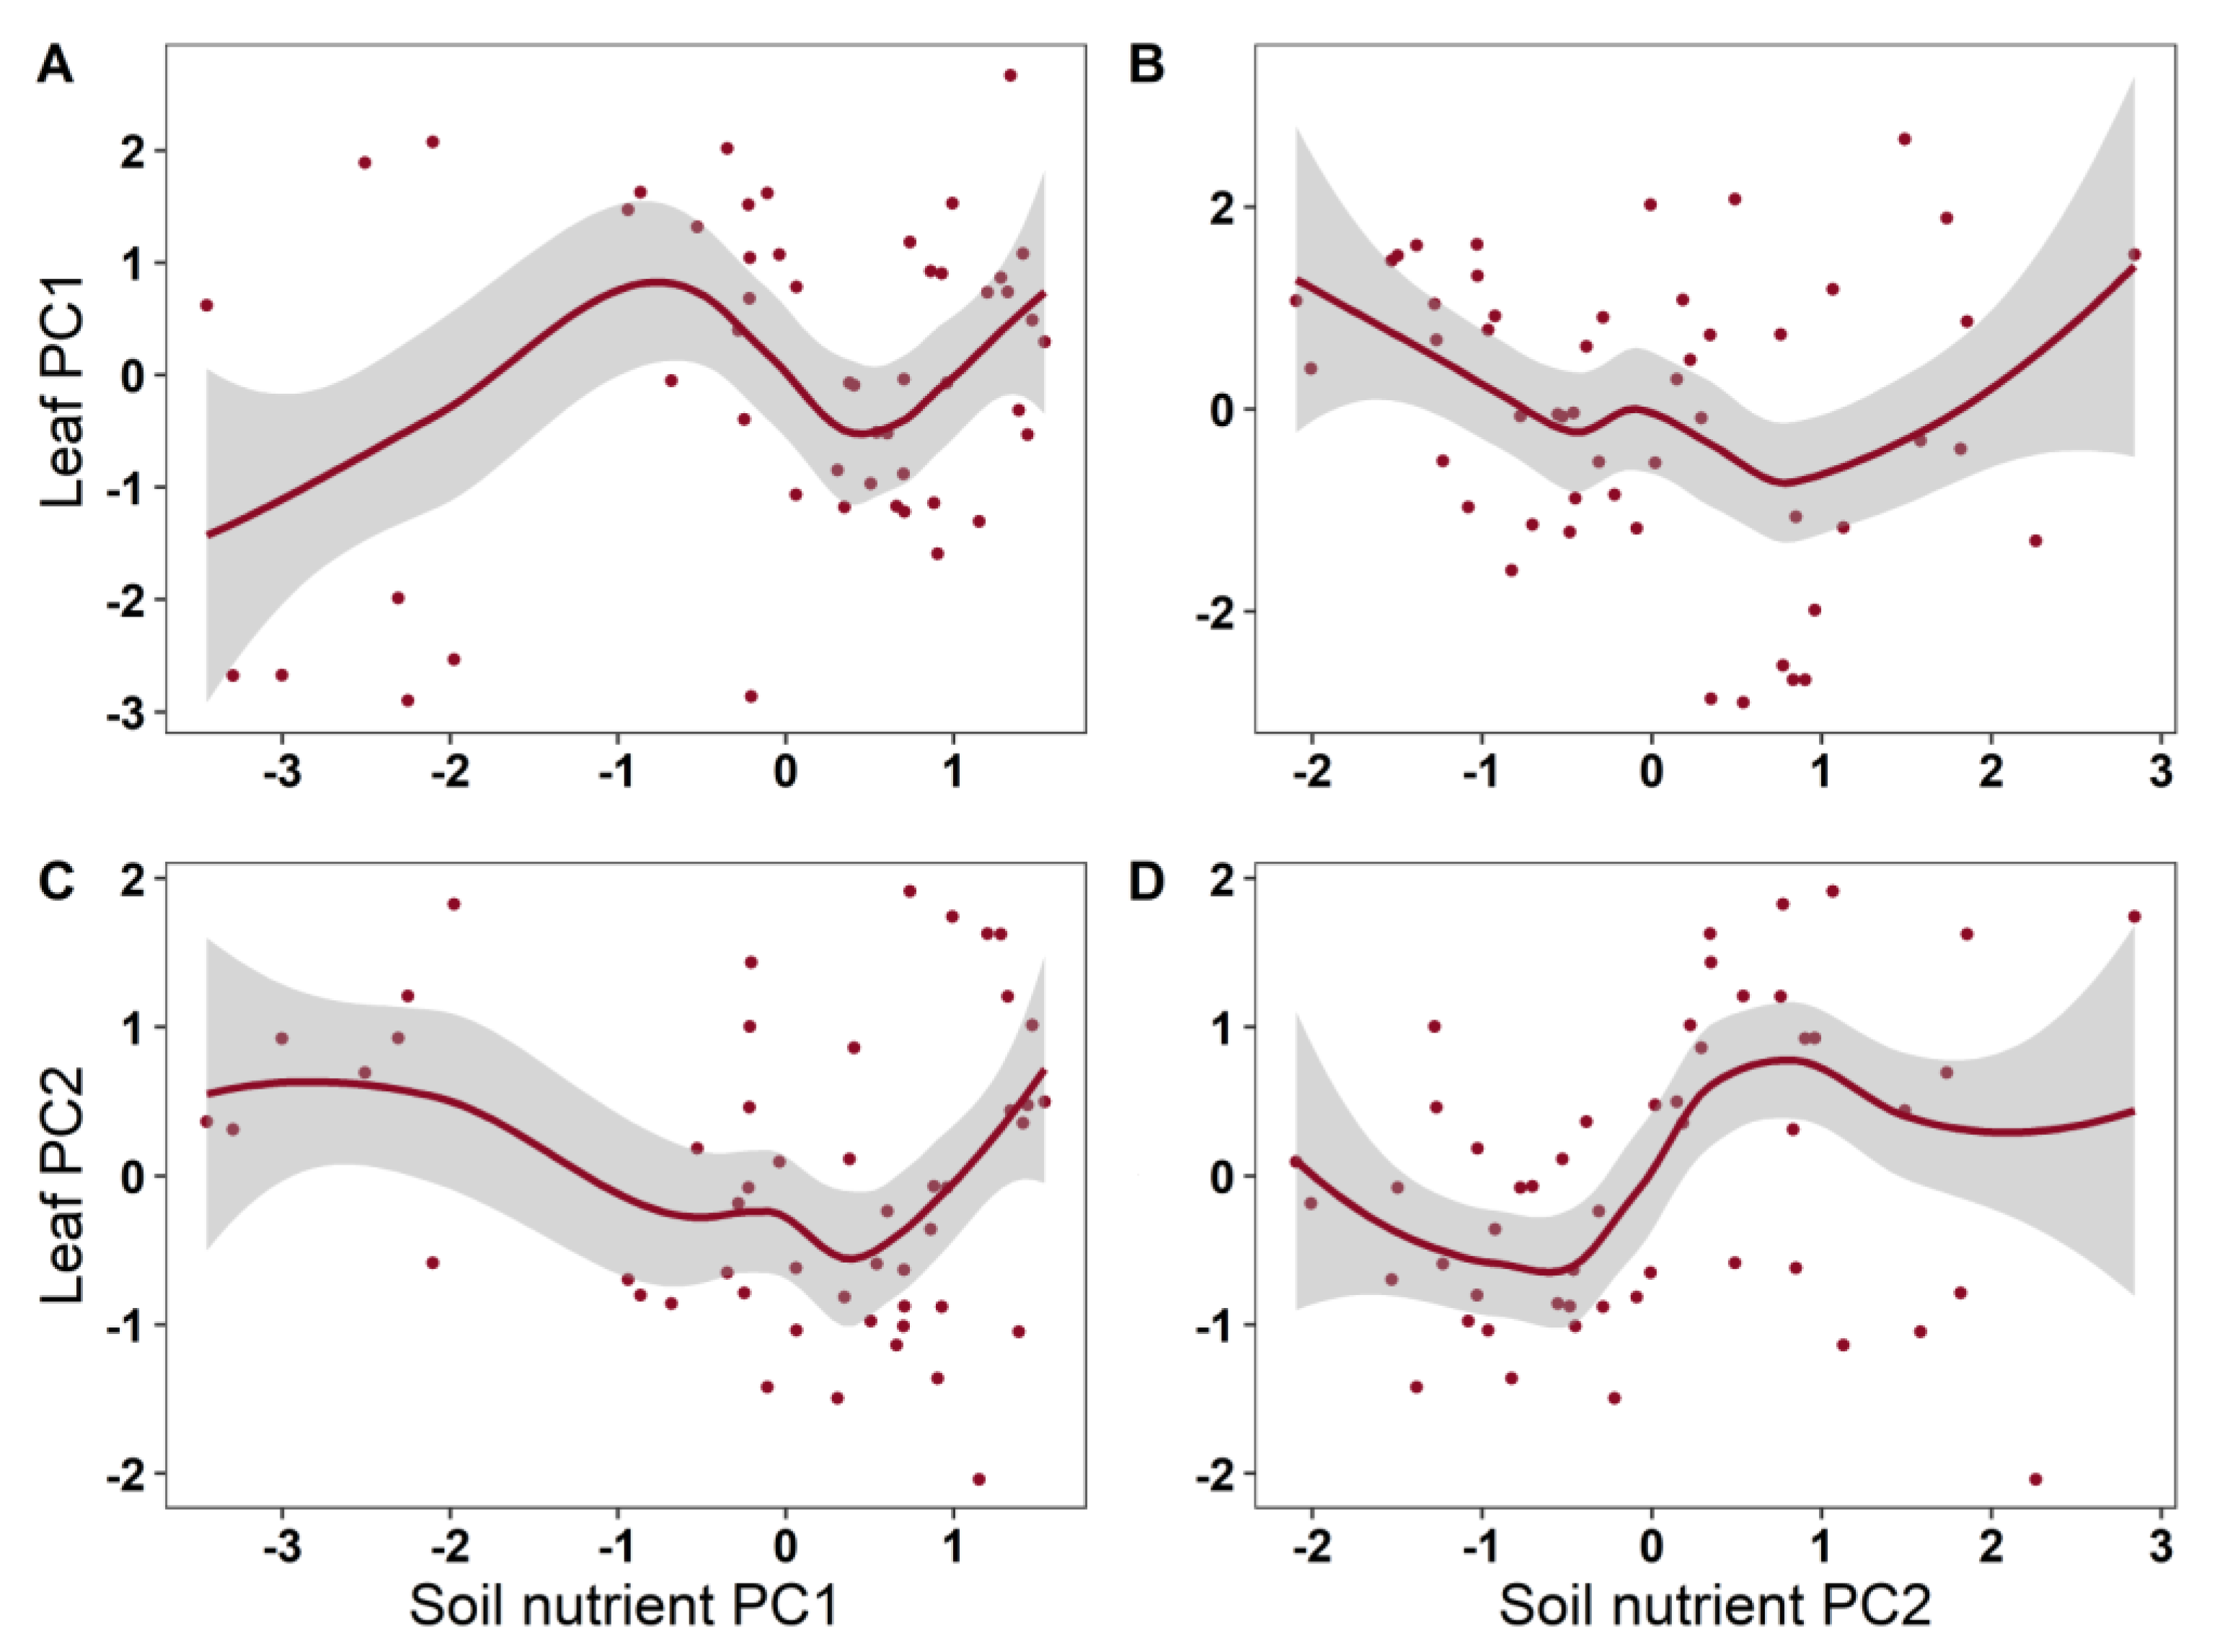
2. Results
3. Discussion
4. Materials and Methods
4.1. Study Area
4.2. Nutrient Trait Data
4.3. Data Analysis
Supplementary Materials
Author Contributions
Funding
Institutional Review Board Statement
Informed Consent Statement
Data Availability Statement
Conflicts of Interest
References
- Ma, J.; Niklas, K.J.; Liu, L.; Fang, Z.D.; Li, Y.R.; Shi, P.J. Tree size influences leaf shape but does not affect the proportional relationship between leaf area and the product of length and width. Front. Plant Sci. 2022, 13, 850203. [Google Scholar]
- Wang, X.; Wang, R.; Gao, J. Precipitation and soil nutrients determine the spatial variability of grassland productivity at large scales in China. Front. Plant Sci. 2022, 13, 996313. [Google Scholar] [CrossRef] [PubMed]
- Wang, X.; Wang, J.; Zhang, L.; Lv, C.; Liu, L.; Zhao, H.; Gao, J. Climatic Factors Determine the Distribution Patterns of Leaf Nutrient Traits at Large Scales. Plants 2022, 11, 2171. [Google Scholar] [CrossRef]
- Gong, H.; Li, Y.; Yu, T.; Zhang, S.; Gao, J.; Zhang, S.; Sun, D. Soil and climate effects on leaf nitrogen and phosphorus stoichiometry along elevational gradients. Glob. Ecol. Conserv. 2020, 23, e01138. [Google Scholar] [CrossRef]
- Huang, C.; Xu, Y.; Zang, R. Variation patterns of functional trait moments along geographical gradients and their environmental determinants in the subtropical evergreen broadleaved forests. Front. Plant Sci. 2021, 12, 1414. [Google Scholar]
- Han, W.X.; Fang, J.Y.; Guo, D.L.; Zhang, Y. Leaf nitrogen and phosphorus stoichiometry across 753 terrestrial plant species in China. New Phytol. 2005, 168, 377–385. [Google Scholar] [CrossRef]
- Aerts, R.; Chapin, F.S. The mineral nutrition of wild plants revisited: A re-evaluation of processes and patterns. Adv. Ecol. Res. 2000, 30, 1–67. [Google Scholar]
- Güsewell, S. N:P ratios in terrestrial plants: Variation and functional significance. New Phytol. 2004, 164, 243–266. [Google Scholar] [CrossRef]
- Chen, X.; Chen, H.Y.H.; Searle, E.B.; Chen, C.; Reich, P.B. Negative to positive shifts in diversity effects on soil nitrogen over time. Nat. Sustain. 2020, 4, 225–232. [Google Scholar] [CrossRef]
- Taylor, P.; Asner, G.; Dahlin, K.; Anderson, C.; Knapp, D.; Martin, R.; Mascaro, J.; Chazdon, R.; Cole, R.; Wanek, W. LandscapeScale Controls on Aboveground Forest Carbon Stocks on the Osa Peninsula, Costa Rica. PLoS ONE 2015, 10, e0126748. [Google Scholar]
- Ordoñez, J.C.; Bodegom, P.M.V.; Witte, J.P.M.; Wright, I.J.; Reich, P.B.; Aerts, R. A global study of relationships between leaf traits, climate and soil measures of nutrient fertility. Glob. Ecol. Biogeogr. 2009, 18, 137–149. [Google Scholar] [CrossRef]
- Berendse, F. Litter decomposability—A neglected component of plant fitness. J. Ecol. 1994, 82, 187–190. [Google Scholar] [CrossRef]
- Booth, M.S.; Stark, J.M.; Rastetter, E. Controls on nitrogen cycling in terrestrial ecosystems: A synthetic analysis of literature data. Ecol. Monogr. 2005, 75, 139–157. [Google Scholar] [CrossRef]
- Wright, I.J.; Reich, P.B.; Cornelissen, J.H.C.; Falster, D.S.; Garnier, E.; Hikosaka, K.; Lamont, B.B.; Lee, W.; Oleksyn, J.; Osada, N.; et al. Assessing the generality of global leaf trait relationships. New Phytol. 2005, 166, 485–496. [Google Scholar] [CrossRef]
- Wright, I.J.; Reich, P.B.; Westoby, M.; Ackerly, D.D.; Baruch, Z.; Bongers, F.; Cavender-Bares, J.; Chapin, T.; Cornelissen, J.H.C.; Diemer, M.; et al. The worldwide leaf economics spectrum. Nature 2004, 428, 821–827. [Google Scholar] [CrossRef]
- Koerselman, W.; Meuleman, A.F.M. The vegetation N:P ratio: A new tool to detect the nature of nutrient limitation. J. Appl. Ecol. 1996, 33, 1441–1450. [Google Scholar] [CrossRef]
- Valverde-Barrantes, O.J.; Horning, A.L.; Smemo, K.A.; Blackwood, C.B. Phylogenetically structured traits in root systems influence arbuscular mycorrhizal colonization in woody angiosperms. Plant Soil 2016, 404, 1–12. [Google Scholar] [CrossRef]
- Hobbie, S.E. Effects of plant species on nutrient cycling. Trends Ecol. Evol. 1992, 7, 336–339. [Google Scholar]
- Gong, H.D.; Yao, F.G.; Gao, J. Succession of a broad-leaved Korean pine mixed forest: Functional plant trait composition. Glob. Ecol. Conserv. 2020, 22, e00950. [Google Scholar] [CrossRef]
- Gong, H.D.; CUI, Q.J.; Gao, J. Latitudinal, soil and climate effects on key leaf traits in northeastern China. Glob. Ecol. Conserv. 2020, 22, e00904. [Google Scholar] [CrossRef]
- Gao, J.; Song, Z.P.; Liu, Y.H. Response mechanisms of leaf nutrients of endangered plant (Acer catalpifolium) to environmental factors varied at different growth stages. Glob. Ecol. Conserv. 2019, 17, e00521. [Google Scholar] [CrossRef]
- Huang, W.; Ding, Y.; Wang, S.; Song, C.; Wang, F. Growth and development responses of the rhizome-root system in Pleioblastus pygmaeus to light intensity. Plants 2022, 11, 2204. [Google Scholar] [CrossRef] [PubMed]
- Elser, J.J.; Dobberfuhl, D.R.; MacKay, N.A.; Schampel, J.H. Organism size, life history, and N:P stoichiometry. BioScience 1996, 46, 674–684. [Google Scholar] [CrossRef]
- He, J.S.; Han, X.G. Ecological stoichiometry: Searching for unifying principles from individuals to ecosystems. Chin. J. Plant Ecol. 2010, 34, 2–6. [Google Scholar]
- Guo, D.; Xia, M.; Wei, X.; Chang, W.; Liu, Y.; Wang, Z. Anatomical traits associated with absorption and mycorrhizal colonization are linked to root branch order in twenty-three Chinese temperate tree species. New Phytol. 2008, 3, 180. [Google Scholar] [CrossRef] [PubMed]
- Wang, J.; Wang, X.; Ji, Y.; Gao, J. Climate factors determine the utilization strategy of forest plant resources at large scales. Front. Plant Sci. 2022, 13, 990441. [Google Scholar] [CrossRef] [PubMed]
- Aerts, R.; De Caluwe, H.; Beltman, B. Is the relation between nutrient supply and biodiversity CO2 limited by the type of nutrient limitation. Oikos 2003, 101, 489–498. [Google Scholar] [CrossRef]
- Elser, J.J.; Fagan, W.F.; Kerkhoff, A.J.; Swenson, N.G.; Enquist, B.J. Biological stoichiometry of plant production: Metabolism, scaling and ecological response to global change. New Phytol. 2010, 186, 593–608. [Google Scholar] [CrossRef] [PubMed]
- Sweeney, C.J.; Vries, F.T.; Dongen, B.E. Root traits explain rhizosphere fungal community composition among temperate grassland plant species. New Phytol. 2021, 229, 1492–1507. [Google Scholar] [CrossRef]
- Potarzycki, J. Effect of magnesium or zinc supplementation at the background of nitrogen rate on nitrogen management by maize canopy cultivated in monoculture. Plant Soil Environ. 2011, 57, 19–25. [Google Scholar] [CrossRef]
- Shen, X.; Yang, F.; Xiao, C.W.; Zhou, Y. Increased contribution of root exudates to soil carbon input during grassland degradation. Soil Biol. Biochem. 2020, 146, 107817. [Google Scholar] [CrossRef]
- Liu, C.; Sack, L.; Li, Y.; He, N. Contrasting adaptation and optimization of stomatal traits across communities at continental-scale. J. Exp. Bot. 2022, 73, 6405–6416. [Google Scholar] [CrossRef] [PubMed]
- Fukano, Y.; Guo, W.; Uchida, K.; Tachiki, Y. Contemporary adaptive divergence of plant competitive traits in urban and rural populations and its implication for weed management. J. Ecol. 2020, 108, 2521–2530. [Google Scholar] [CrossRef]
- Reichardt, K.; Timm, L.C. How Plants Absorb Nutrients from the Soil. In Soil, Plant and Atmosphere; Springer: Cham, Switzerland, 2020. [Google Scholar]
- Chen, Y.S.; Hou, M.T.; Dan, M.A.; Han, X.H.; Zhang, R.Y.; Zhang, X.Z. Determination of Total Phosphorus in Soil by Alkali Fusion-Mo-Sb Anti Spectrophotometric Method; China Standardization: Beijing, China, 2018. [Google Scholar]


| Nutrient Characteristics | Mean Value (g/g) | Coefficient of Variation (%) | Max–Min (g/g) | |
|---|---|---|---|---|
| Leaf | Nmass | 2.03 | 3.81 | 1.23 |
| Pmass | 0.32 | 6.02 | 0.56 | |
| N:P | 7.38 | 10.59 | 5.82 | |
| Root | Nmass | 1.19 | 2.15 | 0.62 |
| Pmass | 0.22 | 1.23 | 0.20 | |
| N:P | 5.6 | 29.56 | 4.42 | |
| Soil | Nmass | 3.22 | 41.72 | 5.38 |
| Pmass | 0.43 | 7.74 | 0.62 | |
| N:P | 8.46 | 20.05 | 6.4 |
| Parameters | Independent Variable | Degrees of Freedom | F Value | Pr (>|t|) | R2adj |
|---|---|---|---|---|---|
| Leaf PC1 | Soil PC1 | 3.328 | 1.496 | 0.227 | 0.163 |
| Soil PC2 | 1.970 | 1.452 | 0.217 | ||
| Leaf PC2 | Soil PC1 | 1.432 | 0.498 | 0.6806 | 0.25 |
| Soil PC2 | 5.484 | 2.282 | 0.0475 * | ||
| Root PC1 | Soil PC1 | 1.797 | 1.729 | 0.190 | 0.108 |
| Soil PC2 | 1.641 | 0.790 | 0.451 | ||
| Root PC2 | Soil PC1 | 3.086 | 2.757 | 0.0511 | 0.181 |
| Soil PC2 | 1.000 | 0.231 | 0.6340 | ||
| Leaf PC1 | Root PC1 | 2.843 | 1.939 | 0.1352 | 0.364 |
| Root PC2 | 4.418 | 2.802 | 0.0337 * | ||
| Leaf PC2 | Root PC1 | 1.000 | 0.392 | 0.536 | 0.0861 |
| Root PC2 | 1.927 | 1.740 | 0.153 |
Disclaimer/Publisher’s Note: The statements, opinions and data contained in all publications are solely those of the individual author(s) and contributor(s) and not of MDPI and/or the editor(s). MDPI and/or the editor(s) disclaim responsibility for any injury to people or property resulting from any ideas, methods, instructions or products referred to in the content. |
© 2023 by the authors. Licensee MDPI, Basel, Switzerland. This article is an open access article distributed under the terms and conditions of the Creative Commons Attribution (CC BY) license (https://creativecommons.org/licenses/by/4.0/).
Share and Cite
Gao, J.; Wang, J.; Li, Y. Effects of Soil Nutrients on Plant Nutrient Traits in Natural Pinus tabuliformis Forests. Plants 2023, 12, 735. https://doi.org/10.3390/plants12040735
Gao J, Wang J, Li Y. Effects of Soil Nutrients on Plant Nutrient Traits in Natural Pinus tabuliformis Forests. Plants. 2023; 12(4):735. https://doi.org/10.3390/plants12040735
Chicago/Turabian StyleGao, Jie, Jiangfeng Wang, and Yanhong Li. 2023. "Effects of Soil Nutrients on Plant Nutrient Traits in Natural Pinus tabuliformis Forests" Plants 12, no. 4: 735. https://doi.org/10.3390/plants12040735
APA StyleGao, J., Wang, J., & Li, Y. (2023). Effects of Soil Nutrients on Plant Nutrient Traits in Natural Pinus tabuliformis Forests. Plants, 12(4), 735. https://doi.org/10.3390/plants12040735