
Can a Forest Tree Species Progeny Trial Serve as an Ex Situ Collection? A Case Study on Alnus glutinosa


 ,
,
Abstract
:1. Introduction
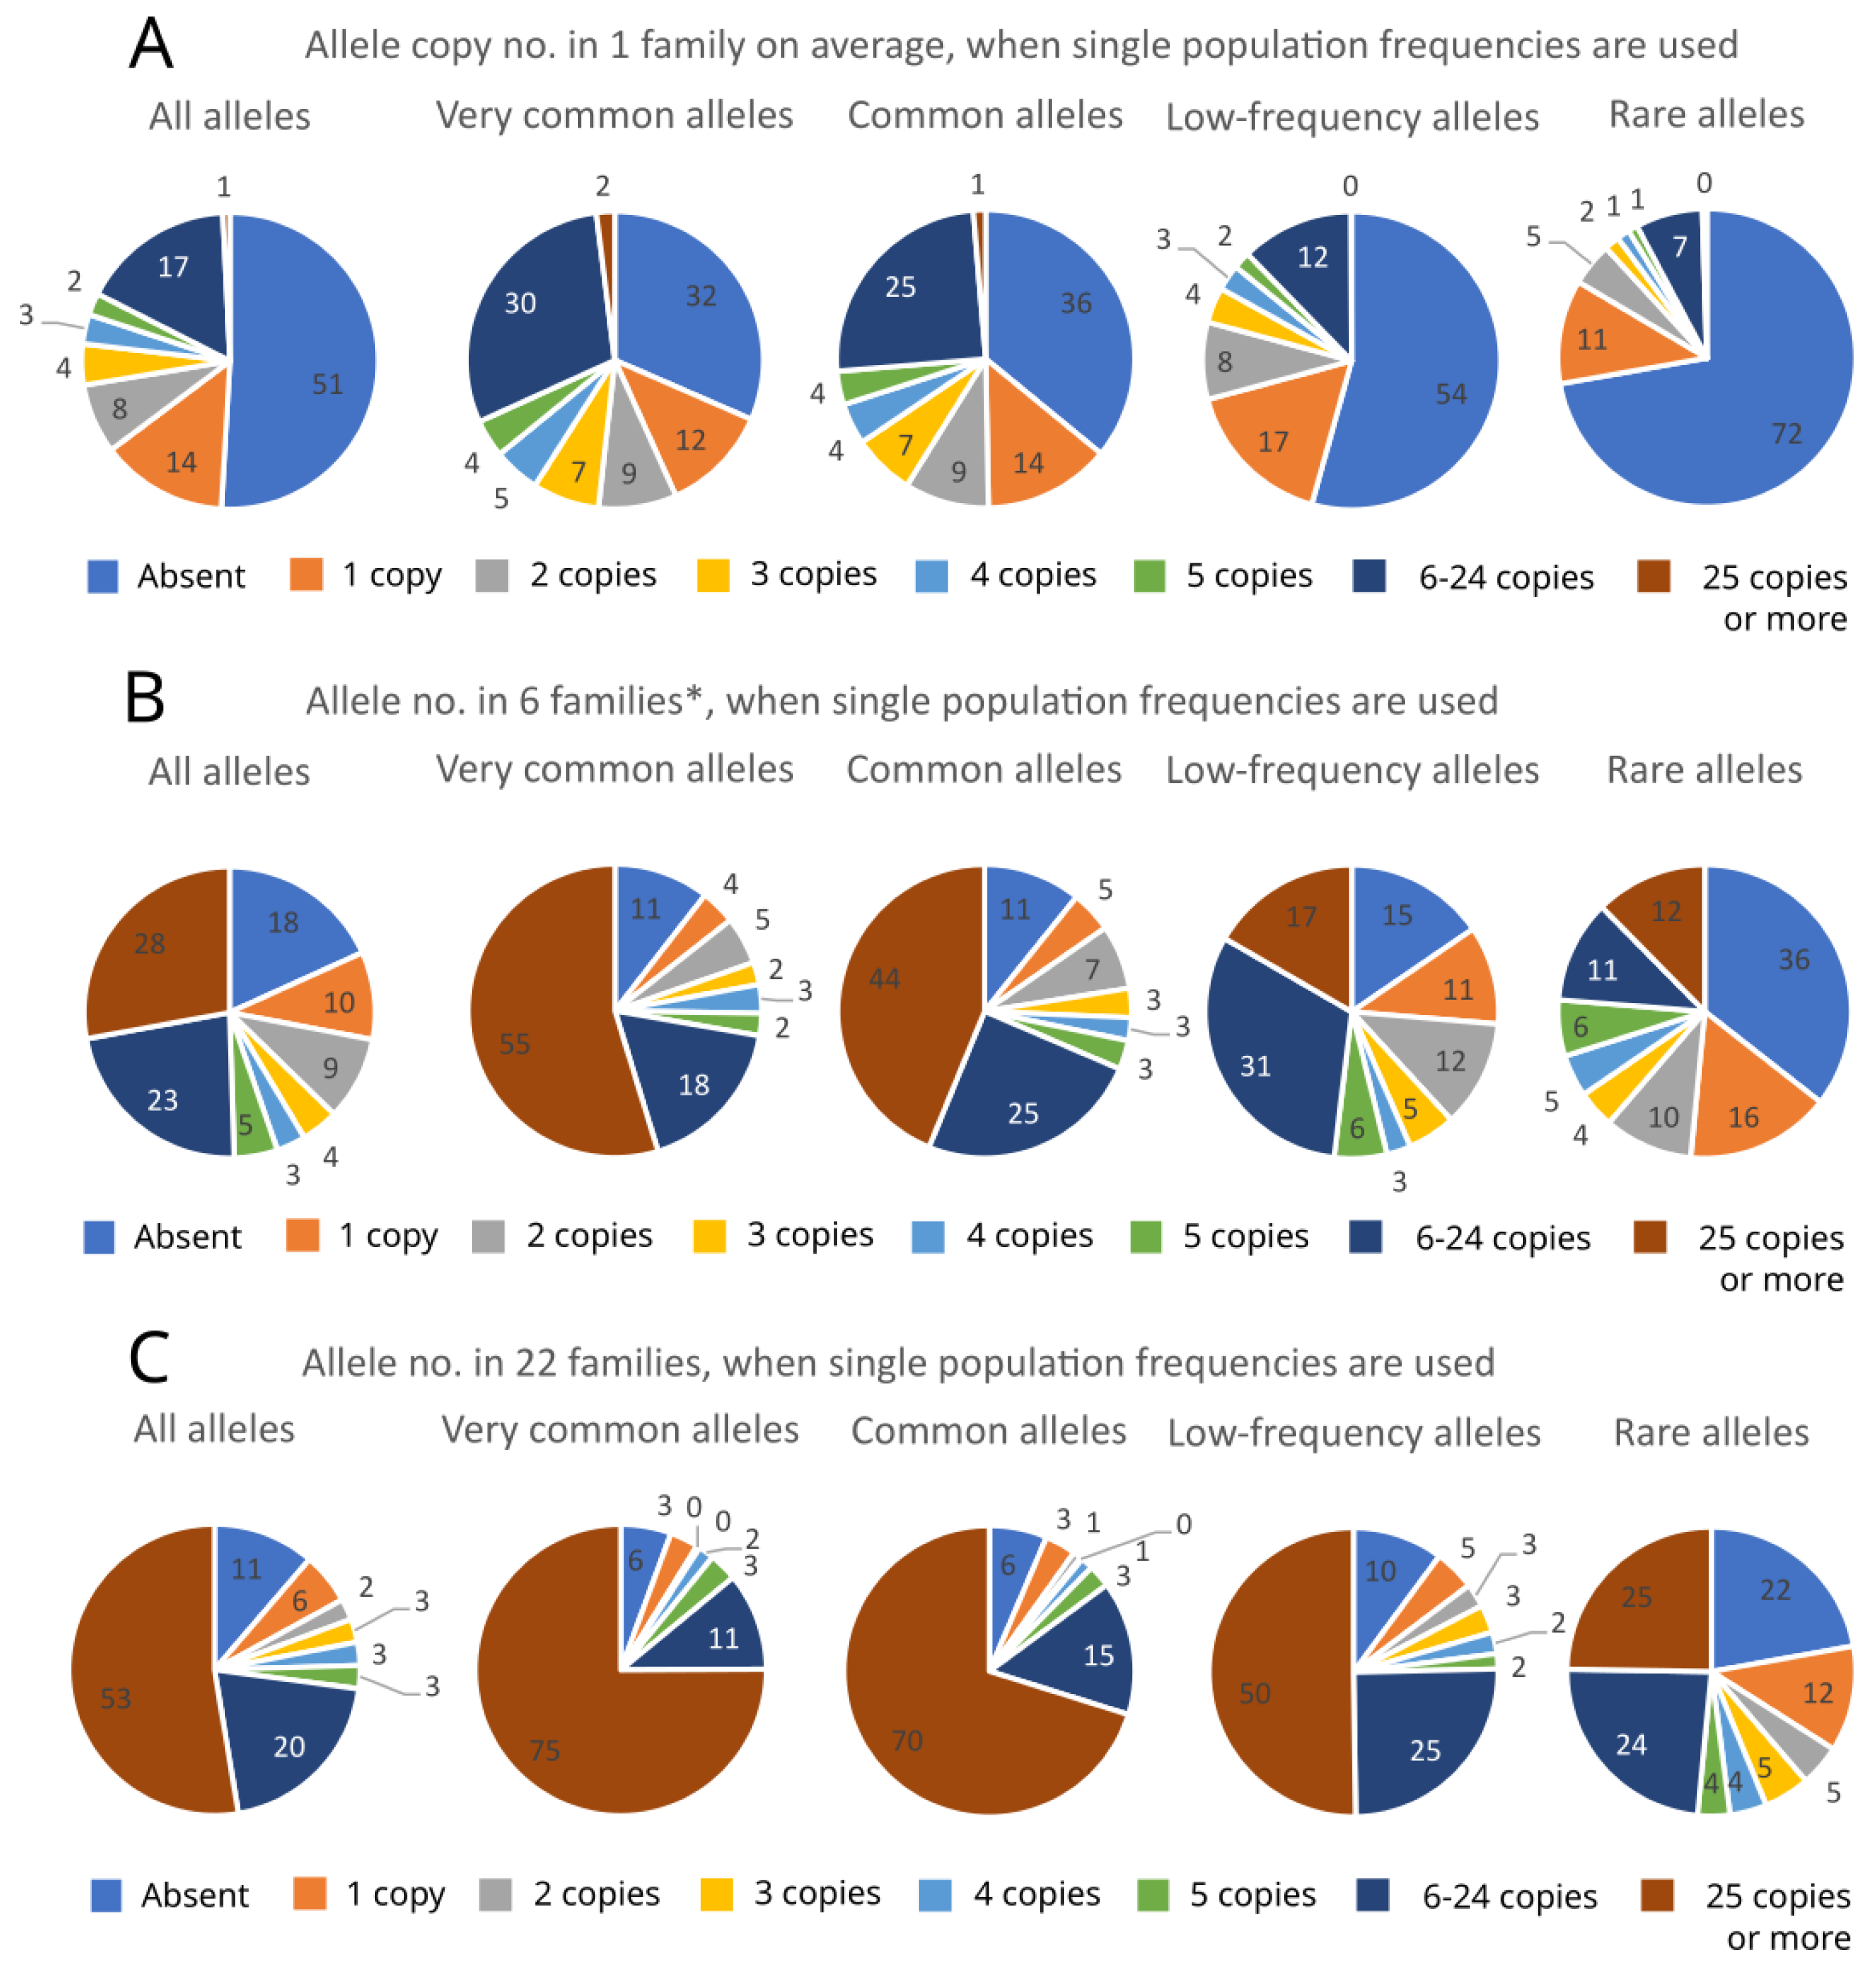
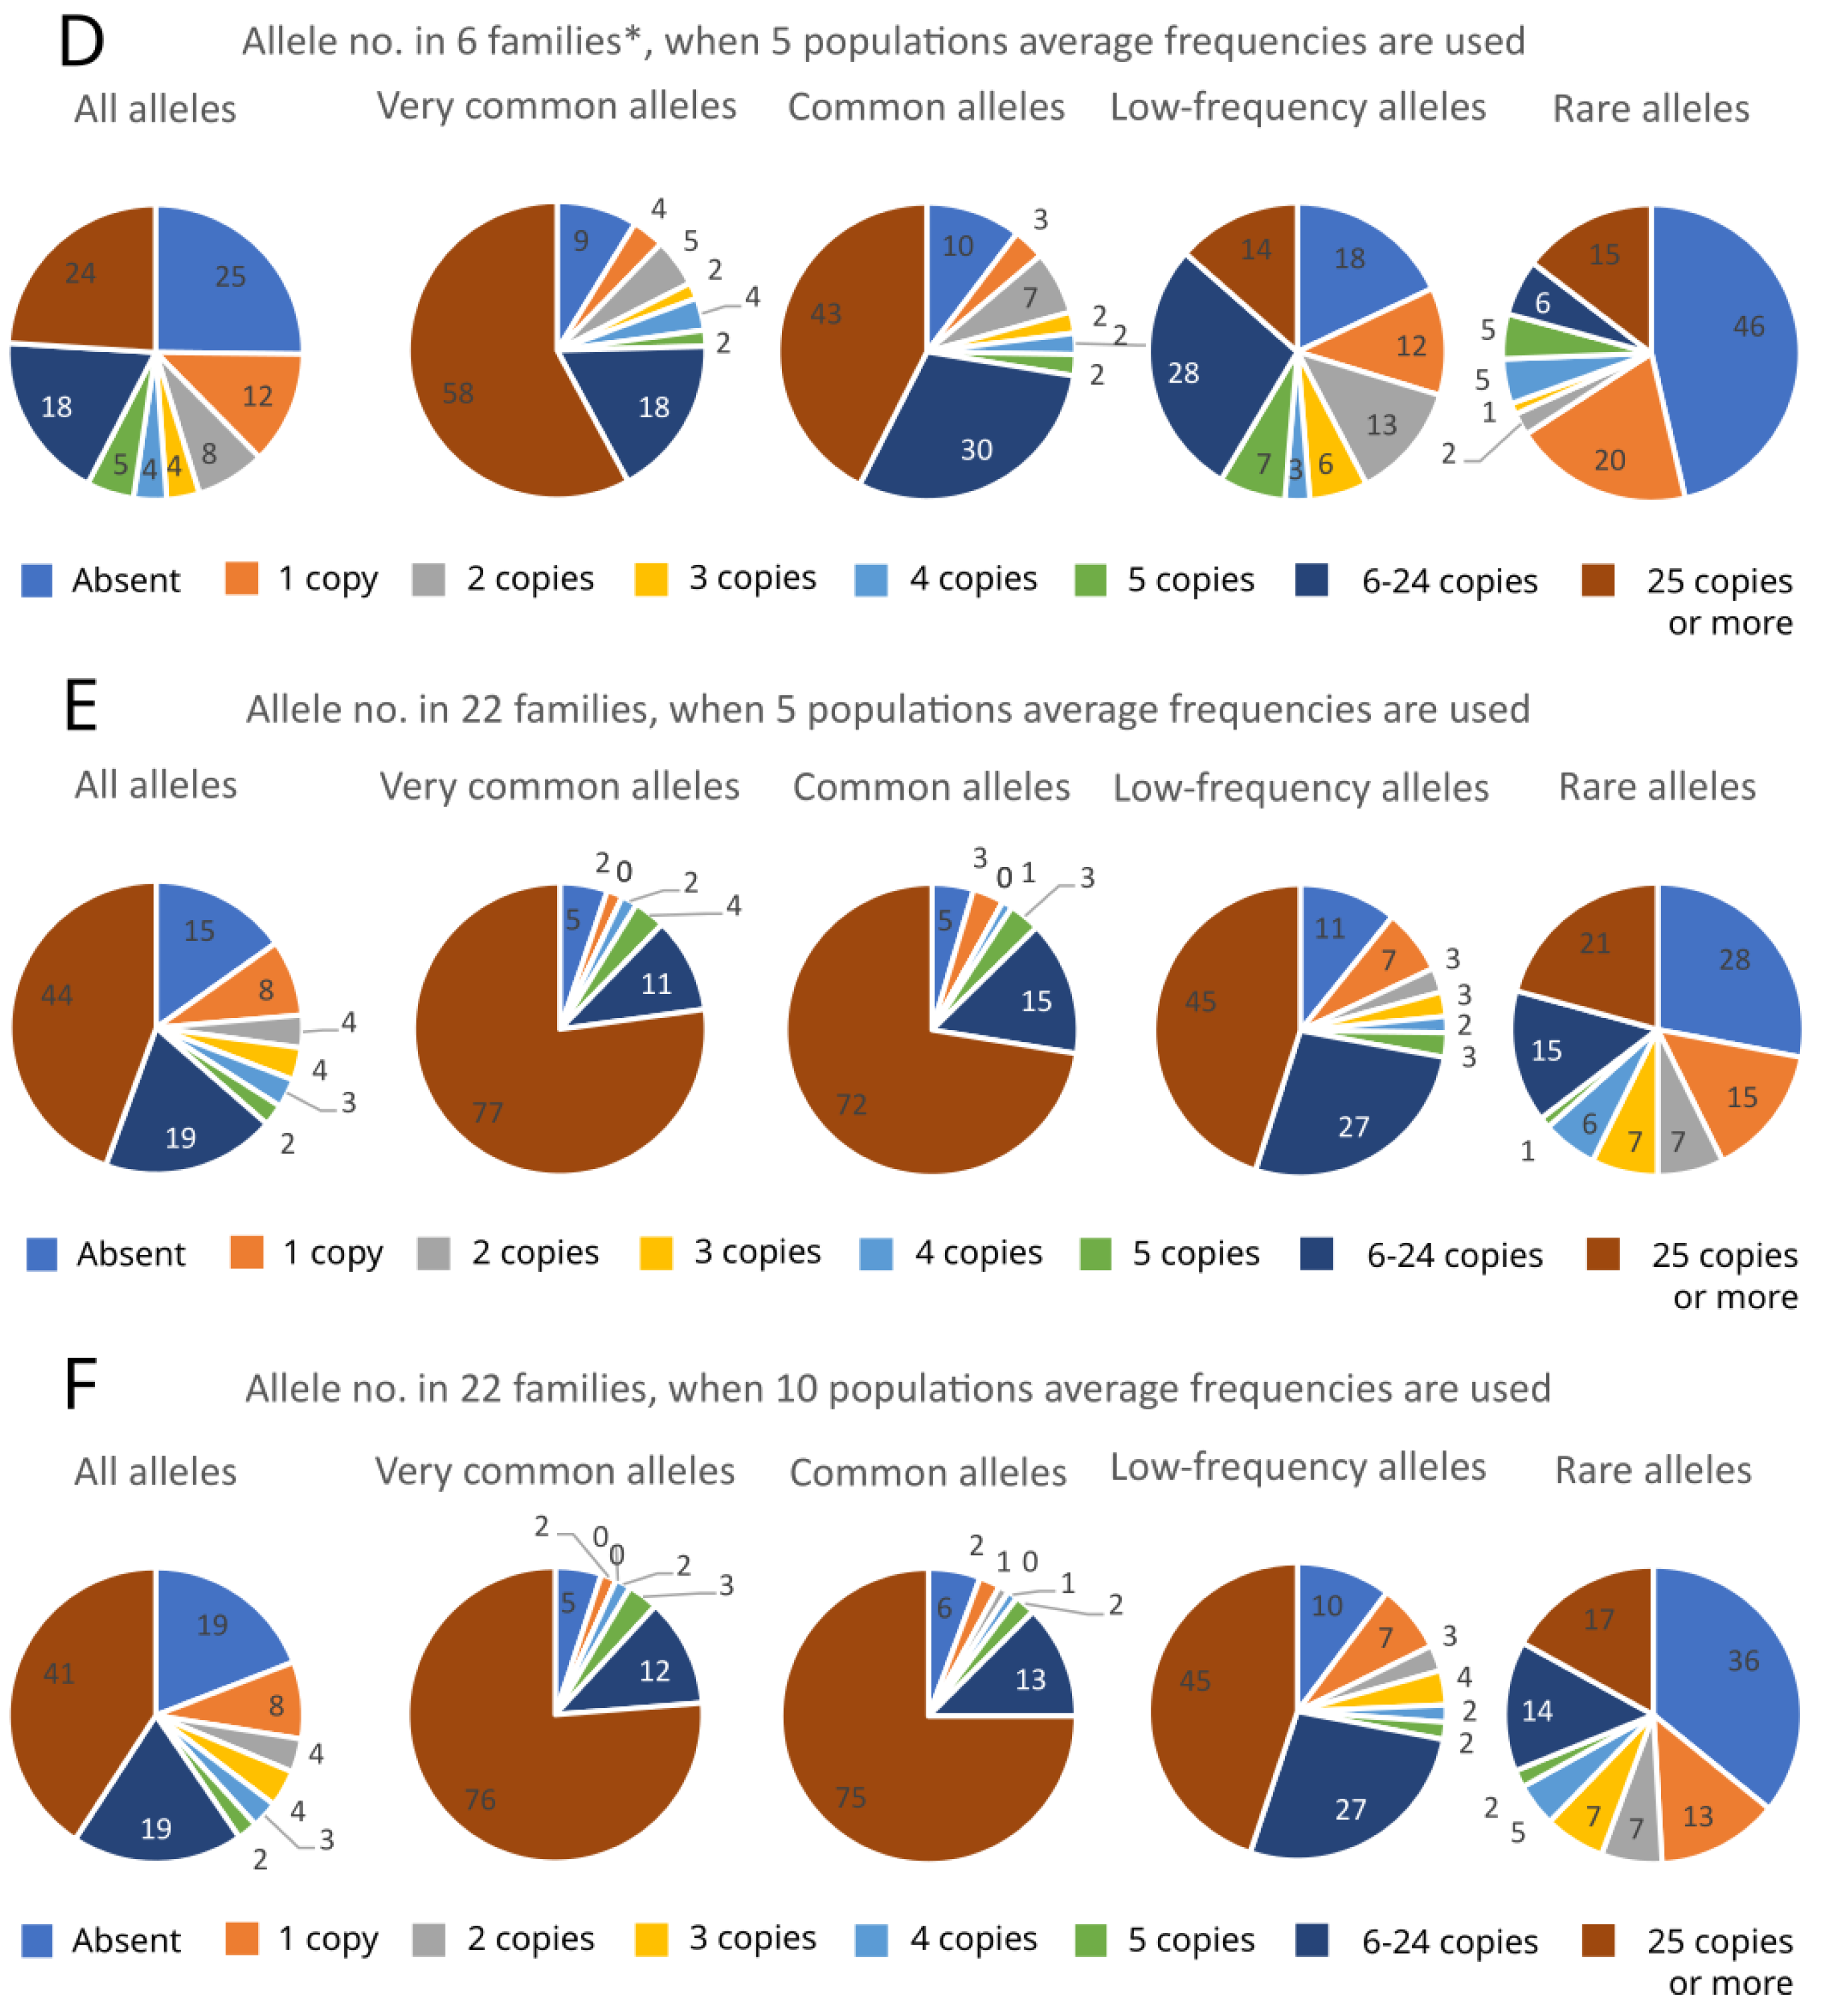
2. Results
3. Discussion
4. Materials and Methods
4.1. Description of the Progeny Plantation
4.2. Description of the GCUs
4.3. Sampling
4.4. Molecular Analysis
4.5. Sample Lots Used for Comparisons
Supplementary Materials
Author Contributions
Funding
Data Availability Statement
Acknowledgments
Conflicts of Interest
References
- Durrant, T.H.; de Rigo, D.; Caudullo, G. Alnus glutinosa in Europe: Distribution, Habitat, Usage and Threats. In European Atlas of Forest Tree Species; San-MiguelAyanz, J., de Rigo, D., Caudullo, G., Houston Durrant, T., Mauri, A., Eds.; Publication Office of the European Union: Luxembourg, 2016; pp. 64–65. [Google Scholar]
- Klimo, E.; Hager, H. The Floodplain Forests in Europe; EFI research reports; Brill: Leiden, The Netherlands, 2001; Volume 10. [Google Scholar]
- Klimo, E.; Hager, H.; Matić, S.; Anić, I.; Kulhavý, J. Floodplain Forests of the Temperate Zone of Europe; Lesnická Práce: Kostelec nad Černými lesy, Czech Republic, 2008; p. 623. [Google Scholar]
- Kajba, D.; Krstinić, A. Species of the genus Alnus l. suitable for biomass production. Šumarski List 1998, 3–4, 131–137. [Google Scholar]
- Ceballos, G.; Ehrlich, P.R.; Dirzo, R. Biological annihilation via the ongoing sixth mass extinction signaled by vertebrate population losses. Proc. Natl. Acad. Sci. USA 2017, 114, E6089–E6096. [Google Scholar] [CrossRef] [PubMed]
- Román-Palacios, C.; Wiens, J.J. Recent responses to climate change reveal the drivers of species extinction and survival. Proc. Natl. Acad. Sci. USA 2020, 117, 4211–4217. [Google Scholar] [CrossRef] [PubMed]
- Guerrant, E.O., Jr.; Fiedler, P.L.; Havens, K.; Maunder, M. Revised genetic sampling guidelines for conservation collections of rare and endangered plants: Supporting species survival in the wild. In Ex Situ Plant Conservation: Supporting Species Survival in the Wild; Guerrant, E.O., Havens, K., Maunder, M., Eds.; Island Press: Washington, DC, USA, 2004; pp. 419–441. [Google Scholar]
- Griffith, M.P.; Calonje, M.; Meerow, A.W.; Tut, F.; Kramer, A.T.; Hird, A.; Magellan, T.M.; Husby, C.E. Can a botanic garden cycad collection capture the genetic diversity in a wild population? Int. J. Plant. Sci. 2015, 176, 1–10. [Google Scholar] [CrossRef]
- Hoban, S.; Bruford, M.; Jackson, J.D.; Lopes-Fernandes, M.; Heuertz, M.; Hohenlohe, P.A.; Paz-Vinas, I.; Sjögren-Gulve, P.; Segelbacher, G.; Vernesi, C.; et al. Genetic diversity targets and indicators in the CBD post-2020 Global Biodiversity Framework must be improved. Biol. Conserv. 2020, 248, 108654. [Google Scholar] [CrossRef]
- Hoban, S.; Callicrate, T.; Clark, J.; Deans, S.; Dosmann, M.; Fant, J.; Gailing, O.; Havens, K.; Hipp, A.L.; Kadav, P.; et al. Taxonomic similarity does not predict necessary sample size for ex situ conservation: A comparison among five genera. Proc. R. Soc. B 2020, 287, 20200102. [Google Scholar] [CrossRef] [PubMed]
- Marshall, D.R.; Brown, A.H.D. Optimum sampling strategies in genetic conservation. In Crop Genetic Resources for Today and Tomorrow; Frankel, O.H., Hawkes, J.G., Eds.; Cambridge University Press: Cambridge, UK, 1975; pp. 53–80. [Google Scholar]
- Hoban, S.; Strand, A. Ex situ seed collections will benefit from considering spatial sampling design and species’ reproductive biology. Biol. Conserv. 2015, 187, 182–191. [Google Scholar] [CrossRef]
- Richards, C.M.; Antolin, M.F.; Reilley, A.; Poole, J.; Walters, C. Capturing genetic diversity of wild populations for ex situ conservation: Texas wild rice (Zizania texana) as a model. Genet. Resour. Crop. Evol. 2007, 54, 837–848. [Google Scholar] [CrossRef]
- Griffith, M.P.; Calonje, M.; Meerow, A.W.; Francisco-Ortega, J.; Knowles, L.; Aguilar, R.; Tut, F.; Sánchez, V.; Meyer, A.; Noblick, L.R.; et al. Will the same ex situ protocols give similar results for closely related species? Biodivers. Conserv. 2017, 26, 2951–2966. [Google Scholar] [CrossRef]
- McGlaughlin, M.E.; Riley, L.; Brandsrud, M.; Arcibal, E.; Helenurm, M.K.; Helenurm, K. How much is enough? Minimum sampling intensity required to capture extant genetic diversity in ex situ seed collections: Examples from the endangered plant Sibara filifolia (Brassicaceae). Conserv. Genet. 2015, 16, 253–266. [Google Scholar] [CrossRef]
- Flower, C.E.; Fant, J.B.; Hoban, S.; Knight, K.S.; Steger, L.; Aubihl, E.; Gonzalez-Meler, M.A.; Forry, S.; Hille, A.; Royo, A.A. Optimizing conservation strategies for a threatened tree species: In-situ conservation of white ash (Fraxinus americana L.) genetic diversity through insecticide treatment. Forests 2018, 9, 202. [Google Scholar] [CrossRef]
- Namoff, S.; Husby, C.E.; Francisco-Ortega, J.; Noblick, L.R.; Lewis, C.E.; Griffith, M.P. How well does a botanical garden collection of a rare palm capture the genetic variation in a wild population? Biol. Conserv. 2010, 143, 1110–1117. [Google Scholar] [CrossRef]
- Brown, A.H.D.; Marshall, D.R. A basic sampling strategy: Theory and practice. In Collecting Plant Genetic Diversity: Technical Guidelines; Guarino, L., Rao, V.R., Reid, R., Eds.; Cambridge University Press: Wallingford, UK, 1995; pp. 75–91. [Google Scholar]
- Brown, A.H.D.; Briggs, J.D. Sampling strategies for genetic variation in ex-situ collections of endangered plant species. In Genetics and Conservation of Rare Plants; Falk, D.A., Holsinger, K.E., Eds.; Oxford University Press: New York, NY, USA, 1991; pp. 99–119. [Google Scholar]
- Hoban, S. New guidance for ex situ gene conservation: Sampling realistic population systems and accounting for collection attrition. Biol. Conserv. 2019, 235, 199–208. [Google Scholar] [CrossRef]
- Griffith, M.P.; Barber, G.; Tucker Lima, J.; Barros, M.; Calonje, C.; Noblick, L.R.; Calonje, M.; Magellan, T.; Dosmann, M.; Thibault, T.; et al. Plant collection “half-life:” can botanic gardens weather the climate? Curator Mus. J. 2017, 60, 395–410. [Google Scholar] [CrossRef]
- Hoban, S.; Schlarbaum, S. Optimal sampling of seeds from plant populations for ex-situ conservation of genetic biodiversity, considering realistic population structure. Biol. Conserv. 2014, 177, 90–99. [Google Scholar] [CrossRef]
- EUFORGEN. European Forest Genetic Resources Programme. Available online: https://www.euforgen.org/species/ (accessed on 29 January 2023).
- McVean, D.N. Alnus glutinosa (L.) Gaertn. J. Ecol. 1953, 41, 447–466. [Google Scholar] [CrossRef]
- Chambers, F.M.; Elliott, L. Spread and Expansion of Alnus Mill. In the British Isles: Timing, Agencies and Possible Vectors. J. Biogeogr. 1989, 16, 541–550. [Google Scholar] [CrossRef]
- Kajba, D.; Gračan, J. EUFORGEN Technical Guidelines for Genetic Conservation and Use for Black Alder (Alnus glutinosa); International Plant Genetic Resources Institute: Rome, Italy, 2003; pp. 1–4. [Google Scholar]
- Cox, K.; Vanden Broeck, A.; Van Calster, H.; Mergeay, J. Temperature-related natural selection in a wind-pollinated tree across regional and continental scales. Mol. Ecol. 2011, 20, 2724–2738. [Google Scholar] [CrossRef]
- Lepais, O.; Muller, S.D.; Ben Saad-Limam, S.; Benslama, M.; Rhazi, L.; Belouahem-Abed, D.; Daoud-Bouattour, A.; Gammar, A.M.; Ghrabi-Gammar, Z.; Bacles, C.F.E. High genetic diversity and distinctiveness of rear-edge climate relicts maintained by ancient tetraploidisation for Alnus glutinosa. PLoS ONE 2013, 8, e75029. [Google Scholar] [CrossRef]
- Havrdová, A.; Douda, J.; Krak, K.; Vít, P.; Hadincová, V.; Zákravský, P.; Mandák, B. Higher genetic diversity in recolonized areas than in refugia of Alnus glutinosa triggered by continent-wide lineage admixture. Mol. Ecol. 2015, 24, 4759–4777. [Google Scholar] [CrossRef]
- Mingeot, D.; Husson, C.; Mertens, P.; Watillon, B.; Bertin, P.; Druart, P. Genetic diversity and genetic structure of black alder (Alnus glutinosa [L.] Gaertn) in the Belgium-Luxembourg-France cross-border area. Tree Genet. Genomes 2016, 12, 1–12. [Google Scholar] [CrossRef]
- Beatty, G.E.; Montgomery, W.I.; Tosh, D.G.; Provan, J. Genetic provenance and best practice woodland management: A case study in native alder (Alnus glutinosa). Tree Genet. Genomes 2015, 11, 1–7. [Google Scholar] [CrossRef]
- Verbylaitė, R.; Aravanopoulos, F.A.; Baliuckas, V.; Juškauskaitė, A. Genetic Monitoring of Alnus glutinosa Natural Populations Using Two Generation Cohorts. Forests 2023, 14, 330. [Google Scholar] [CrossRef]
- De Kort, H.; Vandepitte, K.; Bruun, H.H.; Closset-Kopp, D.; Honnay, O.; Mergeay, J. Landscape genomics and a common garden trial reveal adaptive differentiation to temperature across Europe in the tree species Alnus glutinosa. Mol. Ecol. 2014, 23, 4709–4721. [Google Scholar] [CrossRef] [PubMed]
- Slezák, M.; Douda, J.; Šibíková, M.; Jarolímek, I.; Senko, D.; Hrivnák, R. Topographic indices predict the diversity of Red List and non-native plant species in human-altered riparian ecosystems. Ecol. Indic. 2022, 139, 108949. [Google Scholar] [CrossRef]
- Krstinič, A.; Gračan, J.; Kajba, D. Alnus spp. genetic resources conservation strategy. In Noble Hardwoods Network, Report of the Fourth Meeting, 4–6 September 1999, Gmunden, Austria, and the Fifth Meeting, 17–19 May 2001, Blessington, Ireland; Turok, J., Eriksson, G., Russell, K., Borelli, S., Eds.; International Plant Genetic Resources Institute: Rome, Italy, 2002; pp. 44–49. [Google Scholar]
- Van Oosterhout, C.; Hutchison, W.F.; Wills, D.P.M.; Shipley, P. Micro-Checker: Software for identifying and correcting genotyping errors in microsatellite data. Mol. Ecol. 2004, 4, 535–538. [Google Scholar] [CrossRef]
- Cubry, P.; Gallagher, E.; O’Connor, E.; Kelleher, C.T. Phylogeography and Population Genetics of Black Alder (Alnus Glutinosa (L.) Gaertn.) in Ireland: Putting It in a European Context. Tree Genet. Genomes 2015, 11, 99. [Google Scholar] [CrossRef]
- Forest resources. In Lithuanian Statistical Yearbook of Forestry; State Forestry Service: Kaunas, Lithuania, 2021; pp. 12–25.
- Verbylaitė, R. European Aspen (Populus tremula L.) in Lithuania: Genetic Diversity of Plus trees and Populations Assessed Using Molecular Markers. Ph.D. Thesis, Vytautas Magnus University, Kaunas, Lithuania, 2015. [Google Scholar]
- Koskela, J.; Lefèvre, F.; Schueler, S.; Kraigher, H.; Olrik, D.C.; Hubert, J.; Longauer, R.; Bozzano, M.; Yrjänä, L.; Alizoti, P.; et al. Translating conservation genetics into management: Pan-European minimum requirements for dynamic conservation units of forest tree genetic diversity. Biol. Conserv. 2013, 157, 39–49. [Google Scholar] [CrossRef]
- De Vries, S.M.; Alan, M.; Bozzano, M.; Burianek, V.; Collin, E.; Cottrell, J.; Ivankovic, M.; Kelleher, C.T.; Koskela, J.; Rotach, P.; et al. Pan-European Strategy for Genetic Conservation of Forest Trees and Establishment of a Core Network of Dynamic Conservation Units; European Forest Genetic Resources Programme (EUFORGEN): Bioversity International: Rome, Italy, 2015; p. xii + 40. [Google Scholar]
- EUFGIS European Information System on Forest Genetic Resources. Available online: http://portal.eufgis.org/ (accessed on 29 October 2023).
- Durrant, T.H.; de Rigo, D.; Caudullo, G. Alnus incana in Europe: Distribution, Habitat, Usage and Threats. In European Atlas of Forest Tree Species; San-MiguelAyanz, J., de Rigo, D., Caudullo, G., Houston Durrant, T., Mauri, A., Eds.; Publication Office of the European Union: Luxembourg, 2016; pp. 66–67. [Google Scholar]
- Jurkšiene, G.; Tamošaitis, S.; Kavaliauskas, D.; Buchovska, J.; Danusevičius, D.; Baliuckas, V. Identification of Alnus glutinosa L. and A. incana (L.) Moench. Hybrids in Natural Forests Using Nuclear DNA Microsatellite and Morphometric Markers. Forests 2021, 12, 1504. [Google Scholar] [CrossRef]
- Banaev, E.; Bažant, V. Study of Natural Hybridization between Alnus incana (L.) Moench. and Alnus glutinosa (L.) Gaertn. J. For. Sci. 2007, 53, 66–73. [Google Scholar] [CrossRef]
- Mejnartowicz, L. Morphology and Growth of Alnus incana × Glutinosa Hybrids. Arbor. Kórnickie Rocz. 1982, 26, 15–28. [Google Scholar]
- Aleksandravičiūtė, B.; Apalia, D.; Brundza, K.; Bagdonaitė, A.; Čibiras, L.; Jankevičienė, R.; Lekavičius, A.; Lukaitienė, M.; Lisaitė, B.; Marcinkevičienė, J.; et al. Flora of Lithuania (Lietuvos TSR Flora); Natkevičaitė-Ivanauskienė, M., Ed.; Valstybinė Politinės ir Mokslinės literatūros leidykla [State Publishing House of Political and Scientific Literature]: Vilnius, Lithuania, 1961; Volume III. [Google Scholar]
- Jurkšienė, G.; Sirgedaite-Šėžienė, V.; Juškauskaitė, A.; Baliuckas, V. Identification of Alnus incana (L.) Moenx. × Alnus glutinosa (L.) Gaertn. Hybrids Using Metabolic Compounds as Chemotaxonomic Markers. Forests 2023, 14, 150. [Google Scholar] [CrossRef]
- Voronova, A.; Lazdina, D.; Korica, A.; Veinberga, I.; Liepins, K.; Rungis, D. Evaluation of Allelic Content in an Experimental Alder (Alnus Spp.) Plantation. Acta Biol. Univ. Daugavp. 2015, 15, 227–240. [Google Scholar]
- Dumolin, S.; Demesure, B.; Petit, R.J. Inheritance of chloroplast and mitochondrial genomes in pedunculated oak investigated with an efficient PCR method. Theory Appl. Genet. 1995, 91, 1253–1256. [Google Scholar] [CrossRef] [PubMed]
- Kalia, R.K.; Rai, M.K.; Kalia, S.; Singh, R.; Dhawan, A. Microsatellite markers: An overview of the recent progress in plants. Euphytica 2011, 177, 309–334. [Google Scholar] [CrossRef]
- Peakall, R.; Smouse, P.E. GENALEX 6: Genetic analysis in Excel. Population genetic software for teaching and research. Mol. Ecol. Notes 2006, 6, 288–295. [Google Scholar] [CrossRef]
- Peakall, R.; Smouse, P.E. GenAlEx 6.5: Genetic analysis in Excel. Population genetic software for teaching and research-an update. Bioinformatics 2012, 28, 2537–2539. [Google Scholar] [CrossRef]
- Smouse, P.E.; Banks, S.C.; Peakall, R. Converting quadratic entropy to diversity: Both animals and alleles are diverse, but some are more diverse than others. PLoS ONE 2017, 12, e0185499. [Google Scholar] [CrossRef]
- Goudet, J. FSTAT (Version 2.9. 3.2): A Program to Estimate and Test gene Diversities and Fixation Indices. 2002. Available online: http://www.unil.ch/izea/software/fstat.html (accessed on 15 August 2023).
- Wu, B.; Lian, C.; Hogetsu, T. Development of microsatellite markers in white birch (Betula platyphylla var. japonica). Mol. Ecol. 2002, 3, 413–415. [Google Scholar] [CrossRef]
- Gürcan, K.; Mehlenbacher, S.A.; Botta, R.; Boccacci, P. Development, characterization, segregation, and mapping of microsatellite markers for European hazelnut (Corylus avellana L.) from enriched genomic libraries and usefulness in genetic diversity studies. Tree Genet. Genomes 2010, 6, 513–531. [Google Scholar] [CrossRef]
- Kulju, K.K.M.; Pekkinen, M.; Varvio, S. Twenty-three microsatellite primer pairs for Betula pendula (Betulaceae). Mol. Ecol. Notes 2004, 4, 471–473. [Google Scholar] [CrossRef]
- Tsuda, Y.; Ueno, S.; Ide, Y.; Tsumura, Y. Development of 14 ESTSSRs for Betula maximowicziana and their applicability to related species. Conserv. Genet. 2009, 10, 661–664. [Google Scholar] [CrossRef]
- Ogyu, K.; Tsuda, Y.; Sugaya, T.; Yoshimaru, H.; Ide, Y. Identification and characterization of microsatellite loci in Betula maximowicziana Regel. Mol. Ecol. Notes 2003, 3, 268–269. [Google Scholar] [CrossRef]
- Tsuda, Y.; Ueno, S.; Ranta, J.; Salminen, K.; Ide, Y.; Shinohara, K.; Tsumura, Y. Development of 11 EST-SSRs for Japanese white birch, Betula platyphylla var. japonica and their transferability to related species. Conserv. Genet. 2009, 10, 1385–1388. [Google Scholar] [CrossRef]
- Lepais, O.; Bacles, C.F.E. De novo discovery and multiplexed amplification of microsatellite markers for black alder (Alnus glutinosa) and related species using SSR-enriched shotgun pyrosequencing. J. Hered. 2011, 102, 627–632. [Google Scholar] [CrossRef]


| Low-Frequency Alleles | Local Alleles | All Alleles | ||
|---|---|---|---|---|
| Minimal collection (1 copy) | 10–20 pops | 50–70 | 100–200 | 200–800 |
| 2–7 pops | 40–60 | 30–80 | 150–550 | |
| Secure collection (5 copies) | 10–20 pops | 200–280 | 400–800 | 800–3200 |
| 2–7 pops | 160–320 | 120–320 | 600–2200 | |
| Robust collection (25 copies) | 10–20 pops | 800–1120 | 1600–3200 | 3200–12,800 |
| 2–7 pops | 640–960 | 480–1280 | 2400–8800 |
| Sample Lot | Ne | Ho | He | FIS | Ar |
|---|---|---|---|---|---|
| BAT | 5.08 ± 0.54 | 0.73 ± 0.04 | 0.75 ± 0.04 | 0.03 ± 0.03 | 2.89 ± 0.12 |
| JUO | 4.98 ± 0.46 | 0.64 ± 0.04 | 0.77 ± 0.02 | 0.18 ± 0.04 | 3.94 ± 0.08 |
| MIK | 4.46 ± 0.44 | 0.70 ± 0.04 | 0.72 ± 0.04 | 0.05 ± 0.04 | 2.79 ± 0.11 |
| PAZ | 4.60 ± 0.47 | 0.73 ± 0.04 | 0.73 ± 0.04 | 0.01 ± 0.03 | 2.81 ± 0.11 |
| VIL | 5.17 ± 0.49 | 0.76 ± 0.03 | 0.76 ± 0.03 | 0.01 ± 0.03 | 2.92 ± 0.11 |
| 5 * GCU pops combined | 5.30 ± 0.51 | 0.71 ± 0.03 | 0.77 ± 0.03 | 0.08 ± 0.02 | 2.87 ± 0.05 |
| 10 GCU pops combined | 4.97 ± 0.16 | 0.73 ± 0.01 | 0.75 ± 0.01 | 0.04 ± 0.02 | 2.88 ± 0.03 |
| Family 89 | 3.38 ± 0.26 | 0.79 ± 0.06 | 0.67 ± 0.05 | −0.17 ± 0.06 | 2.59 ± 0.10 |
| Family 97 | 3.16 ± 0.30 | 0.70 ± 0.06 | 0.63 ± 0.04 | −0.10 ± 0.07 | 2.49 ± 0.11 |
| Family 103 | 3.44 ± 0.34 | 0.72 ± 0.06 | 0.64 ± 0.05 | −0.10 ± 0.05 | 2.56 ± 0.13 |
| Family 121 | 3.31 ± 0.22 | 0.85 ± 0.05 | 0.67 ± 0.03 | −0.25 ± 0.04 | 2.59 ± 0.09 |
| Family 135 | 3.88 ± 0.26 | 0.87 ± 0.03 | 0.72 ± 0.02 | −0.19 ± 0.05 | 2.75 ± 0.08 |
| Family 139 | 3.65 ± 0.28 | 0.82 ± 0.05 | 0.69 ± 0.04 | −0.17 ± 0.05 | 2.67 ± 0.11 |
| 6 ** families combined | 4.88 ± 0.42 | 0.79 ± 0.04 | 0.75 ± 0.03 | −0.05 ± 0.02 | 2.61 ± 0.04 |
| 22 families combined | 3.48 ± 0.06 | 0.77 ± 0.01 | 0.66 ± 0.01 | −0.01 ± 0.02 | 2.61 ± 0.02 |
| Sample Lot | No. of All Alleles | No. of Very Common Alleles (>0.10) | No. of Common Alleles (>0.05) | No. of Low-Frequency Alleles (0.10 > 0.01) | No. of Rare Alleles (<0.01) |
|---|---|---|---|---|---|
| BAT | 171 | 57 (33%) | 90 (53%) | 83 (49%) | 31 (18%) |
| JUO | 187 | 58 (31%) | 89 (48%) | 90 (48%) | 39 (21%) |
| MIK | 178 | 50 (28%) | 88 (49%) | 88 (49%) | 40 (23%) |
| PAZ | 168 | 61 (36%) | 84 (50%) | 71 (42%) | 36 (21%) |
| VIL | 189 | 59 (31%) | 85 (45%) | 82 (43%) | 48 (25%) |
| 5 pops combined | 249 | 57 (23%) | 87 (35%) | 110 (44%) | 82 (33%) |
| 10 pops combined | 272 | 59 (22%) | 88 (32%) | 107 (39%) | 106 (39%) |
| Locus | Repeat Motif Size | No of Alleles | Allele Interval (In bp) | Primer Source References |
|---|---|---|---|---|
| A2 | 2 | 8 | 132–150 | [56] |
| A22 | 2 | 15 | 151–181 | [57] |
| A10 | 2 | 12 | 107–133 | [58] |
| A35 | 2 | 16 | 216–248 | [59] |
| A38 | 3 | 15 | 97–151 | [59] |
| A7 | 2 | 13 | 168–200 | [60] |
| A37 | 2 | 19 | 239–275 | [61] |
| A26 | 2 | 19 | 341–377 | [57] |
| Ag30 | 2 | 18 | 76–114 | [62] |
| Ag05 | 2 | 17 | 136–172 | [62] |
| Ag10 | 2 | 16 | 205–249 | [62] |
| Ag14 * | 2 | 31 | 271–341 | [62] |
| Ag27 | 2 | 16 | 74–118 | [62] |
| Ag35 | 2 | 24 | 164–214 | [62] |
| Ag13 | 2 | 17 | 243–283 | [62] |
| Ag25 | 2 | 24 | 73–131 | [62] |
| Ag09 | 2 | 26 | 186–264 | [62] |
| Ag20 * | 2 | 19 | 283–333 | [62] |
| Ag01 | 2 | 12 | 126–188 | [62] |
| Ag23 * | 2 | 9 | 336–370 | [62] |
Disclaimer/Publisher’s Note: The statements, opinions and data contained in all publications are solely those of the individual author(s) and contributor(s) and not of MDPI and/or the editor(s). MDPI and/or the editor(s) disclaim responsibility for any injury to people or property resulting from any ideas, methods, instructions or products referred to in the content. |
© 2023 by the authors. Licensee MDPI, Basel, Switzerland. This article is an open access article distributed under the terms and conditions of the Creative Commons Attribution (CC BY) license (https://creativecommons.org/licenses/by/4.0/).
Share and Cite
Verbylaitė, R.; Aravanopoulos, F.A.; Baliuckas, V.; Juškauskaitė, A.; Ballian, D. Can a Forest Tree Species Progeny Trial Serve as an Ex Situ Collection? A Case Study on Alnus glutinosa. Plants 2023, 12, 3986. https://doi.org/10.3390/plants12233986
Verbylaitė R, Aravanopoulos FA, Baliuckas V, Juškauskaitė A, Ballian D. Can a Forest Tree Species Progeny Trial Serve as an Ex Situ Collection? A Case Study on Alnus glutinosa. Plants. 2023; 12(23):3986. https://doi.org/10.3390/plants12233986
Chicago/Turabian StyleVerbylaitė, Rita, Filippos A. Aravanopoulos, Virgilijus Baliuckas, Aušra Juškauskaitė, and Dalibor Ballian. 2023. "Can a Forest Tree Species Progeny Trial Serve as an Ex Situ Collection? A Case Study on Alnus glutinosa" Plants 12, no. 23: 3986. https://doi.org/10.3390/plants12233986
APA StyleVerbylaitė, R., Aravanopoulos, F. A., Baliuckas, V., Juškauskaitė, A., & Ballian, D. (2023). Can a Forest Tree Species Progeny Trial Serve as an Ex Situ Collection? A Case Study on Alnus glutinosa. Plants, 12(23), 3986. https://doi.org/10.3390/plants12233986