Article

Optimization and Characterization of Phenolic Extraction Conditions and Antioxidant Activity Evaluation of Adenanthera pavonina L. Bark

1
Ethnopharmacology Laboratory, Department of Botany, Visva-Bharati University, Santiniketan 731235, West Bengal, India
2
Department of Applied Geosciences, GZG—University of Göttingen, Goldschmidtstraße 3, 37077 Göttingen, Lower Saxony, Germany
3
Department of Molecular Pharmaceutics, College of Pharmacy, University of Utah, Salt Lake City, UT 84112, USA
4
New York State Center for Clean Water Technology, Stony Brook University, Stony Brook, NY 11794, USA
5
School of Marine and Atmospheric Sciences, Stony Brook University, Stony Brook, NY 11794, USA
6
Department of Environmental Science, College of Agricultural Sciences, IUBAT—International University of Business Agriculture and Technology, Dhaka 1230, Bangladesh
*
Authors to whom correspondence should be addressed.
Plants 2023, 12(22), 3902; https://doi.org/10.3390/plants12223902
Submission received: 15 October 2023 / Revised: 6 November 2023 / Accepted: 14 November 2023 / Published: 19 November 2023

Abstract

:
The presence of high levels of secondary metabolites in medicinal plants can significantly influence the progress of drug development. Here, we aimed to maximize phenolic extraction from Adenanthera pavonina L. stem bark using various solvents such as ethyl acetate, methanol, petroleum ether, and chloroform. A response surface method (RSM) with a central composite design (CCD) statistical technique was applied to optimize the extraction process, employing three important extracting parameters such as extraction time (h), temperature (°C), and solvent composition (% v/v of methanol/water) to obtain the highest phenolic content. Total phenolic content (TPC) and antioxidant activity (IC50 of extract’s DPPH radical scavenging activity) were used as response variables to find the influence of these extracting parameters. Among the various solvents used, methanol extract showed the highest contents of phenolics and the maximum level of antioxidant activity with a lower IC50 value. The notable TPC and IC50 value of the extract’s DPPH radical scavenging capacity were found to be 181.69 ± 0.20 mg GAE/g dry tissue and 60.13 ± 0.11 mg/mL, respectively, under the optimal conditions with a solvent composition of 71.61% (v/v) of methanol/water, extraction temperature of 42.52 °C, and extraction time of 24 h. The optimized extract of A. pavonina stem bark was further subjected to HPLC analysis, where six phenolic compounds, including coumarin, p-coumaric acid, chlorogenic acid, sinapic acid, gallic acid, and caffeic acid, were identified along with their respective quantities. Overall, the findings of this study uncover a low-cost analytical model for maximizing phenolic extraction from A. pavonina bark with enhanced antioxidant activity.

1. Introduction

Adenanthera pavonina L. is a perennial and tall tree in the Leguminosae family that is found in tropical and subtropical areas around the world. This tree is also known as the red bead tree worldwide. Traditionally, different parts of this plant have been used to treat an extensive range of conditions including hypertension, boils, diabetes, diarrhea, arthritis, cholera, asthma, stomach bleeding, fever, indigestion, epilepsy, vomiting, pulmonary infections, and cancer [1,2,3]. Besides these, bark and leaves are also used as a remedy for ulcers, gout, dysentery, hematemesis, and rheumatism [4]. Several studies have investigated the phytochemical and pharmacological possibilities of various parts of A. pavonina in the past [5,6,7,8]. Pharmacological investigations have shown that different parts of this plant have antinociceptive, anti-inflammatory, analgesic, anti-diarrheal, antimicrobial, antioxidant, anti-hyperglycemic, and hypolipidemic properties [2,7,9]. Phytochemical studies have demonstrated that different parts of this plant contain a wide array of chemical compounds including phenolics, flavonoids, alkaloids, steroids, saponins, triterpenoids, and glycosides [7,10].
The phenolic compounds found naturally in A. pavonina L. were suggested to be the major contributors to the antioxidant activities of the plant [11,12]. In general, the existence of hydroxyl groups is mainly responsible for the antioxidant capacity of phenolic compounds, which possess the ability to donate electrons [13]. These phenolic compounds also boost the antioxidant activities of cells by stimulating the synthesis of endogenous antioxidant molecules like glutathione peroxidase, superoxide dismutase, and catalase within the cell and inducing their defense mechanisms through the regulation of multiple signaling pathways [14,15,16].
Several existing studies have revealed that phenolic substances can suppress the generation of free radicals, break down peroxides and inactive metal ions, and hinder the process of oxygen scavenging within biological systems that ultimately defend against many oxidative diseases [17]. Thus, phenolic compounds from medicinal plants have recently gained extensive attention because of their plentiful pharmacological actions such as preventing neurodegenerative diseases, body inflammation, cancers, diabetes, osteoporosis, and cardiovascular problems [14]. Given the intrinsic utility and broad spectrum of potential uses in the pharmaceutical sector, it is crucial to concentrate on phenolic extraction. This is one of the most important steps because it is the initial step in the process of isolating bioactive compounds from plant parts.
Due to the diverse sources of phenolics from a particular plant, and the complex structure of these compounds, the extraction methods for phenolic compounds vary. Therefore, an ideal extraction method for a particular source, rich or poor in phenolic substances, has to be individually designed and optimized so that the maximum amount of phenolic compounds can be gained with minimal changes to the functional properties [18]. The extraction of phenolic compounds from a plant is generally influenced by several factors such as solvent–solid ratio, extraction time, solvent composition, particle size, solvent polarity, extraction temperature, and pH [19]. Conventional phenol extraction methods utilize a single factor or variable at a time in an experimental setup and this is called the one-variable-at-a-time technique. The major limitation of this method is that there is no scope to study the interactive effects of all the variables considered in a single experimental setup. Several other drawbacks attached to this one-variable technique are poor extraction efficiency, lengthy extraction time, and loss of thermolabile compounds [20]. To address these issues, the current work utilized the response surface methodology (RSM), a multivariate statistical technique, described by Box and Wilson, 1951 [21], to optimize the extraction procedures. The response surface methodology (RSM) is an effective statistical and mathematical technique that widely relates multiple parameters or variables to attain the optimal system efficiency for maximal bioactive phenolic extraction [22].
The current study highlights how to maximize the efficiency of phenolic extraction considering some important factors (solvent composition (v/v), extraction time (h), and extraction temperature (°C)) to gain the maximum possible phenolic content and antioxidant activity from the bark part of A. pavonina, since its stem bark contains a high amount of phenolics. The literature review revealed that no prior data focused on the optimization of the extraction of maximum phenolic compounds from the stem bark of A. pavonina. Therefore, the design of an optimized extraction method was performed for the first time to obtain a higher yield of phenolic compounds from A. pavonina bark. The RSM-based optimized extraction procedure was used to enhance the extraction efficiency, lower the cost, and reduce the time for various experiments. The present study stresses the effectiveness of the RSM technique in optimizing the extraction parameters for the highest phenolic content and provides an assessment of the antioxidant activity of the bark part of A. pavonina including phenolic compound characterization using the HPLC (high-performance liquid chromatography) method.

2. Results and Discussion

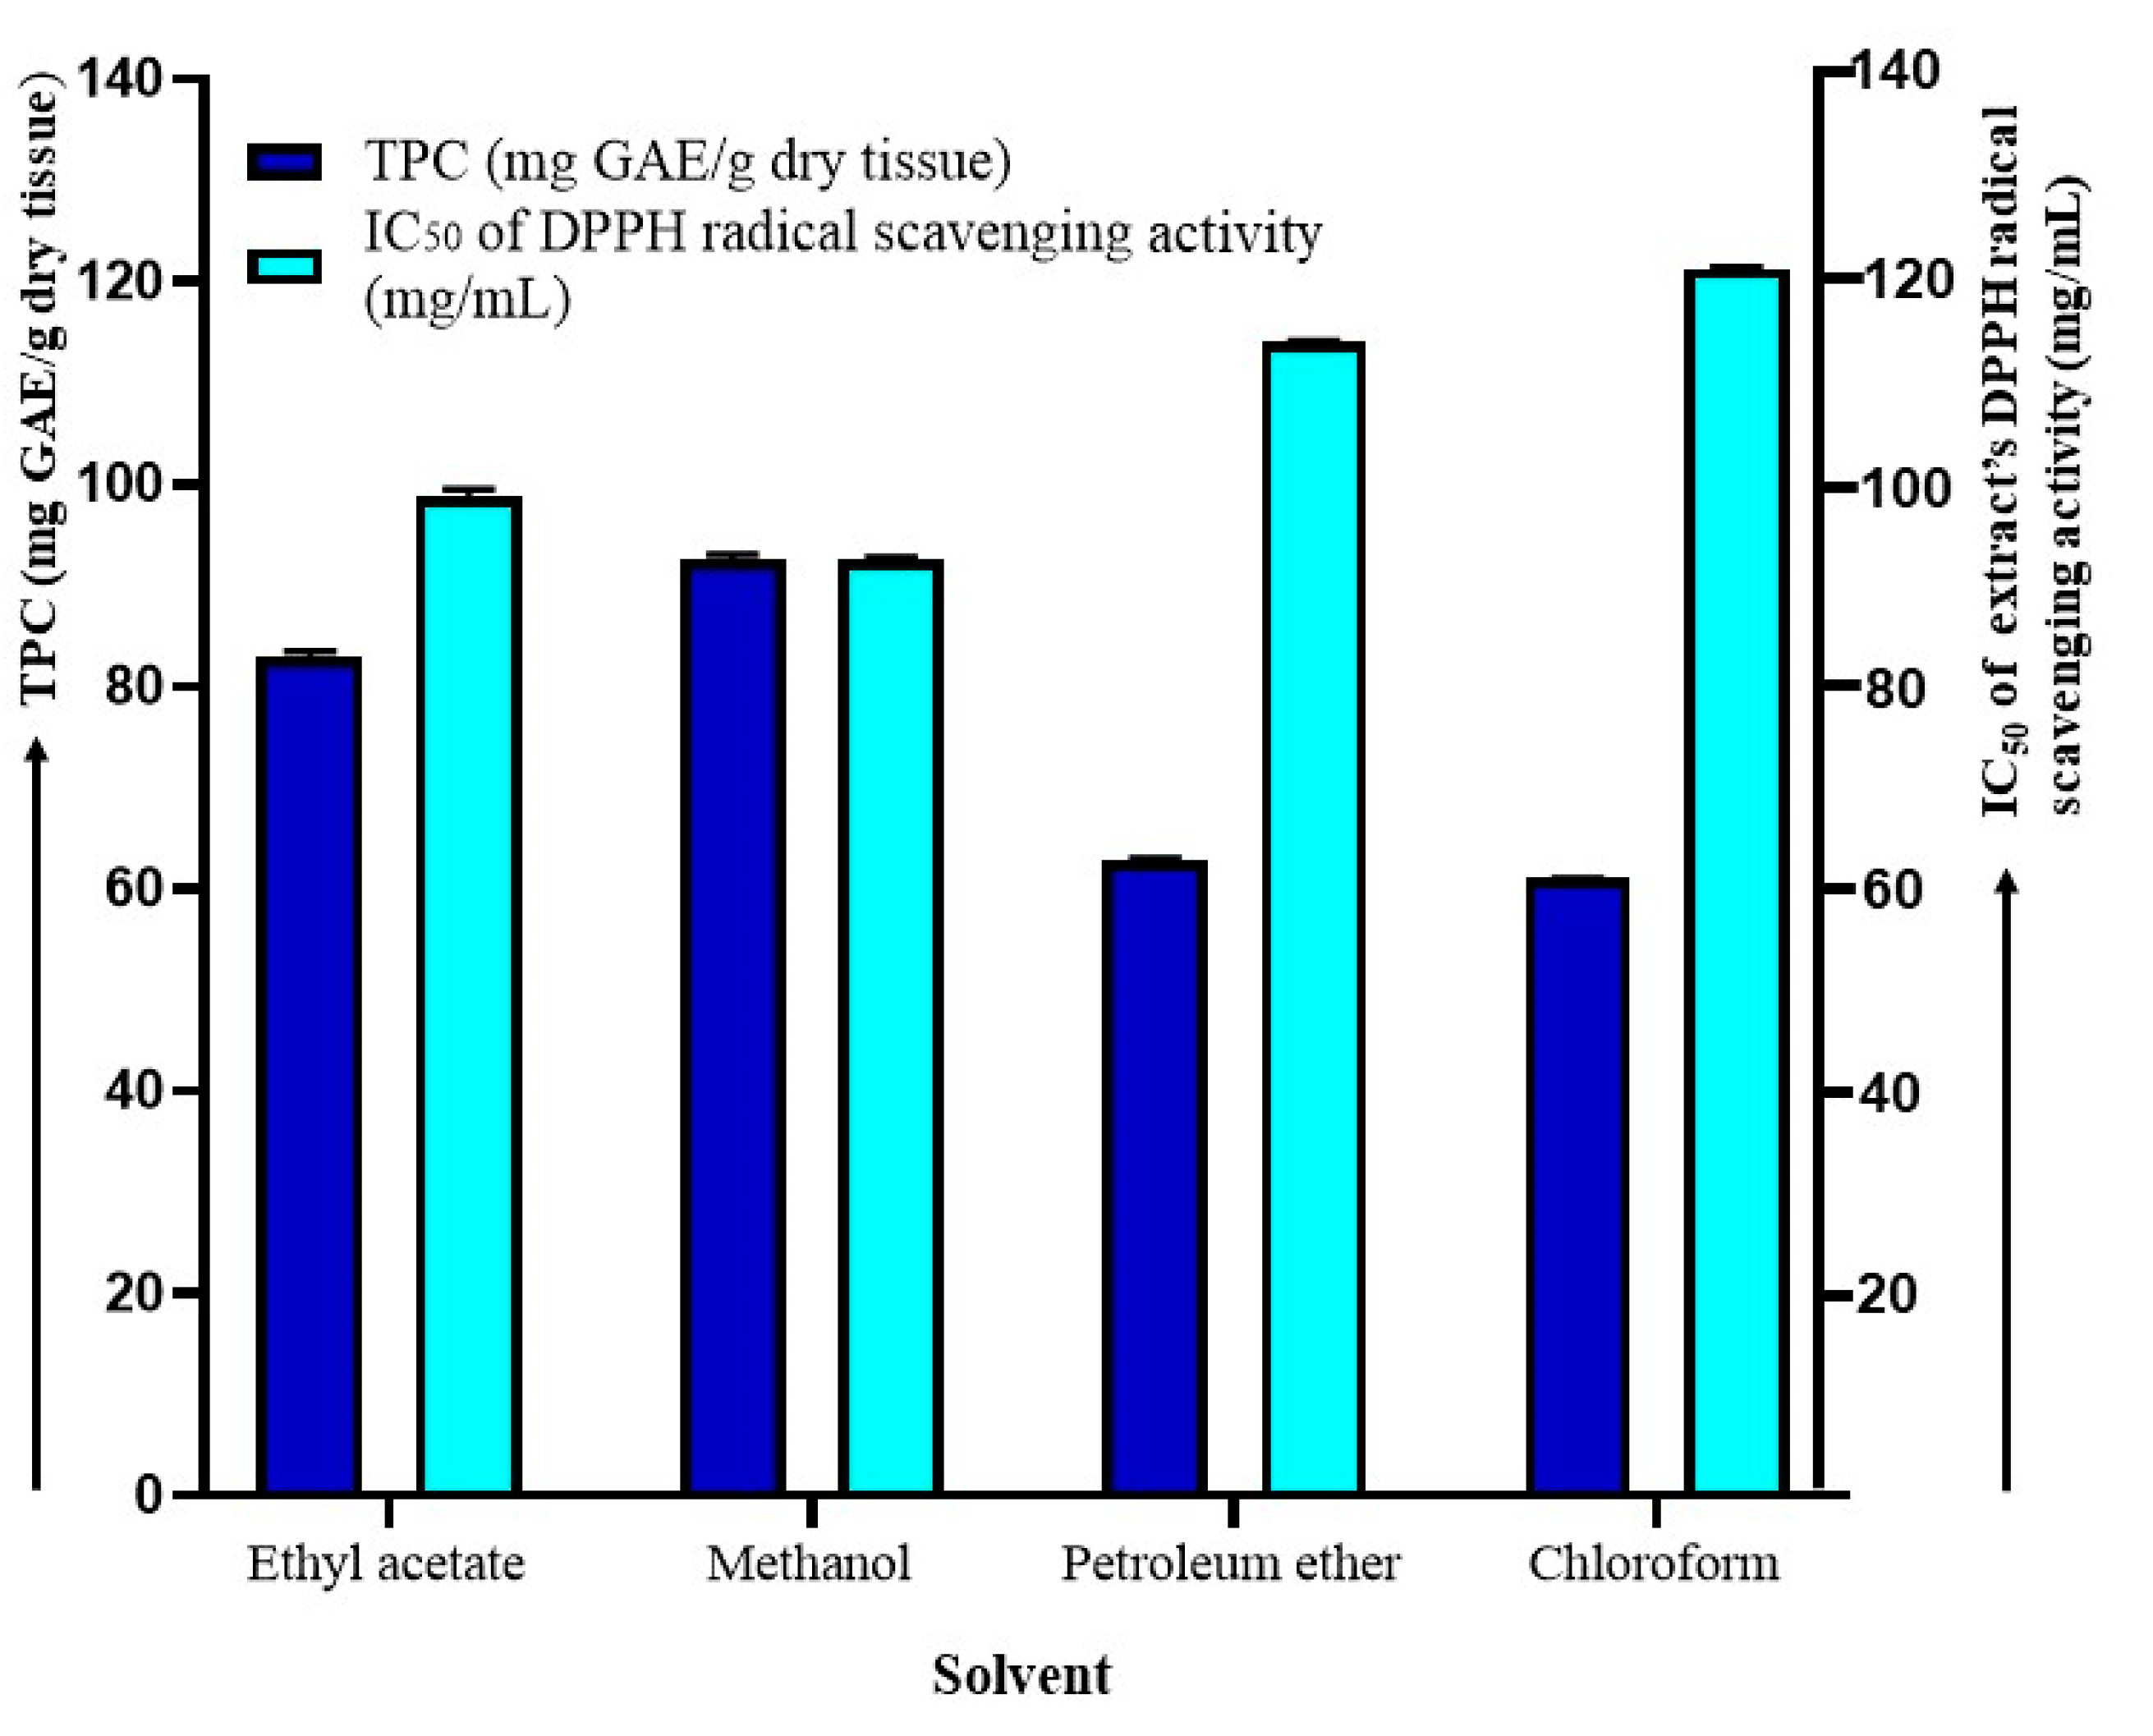
2.1. Impact of Various Extraction Solvents on TPC and Antioxidant Activity

Phenolic compounds are one type of secondary metabolites that are synthesized by plants. These compounds are attributed to the antioxidant properties of plants that neutralize free radicals through multifunctional properties such as singlet oxygen quenching, hydrogen donating, reducing foreign elements, and metal chelating [23]. Nowadays, scientists are paying attention to isolating phenolic compounds from plants so that they can be used as a natural antioxidant supplement in several dietary products. Importantly, different components of a plant possess a reservoir of bioactive substances that encompass possible chemical groups. These compounds frequently exhibit protective properties against cellular oxidative damage in plants and animals.
A varied range of phenolic content is found in different plant taxa. It is essential to employ effective extraction methods that give higher yields with minimal changes to the functional properties of phenolic compounds present in the extract. These methods include maceration, percolations, infusion, decoctions, supercritical fluid extraction, microwave-assisted solvent extraction, and ultrasonic-assisted extraction, all of which require appropriate solvents for optimal results. Significantly, plant-based compounds have a wide range of chemical properties and polarities that pose challenges in terms of solubility in specific solvents. Hence, it is imperative to investigate a range of solvents with varying polarity in order to extract potential bioactive components from the plant [24]. In our study, the bark of A. pavonina was macerated using ethyl acetate, methanol, petroleum ether, and chloroform to obtain the highest total phenolic content and antioxidant activity.
Figure 1 reveals that different solvent extracts had different total phenolic contents and variable antioxidant activities. The maximum TPC and enhanced antioxidant activity (in terms of IC50 values as depicted from the DPPH activity) estimated in the methanol extract were 92.51 ± 0.51 mg GAE/g dry tissue and 92.45 ± 0.334 mg/mL, respectively. IC50 standard (ascorbic acid) was found to be 59.82 ± 0.6 mg/mL. In this investigation, the order of the yield of TPC and antioxidant activity by using different solvents was found to be in the following descending order: methanol > ethyl acetate> petroleum ether > chloroform (Figure 1).
The chemical components of a plant may display either polar or nonpolar characteristics. Specifically, phenolic compounds are known to include many hydroxyl groups, which facilitate their solubility in polar solvents. Hydroxyl groups in phenolic compounds can develop hydrogen bonds with the electronegative oxygen of polar solvents such as methanol and ethanol. Researchers have determined that strongly polar solvents like methanol are more effective in extracting phenolics from plant-based sources [25]. The methanol extract may have exhibited the highest TPC due to its elevated polarity index. Moreover, the significant TPC observed in the methanol extract could perhaps be attributed to the existence of methyl radicals, which have the ability to readily combine with phenolic compounds, facilitating effective solvation [26]. Furthermore, the methanol extract exhibited superior extraction of TPC from A. pavonina bark, validating the efficacy of this solvent for extracting phenolic compounds. Our findings support the claim that the methanol solvent shows potential for the extraction of maximum phenolic compounds with nominal changes to their functional properties.
Plant extracts rich in phenolics and other antioxidant phytochemicals exhibited a significantly higher value of free radical scavenging [27]. DPPH, also known as 2,2-diphenyl-1-picrylhydrazyl, is an organic nitrogen radical, which has an unpaired valence electron at one atom of its nitrogen bridge that serves as a free radical. It has been widely used for testing the preliminary antioxidant activity of plant extracts. Here, methanol and ethyl acetate extracts showed promising DPPH radical scavenging activity with a lower IC50 similar to the TPC result. It was noteworthy that there was a positive correlation between antioxidant activity and the level of total phenolic content. Different phenolic groups have different hydroxyl groups, which are responsible for their radical scavenging activity. Two main mechanisms by which antioxidants manifest these properties are free radical inactivation and electron transfer [28]. Therefore, it is possible that the increased antioxidant activity found in our study can be linked to the presence of phenolics in higher amounts in the stem bark extracts.

2.2. Optimization through Response Surface Methodology (RSM) Model

Table 1 displays the results of TPC extraction and the IC50 of the extract’s DPPH radical scavenging activity obtained during extraction using CCD. Based on the experimental outcomes, the coded versions of the subsequent second-order polynomial quadratic equations (Equations (1) and (2)) were developed:
TPC (mg GAE/g dry tissue) = 180.83 + 0.92x1 − 14.88x2 + 13.28x3 − 20.29x12 − 24.67x22 − 14.69x32 − 0.01x1x2 + 0.22x1x3 − 4.99x2x3
IC50 of DPPH radical scavenging activity (mg/mL) = 65.00 − 1.30x1 + 1.83x2 − 4.84x3 + 13.35x12 + 12.25x22 − 4.52x32 − 0.91x1x2 − 0.81x1x3 + 1.12x2x3
Multiple regression analysis was employed to compute the model coefficients and the fitness of the developed models was assessed by examining the correlation coefficient of the model (R2) and the adjusted R2 (R2adj) and predicted R2 (R2pre) values. The R2adj accounts for changes in the R2 value, which enhances the model’s ability to explain the numerical aspects of the data points. On the other hand, R2pre gauges the ability of a regression model to predict responses using additional observations [29]. Here, the Design Expert (version 13.0.5, Stat-Ease Inc., Minneapolis, MN, USA) software was used to derive both R2adj (0.97 and 0.90) and R2pre (0.93 and 0.72) values for TPC extraction and the IC50 of the extract’s DPPH radical scavenging activity, respectively, and exhibited strong concurrence. Furthermore, the R2 values of 0.98 and 0.94 signify that the model-predicted values are in good agreement with experimental observations. ANOVA was used to assess the statistical significance of the developed second-order polynomial quadratic equations (Equations (1) and (2)). The results of ANOVA are presented in Table 1 and Table 2. Key model indicators such as Fisher’s F-value, lack of fit, and acceptable accuracy are crucial in establishing the significance, capability, and reliability of RSM-based models [30]. As shown in Table 1 and Table 2, the computed Fisher’s F-values (85.75 and 20.66), with a significance level of p < 0.0001, effectively affirmed the suitability of the suggested regression models in projecting the results [31]. The lack-of-fit value aids in figuring out the relative distinction between residual errors and pure errors in an executed experimental design, and its insignificance is imperative to validate the credibility of the constructed model [32]. In the present study, the lack-of-fit value was found to be insignificant in both quadratic equations (p > 0.1), denoting the viability of the developed models. Moreover, the values of adequate precision (24.92 and 14.92) were higher than 4, implying the capability of the constructed models to effectively govern the design space [33]. In addition, the capability of the suggested second-order polynomial quadratic models to fit the TPC extraction and the IC50 of the extract’s DPPH radical scavenging activity was confirmed by plotting the projected values against the actual experimental data points (Figure 2). The figure displays a linear distribution of predicted and observed values in both cases, indicating the goodness of fit and assessment potential of the proposed models during the experiment.
Moreover, the diagnostics plots such as externally studentized residuals versus predicted values and externally studentized residuals versus experimental runs did not show any outliers (Figure 3), hence epitomizing the developed models’ reliability with the obtained experimental values for both TPC extraction and IC50 of the extract’s DPPH scavenging activity. The normal plot of residuals elucidated the normal residual distribution following a straight-line pattern and further confirmed the rational agreement between the predicted and actual values (Figure 4). Overall, the statistical interpretation of the results indicates the suitability of the established polynomial quadratic models in forecasting the TPC content and IC50 of the extract’s DPPH scavenging activity values.

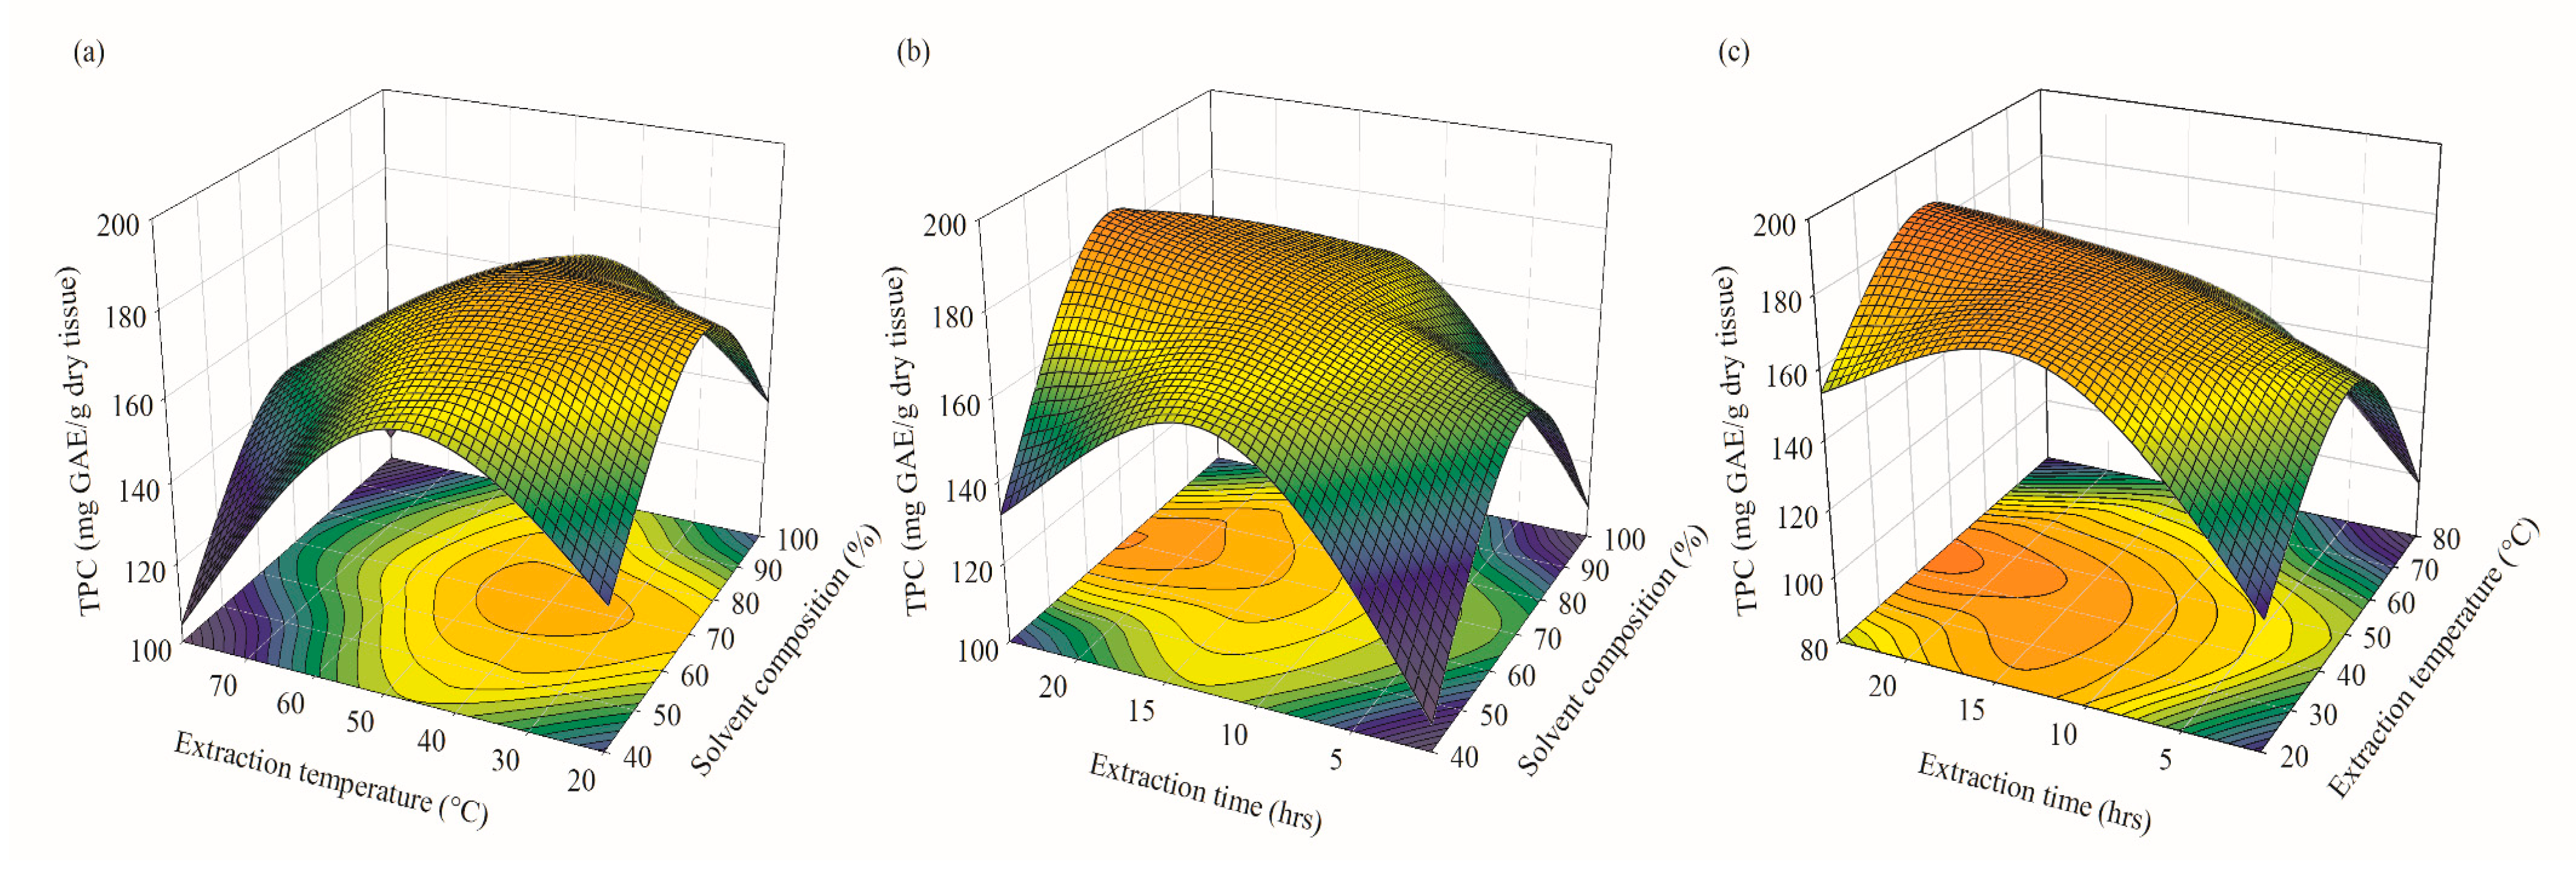
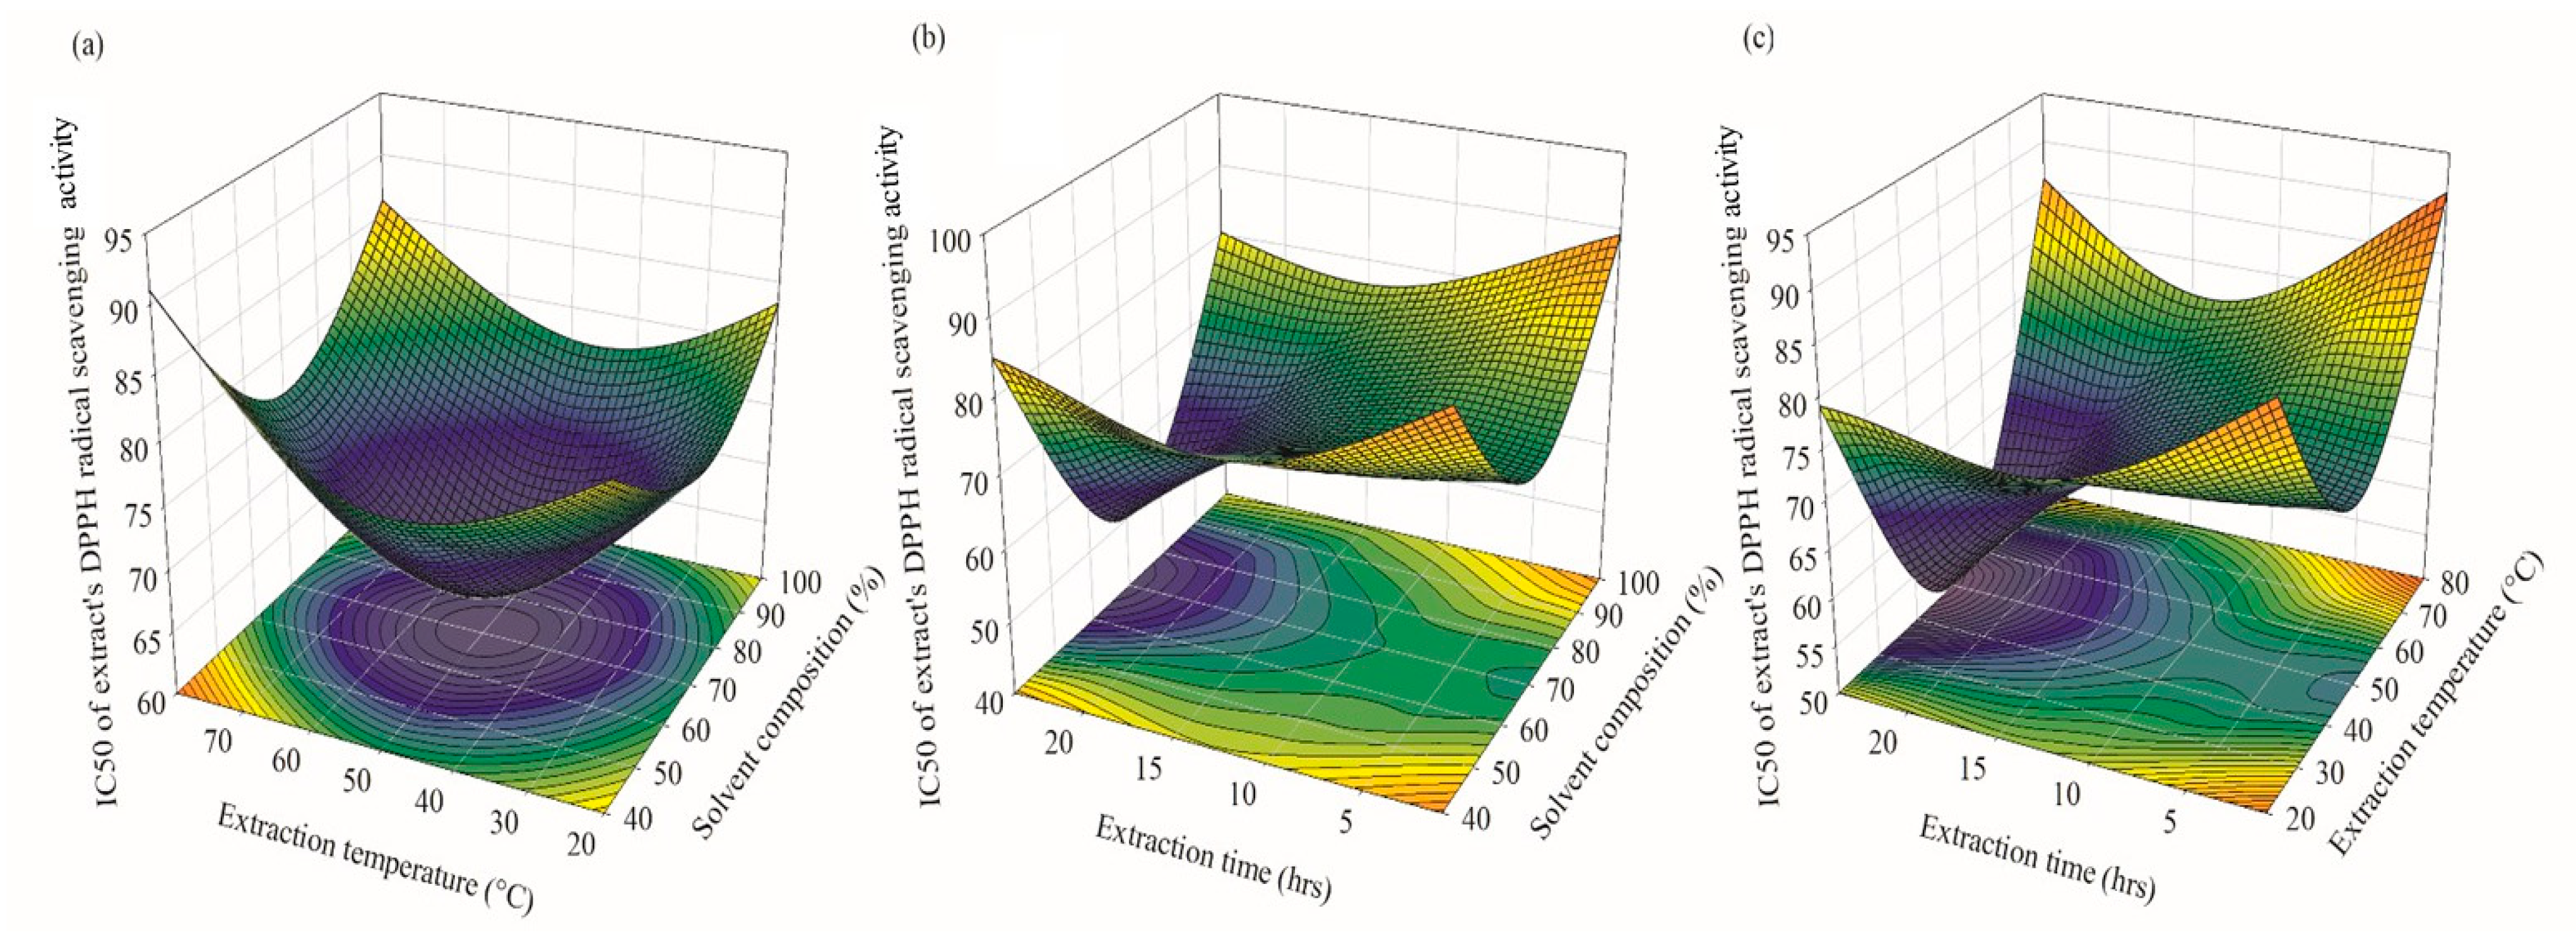
2.2.1. Effects of Operational Parameters on TPC Extraction and IC50 of Extract’s DPPH Radical Scavenging Activity

The linear, quadratic, and interaction impacts of the specified independent operational factors on TPC extraction from A. pavonina bark and the IC50 of the extract’s DPPH radical scavenging activity are explained by the regression analysis in Table 1 and Table 2, respectively. The principal and cross-interactive effects of independent factors on the target responses are also represented via the 3D response graph and contour plots (Figure 5 and Figure 6).
Table 2 shows that the TPC extraction from A. pavonina bark is controlled by the extraction temperature and time at both linear and quadratic levels (p < 0.001), while the extraction solution significantly affected the TPC extraction process only at the quadratic level (p < 0.0001). In terms of the interactive impacts of all investigated independent factors, extraction temperature and time showed substantial positive effects on TPC extraction (p < 0.05). The aforementioned results are validated further by the 3D responsive surface and contour diagrams shown in Figure 5 and Figure 6 and supported by many previous studies [34,35,36]. It was evidenced that the majority of the phenolic compounds are heat-sensitive in nature and can be oxidized or degraded easily [37,38]. Therefore, a high temperature together with a prolonged extraction time can lead to the decomposition of phenolic compounds [34]. Furthermore, Jahromi [35] and Shi et al. [36] also highlighted the significance of extraction temperature and time for TPC extraction from plant materials.
Extraction time showed a significant impact at a linear level on the IC50 of the extract’s DPPH scavenging activity (p < 0.05). Earlier studies also signified the effect of extraction time on the increased antioxidant activity of extracts [39,40].
On the other hand, solvent composition and extraction temperature showed profound influences at quadratic levels (p < 0.001) (Table 3). In the case of interactive effects, none of the process parameters influenced the IC50 of the extract’s DPPH radical scavenging activity (p > 0.05). To sum up, the findings described above provide useful insights regarding the impact of independent operational factors on the TPC extraction efficiency from A. pavonina bark and the IC50 in the extract’s DPPH radical scavenging test.

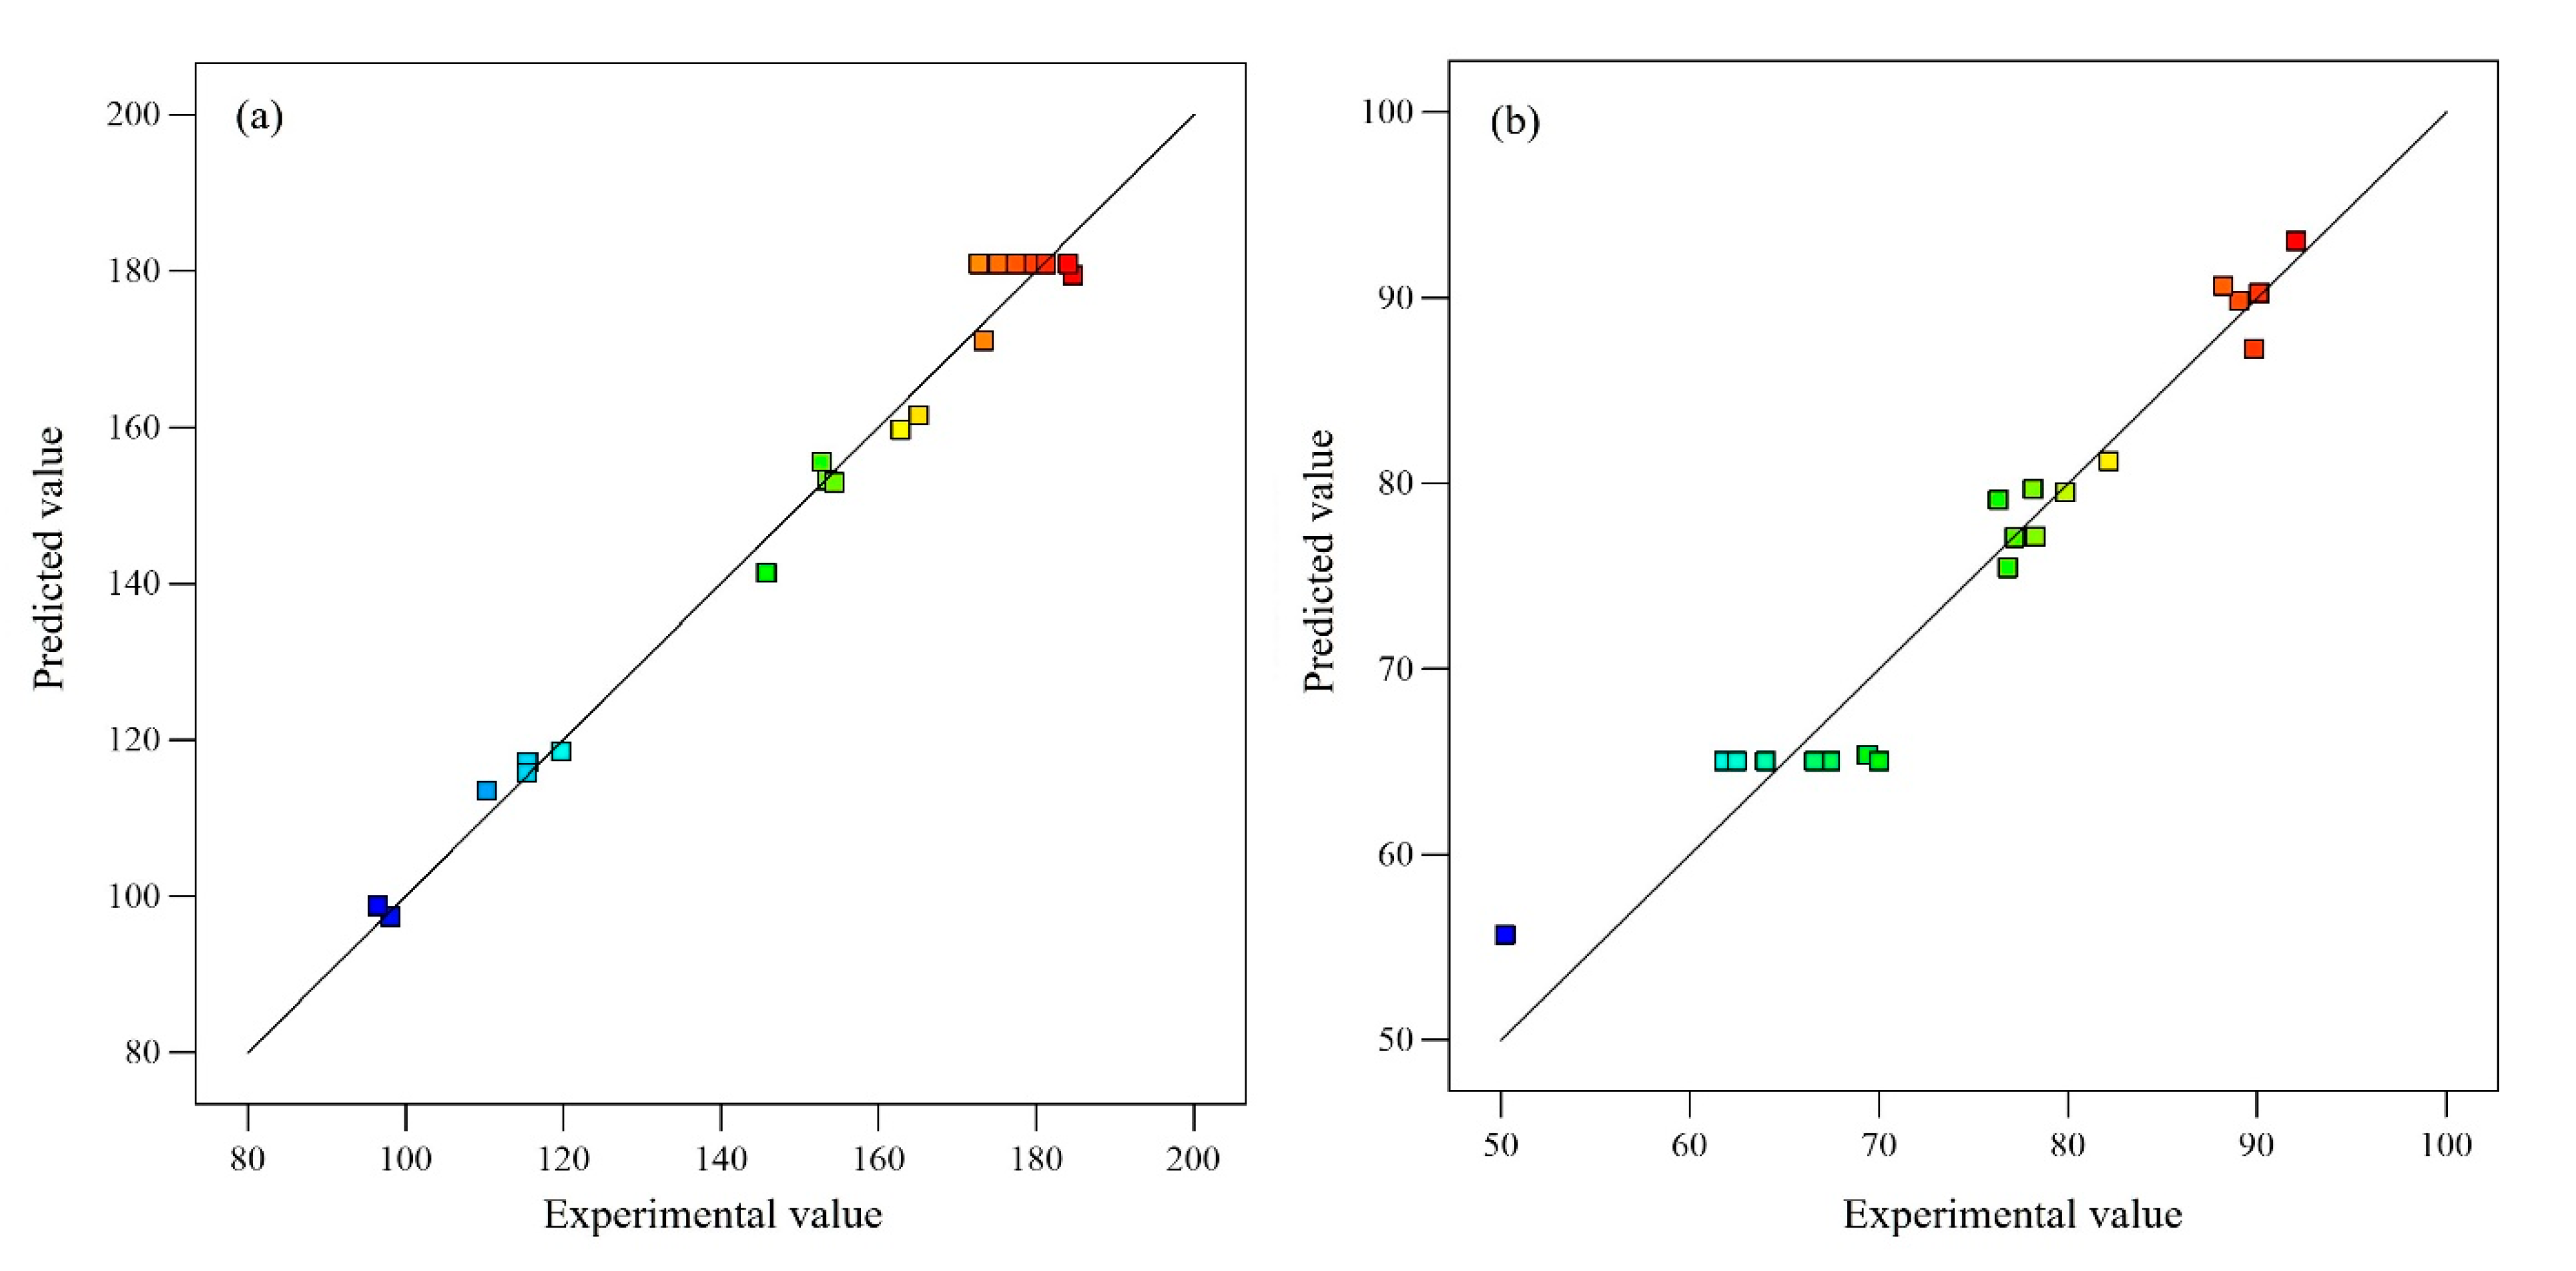
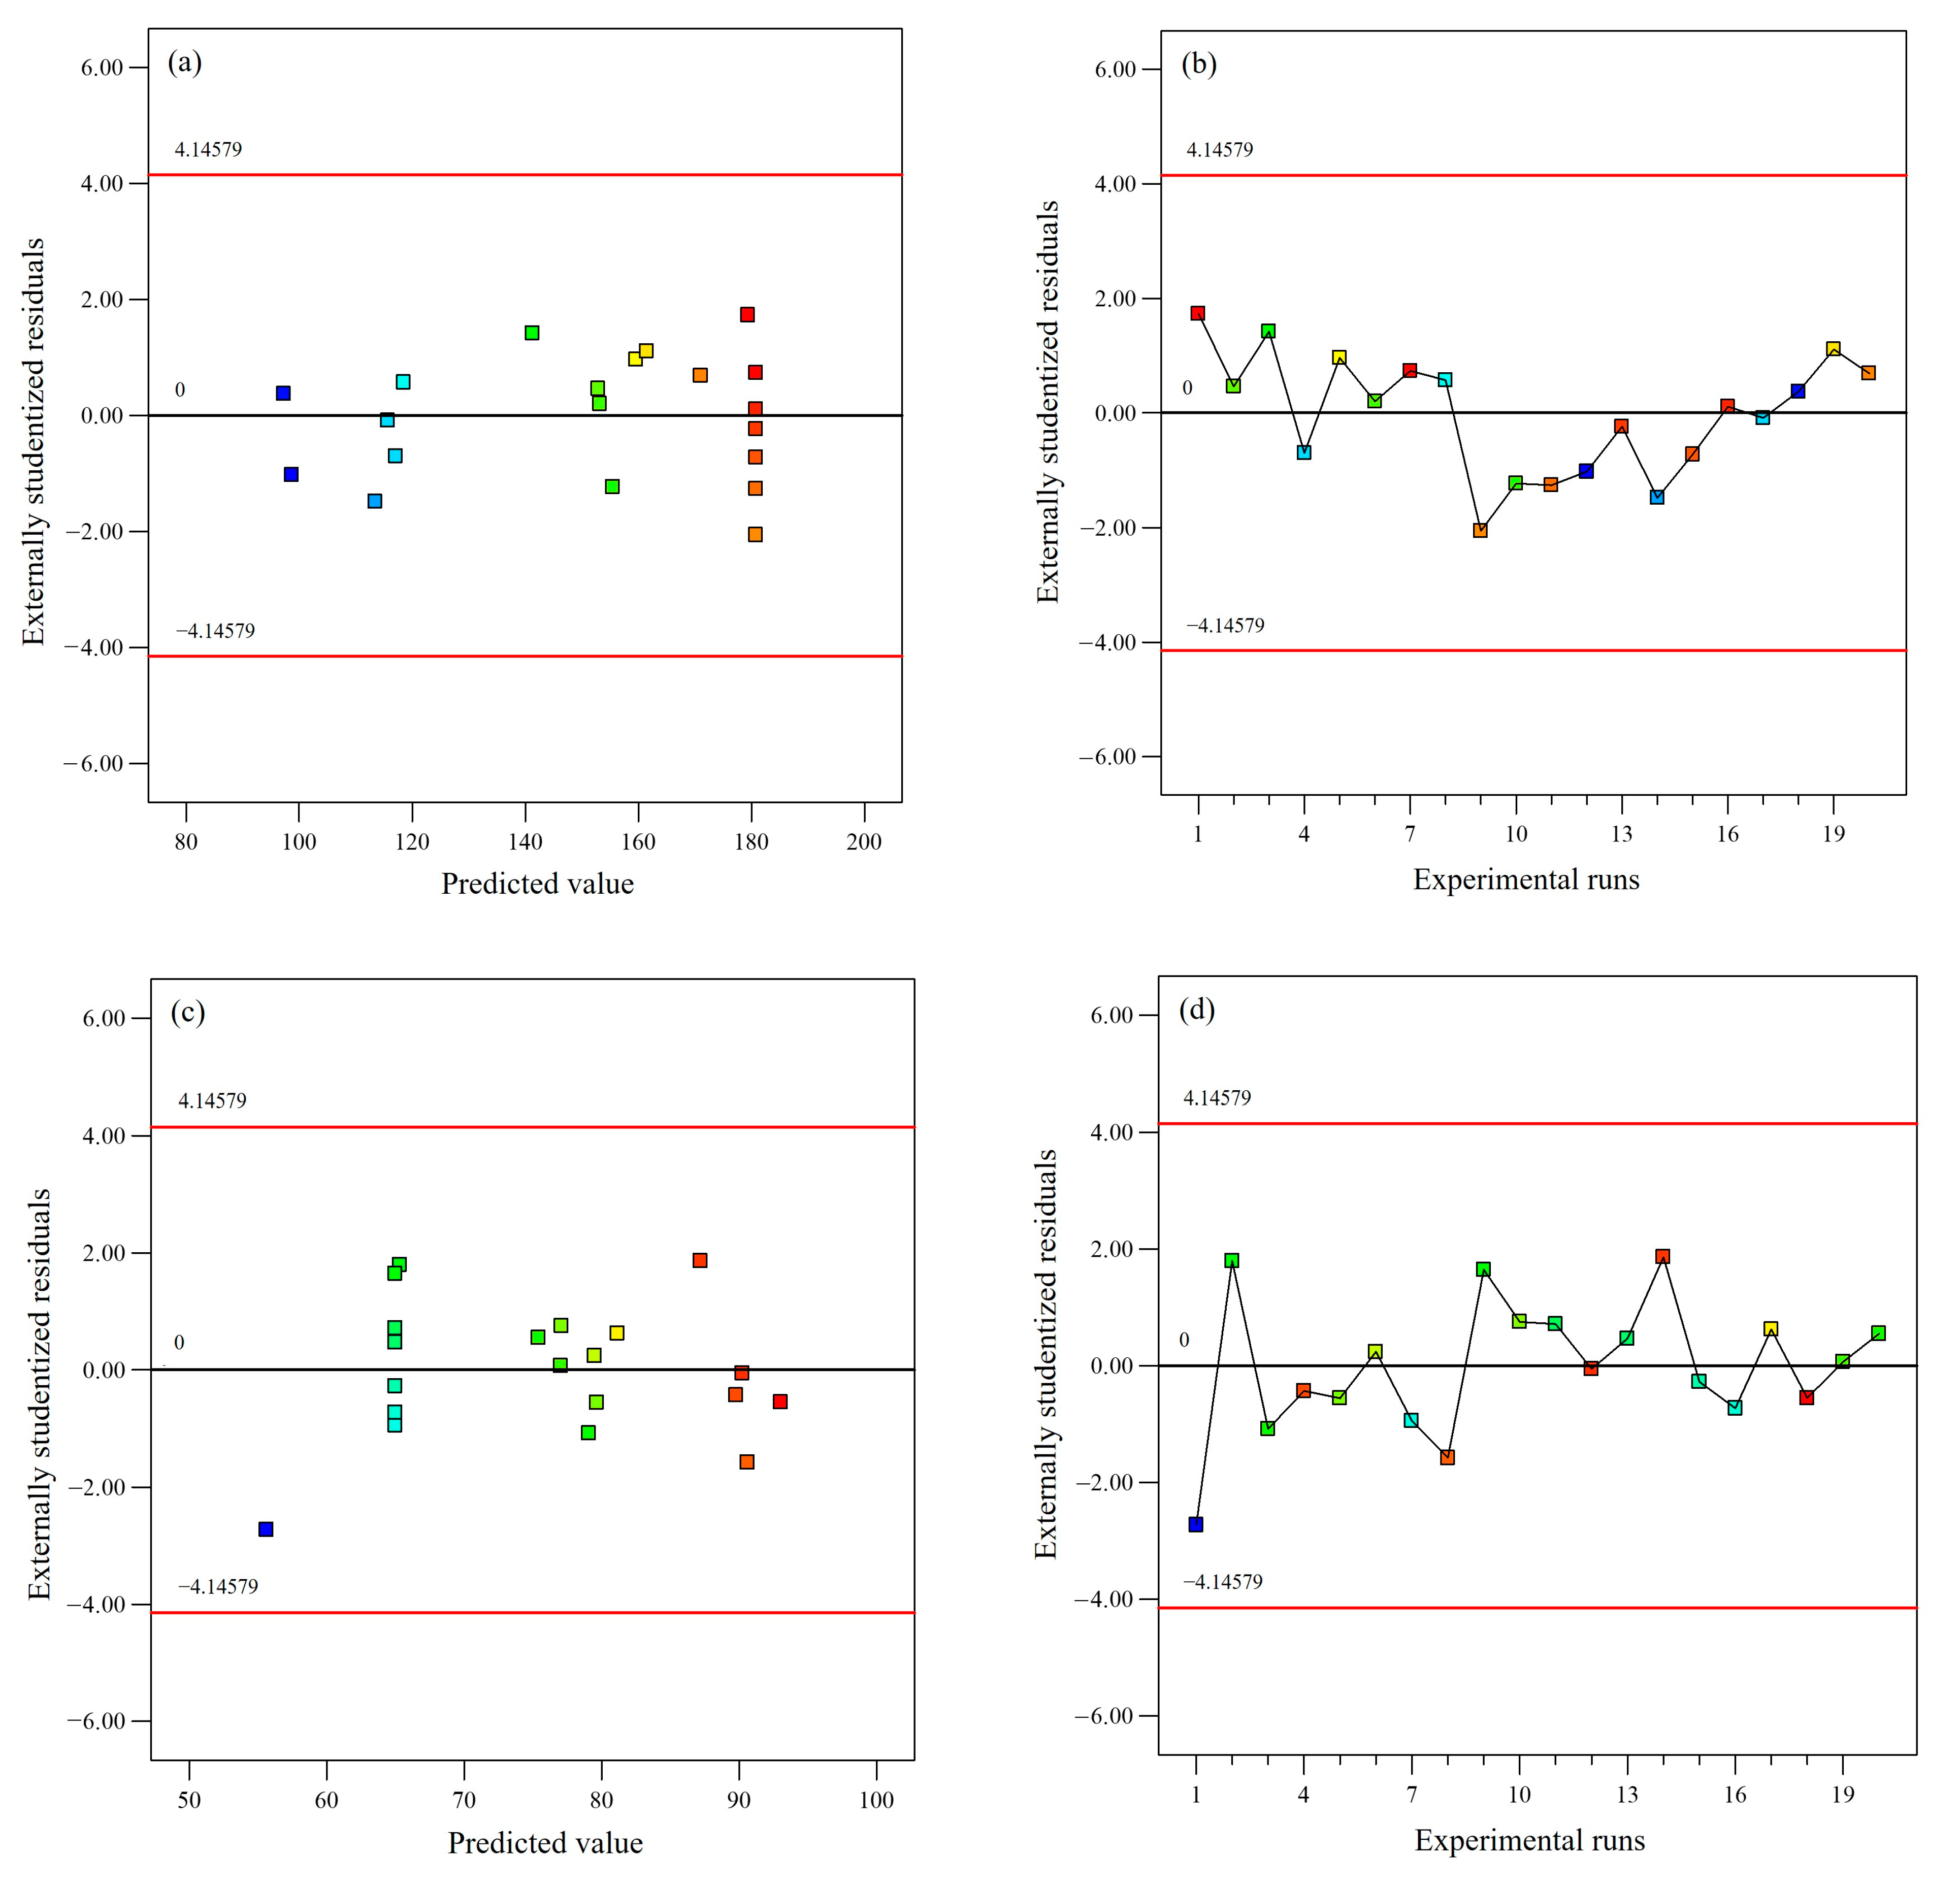
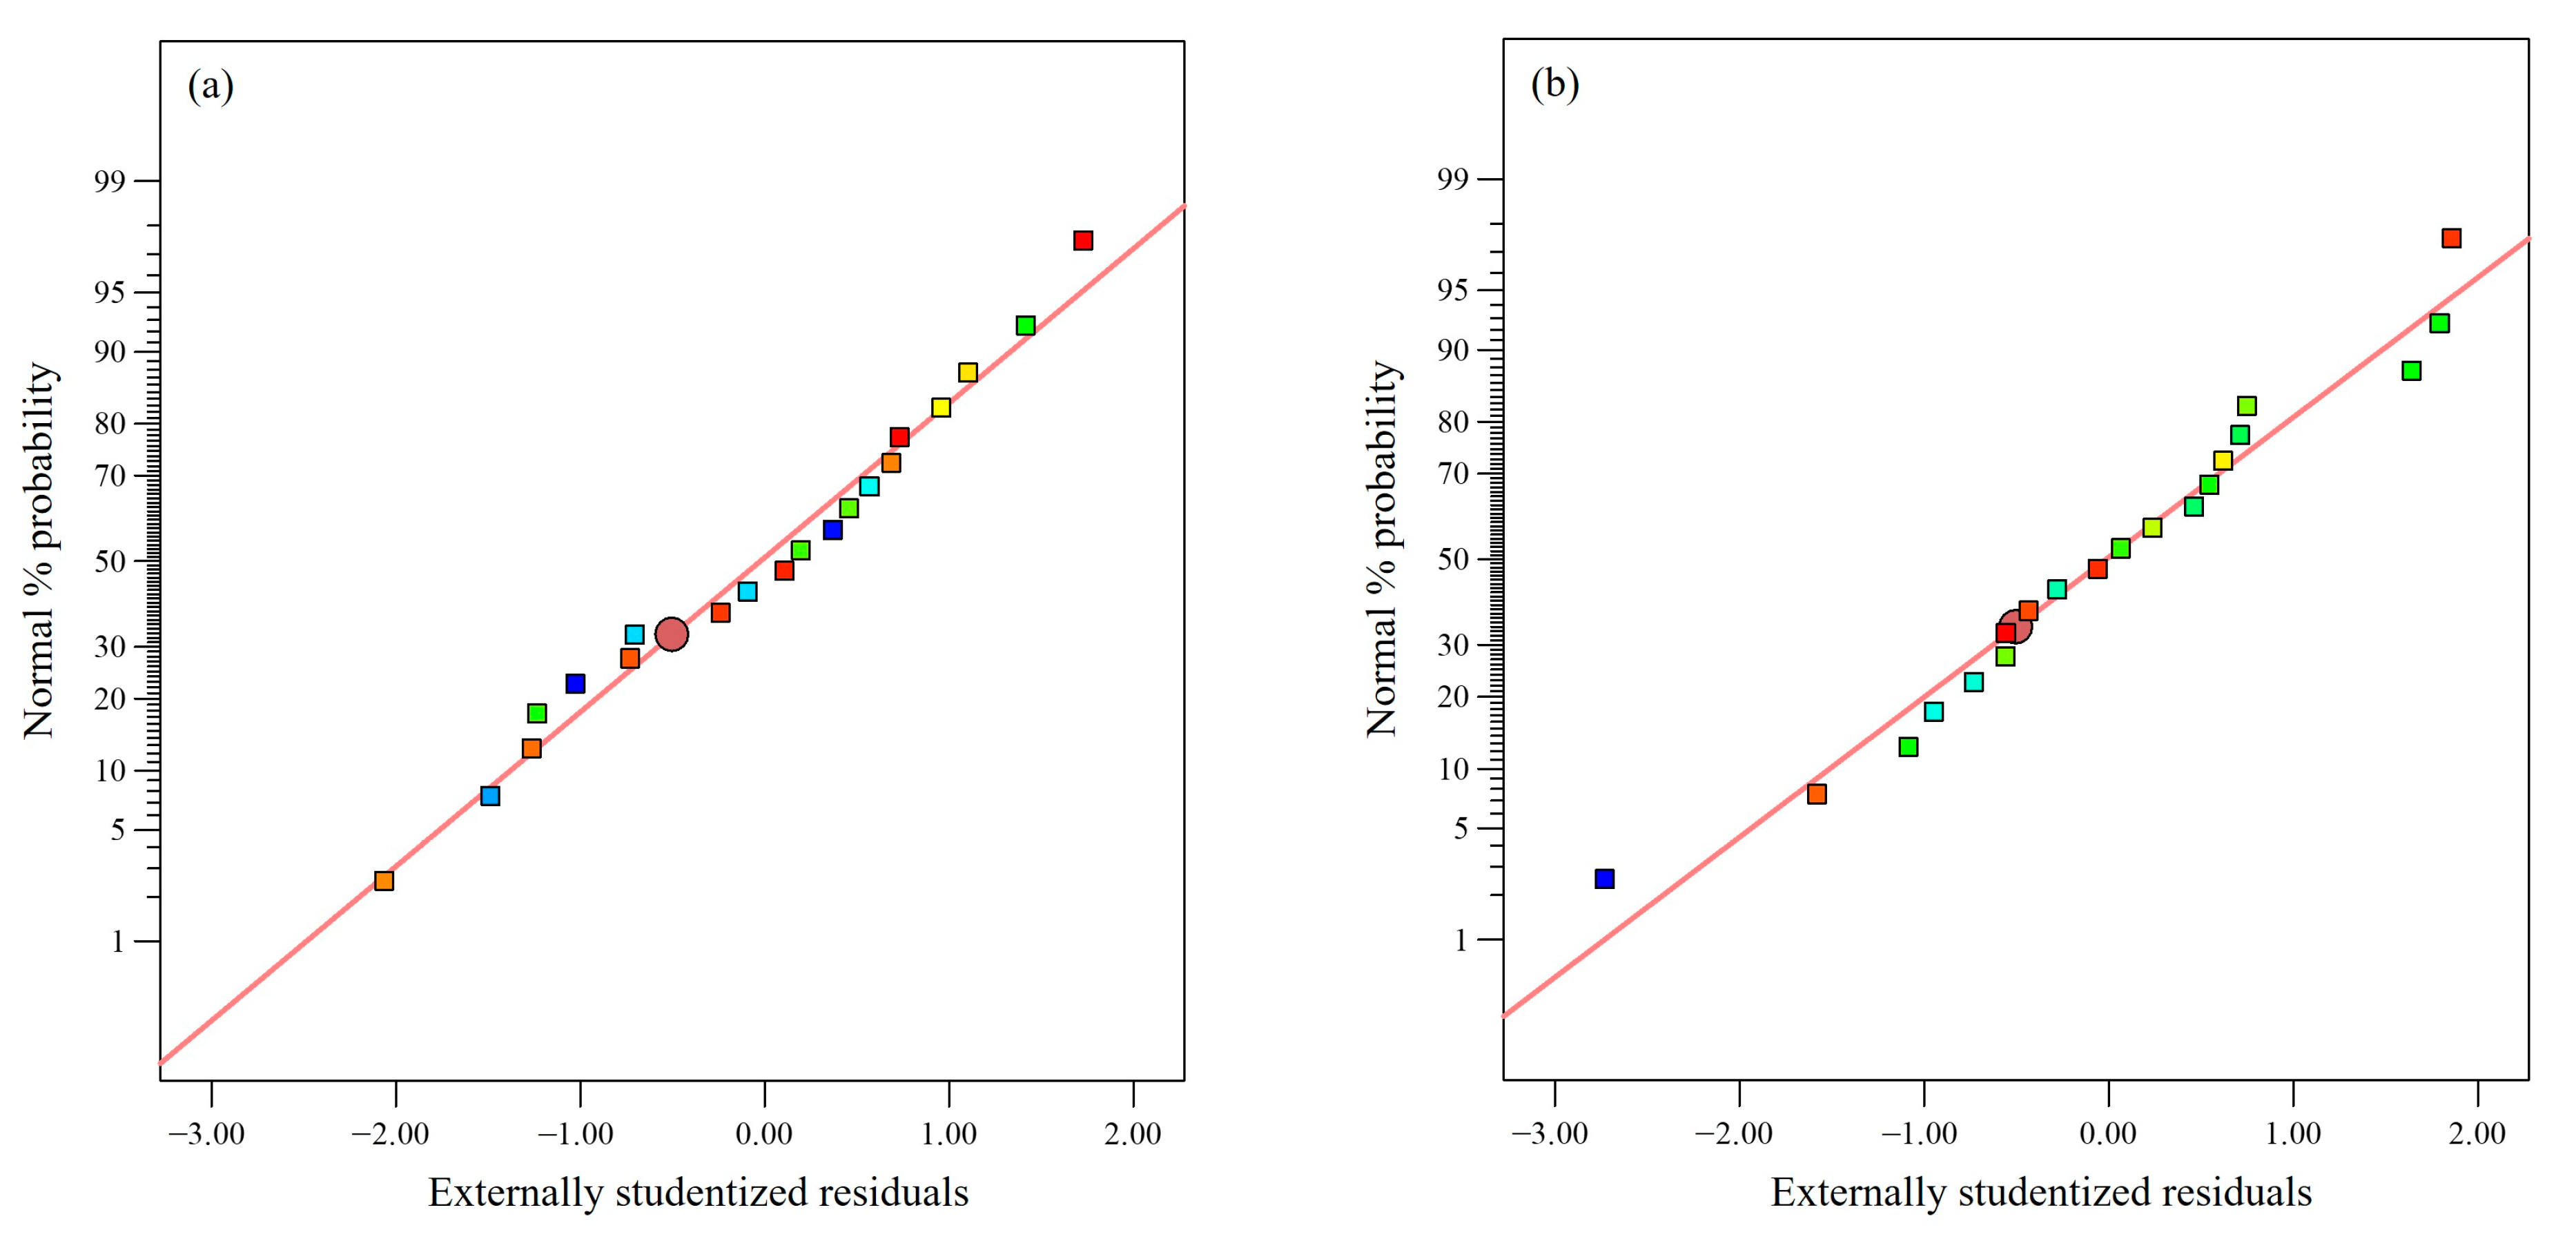
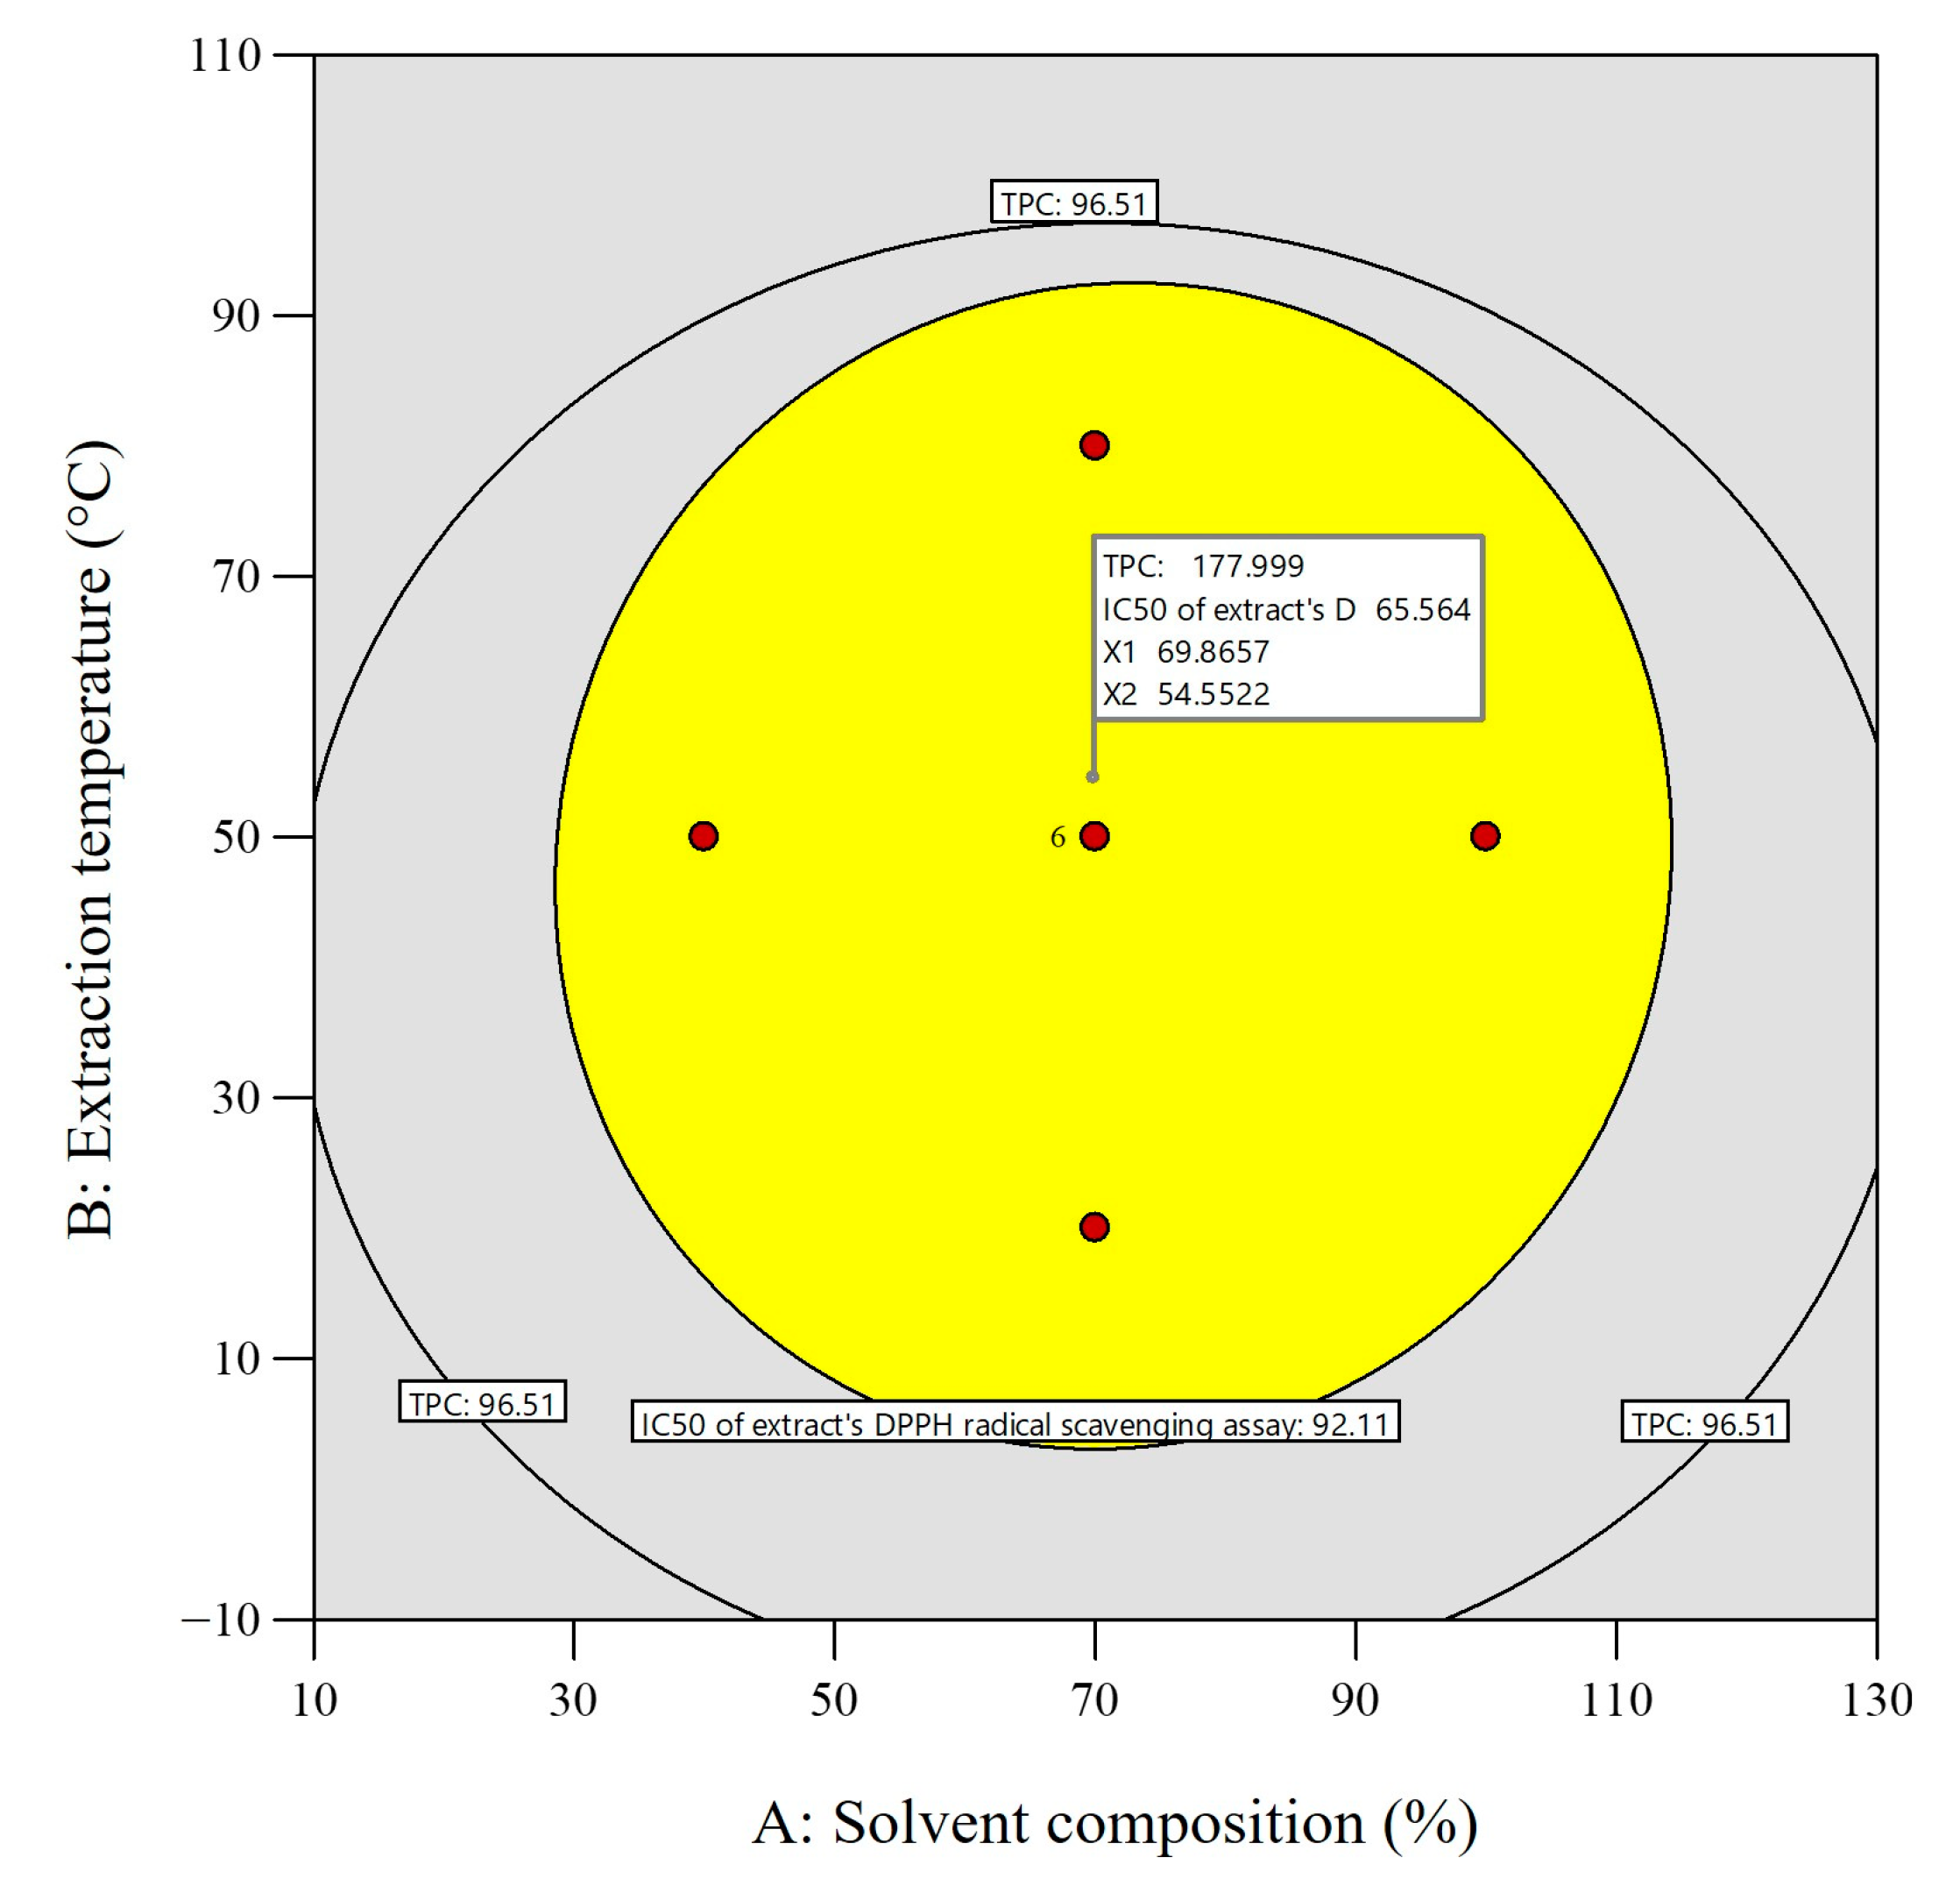
2.2.2. Optimization and Validation of the Extraction Process

The independent parameters that have insightful influences on the performance of the process are generally selected from the prevailing options. The extraction of phenolic compounds and the antioxidant potential of the extracts are generally influenced by extraction parameters such as solvent composition, temperature, and time. The antioxidant potential of plants is strongly correlated with phenolic compounds because of their hydroxyl groups at ortho and para positions contributing to the antioxidant property. In the present work, the extraction of phenolics was influenced by an optimized binary solvent composition, temperature, and time. Methanol was the solvent of choice for extracting phenolics due to its high polarity. Its superiority was also well documented in previous studies [25].
An optimized alcohol (methanol) and water ratio is a key factor in the extraction of phenolic compounds. Water helps to swell plant tissues, while alcohol helps to dissolve and recover phenolic compounds. The TPC content and DPPH scavenging activity (lower IC50 value) initially increased with increasing methanol concentration until reaching a maximum level and then started to decrease after a certain concentration. High concentrations of methanol can cause molecule congestion, which hinders the mass transfer and ultimately reduces the extraction of phenolic compounds [41]. Furthermore, an increase in extraction temperature enhances the exaction of phenolic compounds. High temperatures during extraction promote polysaccharides on the cell wall, which aid in dispersing the solvent used for extraction by undermining the strength of the cell wall. However, if the extraction process is performed at temperatures beyond the optimum, the phenolic yield may be decreased because it causes a loss of solvent and accelerates phenolic oxidation or degradation [42,43]. Moreover, extraction time governs the interaction between the extraction medium (aqueous methanol) and plant material, and a longer extraction time facilitates better extraction [34]. Therefore, it is of utmost importance to ascertain the best possible conditions to confirm effective and efficient process performance during extraction.
The targeted levels for the independent operating variables and target responses were set to ‘within the range’ and ‘maximum’, respectively, in this investigation. All independent factors and target responses were given equal weightage. Table 4 shows the most appropriate operating conditions for TPC extraction from A. pavonina bark, as well as for the IC50 of the extract’s DPPH scavenging activity. The optimized conditions were then independently tested in triplicate, and their validity was confirmed by comparing the results to those predicted by the model. High TPC and IC50 of the extract’s DPPH radical scavenging activity of 181.69 ± 0.20 mg GAE/g dry tissue and 60.13 ± 0.11 mg/mL, respectively, were obtained under the optimized conditions (solvent composition 71.61%, extraction temperature 42.52 °C, and extraction time: 24 h), which were found to be fairly close to the RSM-model-predicted values and within the 95% confidence level (Table 4). Moreover, the optimal operating conditions were justified by means of the overlay plots. The yellow zone in the overlay plot indicated the optimal region as a design space. The selected values for the TPC and IC50 of the extract’s DPPH scavenging activity were 177.99 mg GAE/g dry tissue and 65.56 mg/mL, at the solvent composition, extraction temperature, and extraction time of 69.87%, 55.55 °C, and 12.5 h, respectively, and are symbolized by a flag (Figure 7). Through the optimization method, an increased extraction of TPC and IC50 of the extract’s DPPH radical scavenging activity from A. pavonina bark was achieved by using methanol as a solvent compared to a non-optimized condition (92.51 ± 0.51 mg GAE/g dry tissue and 92.45 ± 0.334 mg/mL). A previous study revealed that the TPC extracted from the bark of A. pavonina using a methanol solvent in non-optimized conditions is 8.51 mg/g [3]. Rodrigo et al. [44] assessed the antioxidant activity (DPPH activity) of non-optimized methanolic extracts of A. pavonina bark, and it was 70.3 ± 0.5 mg/mL. These findings imply that the optimization of operational conditions ensures maximum TPC extraction from A. pavonina bark with higher antioxidant activity as compared to a non-optimized extract.

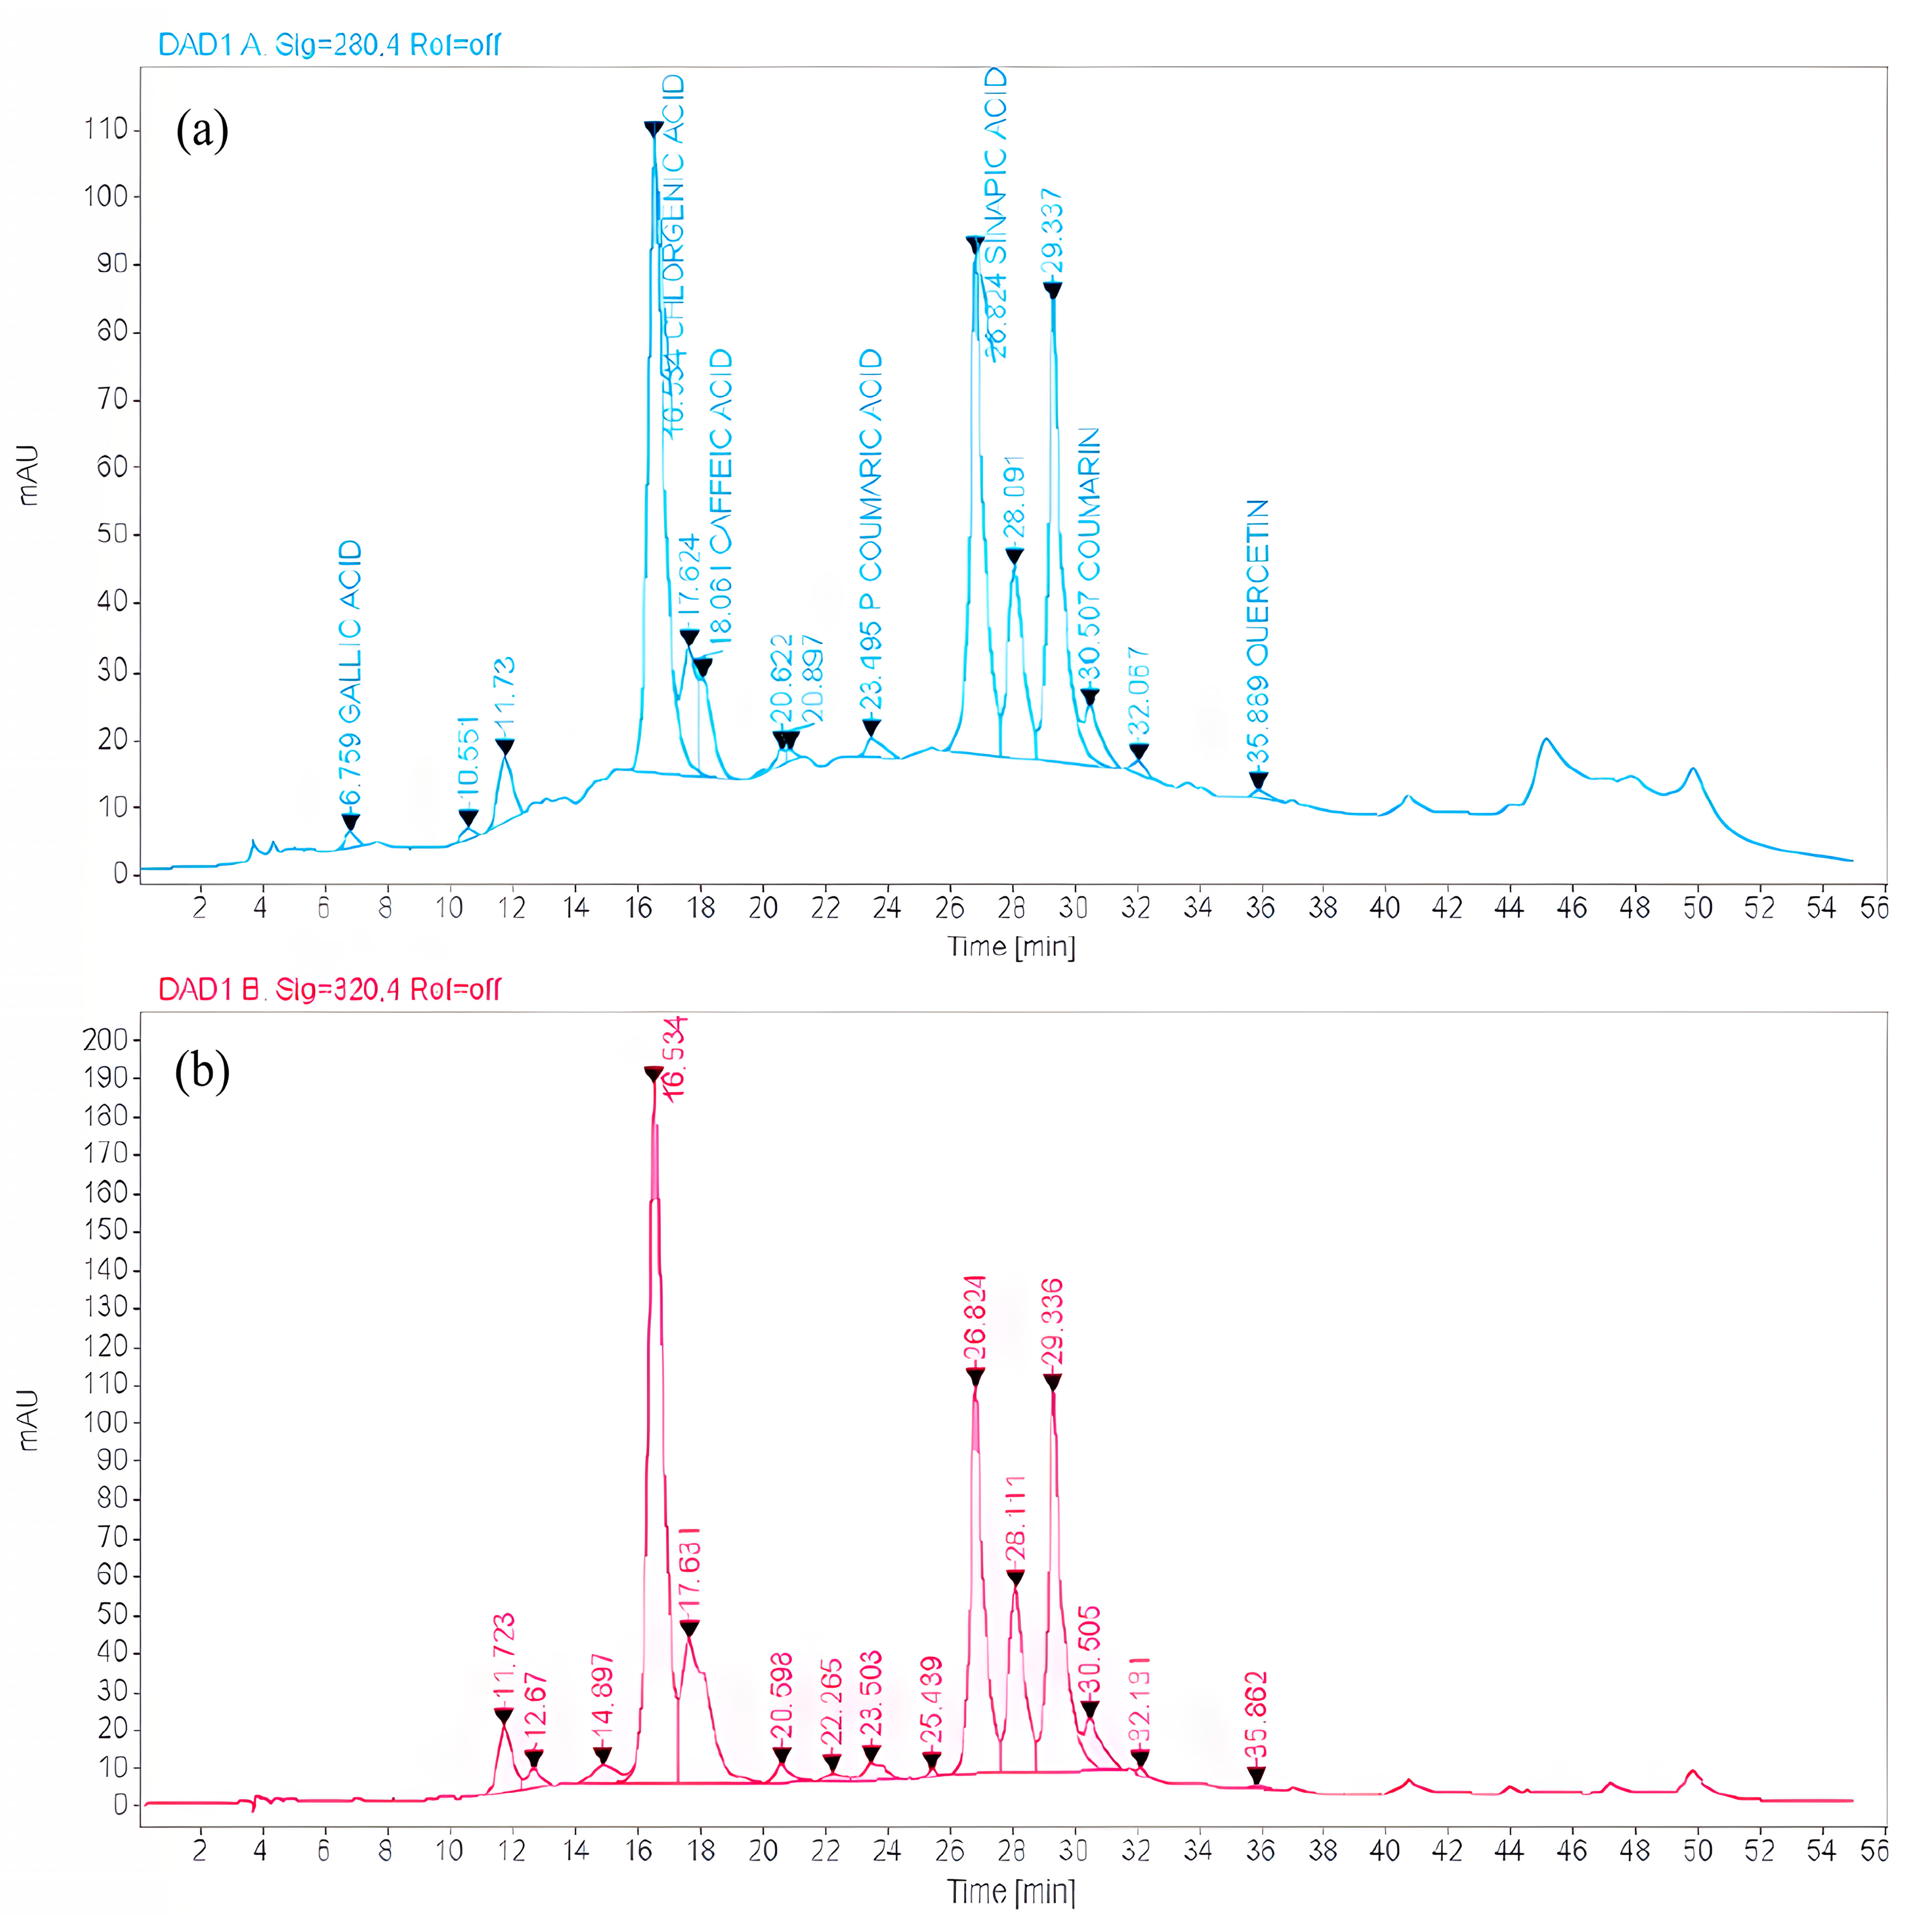
2.3. Identification and Quantification of Phenolic Compounds

To characterize the phytochemicals from the optimized phenolic extract, ten standards of phenolic compounds (kaempferol, gallic acid, syringic acid, chlorogenic acid, catechin hydrate, caffeic acid, p-coumaric acid, sinapic acid, coumarin, and quercetin) were used for HPLC analysis. The HPLC examination of the A. Pavonina optimized stem bark extract indicated the presence of a total of six phenolic components, which have been identified and quantified, namely chlorogenic acid (117.526 mg/g dry tissue), gallic acid (0.042 mg/g dry tissue), caffeic acid (5.809 mg/g dry tissue), sinapic acid (64.779 mg/g dry tissue), p-coumaric acid (0.487 mg/g dry tissue), and coumarin (1.523 mg/g dry tissue). The identified six phenolic compounds have predominantly hydrophilic characteristics. The present study utilized the RSM model to determine the optimal solvent for extracting greater amounts of phenolic compounds, with methanol being identified as the most effective solvent in combination with water. Among the identified six compounds from the bark extract, chlorogenic acid, and sinapic acid are the prominent phenolic acids, which have well-documented antioxidant, anti-inflammatory, anticancer, and antibacterial effects [45,46] (Table 5). Other phenolic compounds such as gallic acid, caffeic acid, p-coumaric acid, and coumarin were found in subordinate quantities. All these acknowledged compounds have well-documented antioxidant, anti-inflammatory, anticancer, and antibacterial effects [45,46,47,48,49,50,51,52] (Table 5). Thus, the stem bark of A. pavonina can also be recognized as a new important source of phenolic compounds. Previously, scientists [10,11] demonstrated that A. pavonina has some antioxidant activities and the present study evidenced that those activities are mainly due to the presence of phenolic compounds like chlorogenic acid and sinapic acid since they were found in the highest concentration in the optimized bark extract (Figure 8).

3. Materials

3.1. Plant Collection and Sample Preparation

Identification of the plant (Figure 9a) was performed with the help of different floras [53] and authenticated by consulting with plant taxonomists. A standard website, Plants of the World Online [54] was also followed for the nomenclature verification of the identified plant species. The fresh stem bark parts of Adenanthera pavonina L. were collected in December 2022 from Santiniketan, Birbhum (23°40′52″ N, 87°40′20″ E), a popular semi-arid tropical region of West Bengal, India (Figure 9b). The harvested plant materials were adequately rinsed with tap water to eliminate any remaining dust before being chopped into small fragments, shade-dried, and finely powdered using an electric grinder. The crude powder was then stored in a tightly sealed container at 4 °C until it was used for further analyses (Figure 9c). According to accepted herbarium procedures [55], collected plant specimens were also stored as specimen vouchers in the Department of Botany, Visva-Bharati, Santiniketan, India, for future use (Specimen number: SN Begum 6, India, West Bengal, Birbhum: Santiniketan, 28 December 2022).

3.2. Chemicals and Software

All of the chemicals and reagents used for polyphenols extraction and HPLC analyses were of analytical grade and obtained from reputable commercial suppliers. For example, from Merck (Mumbai, India), HPLC-grade methanol, ethyl acetate, petroleum ether, chloroform, acetonitrile, and acetic acid were obtained. Phenolic standards of analytical grades were purchased from Sigma Aldrich, St. Louis, MO, USA. Hi Media Laboratories, Mumbai, India, provided high-purity Folin–Ciocalteu’s phenol reagent, 1,1-diphenyl-2-picrylhydrazyl radical (DPPH), etc. The statistical software program Design Expert (version 13.0.5, Stat-Ease Inc., Minneapolis, MN, USA) was used to carry out the optimization study and perform the regression analysis of the experimental data and the descriptive statistics were analyzed using MS Excel (version 21).

4. Methods

4.1. Solvent Extraction

An amount of 100 mL solvent of each of the four different solvents (ethyl acetate, methanol, petroleum ether, and chloroform) was used to extract 10 g of powdered stem bark over the course of 48 hours at room temperature with continuous shaking. The extract was filtered and then it was dried in a vacuum using a rotary evaporator at a temperature of 45 °C. After drying, the extracts were collected in vials and preserved at a temperature of 4 °C until further analysis of total phenolic compounds and antioxidant activity.

4.2. Total Phenolic Content (TPC) Determination

Cicco et al.’s [56] method was applied to analyze the TPC of the A. pavonina extract with minor modifications. In a test tube, 100 µL of an aliquot of the plant extract in 1 mg/mL concentration was mixed with 100 µL of 1N Folin–Ciocalteu reagent and left for 2 min. Then, in the reaction, 800 μL of a 5% (w/v) sodium carbonate solution was added and the test tubes were incubated at 40 °C for 20 min in the absence of light. Against a blank, the absorbance of the test tube mixture was measured at 740 nm wavelength using a spectrophotometer (Shimadzu 04160). The amount of total phenolics was determined as mg of GAE/g using a standard curve ranging from 10 to 100 mg/mL concentration of gallic acid.

4.3. Determination of Antioxidant Activities (DPPH Radical Scavenging Method)

DPPH radical scavenging activity was assessed using a standard method as described by Thaipong et al. [57]. A total of 0.5 mL of plant extract of A. pavonina bark at different concentrations (20–100 μL per 1 mL methanol) mixed with 2 mL of DPPH methanol solution was kept in the dark for 24 h. Before measuring the absorbance at 517 nm, the mixture was rapidly stirred for 10 min. Ascorbic acid was used as a standard, and the results were expressed in IC50. The IC50 value of plant extract was the concentration at which it could scavenge 50% of the DPPH free radicals. IC50 value was calculated using a linear regression method. These measurements were performed in triplicate and the following equation was used to compute the proportion of radicals scavenged by DPPH (Equation (3)):
%   DPPH   radical   scavenging   activity = A 0 A t A 0 × 100
where A0 is the absorbance of the control (methanol instead of the plant extract), while At is the absorption value of the test substances (plant extract in different concentrations).

4.4. Selection of Relevant Variables and Experiment Design

In this study, the TPC extraction from the stem bark material of the A. pavonina tree and IC50 of the extract’s DPPH radical scavenging activity (antioxidant activities) were optimized using the response surface methodology (RSM). To improve the extraction efficiency, the central composite design (CCD) was adopted as an experimental design. The independent operational parameters, viz. solvent composition (x1, % v/v of methanol/water), extraction temperature (x2, °C), and extraction time (x3, h), were selected based on impact as indicated in earlier studies and were categorized into three levels: low (−1), medium (0), and high (+1) (Table 6). The experimental design comprised 20 combinations including six central points, generated using Design Expert software (version 13.0.5) (Table 1), and the experimental data were fitted to the following second-order polynomial equation (Equation (4)):
y = b0 + b1x1 + b2x2 + b3x3 + b11x12 + b22x22 + b33x32 + b12x1x2+ b13x1x3 + b23x2x3
where y stands for the anticipated response; b0 indicates the value of the offset term; b1, b2, and b3 represent the linear coefficients; b11, b22, and b33 signify the quadratic coefficients; and b12, b13, and b23 imply the interaction coefficients. As per the extraction protocol suggested by the RSM model, 10 g bark powder was mixed with 100 mL of 71.61% (v/v) methanol/water and kept at 42.52 °C for 24 h under constant agitation in a shaker incubator. The extract was filtered before being vacuum-dried using a rotary evaporator. The dried extract was kept at 4 °C in an air-tight container until further analysis for identification and quantification of phenolic compounds employing the HPLC method.

4.5. Estimation of Phenolic Compounds via High-Performance Liquid Chromatography (HPLC)

An AGILANT 1260 (USA) device connected to the OpenLAB CDS 2.1 software data processing unit was employed for the evaluation of the phenolic compounds in the optimized extract of A. pavonina stem bark. A reversed-phase column, Luna C18 (25 cm length × 4.6 mm inner diameter × 5 µm thickness) (Phenomenex, Torrance, CA, USA), whose temperature was maintained at 28 °C, with a flow rate of the solvent set to 0.7 mL/min, was used for compound separation from a 20 µL plant sample and standard compound solution [19]. A standard compound solution with 1 mg/mL concentration was prepared by mixing 1 mg of standard compounds (kaempferol, gallic acid, syringic acid, chlorogenic acid, catechin hydrate, caffeic acid, p-coumaric acid, sinapic acid, coumarin, and quercetin) with 1 mL methanol solvent (HPLC-grade). The plant sample was prepared by mixing 1 mg of optimized extract of A. pavonina stem bark with 0.5 mL methanol solvent (HPLC-grade). Different proportions of solvent-B to solvent-A were used for gradient elution. For the first 28 min, the gradient of elution was altered using 10% to 40% of solvent-B in a linear manner, followed by 40% to 60% at 39 min, and 60 to 90% at 50 min. At 55 min, the mobile phase’s composition was restored to its original 10:90 (solvent-B/solvent-A) ratio, and the reaction was allowed to proceed for an additional 10 minutes before a new sample was injected. The total time required for analysis of each sample was 65 min. The chromatograms of the analyzed compounds were portrayed using a UV-Visible DAD detector, applying a range of wavelength from 280 to 320 nm. All the phenolic compounds were identified based on their retention time and by comparing them with standard compounds. For quantification of the identified compounds, a calibration curve was made against different concentrations of the respective standard compounds.

5. Conclusions

In the present work, different solvents like ethyl acetate, methanol, petroleum ether, and chloroform were used to observe their role in the extraction of maximum TPC and to gain the utmost antioxidant activity. Among the tested solvents, methanol was identified as the most effective solvent for the extraction of phenolic substances. The applied RSM technique has successfully demonstrated the influence of various factors like solvent ratio, extraction temperature, and extraction time on extracting the highest TPC and gaining maximum antioxidant activity from A. pavonina stem bark. According to the RSM optimization analysis, the optimal conditions were a solvent composition of 71.61% (v/v) of methanol/water, an extraction temperature of 42.52 °C, and an extraction time of 24 h, respectively. Under these extraction conditions, the experimental values for the TPC and IC50 of the extract’s DPPH radical scavenging activity were found to be 181.69 ± 0.20 mg GAE/g dry tissue and 60.13 ± 0.11 mg/mL, respectively, which are very close to the theoretical projected values determined via RSM. Further, phenolic characterization using the HPLC technique revealed the presence of five phenolic acids and one coumarin compound with the highest quantities of chlorogenic acid (117.526 mg/g dry tissue) and sinapic acid (64.779 mg/g dry tissue), which demonstrated sensible antioxidant potential of the A. pavonina stem bark. This study highlighted the significance of applying RSM in maximizing the phenolic quantity and antioxidant activity obtained from the stem bark of A. pavonina, with a characterization of phenolics that validates that the stem bark of this plant is a rich source of phenolic compounds and a promising antioxidant agent for pharmaceutical industries and future drug development.

Author Contributions

Conceptualization, S.N.B., C.H.R. and A.R.; methodology, S.N.B., C.H.R., M.H., M.A. and A.R.; software, A.R.; validation, S.N.B. and C.H.R.; formal analysis, S.N.B. and M.H.; investigation, S.N.B. and M.H.; resources, C.H.R. and A.R.; data curation, S.N.B. and A.R.; writing—original draft preparation, S.N.B.; writing—review and editing, A.R., M.A., C.H.R., S.N.B. and M.H.; visualization, S.N.B., C.H.R., M.H. and A.R.; supervision, C.H.R. and A.R.; project administration, C.H.R. and A.R. All authors have read and agreed to the published version of the manuscript.

Funding

This research received no external funding.

Data Availability Statement

All data are mentioned within the article.

Acknowledgments

The authors are thankful to the Department of Botany, Visva-Bharati University, West Bengal, India, for providing the laboratory facilities to conduct the research. All authors acknowledge the suggestions of the reviewers for the improvement of the manuscript.

Conflicts of Interest

The authors declare no conflict of interest.

References

  1. Kirtikar, K.R.; Basu, B.D. Indian Medicinal Plants, 2nd ed.; Lalit Mohan Basu: Allahabad, India, 1991; pp. 909–910. [Google Scholar]
  2. Gerona, M.S.; Melo, R.C.; Barros, H.L.M.; Aquino, S.R.; Islam, M.T.; dos Santos Rizzo, M.; da Costa, M.P. Advances in the research of Adenanthera pavonina: From traditional use to intellectual property. J. Med. Plant Res. 2020, 14, 24–53. [Google Scholar] [CrossRef]
  3. Partha, G.; Rahaman, C.H. Pharmacognostic, phytochemical and antioxidant studies of Adenantherapavonina L. Int. J. Pharmacogn. Phytochem. Res. 2015, 7, 30–37. [Google Scholar]
  4. Dash, S.; Das, C.; Sahoo, D.C. Phytochemical and anthelmintic screening of crude bark extract of Adenanthera pavonina Linn. Pharm. Glob. Int. J. Compr. Pharm. 2010, 1, 1–4. [Google Scholar]
  5. Ara, A.; Arifuzzaman, M.; Ghosh, C.K.; Hashem, M.A.; Ahmad, M.U.; Bachar, S.C.; Nahar, L.; Sarker, S.D. Anti-inflammatory activity of Adenanthera pavonina L., Fabaceae, in experimental animals. Rev. Bras. Farmacogn. 2010, 20, 929–932. [Google Scholar] [CrossRef]
  6. Olajide, O.A.; Echianu, C.A.; Adedapo, A.D.; Makinde, J.M. Anti-inflammatory studies on Adenanthera pavonina seed extract. Inflammopharmacology 2004, 12, 196–201. [Google Scholar] [CrossRef] [PubMed]
  7. Ara, A.; Saleh-E-In, M.M.; Hashem, M.A.; Ahmad, M.; Hasan, C.M. Phytoconstituents of Adenanthera pavonina Linn from the bark extracts. Beni-Suef Univ. J. Basic Appl. Sci. 2019, 8, 20. [Google Scholar] [CrossRef]
  8. Owoeye, T.F.; Akinlabu, K.D.; Ajani, O.O. Proximate composition, phytochemical screening and mineral content studies of leaves extract of Adenanthera pavonina. Arab J. Basic Appl. Sci. 2023, 30, 317–328. [Google Scholar] [CrossRef]
  9. Krishnan, H.B.; Kim, S.; Pereira, A.E.; Jurkevich, A.; Hibbard, B.E. Adenanthera pavonina, a potential plant-based protein resource: Seed protein composition and immunohistochemical localization of trypsin inhibitors. Food Chem. 2022, 14, 100253. [Google Scholar] [CrossRef] [PubMed]
  10. Zeid, A.H.A.; El-Kashoury, E.A.; Sleem, A.A.; Waly, D.A. Lipoidal content and anti-inflammatory activity of Adenanthera pavonina L. leaves. J. Appl. Sci. Res. 2012, 8, 207–214. [Google Scholar]
  11. Silva, I.K.; Soysa, P. Evaluation of phytochemical composition and antioxidant capacity of a decoction containing Adenanthera pavonina L.; Thespesia populnea L. Pharmacogn. Mag. 2011, 7, 193–199. [Google Scholar] [CrossRef]
  12. Mohamed, S.M.; Hassanein, E.H.; Ross, S.A.; Mohamed, N.M. Phytoconstituents from Adenanthera pavonina L. as antioxidants and inhibitors of inducible TNF-α production in BV2 cells. Nat. Prod. Res. 2022, 36, 6267–6278. [Google Scholar] [CrossRef] [PubMed]
  13. Begum, S.N.; Ray, A.S.; Rahaman, C.H. A comprehensive and systematic review on potential anticancer activities of eugenol: From pre-clinical evidence to molecular mechanisms of action. Phytomedicine 2022, 107, 154456. [Google Scholar] [CrossRef]
  14. Fratta Pasini, A.M.; Cominacini, L. Potential Benefits of Antioxidant Phytochemicals on Endogenous Antioxidants Defences in Chronic Diseases. Antioxidants 2023, 12, 890. [Google Scholar] [CrossRef] [PubMed]
  15. Kumar, N.; Goel, N. Phenolic acids: Natural versatile molecules with promising therapeutic applications. Biotechnol. Rep. 2019, 24, e00370. [Google Scholar] [CrossRef]
  16. Stevenson, D.E.; Hurst, R.D. Polyphenolic phytochemicals–just antioxidants or much more? Cell. Mol. Life Sci. 2007, 64, 2900–2916. [Google Scholar] [CrossRef]
  17. Lobo, V.; Patil, A.; Phatak, A.; Chandra, N. Free radicals, antioxidants and functional foods: Impact on human health. Pharmacogn. Rev. 2010, 4, 118–126. [Google Scholar] [CrossRef]
  18. Mukherjee, S.; Mandal, N.; Dey, A.; Mondal, B. An approach towards optimization of the extraction of polyphenolic antioxidants from ginger (Zingiber officinale). J. Food Sci. Technol. 2014, 51, 3301–3308. [Google Scholar] [CrossRef] [PubMed]
  19. Gil-Martín, E.; Forbes-Hernández, T.; Romero, A.; Cianciosi, D.; Giampieri, F.; Battino, M. Influence of the extraction method on the recovery of bioactive phenolic compounds from food industry by-products. Food Chem. 2022, 378, 1–398. [Google Scholar] [CrossRef]
  20. Hazra, S.; Ray, A.S.; Das, S.; Das Gupta, A.; Rahaman, C.H. Phytochemical Profiling, Biological Activities, and In Silico Molecular Docking Studies of Causonis trifolia (L.) Mabb. & J. Wen Shoot. Plants 2023, 28, 5163. [Google Scholar] [CrossRef]
  21. Box, G.E.; Wilson, K.B. On the experimental attainment of optimum conditions. In Breakthroughs in Statistics: Methodology and Distribution; Kotz, S., Johnson, N.L., Eds.; Springer: New York, NY, USA, 1992; Volume 2, pp. 270–310. [Google Scholar] [CrossRef]
  22. Muala, W.C.B.; Desobgo, Z.S.C.; Jong, N.E. Optimization of extraction conditions of phenolic compounds from Cymbopogon citratus and evaluation of phenolics and aroma profiles of extract. Heliyon 2021, 7, e06744. [Google Scholar] [CrossRef]
  23. Kruk, J.; Aboul-Enein, B.H.; Duchnik, E.; Marchlewicz, M. Antioxidative properties of phenolic compounds and their effect on oxidative stress induced by severe physical exercise. J. Physiol. Sci. 2022, 72, 19. [Google Scholar] [CrossRef] [PubMed]
  24. Adnan, M.; Oh, K.K.; Azad, M.O.K.; Shin, M.H.; Wang, M.-H.; Cho, D.H. Kenaf (Hibiscus cannabinus L.) Leaves and Seed as a Potential Source of the Bioactive Compounds: Effects of Various Extraction Solvents on Biological Properties. Life 2020, 10, 223. [Google Scholar] [CrossRef] [PubMed]
  25. Altemimi, A.; Lakhssassi, N.; Baharlouei, A.; Watson, D.G.; Lightfoot, D.A. Phytochemicals: Extraction, isolation, and identification of bioactive compounds from plant extracts. Plants 2017, 6, 42. [Google Scholar] [CrossRef] [PubMed]
  26. Adnan, M.; Chy, M.N.U.; Kamal, A.T.M.M.; Chowdhury, K.A.A.; Rahman, M.A.; Reza, A.S.M.A.; Moniruzzaman, M.; Rony, S.R.; Nasrin, M.S.; Azad, M.O.K.; et al. Intervention in Neuropsychiatric Disorders by Suppressing Inflammatory and Oxidative Stress Signal and Exploration of In Silico Studies for Potential Lead Compounds from Holigarna caustica (Dennst.) Oken leaves. Biomolecules 2020, 10, 561. [Google Scholar] [CrossRef]
  27. Loganayaki, N.; Siddhuraju, P.; Manian, S. Antioxidant activity and free radical scavenging capacity of phenolic extracts from Helicteresisora L.; Ceiba pentandra L. J. Food Sci. Technol. 2013, 50, 687–695. [Google Scholar] [CrossRef]
  28. Adnan, M.; Chy, M.N.U.; Rudra, S.; Tahamina, A.; Das, R.; Tanim, M.A.H.; Siddique, T.I.; Hoque, A.; Tasnim, S.M.; Paul, A.; et al. Evaluation of Bonamia semidigyna (Roxb.) for antioxidant, antibacterial, anthelmintic and cytotoxic properties with the involvement of polyphenols. Orient. Pharm. Exp. Med. 2019, 19, 187–199. [Google Scholar] [CrossRef]
  29. Anderson, M.J.; Whitcomb, P.J. RSM Simplified: Optimizing Processes Using Response Surface Methods for Design of Experiments, 2nd ed.; Productivity Press: New York, NY, USA, 2016. [Google Scholar] [CrossRef]
  30. Nikaeen, G.; Yousefinejad, S.; Rahmdel, S.; Samari, F.; Mahdavinia, S. Central Composite Design for Optimizing the Biosynthesis of Silver Nanoparticles using Plantago major Extract and Investigating Antibacterial, Antifungal and Antioxidant Activity. Sci. Rep. 2020, 10, 9642. [Google Scholar] [CrossRef] [PubMed]
  31. Montgomery, D.C. Design and Analysis of Experiments, 7th ed.; John Wiley & Sons, Inc.: New York, NY, USA, 2009. [Google Scholar]
  32. Liyana-Pathirana, C.; Shahidi, F. Optimization of extraction of phenolic compounds from wheat using response surface methodology. Food Chem. 2005, 93, 47–56. [Google Scholar] [CrossRef]
  33. Jaafar, N.F.; Ramli, M.E.; Salleh, R.M. Optimum extraction condition of Clitoreaternatea flower on antioxidant activities, total phenolic, total flavonoid and total anthocyanin contents. Trop. Life Sci. Res. 2020, 31, 1–17. [Google Scholar] [CrossRef]
  34. Che Sulaiman, I.S.; Basri, M.; Fard Masoumi, H.R.; Chee, W.J.; Ashari, S.E.; Ismail, M. Effects of temperature, time, and solvent ratio on the extraction of phenolic compounds and the anti-radical activity of Clinacanthus nutans Lindau leaves by response surface methodology. Chem. Cent. J. 2017, 11, 1–11. [Google Scholar] [CrossRef]
  35. Jahromi, S.G. Extraction techniques of phenolic compounds from plants. In Plant Physiological Aspects of Phenolic Compounds; IntechOpen: London, UK, 2019; pp. 1–18. [Google Scholar] [CrossRef]
  36. Shi, L.; Zhao, W.; Yang, Z.; Subbiah, V.; Suleria, H.A.R. Extraction and characterization of phenolic compounds and their potential antioxidant activities. Environ. Sci. Pollut. Res. Int. 2022, 29, 81112–81129. [Google Scholar] [CrossRef]
  37. Robards, K. Strategies for the determination of bioactive phenols in plants, fruit and vegetables. J. Chromatogr. A 2003, 1000, 657–691. [Google Scholar] [CrossRef]
  38. Khoddami, A.; Wilkes, M.A.; Roberts, T.H. Techniques for analysis of plant phenolic compounds. Molecules 2013, 18, 2328–2375. [Google Scholar] [CrossRef] [PubMed]
  39. Hamad, A.; Hartanti, D. Effects of extraction time on total phenolic and flavonoid contents and antioxidant activities of a polyherbal drink. IOP Conf. Ser. Earth Environ. Sci. 2023, 1200, 1–8. [Google Scholar] [CrossRef]
  40. Sik, B.; Ajtony, Z.; Lakatos, E.; Székelyhidi, R. The effects of extraction conditions on the antioxidant activities, total polyphenol and monomer anthocyanin contents of six edible fruits growing wild in Hungary. Heliyon 2022, 8, 1–8. [Google Scholar] [CrossRef] [PubMed]
  41. Zimare, S.B.; Mankar, G.D.; Barmukh, R.B. Optimization of ultrasound-assisted extraction of total phenolics and flavonoids from the leaves of Lobelia nicotianifolia and their radical scavenging potential. Curr. Res. Green Sustain. Chem. 2021, 4, 1–10. [Google Scholar] [CrossRef]
  42. Patil, S.S.; Deshannavar, U.B.; Ramasamy, M.; Emani, S.; Khalilpoor, N.; Issakhov, A. Study of extraction kinetics of Total polyphenols from curry leaves. Int. J. Chem. Eng. 2021, 1–8. [Google Scholar] [CrossRef]
  43. Al-Juhaimi, F.; Adiamo, O.Q.; Ghafoor, K.; Babiker, E.E. Optimization of ultrasonic-assisted extraction of phenolic compounds from fenugreek (Trigonella foenum-graecum L.) seed. CyTA-J. Food 2016, 14, 369–374. [Google Scholar]
  44. Rodrigo, S.K.; Jayasingha, U.L.B.; Bandara, B.M.R. Antifungal, antioxidant and cytotoxic activity of Acronychia pedunculata and Adenanthera pavonina. Proc. Perad. Univ. Res. Sess.-Sri Lanka 2007, 12, 94–95. [Google Scholar]
  45. Naveed, M.; Hejazi, V.; Abbas, M.; Kamboh, A.A.; Khan, G.J.; Shumzaid, M.; Ahmad, F.; Babazadeh, D.; Xia, F.; Modarresi-Ghazani, F.; et al. Chlorogenic acid (CGA): A pharmacological review and call for further research. Biomed. Pharmacother. 2018, 97, 67–74. [Google Scholar] [CrossRef]
  46. Pandi, A.; Kalappan, V.M. Pharmacological and therapeutic applications of Sinapic acid an updated review. Mol. Biol. Rep. 2021, 48, 3733–3745. [Google Scholar] [CrossRef] [PubMed]
  47. Bai, J.; Zhang, Y.; Tang, C.; Hou, Y.; Ai, X.; Chen, X.; Zhang, Y.; Wang, X.; Meng, X. Gallic acid: Pharmacological activities and molecular mechanisms involved in inflammation-related diseases. Biomed. Pharmacother. 2021, 133, 1–14. [Google Scholar] [CrossRef]
  48. Gao, J.; Hu, J.; Hu, D.; Yang, X. A role of gallic acid in oxidative damage diseases: A comprehensive review. Nat. Prod. Commun. 2019, 14, 1–9. [Google Scholar] [CrossRef]
  49. Maity, S.; Kinra, M.; Nampoothiri, M.; Arora, D.; Pai, K.S.R.; Mudgal, J. Caffeic acid, a dietary polyphenol, as a promising candidate for combination therapy. Chem. Pap. 2022, 76, 1271–1283. [Google Scholar] [CrossRef]
  50. Ferreira, P.S.; Victorelli, F.D.; Fonseca-Santos, B.; Chorilli, M. A review of analytical methods for p-coumaric acid in plant-based products, beverages, and biological matrices. Crit. Rev. Anal. Chem. 2019, 49, 21–31. [Google Scholar] [CrossRef] [PubMed]
  51. Devulapally, S.; Chandraiah, G.; Pramod, K.D. A review on pharmacological properties of coumarins. Mini Rev. Med. Chem. 2018, 18, 113–141. [Google Scholar] [CrossRef]
  52. Junior, C.M.S.; Cardoso, S.M.; Sales, E.M.; Velozo, E.S.; Dos Santosb, E.K.P.; Canuto, G.A.B.; Azeredo, F.J.; Barrosd, T.F.; Biegelmeyer, R. Coumarins from Rutaceae: Chemical diversity and biological activities. Fitoterapia 2023, 168, 105489. [Google Scholar] [CrossRef]
  53. Paul, T.K.; Lakshminarasimhan, P.; Chowdhery, H.J.; Singh, P. Flora of West Bengal, Vol-I Ranunculaceae-Moringaceae; Botanical Survey of India: Kolkata, India, 2015. [Google Scholar]
  54. POWO. Available online: https://powo.science.kew.org/ (accessed on 14 October 2020).
  55. Jain, S.K.; Rao, R.R. A Handbook of Field and Herbarium Methods; Today and Tomorrows Publishers: New Delhi, India, 1977. [Google Scholar]
  56. Cicco, N.; Lanorte, M.T.; Paraggio, M.; Viggiano, M.; Lattanzio, V. A reproducible, rapid and inexpensive Folin–Ciocalteu micro-method in determining phenolics of plant methanol extracts. Microchem. J. 2009, 91, 107–110. [Google Scholar] [CrossRef]
  57. Thaipong, K.U.; Boonprakob, K.; Crosby, L.; Cisneros, Z.; Byrne, D.H. Comparison of ABTS, DPPH, FRAP and ORAC assays for estimating antioxidant activity from guava fruit extracts. J. Food Compost. Anal. 2006, 19, 669–675. [Google Scholar] [CrossRef]
Figure 1. Effect of different solvents extracts on the extraction of TPC (total phenolic content, mg GAE/g dry tissue) and antioxidant activities (IC50 of extract’s DPPH radical scavenging activity, mg/mL) from the A. pavonia stem bark.
Plants 12 03902 g001
Figure 2. Linear fit for predicted values against experimental observations: (a) TPC and (b) IC50 of extract’s DPPH radical scavenging activity.
Plants 12 03902 g002
Figure 3. Diagnostic plots for TPC (externally studentized residual versus (a) predicted value and (b) experimental runs) and IC50 of extract’s DPPH radical scavenging activity (externally studentized residual versus (c) predicted value and (d) experimental runs).
Plants 12 03902 g003
Figure 4. Normal probability plot of externally studentized residuals for (a) TPC and (b) IC50 of extract’s DPPH radical scavenging activity.
Plants 12 03902 g004
Figure 5. Three-dimensional surface and contour plots for TPC extraction from A. pavonina bark: (a) extraction temperature (°C) × solvent composition (%), (b) extraction time (h) × solvent composition (%), and (c) extraction time (h) × extraction temperature (°C).
Plants 12 03902 g005
Figure 6. Three-dimensional surface and contour plots for IC50 of extract’s DPPH radical scavenging activity: (a) extraction temperature (°C) × solvent composition (%), (b) extraction time (h) × solvent composition (%), and (c) extraction time (h) × extraction temperature (°C).
Plants 12 03902 g006
Figure 7. Overlay plot showing the ideal zone with an extraction time of 12.5 h.
Plants 12 03902 g007
Figure 8. HPLC chromatogram of (a) standard phenolic compounds and (b) optimized extract of A. pavonina stem bark.
Plants 12 03902 g008
Figure 9. (a) The tree of Adenanthera pavonina L., (b) stem bark (inner (I) and outer (O) surfaces), (c) powder of stem bark.
Plants 12 03902 g009
Table 1. Experimental design and results obtained from the CCD design.
RunIndependent ParametersResponse Variables (y1 and y2)
x1 *x2 **x3 ***Experimental ValuePredicted Value
TPC (mg GAE/g Dry Tissue)IC50 of Extract’s DPPH Radical Scavenging Activity (mg/mL)TPC (mg GAE/g Dry Tissue)IC50 of Extract’s DPPH Radical Scavenging Activity (mg/mL)
140201115.54 ± 0.4389.07±0.27117.0989.79
2100201119.78 ± 0.4288.25 ± 0.15118.590.62
34080198.16 ± 0.7192.11 ± 0.0397.3293.03
410080196.51 ± 0.03690.14 ± 0.0498.7190.23
5402024154.64 ± 0.3979.91 ± 0.23153.1879.5
61002024152.89 ± 0.1178.33 ± 0.06155.4877.09
7408024110.43 ± 0.3089.89 ± 0.20113.4587.2
81008024115.52 ± 0.4182.2 ± 0.19115.7281.16
9405012.5162.89 ± 0.1578.2 ± 0.25159.6279.65
101005012.5165.17 ± 0.1677.23 ± 0.24161.4677.05
11702012.5173.44 ± 0.1376.85 ± 0.14171.0475.42
12708012.5145.85 ± 0.1076.35 ± 0.20141.2879.07
1370501154.49 ± 0.0769.43 ± 0.43152.8665.32
14705024184.76 ± 0.0250.26 ± 0.08179.4155.64
15705012.5175.38 ± 0.1667.44 ± 0.10180.8365
16705012.5179.73 ± 0.2266.62 ± 0.12180.8365
17705012.5184.18 ± 0.2061.83 ± 0.13180.8365
18705012.5181.35 ± 0.1862.52 ± 0.10180.8365
19705012.5172.87 ± 0.4370.06 ± 0.04180.8365
20705012.5177.53 ± 0.4164.04 ± 0.085180.8365
x1 *: solvent composition (% v/v of methanol/water); x2 **: extraction temperature (°C); x3 ***: extraction time (h); y1: total phenolic content; y2: IC50 of extract’s DPPH radical scavenging assay.
Table 2. ANOVA results for the response surface quadratic model developed for TPC.
SourceSS 1df 2MS 3F-Valuep-Value
Model17,332.1691925.8085.75<0.0001significant
x1 *8.4818.480.37770.5526
x2 **2214.7412214.7498.62<0.0001significant
x3 ***1762.5211762.5278.48<0.0001significant
x1²1131.7811131.7850.39<0.0001significant
x2²1673.9211673.9274.53<0.0001significant
x3²593.591593.5926.430.0004significant
x1x20.000310.00030.00000.9971
x1x30.382810.38280.01700.8987
x2x3199.301199.308.870.0138significant
Residual224.581022.46
Lack of Fit140.31528.061.670.2947not significant
Pure Error84.27516.85
R20.98
Adjusted R20.97
Predicted R20.93
Adequate precision24.92
1 SS: sum of square; 2 df: degree of freedom; 3 MS: mean square; * x1: solvent composition; ** x2: extraction temperature; *** x3: extraction time.
Table 3. ANOVA results for the response surface quadratic model developed for IC50 of extract’s DPPH radical scavenging activity.
SourceSS 1df 2MS 3F-Valuep-Value
Model2337.249259.6920.66<0.0001significant
x1 *16.98116.981.350.2721
x2 **33.42133.422.660.1340
x3 ***234.351234.3518.650.0015significant
x1²490.281490.2839.01<0.0001significant
x2²412.491412.4932.820.0002significant
x3²56.13156.134.470.0607
x1x26.5916.590.52420.4856
x1x35.2515.250.41760.5327
x2x39.9519.950.79140.3946
Residual125.681012.57
Lack of Fit75.50515.101.500.3325not significant
Pure Error50.18510.04
R20.94
Adjusted R20.90
Predicted R20.72
Adequate precision14.92
1 SS: sum of square; 2 df: degree of freedom; 3 MS: mean square; * x1: solvent composition; ** x2: extraction temperature; *** x3: extraction time.
Table 4. Predicted and experimental values under optimum conditions for model validation.
ParametersOptimum ConditionsPredicted ValuesExperimental
Values
95% Confidence Interval
LowHigh
TPC (mg GAE/g Dry Tissue)IC50 of Extract’s DPPH Radical Scavenging Activity (mg/mL)TPC (mg GAE/g Dry Tissue)IC50 of Extract’s DPPH Radical Scavenging Activity (mg/mL)TPC (mg GAE/g Dry Tissue)IC50 of Extract’s DPPH Radical Scavenging Activity (mg/mL)TPC (mg GAE/g Dry Tissue)IC50 of Extract’s DPPH Radical Scavenging Activity (mg/mL)
x1 *71.61182.8455.62181.69 ± 0.2060.13 ± 0.11175.4950.11190.1874.62
x2 **42.52
x3 ***24.00
* x1: solvent composition (%); ** x2: extraction temperature (°C); *** x3: extraction time (h).
Table 5. List of phenolic compounds identified in optimized stem bark extract of A. pavonine using HPLC analysis (n = 6).
Sl. NoName of the CompoundAmount
(mg/g Dry Tissue)
Chemical GroupBiological Activity
1Gallic acid0.042Phenolic acidAnti-inflammatory, antioxidant, anticancerous, antimicrobial [47,48]
2Chlorogenic acid117.526Phenolic acidAntioxidant, anti-inflammatory, anticancerous, antimicrobial [45]
3Caffeic acid5.809Phenolic acidAnti-inflammatory, antioxidant, antimicrobial, analgesic, and cardioprotective [49]
4p-coumaric acid0.487Phenolic acidAnti-inflammatory, antioxidant, antineoplastic, and antimicrobial [50]
5Sinapic acid64.779Phenolic acidAnti-inflammatory, antioxidant, anticancerous, and antimicrobial. [46]
6Coumarin1.523Coumarins (benzopyrone)Antimicrobial, antioxidant, anti-inflammatory, anticancer, anti-TB, and anticonvulsant [51,52]
Table 6. Actual and coded values of independent parameters were used in this study.
SymbolsIndependent VariablesUnitCoded Levels
−1 (Low)0 (Medium)+1 (High)
x1Solvent composition (% v/v of methanol/water)%4070100
x2Extraction temperature°C205060
x3Extraction timeh112.524
Dependent/Response VariablesGoal
y1Total phenolic contentmg GAE/g dry tissue Maximize
y2IC50 of extract’s DPPH radical scavenging activity(mg/mL) Maximize
Disclaimer/Publisher’s Note: The statements, opinions and data contained in all publications are solely those of the individual author(s) and contributor(s) and not of MDPI and/or the editor(s). MDPI and/or the editor(s) disclaim responsibility for any injury to people or property resulting from any ideas, methods, instructions or products referred to in the content.

