Article

Genome-Wide Identification and Characterization of the HAK Gene Family in Quinoa (Chenopodium quinoa Willd.) and Their Expression Profiles under Saline and Alkaline Conditions

1
Fuzhou Institute of Oceanography, Minjiang University, Fuzhou 350108, China
2
Fujian University Engineering Research Center of Marine Biology and Drugs, College of Geography and Oceanography, Minjiang University, Fuzhou 350108, China
3
College of Agriculture, Fujian Agriculture and Forestry University, Fuzhou 350002, China
*
Authors to whom correspondence should be addressed.
Plants 2023, 12(21), 3747; https://doi.org/10.3390/plants12213747
Submission received: 7 October 2023 / Revised: 28 October 2023 / Accepted: 31 October 2023 / Published: 1 November 2023

Abstract

:
The high-affinity K+ transporter (HAK) family, the most prominent potassium transporter family in plants, which involves K+ transport, plays crucial roles in plant responses to abiotic stresses. However, the HAK gene family remains to be characterized in quinoa (Chenopodium quinoa Willd.). We explored HAKs in quinoa, identifying 30 members (CqHAK1CqHAK30) in four clusters phylogenetically. Uneven distribution was observed across 18 chromosomes. Furthermore, we investigated the proteins’ evolutionary relationships, physicochemical properties, conserved domains and motifs, gene structure, and cis-regulatory elements of the CqHAKs family members. Transcription data analysis showed that CqHAKs have diverse expression patterns among different tissues and in response to abiotic stresses, including drought, heat, low phosphorus, and salt. The expressional changes of CqHAKs in roots were more sensitive in response to abiotic stress than that in shoot apices. Quantitative RT-PCR analysis revealed that under high saline condition, CqHAK1, CqHAK13, CqHAK19, and CqHAK20 were dramatically induced in leaves; under alkaline condition, CqHAK1, CqHAK13, CqHAK19, and CqHAK20 were dramatically induced in leaves, and CqHAK6, CqHAK9, CqHAK13, CqHAK23, and CqHAK29 were significantly induced in roots. Our results establish a foundation for further investigation of the functions of HAKs in quinoa. It is the first study to identify the HAK gene family in quinoa, which provides potential targets for further functional study and contributes to improving the salt and alkali tolerance in quinoa.

1. Introduction

Potassium (K+) is the predominant monovalent cation in plant cells, comprising approximately 2–10% of the dry weight of plants [1]. K+ is an essential element for plants to maintain normal physiological and biochemical processes. The application of K+ fertilizer has been shown to have positive effects on leaf growth [2], flowering [3], wood quality [4], and yield [5]. Plant K+ transporters are responsible for K+ uptake and transport, and play significant roles in the responses to biotic and abiotic stresses [6,7,8]. Based on their structure and function, K+ transporters can be classified into three groups: (1) KT (K+ transporter)/HAK (high-affinity K+)/KUP (K+ uptake), (2) HKT (high-affinity K+ transporter), and (3) CPAs (cation–proton antiporters) [9]. Among them, KT/HAK/KUP (HAK hereafter) is the most prominent K+ transporter family, with wide distribution in bacteria, fungi, and plants [10].
HAK transporters have been found to play diverse roles in K+ uptake and translocation, and function in stress tolerance and osmotic potential regulation [11]. For example, in Arabidopsis, AtHAK5 is a prominent high-affinity K+ uptake transporter that is strongly induced under K+ deficiency conditions (external concentration below 10 μM) [12]. AtKUP7 is crucial for K+ uptake in Arabidopsis root and plays a role in transporting K+ into the xylem sap, particularly under K+-deficient conditions [13]. In rice, OsHAK5 is involved in transporting K+ from roots to shoots. The overexpression of OsHAK5 led to increased shoot K+/Na+ ratio and salt tolerance in rice [14]. Similarly, rice plants overexpressing OsHAK1 displayed enhanced salt tolerance and significantly improved drought resistance, which resulted an increase in grain yield by 35% compared to the wild type under drought conditions [15,16]. In maize, ZmHAK4 functions in mediating shoot Na+ exclusion, thereby playing a role in promoting salt tolerance [17]. Some HAK transporters have been found to function in the morphological development of roots and shoots. For example, the mutation of AtKUP2/SHY3 (short hypocotyl 3) impacted cell expansion and resulted in developmental defects in Arabidopsis shoots [18]. AtKUP4, previously known as tiny root hair 1 (TRH1), has been characterized to be involved in the initiation and formation of root hairs [19,20].
Quinoa (Chenopodium quinoa Willd.) is an allotetraploid annual halophyte crop (2n = 4x = 36), that originates from the hybridization between diploid C. pallidicaule and diploid C. suecicum [21]. Quinoa is highly tolerant to multiple abiotic stresses, such as cold, drought, salt stress, and sterile soil [22]. Meanwhile, it possesses remarkable nutritional properties and has emerged as an attractive pseudo-cereal over the past decades. Although the HAK family is the most prominent K+ transporter family and has crucial functions in development and in the responses to stresses in plants, very little is known regarding the information of HAKs in quinoa. In the present study, we performed a genome-wide identification and characterization of the HAK gene family in quinoa. Our analyses revealed the phylogenetic relationships, conserved motifs and domains, gene structure, cis-acting elements, syntenic relationships, tissue expression patterns, and the salinity and alkalinity-induced expression profiles of the HAK family. By understanding the involvement of the HAK gene family in quinoa’s response to salt and alkali stress, this research seeks to provide valuable insights into the molecular mechanisms underlying quinoa’s resilience and contribute to the development of stress-tolerant varieties.

2. Results

2.1. Identification of the HAK Family Genes in C. quinoa

A total of 30 CqHAK genes were determined (Table 1) by searching the quinoa genome [21]. Table 1 presents the basic properties of the 30 CqHAK members, including number of introns, length, molecular weight (MW), isoelectric point (pI), and the putative subcellular localization of predicted proteins. The CqHAK genes encode proteins with lengths ranging from 476 to 910 amino acids. The genomic sequences of CqHAK contained 4 to 13 exons. The pI of the predicted CqHAK proteins ranged from 6.1 to 9.17, and the theoretical MW ranged from 54.19 to 102.23 KDa. Subcellular location analyses indicated that all CqHAKs were predicted to be located in the plasma membrane.

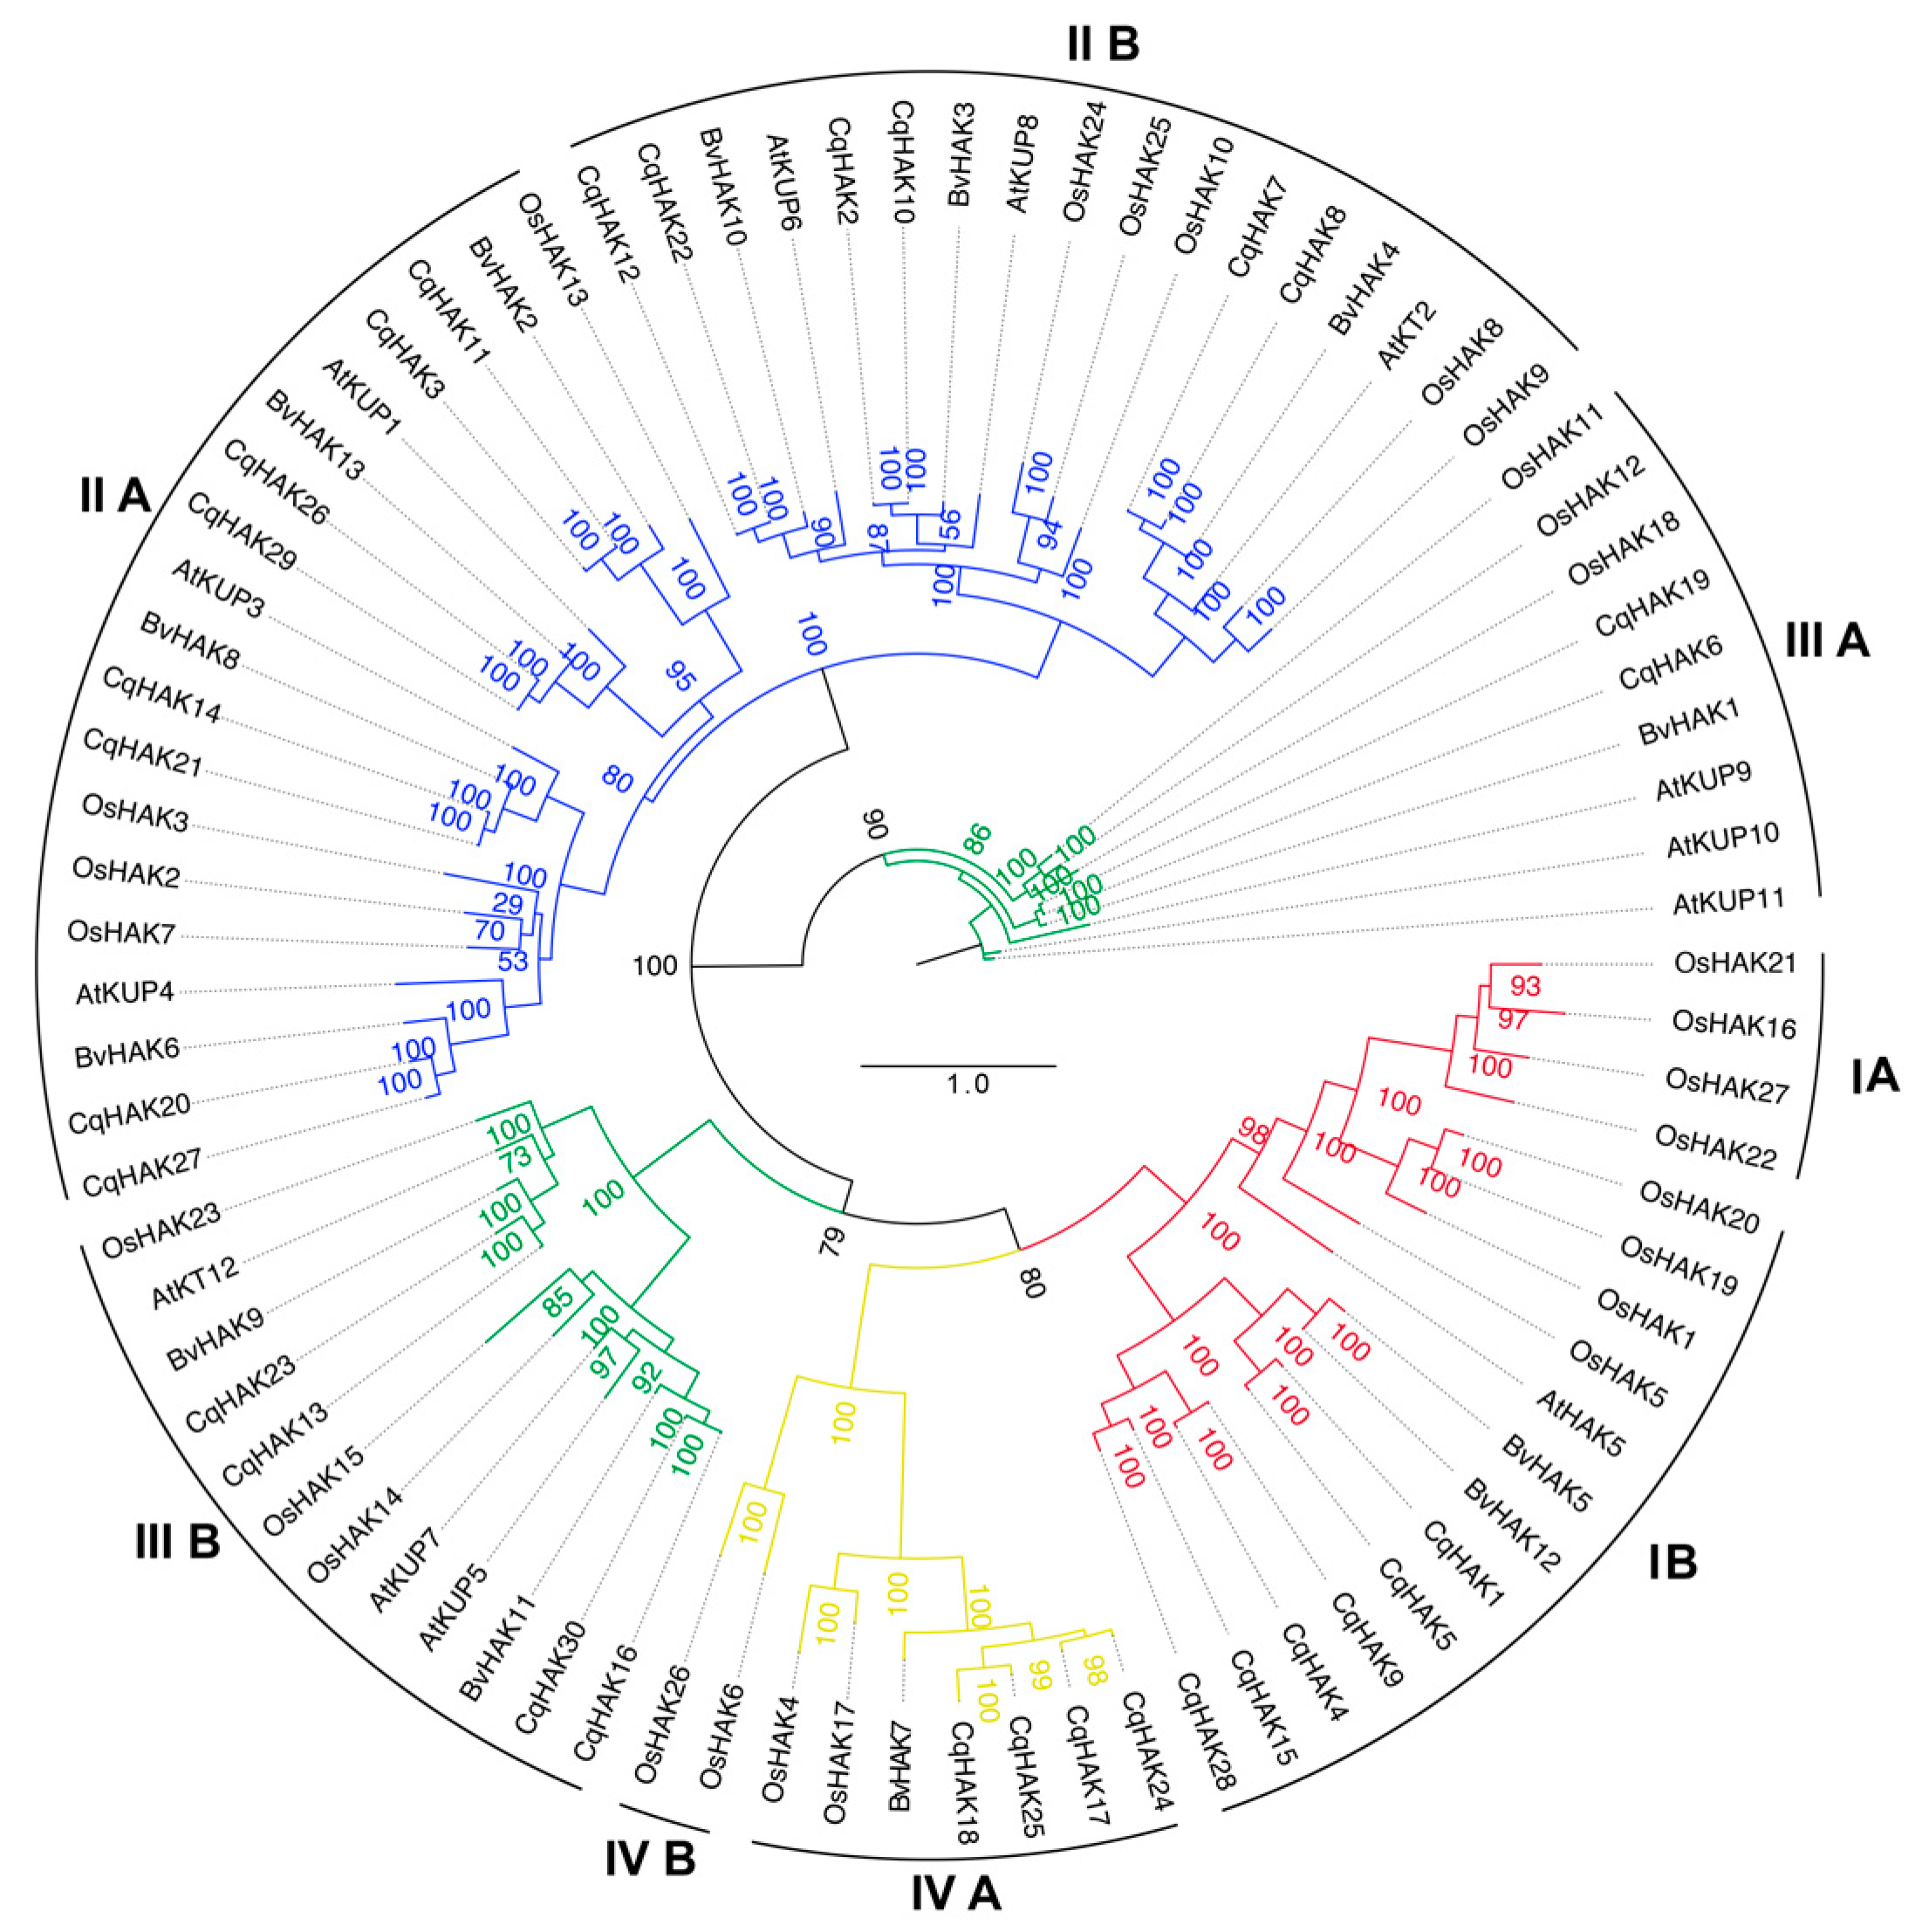
2.2. Phylogenetic Analysis of the CqHAK Transporters

The 30 identified CqHAKs were classified into four clusters: I, II, III, and IV (Figure 1). Furthermore, each cluster could be subdivided into sub-clades A and B. Cluster I contained six CqHAKs, with all six clustering in IB. Cluster II consisted of 14 CqHAKs, with eight members in IIA (CqHAK3, 11, 14, 20, 21, 26, 27, and 29) and six in IIB (CqHAK2, 7, 8, 10, 12, and 22). There were six CqHAKs in cluster III, with two members in IIIA (CqHAK6 and 19) and four in IIIB (CqHAK13, 16, 23, and 30). Only four CqHAK transporters were categorized into Cluster IV, with all (CqHAK17, 18, 24, and 25) clustering together in IVA.

2.3. Motif, Domain, and Gene Structure Analyses of CqHAKs

Ten distinct motifs (labeled as Motif 1–10) were identified among the CqHAK family members (Figure 2A,B and Figure S1). Most of the CqHAK members contained more than seven motifs, except for CqHAK18 and CqHAK28, which contained only six and five motifs, respectively. Specifically, Motif 2 was observed in all the CqHAK proteins. Motifs 1, 3, and 7 were conserved in all four HAK clusters. Motif 9 had the highest absence frequency, as it was missing in seven HAKs. Motifs 4 and 5 had the second highest absence frequency, as it was missing in five HAKs.
The HAK family members have a specific domain known as the “K_trans superfamily” (cl15781). Based on NCBI conserved domain database, there are eight types of “K_trans superfamily”. Among these, three were found in the CqHAK members, namely “K_trans,” “PLN00151,” and “K_trans superfamily”. Cluster I and Cluster II contained only the “K_trans superfamily,” while clusters III and IV contained the “K_trans superfamily” along with “PLN00151” and “K_trans,”, respectively (Figure 2A,B).
The gene structures of CqHAKs exhibited significant variability, comprising four to 13 exons and three to 12 introns (Figure 2C). Eleven CqHAK genes (36.7%) have nine introns, seven CqHAK genes have seven introns, five CqHAK genes have six introns, four CqHAK genes have nine introns, and the remaining three CqHAK genes contain three, ten and 12 introns each. The number of exons/introns was similar in CqHAKs that were categorized into same cluster, especially in the phylogenetically closest pairs. For instance, the gene pairs CqHAK12 and CqHAK22, CqHAK14 and CqHAK21, CqHAK16 and CqHAK30, CqHAK26 and CqHAK29 contained the same intron numbers, respectively. The exon configuration of most gene pairs was almost the same regardless of the difference in intron length. However, the gene pairs of CqHAK17 and CqHAK24, and CqHAK20 and CqHAK27 showed obvious difference in gene structure (Figure 2C).

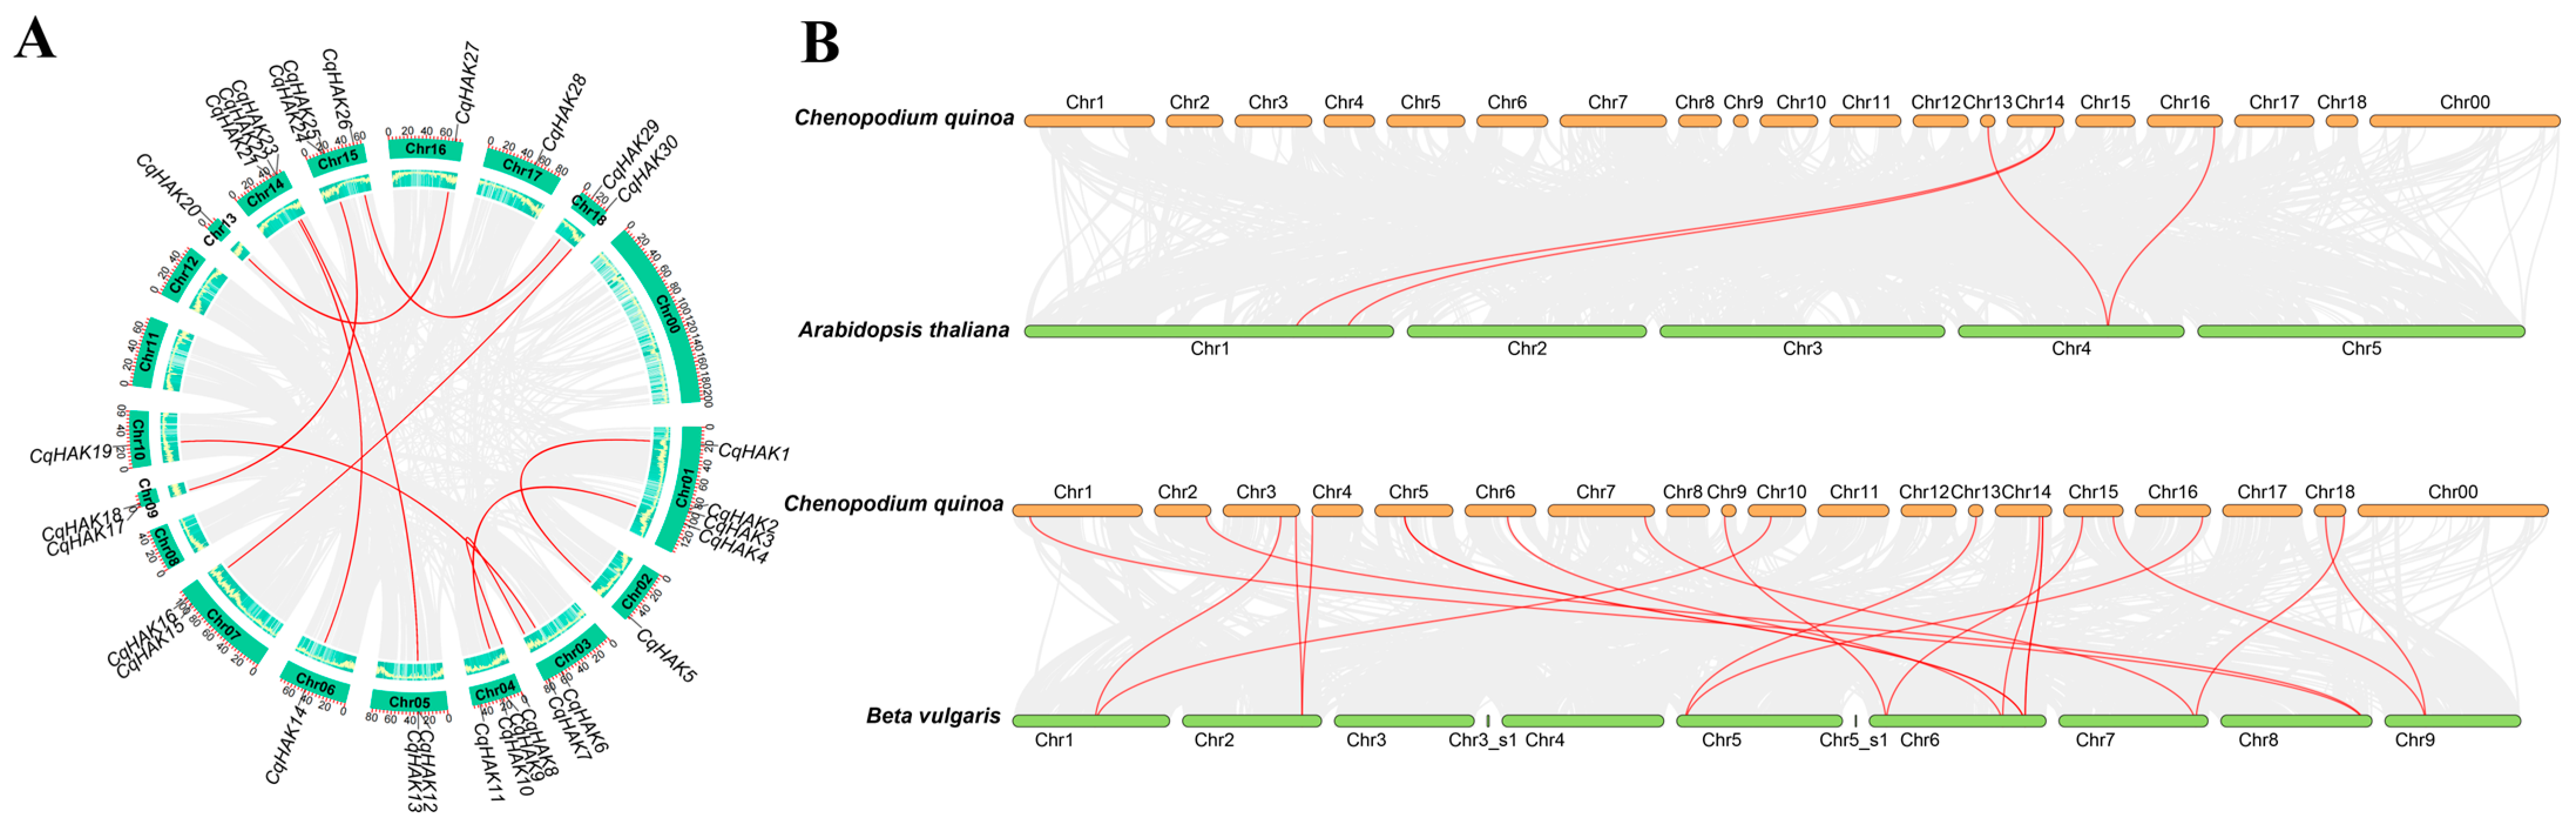
2.4. Chromosomal Distribution and Synteny Analysis of the CqHAK Genes

The genomic distribution of the HAK genes in quinoa was identified by mapping the ORFs of all determined genes onto their corresponding chromosome (Figure 3A). The distribution of the HAK genes in the quinoa chromosomes was uneven, with no genes identified on chr00, chr8, chr11, nor chr12. Chr1 and chr4 had the highest gene count, containing four genes. Chr14 and chr15 each contained three genes, while chr3, chr5, chr7, chr9, and chr18 each contained two genes. Chr2, chr6, chr10, chr13, chr16, and chr17 had only one gene distributed.
A synteny analysis was conducted to further explore the duplication event that occurred in the CqHAK gene family. There were 22 CqHAKs with a collinear relationship (Figure 3A). Only two pairs of tandem repeat events, CqHAK17/CqHAK18 and CqHAK24/CqHAK25 were found in the quinoa genome. In addition, 13 segmental duplication events involving 20 CqHAK genes were identified (Table S2). Notably, four and 18 orthologous pairs were found between quinoa and A. thaliana, quinoa and B. vulgaris, respectively (Figure 3B). These genes may play an irreplaceable role in the evolution of the HAK family. The nonsynonymous (Ka) and synonymous (Ks) substitution rates were calculated to investigate the evolutionary selection pressure in forming the HAK gene family. The Ka/Ks ratios of 33 HAK gene pairs were analyzed to compare Cq-Cq, Cq-At, and Cq-Bv (Figure S1, Table S3). All gene pairs’ Ka/Ks ratios were below 1.00, suggesting that the HAK genes may have experienced significant purification selection pressure throughout the quinoa evolution.

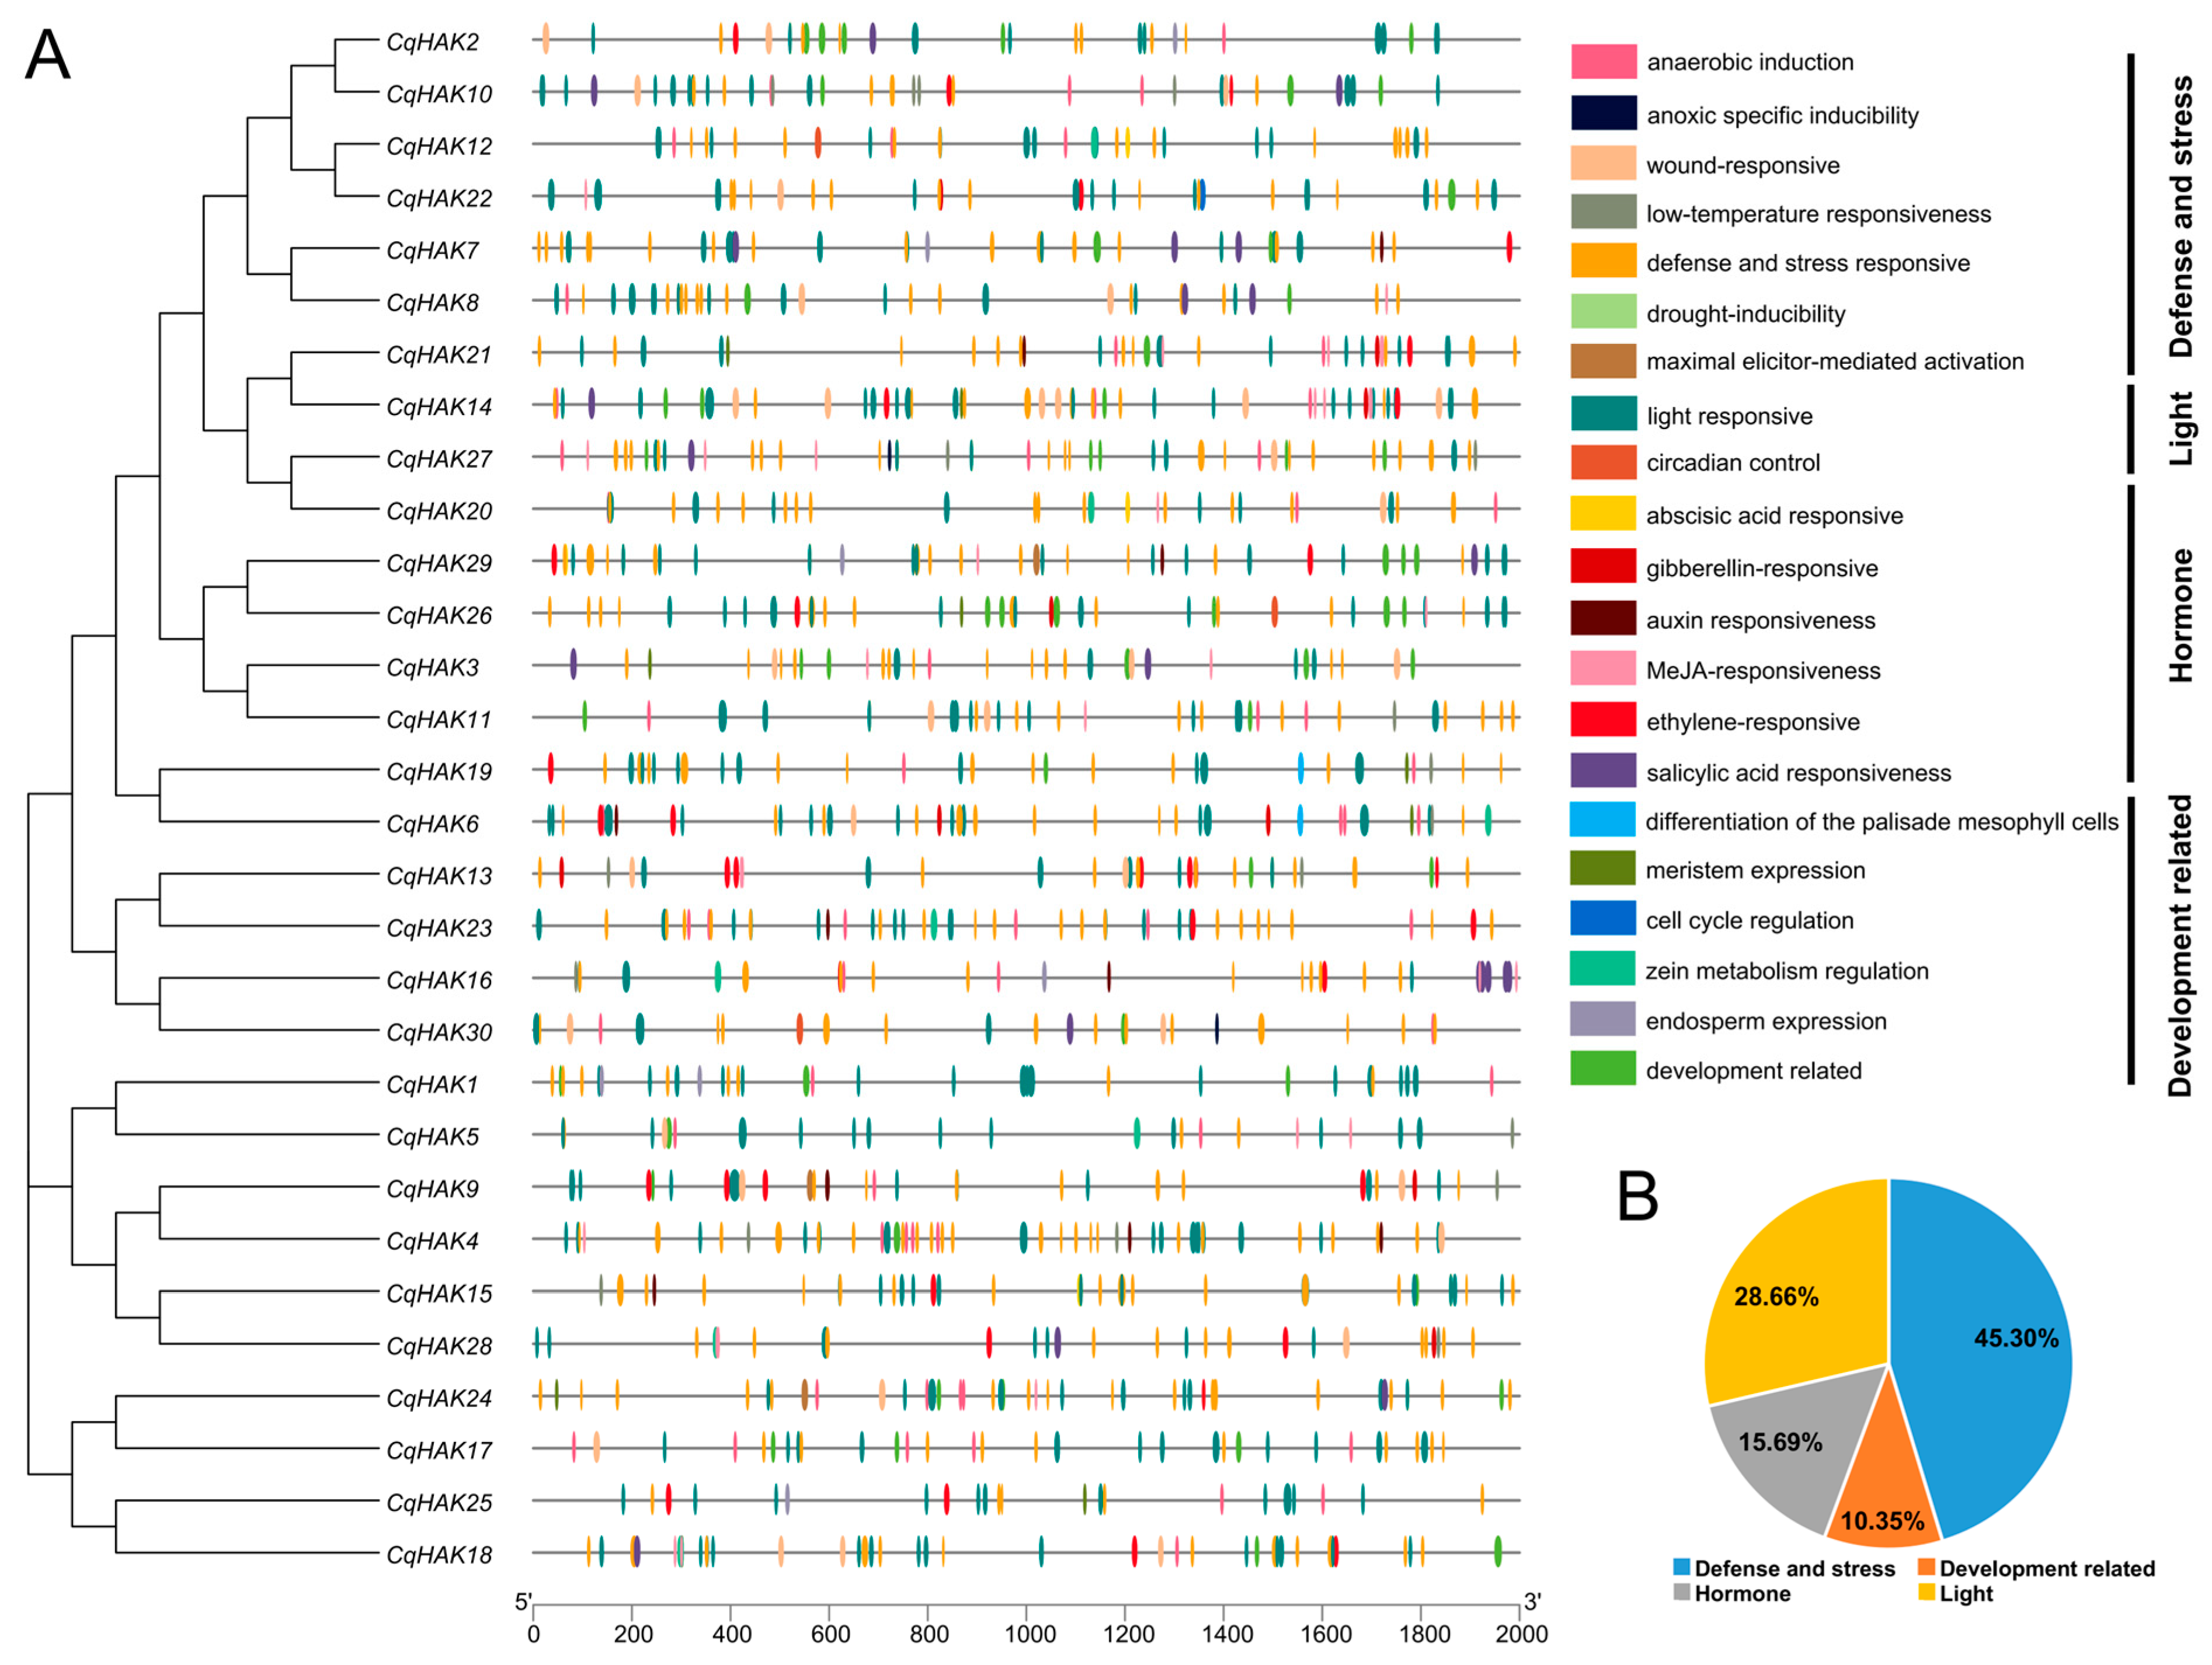
2.5. Cis-Regulatory Elements Analysis of the CqHAK Genes

To elucidate the signal transduction pathway of CqHAKs, we searched the 2 kb upstream sequences of the CqHAK genes for candidate cis-element analysis. A total of 1256 cis-acting elements were determined. Based on their functional annotations, these cis-elements could be categorized into four groups: (1) those associated with defense and stress (e.g., low-temperature, drought, wounding, and hypoxia); (2) those related to development (e.g., endosperm, meristem, palisade mesophyll cells, and cell cycle regulation); (3) those involved in the responses to plant hormones (e.g., ABA, MeJA, GA, auxin, salicylic acid, and ethylene); and (4) light-responsive element (Figure 4A). The most frequent cis-element in the promoters of the CqHAK genes were associated with defense and stress (Figure 4B).

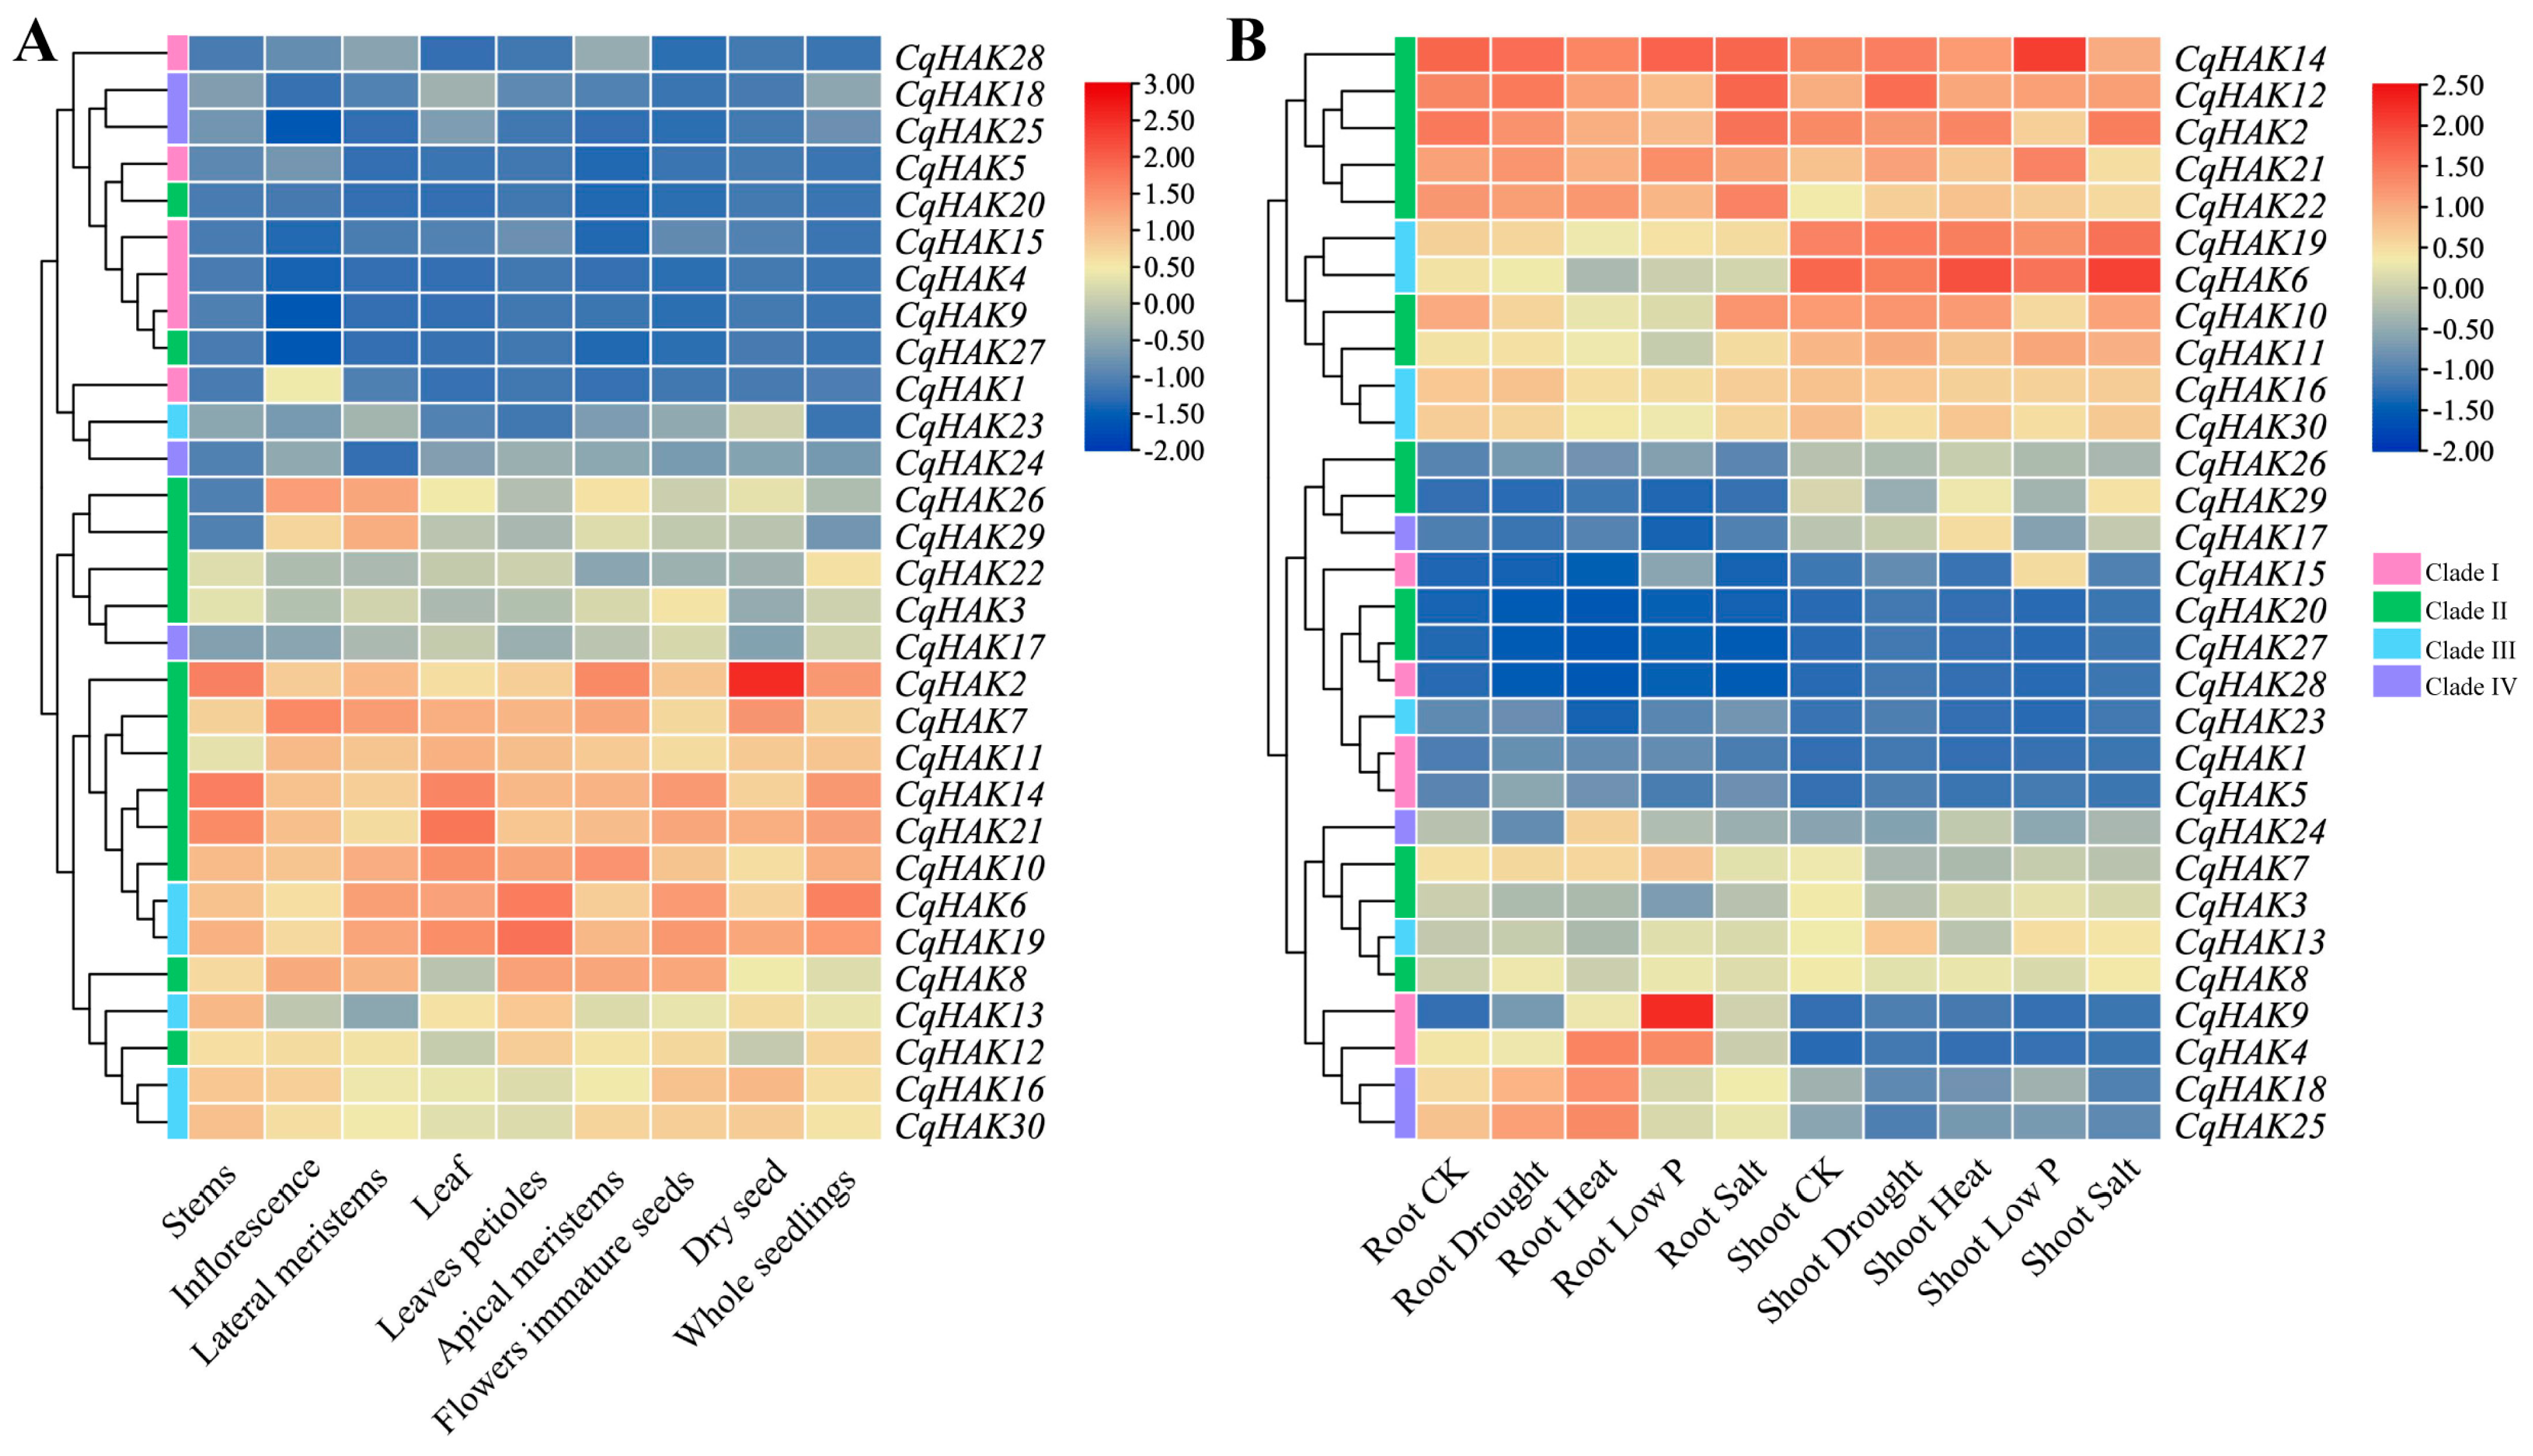
2.6. Expression Pattern Analysis of the CqHAK Genes in Various Tissues and under Abiotic Stresses

We analyzed the expression patterns of the CqHAK genes in different tissues using publicly available transcriptome data (Figure 5A, Table S4). Certain CqHAK genes showed similar expression patterns, while others displayed significant tissue-specific expression patterns, indicating the functional divergence of CqHAKs among different tissues during different developmental stages. Minimal expression levels of CqHAK4, CqHAK9, CqHAK15, CqHAK20, CqHAK25, and CqHAK27 were observed across various tissues. The consistently high expression of CqHAK2, CqHAK6, CqHAK7, CqHAK10, CqHAK14, CqHAK19 and CqHAK21 were observed in all tissues. Certain genes exhibit tissue specificity. For instance, CqHAK1 is predominantly expressed in inflorescence. A number of gene pairs (7/11) with high collinearity exhibited similar expression patterns, including CqHAK1/CqHAK5, CqHAK4/CqHAK9, CqHAK6/CqHAK19, CqHAK14/CqHAK21, CqHAK16/CqHAK30, CqHAK20/CqHAK27, and CqHAK26/CqHAK29 (Figure 5A).
The expression levels of the CqHAK genes in both root and shoot apices under drought, heat, low phosphorus, and salt stresses were also evaluated (Figure 5B, Table S5). The expression changes of CqHAKs were more sensitive in roots in response to abiotic stress than that in shoot apices. CqHAK20, 27, and 28 were expressed at deficient levels in all treatments. In contrast, CqHAK2, 12, 14, 21, and 22 exhibited consistently high expression levels under all abiotic stresses. Notably, CqHAK9 was induced in response to different stress treatments in quinoa roots.

2.7. Validation of the Expression Profiles of the HAK Genes under Salt and Alkali Stress by Quantitative RT-PCR (qRT-PCR)

The transcript levels of 25 selected CqHAKs in the roots and leaves of the quinoa seedlings exposed to salt stress and alkali stress were measured using qRT-PCR. The results showed that the CqHAK members were expressed in diverse levels and patterns.
Upon salt treatment, the expression of CqHAK13 and CqHAK19 was observed to be dramatically induced in leaves at 1 day after treatment (DAT), and the expression of CqHAK20 was observed to be dramatically induced in leaf at 5 DAT (Figure 6A). Only CqHAK9 was found to be induced up to 5 fold in root at 5 DAT(Figure 6B). Upon alkali treatment, the expression of CqHAK1, CqHAK13, CqHAK19, and CqHAK20 was observed to be dramatically induced in leaves at 1 DAT (Figure 6A). Notably, CqHAK6 (4.3-fold) and CqHAK29 (4-fold) were significantly induced in the roots at 1 DAT, and CqHAK9 (37-fold), CqHAK13 (5-fold), and CqHAK23 (4.3-fold) were significantly induced in root at 5 DAT (Figure 6B).

3. Discussion

The HAK family of the K+ transporters have been extensively studied for its role in K+ transport across membrane in bacteria, fungi, and plants [11]. HAK plays a significant role in catalyzing K+ acquisition and uptake, and maintaining plant cation homeostasis, thereby contributing to plant growth and development [23,24,25]. In this study, 30 HAK family members were identified in the quinoa genome. This family has been found in different plant species: 6 HAK genes in Amborella trichopoda,13 AtHAK in Arabidopsis, 27 OsHAK in rice, 40 BnHAK in Brassica napus [26] and 56 TaHAK in wheat Triticum aestivum [27]. The numbers of the HAK genes vary among different plant species, which could be due to ancient whole-genome duplication (WGD), segmental duplication (SD) and tandem duplication (TD) [28,29]. Quinoa experienced a WGD of approximately 4.3 Mya [30], which may contribute to the rapid gene expansion of the CqHAK family. Additionally, we identified four CqHAK genes clustered into two tandem duplication events and ten segmental duplication events (Table S2). Intraspecies duplication events (SD, 13.33%; TD, 66.67%) were the main contributors to quinoa’s rapid gene expansion of the HAK family. These findings suggest that CqHAKs underwent species-specific expansion during long-term evolution.
After identifying the conserved domains, all CqHAK members were confirmed to contain HAK domains. Consistent with the findings in other plant species, the CqHAK proteins are highly conserved in the length of amino acid. Previous study has indicated that the AtHAK and OsHAK members could be classified into four clusters (clusters I to IV) [31]. Based on these criteria, CqHAKs were also classified into the same four groups (Figure 1), indicating that the taxonomy and evolution of the HAK gene family were highly conserved among different plant species.
Gene structure (intron–exon structure) is a typical evolutionary marker in gene families [32,33]. The HAK gene family exhibited a low degree of conservation in terms of intron–exon structure. The coding sequences of all CqHAK genes are disrupted by introns, with the number of introns ranging from three to twelve, suggesting that the gene structure in quinoa is more diverse than that in other model plants, such as Arabidopsis, which typically have five to nine introns [34], and rice, which typically have one to nine introns within the HAK genes [31]. Only four (4/11) homologous CqHAK gene pairs shared a similar gene structure; CqHAK12/CqHAK22 had six introns, while CqHAK14/CqHAK21 and CqHAK26/CqHAK29 contained eight introns each, and CqHAK16/CqHAK30 had nine introns. (Figure 2, Table 1). This phenomenon indicates that intron acquisition or loss may have occurred in the HAK gene family during evolution, leading to the emergence of homologous genes with diverse structures.
Cis-acting regulatory elements play a pivotal role in transcriptional regulation in various biological processes [35] and are significant for plant defense against different biotic and abiotic stresses [36]. In this study, the most frequent predicted cis-elements in the promoters of the CqHAK genes were associated with defense and stress responses, such as BOX4 (light-responsive), ABRE (abscisic acid-responsive), ARE (anaerobic induction), TGACG and TGACG (MeJA-responsive), and STRE (stress-responsive) (Figure 4B). These cis-elements may play important roles in regulating expression of genes in response to these biotic and abiotic stresses.
The expression pattern can be closely associated with gene function. Our study revealed that the expression levels of most of the CqHAK genes in Clade I and Clade IV were relatively low across in all the organs and under diverse abiotic stress treatments. In contrast, most of the CqHAK genes in Clade II and Clade III showed higher expression levels in all test tissues (Figure 5). Similar results were observed in rice [31], Arabidopsis [34], wheat [27], and Saccharum [29].
Soil saline-alkalization has emerged as a significant and escalating global issue [37]. The extensive abiotic stressor severely hampers crop production and threatens agriculture and food security worldwide [38,39]. Quinoa is an excellent pseudocereal for utilization in saline–alkaline environments due to its inherent resistance to salt and alkali. However, the mechanism underlying its salt and alkali tolerance still needs to be better understood. Compared to saline stress, alkaline stress has been found to cause more severe disruptions in trophic ion regulation, osmotic balance, antioxidant defense systems, and plant growth [40]. Alkaline stress has a more substantial effect on K+/Na+ homeostasis than saline stress in many plants. The K+ concentration is related to regulating osmosis, membrane potential, and enzyme activity in plants [7]. Previous studies have demonstrated that the HAK family members AtHAK5, AtKUP7 and OsHAK1 mediated K+ acquisition, thereby enhancing high-affinity K+ uptake in Arabidopsis and rice [11,12,13,41,42,43].
This study showed that some CqHAKs were affected by saline and alkali stresses. For instance, CqHAK9 was induced in leaf of quinoa upon alkali treatments; CqHAK1, CqHAK13, CqHAK19, and CqHAK20 were induced in leaf of quinoa upon both salt and alkali treatments; CqHAK6, CqHAK9, CqHAK13, CqHAK23, and CqHAK29 were induced in the roots of quinoa upon alkali treatment; and CqHAK13 was induced upon both salt and alkali treatment in both leaf and root of quinoa. These results suggested that these genes may play important but distinct roles in quinoa in response to saline and alkali stresses. Further research would be required to elucidate the precise role of the CqHAK genes in quinoa.

4. Summary

In summary, 30 HAK genes were identified in C. quinoa. Phylogenetic analysis indicated that these HAK proteins were classified into four groups. The CqHAK gene family was investigated by evaluating the gene structure, chromosomal distribution, synteny, cis-acting regulatory element, and expression patterns. The expression of the CqHAK genes varies in different tissues and upon abiotic treatments. qRT-PCR further verified that the expression profiles of CqHAKs. Specifically, CqHAK13 was the only gene which highly induced under saline and alkaline treatment both in leaf and root of quinoa. Upon saline condition, four genes (CqHAK1, CqHAK13, CqHAK19, and CqHAK20) were dramatically induced in leaf; under alkaline condition, five genes in leaf (CqHAK1, CqHAK9, CqHAK13, CqHAK19, and CqHAK20) and five genes in root (CqHAK6, CqHAK9, CqHAK13, CqHAK23, and CqHAK29) were significantly induced. Our results offer essential insights into the HAK family in quinoa, providing a solid foundation for future investigation of the functions of HAKs in quinoa.

5. Materials and Methods

5.1. Identification of HAK Family Members in Quinoa

The genomic data of C. quinoa (Cq P1614886 genome V1 pseudomolecule) were obtained from the website (https://www.cbrc.kaust.edu.sa/chenopodiumdb/ (accessed on 29 August 2022)) [21]. Firstly, we conducted two BLASTp searches with a score value ≥ 100 and an E-value ≤ 1–10 using the deduced amino acid sequences of Arabidopsis [44] and rice [31] to pre-screen the candidate HAK protein sequences. Arabidopsis and rice HAK gene sequences were obtained from the Plant TAIR database (https://www.arabidopsis.org/ (accessed on 29 August 2022)) and the Ensembl Plants database (http://plants.ensembl.org/ (accessed on 29 August 2022). Subsequently, the pre-screened biomolecular structure was submitted to the NCBI-Swiss-Prot database (http://plants.ensembl.org/ (accessed on 29 August 2022)) for homology comparison, eliminating the closed-source sequences of quinoa HAKs and retaining the non-redundant protein sequences. Finally, the putative HAK sequences were submitted to InterProScan (https://www.ebi.ac.uk/interpro/search/sequence-search (accessed on 29 August 2022)), CDD v3.19 (https://www.ncbi.nlm.nih.gov/Structure/bwrpsb/bwrpsb.cgi (accessed on 29 August 2022)), Pfam (https://pfam.xfam.org/ (accessed on 29 August 2022)), and SMART v9.0 (http://smart.embl-heidelberg.de/ (accessed on 29 August 2022)) to verify the accuracy of the candidate genes. All predicted protein sequences were manually curated using the FGENESH at Softberry website (http://linux1.softberry.com/berry.phtm (accessed on 29 August 2022)). A total of 30 CqHAK genes were identified and assigned locations on the chromosome.

5.2. Analyses of Sequence, Conserved Motif and Structural Characterization

The fundamental physical and chemical properties of the CqHAK protein sequences were predicted utilizing the ExPASy tool (https://web.expasy.org/compute_pi/ (accessed on 23 December 2022)), including amino acid numbers, isoelectric point and hydrophobicity. The subcellular location of the CqHAK proteins were predicted using the Softberry website. The conserved motifs in the CqHAK proteins were determined and compared to assess the difference using the MEME program v5.5.0 (http://meme-suite.org/tools/meme (accessed on 23 December 2022)) [45]. Sequence structures, including exon–intron positions and conserved motifs, were visualized using TBtools software v2.019 [46].

5.3. Analyses of Phylogenetic Relationship

The HAK protein sequences of A. thaliana, O. sativa, and B. vulgaris were acquired from Phytozome (https://phytozome-next.jgi.doe.gov/ (accessed on 29 August 2022)). Multiple sequence alignment and phylogenetic analyses were performed using TBtools [46]. The unrooted phylogenetic tree was generated using the IQ-tree v1.6.12 [47], with 1000 bootstrap replicates and default parameters.

5.4. Analysis of Chromosome Locations and Collinearity

The position information of the HAK genes was extracted from the GFF annotation file. TBtools was implemented to visualize the chromosome locations of each gene. The collinearity blocks of the CqHAKs genes in the entire genome were identified using MCSCAN (Python version) [48]. Interspecific synteny relationships (C. quinoa and A. thaliana, C. quinoa, and B. vulgaris) were analyzed and mapped using the Dual Synteny Plotter in TBtools. The substitution rates of synonymous (Ks) and nonsynonymous (Ka) were evaluated utilizing TBtools.

5.5. Analysis of Expression Level of HAK Genes

The expression data for various tissues and organs of quinoa (No: PRJNA394651) and different treatments (drought, heat, salt, and low P) (No: PRJNA306026) were obtained from the NCBI BioProject database (www.ncbi.nlm.nih.gov/bioproject (accessed on 28 January 2023)). The control condition (CK) involved cultivation in well-watered soil at a temperature of 20 °C with a 12 h daily light for three weeks. For the heat treatment, the plants were then grown in 12 h light at 37 °C and 12 h dark at 32 °C for one week. The salt treatment involved the use of a 300 mM NaCl solution under hydroponic conditions. The drought treatment entailed withholding water for one week under a temperature of 20 °C and a 12 h daily light. The low phosphorus condition involved cultivation in a medium lacking KH2PO4. All treatments were carried out for one week. At the end of the cultivation period, root and shoot tissues were harvested and stored in liquid nitrogen for subsequent RNA extraction, and three independent replicates were conducted for each treatment. The data were mapped individually to the C. quinoa genome using HISAT2 v2.2.1 (https://github.com/DaehwanKimLab/hisat2 (accessed on 29 August 2023)) [49] with the default parameters. Transcript abundance and differential gene expression were estimated using Cufflink v2.2.1 (https://github.com/cole-trapnell-lab/cufflinks (accessed on 29 August 2023)). The expression levels of the CqHAK genes were determined as fragments per kilobase of exon model per million mapped reads (FPKM). A heatmap was generated using TBtools with log2(FPKM + 1).

5.6. Plant Materials and Treatments

Quinoa seeds (“Jiaqi 744,” obtained from Shanxi Nonggu Jiaqi Seed Industry Co., Ltd., Shanxi, China, http://jqseeds.com/ (accessed on 7 June 2022)) were germinated in the soil until they reached the four-leaf stage, after which they were transferred to a 1/2 Hoagland nutrient solution. Quinoa seedlings were planted in a growth chamber with a photoperiod of 14 h per day and a temperature of 25 ± 1 °C. Upon the full expansion of the eighth leaf, seedlings were transferred to three different culture media: 1/2 Hogland nutrient solution (CK), and 1/2 Hogland nutrient solution supplemented with 300 mM NaCl, and 40 mM of an alkali solution (Na2CO3 and NaHCO3 mixture, with mole ratio = 1:2, pH = 9.38), respectively. The roots and leaves were collected for each treatment at 1 and 5 days. The samples were immediately frozen in liquid nitrogen and stored at −80 ℃ for subsequent analysis.

5.7. RNA Extraction, Analysis of the Gene Expression by RT-qPCR, and Correlation Analyses

Total RNA was extracted utilizing the Trizol method (Trizol, TransGen Biotech, Beijing, China), and the first cDNA strand was synthesized utilizing a cDNA first-strand synthesis kit (HiScript® II 1st Strand cDNA Synthesis Kit, R211, Vazyme Biotech, Nanjing, China). The RT-qPCR reaction was conducted using CFX Connecte Thermal Cycler Real-Time PCR system (Bio-Rad, Hercules, CA, USA) with the ChamQ Universal SYBR qPCR Master Mix (Q711, Vazyme Biotech, Nanjing, China). CqTUB-9 was utilized as an internal reference gene. The primer sequences utilized in this study are presented in Table S1. The reaction system is 10 μL: 1 μL cDNA, 0.5 μL of the upstream and downstream primers, 5 μL of SYBR, and 3 μL of ddH2O. The reaction program is as follows: 95 °C pre-denaturation for 30 s, 95 °C denaturation for 5 s, and 60 °C annealing for 30 s, 40 cycles, repeat 3 times. After the reaction, the fluorescence value change curve and melting curve are analyzed. The relative expression levels of genes were computed utilizing the 2−ΔΔCt method.

Supplementary Materials

The following supporting information can be downloaded at: https://www.mdpi.com/article/10.3390/plants12213747/s1, Figure S1: The sequence information of 10 conserved motifs of the HAK genes in quinoa, including the sequence logo and amino acids and the amino acid numbers of each motif; Figure S2: The Ka/Ks values of the HAK gene pairs for Cq-At, Cq-Cq, and Cq-Bv. Table S1: Details of the HAK genes from Arabidopsis, rice and Beta vulgaris; Table S2: Segmentally and tandemly duplicated CqHAK gene pairs; Table S3: The synteny gene pairs of C. quinoa, A. thaliana, and B. vulgaris as well as the Ka/Ks of comparative synteny gene pairs; Table S4: Detailed information on the expression levels (FPKM) of CqHAK genes retrieved from transcriptome data for C. quinoa; Table S5: Detailed information on the available expression levels (FPKM) of CqHAK genes response to various stress treatments retrieved from transcriptome data for C. quinoa; Table S6: Primers used in this study.

Author Contributions

Conceptualization, Y.C., S.C. and Z.W.; methodology, Y.C.; Y.L. and Z.L.; software, Y.C. and Y.L.; validation, S.C. and Z.W.; formal analysis, Y.C. and Y.L.; investigation, Z.W. and S.Z.; resources, Y.C and Z.L.; data curation, S.Z., Y.C. and Z.W.; writing—original draft preparation, Y.C. and Z.L.; writing—review and editing, Y.C., S.C and Z.W.; visualization, Z.W. and S.C; supervision, Z.W. and S.C.; project administration, Z.W.; funding acquisition, Z.L., Y.C. and Z.W. All authors have read and agreed to the published version of the manuscript.

Funding

This research was funded by the Science and Technology Project of Fuzhou Institute of Oceanography, grant number 2021F01; Natural Science Foundation of Fujian Province, grant number 2022J05103 and Fuzhou Science and Technology Bure, grant number 2022-P-007.

Data Availability Statement

Data are available in the manuscript and in the Supplementary Materials.

Conflicts of Interest

The authors declare no conflict of interest.

References

  1. Leigh, R.A.; Wyn Jones, R.G. A hypothesis relating critical potassium concentrations for growth to the distribution and functions of this ion in the plant cell. New Phytol. 1984, 97, 1–13. [Google Scholar] [CrossRef]
  2. Hu, W.; Yang, J.; Meng, Y.; Wang, Y.; Chen, B.; Zhao, W.; Oosterhuis, D.M.; Zhou, Z.J. Potassium application affects carbohydrate metabolism in the leaf subtending the cotton (Gossypium hirsutum L.) boll and its relationship with boll biomass. Field Crops Res. 2015, 179, 120–131. [Google Scholar] [CrossRef]
  3. Ye, T.; Li, Y.; Zhang, J.; Hou, W.; Zhou, W.; Lu, J.; Xing, Y.; Li, X. Nitrogen, phosphorus, and potassium fertilization affects the flowering time of rice (Oryza sativa L.). Glob. Ecol. Conserv. 2019, 20, e00753. [Google Scholar] [CrossRef]
  4. Chambi-Legoas, R.; Chaix, G.; Castro, V.R.; Franco, M.P.; Tomazello-Filho, M.J. Inter-annual effects of potassium/sodium fertilization and water deficit on wood quality of Eucalyptus grandis trees over a full rotation. For. Ecol. Manag. 2021, 496, 119415. [Google Scholar] [CrossRef]
  5. Ali, M.M.; Petropoulos, S.A.; Selim, D.A.; Elbagory, M.; Othman, M.M.; Omara, A.E.; Mohamed, M.H. Plant growth, yield and quality of potato crop in relation to potassium fertilization. Agronomy 2021, 11, 675. [Google Scholar] [CrossRef]
  6. Wang, M.; Zheng, Q.; Shen, Q.; Guo, S.J. The critical role of potassium in plant stress response. Int. J. Mol. Sci. 2013, 14, 7370–7390. [Google Scholar] [CrossRef]
  7. Hasanuzzaman, M.; Bhuyan, M.B.; Nahar, K.; Hossain, M.S.; Mahmud, J.A.; Hossen, M.S.; Masud, A.A.; Moumita; Fujita, M.J. Potassium: A vital regulator of plant responses and tolerance to abiotic stresses. Agronomy 2018, 8, 31. [Google Scholar] [CrossRef]
  8. Wang, Y.; Wu, W.H. Regulation of potassium transport and signaling in plants. Curr. Opin. Plant Biol. 2017, 39, 123–128. [Google Scholar] [CrossRef]
  9. Wang, Y.; Chen, Y.F.; Wu, W.H. Potassium and phosphorus transport and signaling in plants. J. Integr. Plant Biol. 2021, 63, 34–52. [Google Scholar] [CrossRef]
  10. Corratgé-Faillie, C.; Jabnoune, M.; Zimmermann, S.; Véry, A.A.; Fizames, C.; Sentenac, H.J. Potassium and sodium transport in non-animal cells: The Trk/Ktr/HKT transporter family. Cell. Mol. Life Sci. 2010, 67, 2511–2532. [Google Scholar] [CrossRef]
  11. Li, W.; Xu, G.; Alli, A.; Yu, L. Plant HAK/KUP/KT K+ transporters: Function and regulation. Semin. Cell Dev. Biol. 2018, 74, 133–141. [Google Scholar] [CrossRef]
  12. Gierth, M.; Mäser, P.; Schroeder, J.I. The potassium transporter AtHAK5 functions in K+ deprivation-induced high-affinity K+ uptake and AKT1 K+ channel contribution to K+ uptake kinetics in Arabidopsis roots. Plant Physiol. 2005, 137, 1105–1114. [Google Scholar] [CrossRef] [PubMed]
  13. Han, M.; Wu, W.; Wu, W.H.; Wang, Y. Potassium transporter KUP7 is involved in K+ acquisition and translocation in Arabidopsis root under K+-limited conditions. Mol. Plant 2016, 9, 437–446. [Google Scholar] [CrossRef] [PubMed]
  14. Yang, T.; Zhang, S.; Hu, Y.; Wu, F.; Hu, Q.; Chen, G.; Cai, J.; Wu, T.; Moran, N.; Yu, L.J. The role of a potassium transporter OsHAK5 in potassium acquisition and transport from roots to shoots in rice at low potassium supply levels. Plant Physiol. 2014, 166, 945–959. [Google Scholar] [CrossRef] [PubMed]
  15. Chen, G.; Hu, Q.; Luo, L.; Yang, T.; Zhang, S.; Hu, Y.; Yu, L.; Xu, G.J. Rice potassium transporter OsHAK1 is essential for maintaining potassium-mediated growth and functions in salt tolerance over low and high potassium concentration ranges. Plant Cell Environ. 2015, 38, 2747–2765. [Google Scholar] [CrossRef]
  16. Chen, G.; Liu, C.; Gao, Z.; Zhang, Y.; Jiang, H.; Zhu, L.; Ren, D.; Yu, L.; Xu, G.; Qian, Q.J. OsHAK1, a high-affinity potassium transporter, positively regulates responses to drought stress in rice. Front. Plant Sci. 2017, 8, 1885. [Google Scholar] [CrossRef]
  17. Zhang, M.; Liang, X.; Wang, L.; Cao, Y.; Song, W.; Shi, J.; Lai, J.; Jiang, C.J. A HAK family Na+ transporter confers natural variation of salt tolerance in maize. Nat. Plants 2019, 5, 1297–1308. [Google Scholar] [CrossRef]
  18. Elumalai, R.P.; Nagpal, P.; Reed, J.W. A mutation in the Arabidopsis KT2/KUP2 potassium transporter gene affects shoot cell expansion. Plant Cell 2002, 14, 119–131. [Google Scholar] [CrossRef]
  19. Rigas, S.; Ditengou, F.A.; Ljung, K.; Daras, G.; Tietz, O.; Palme, K.; Hatzopoulos, P.J. Root gravitropism and root hair development constitute coupled developmental responses regulated by auxin homeostasis in the Arabidopsis root apex. New Phytol. 2013, 197, 1130–1141. [Google Scholar] [CrossRef]
  20. Daras, G.; Rigas, S.; Tsitsekian, D.; Iacovides, T.A.; Hatzopoulos, P.J. Potassium transporter TRH1 subunits assemble regulating root-hair elongation autonomously from the cell fate determination pathway. Plant Sci. 2015, 231, 131–137. [Google Scholar] [CrossRef]
  21. Jarvis, D.E.; Ho, Y.S.; Lightfoot, D.J.; Schmöckel, S.M.; Li, B.; Borm, T.J.; Ohyanagi, H.; Mineta, K.; Michell, C.T.; Saber, N.J. The genome of Chenopodium quinoa. Nature 2017, 542, 307–312. [Google Scholar] [CrossRef] [PubMed]
  22. Hinojosa, L.; González, J.A.; Barrios-Masias, F.H.; Fuentes, F.; Murphy, K.M. Quinoa abiotic stress responses: A review. Plants 2018, 7, 106. [Google Scholar] [CrossRef] [PubMed]
  23. Grabov, A.J. Plant KT/KUP/HAK potassium transporters: Single family-multiple functions. Ann. Bot. 2007, 99, 1035–1041. [Google Scholar] [CrossRef] [PubMed]
  24. Shen, Y.; Shen, L.; Shen, Z.; Jing, W.; Ge, H.; Zhao, J.; Zhang, W.J. The potassium transporter OsHAK21 functions in the maintenance of ion homeostasis and tolerance to salt stress in rice. Plant Cell Environ. 2015, 38, 2766–2779. [Google Scholar] [CrossRef]
  25. Tahir, M.M.; Tong, L.; Xie, L.; Wu, T.; Ghani, M.I.; Zhang, X.; Li, S.; Gao, X.; Tariq, L.; Zhang, D.J. Identification of the HAK gene family reveals their critical response to potassium regulation during adventitious root formation in apple rootstock. Hortic. Plant J. 2023, 9, 45–59. [Google Scholar] [CrossRef]
  26. Zhou, J.; Zhou, H.J.; Chen, P.; Zhang, L.L.; Zhu, J.T.; Li, P.F.; Yang, J.; Ke, Y.Z.; Zhou, Y.H.; Li, J.N. Genome-wide survey and expression analysis of the KT/HAK/KUP family in Brassica napus and its potential roles in the response to K+ deficiency. Int. J. Mol. Sci. 2020, 21, 9487. [Google Scholar] [CrossRef]
  27. Cheng, X.; Liu, X.; Mao, W.; Zhang, X.; Chen, S.; Zhan, K.; Bi, H.; Xu, H.J. Genome-wide identification and analysis of HAK/KUP/KT potassium transporters gene family in wheat (Triticum aestivum L.). Int. J. Mol. Sci. 2018, 19, 3969. [Google Scholar] [CrossRef]
  28. Rehman, H.M.; Nawaz, M.A.; Shah, Z.H.; Daur, I.; Khatoon, S.; Yang, S.H.; Chung, G.J. In-depth genomic and transcriptomic analysis of five K+ transporter gene families in soybean confirm their differential expression for nodulation. Front. Plant Sci. 2017, 8, 804. [Google Scholar] [CrossRef] [PubMed]
  29. Feng, X.; Wang, Y.; Zhang, N.; Wu, Z.; Zeng, Q.; Wu, J.; Wu, X.; Wang, L.; Zhang, J.; Qi, Y.J. Genome-wide systematic characterization of the HAK/KUP/KT gene family and its expression profile during plant growth and in response to low-K+ stress in Saccharum. BMC Plant Biol. 2020, 20, 20. [Google Scholar] [CrossRef]
  30. Zou, C.; Chen, A.; Xiao, L.; Muller, H.M.; Ache, P.; Haberer, G.; Zhang, M.; Jia, W.; Deng, P.; Huang, R.J. A high-quality genome assembly of quinoa provides insights into the molecular basis of salt bladder-based salinity tolerance and the exceptional nutritional value. Cell Res. 2017, 27, 1327–1340. [Google Scholar] [CrossRef]
  31. Gupta, M.; Qiu, X.; Wang, L.; Xie, W.; Zhang, C.; Xiong, L.; Lian, X.; Zhang, Q.J. Genomics. KT/HAK/KUP potassium transporters gene family and their whole-life cycle expression profile in rice (Oryza sativa). Mol. Genet. Genom. 2008, 280, 437–452. [Google Scholar] [CrossRef]
  32. Liu, J.; Chen, N.; Chen, F.; Cai, B.; Dal Santo, S.; Tornielli, G.B.; Pezzotti, M.; Cheng, Z.M. Genome-wide analysis and expression profile of the bZIP transcription factor gene family in grapevine (Vitis vinifera). BMC Genom. 2014, 15, 281. [Google Scholar] [CrossRef]
  33. Zhang, P.; Yan, H.; Liu, Y.; Chai, Y.J. Genome-wide identification and functional characterization of wheat Brassinazole-resistant transcription factors in response to abiotic stresses and stripe rust infection. Front. Plant Sci. 2023, 14, 1144379. [Google Scholar] [CrossRef] [PubMed]
  34. Ahn, S.J.; Shin, R.; Schachtman, D.P. Expression of KT/KUP genes in Arabidopsis and the role of root hairs in K+ uptake. Plant Physiol. 2004, 134, 1135–1145. [Google Scholar] [CrossRef] [PubMed]
  35. Zou, C.; Sun, K.; Mackaluso, J.D.; Seddon, A.E.; Jin, R.; Thomashow, M.F.; Shiu, S.H. Cis-regulatory code of stress-responsive transcription in Arabidopsis thaliana. Proc. Natl. Acad. Sci. USA 2011, 108, 14992–14997. [Google Scholar] [CrossRef]
  36. Zhao, W.; Liu, Y.W.; Zhou, J.M.; Zhao, S.P.; Zhang, X.H.; Min, D.H. Genome-wide analysis of the lectin receptor-like kinase family in foxtail millet (Setaria italica L.). Plant Cell Tissue Organ Cult. 2016, 127, 335–346. [Google Scholar] [CrossRef]
  37. Shabala, S.J. Learning from halophytes: Physiological basis and strategies to improve abiotic stress tolerance in crops. Ann. Bot. 2013, 112, 1209–1221. [Google Scholar] [CrossRef]
  38. Bartels, D.; Sunkar, R.J. Drought and salt tolerance in plants. Crit. Rev. Plant Sci. 2005, 24, 23–58. [Google Scholar] [CrossRef]
  39. Wang, H.; Takano, T.; Liu, S.J. Screening and evaluation of saline-alkaline tolerant germplasm of rice (Oryza sativa L.) in soda saline–alkali soil. Agronomy 2018, 8, 205. [Google Scholar] [CrossRef]
  40. Amirinejad, A.A.; Sayyari, M.; Ghanbari, F.; Kordi, S.J. Salicylic acid improves salinity-alkalinity tolerance in pepper (Capsicum annuum L.). Adv. Hortic. Sci. 2017, 31, 157–164. [Google Scholar]
  41. Li, J.; Long, Y.; Qi, G.N.; Li, J.; Xu, Z.J.; Wu, W.H.; Wang, Y. The Os-AKT1 channel is critical for K+ uptake in rice roots and is modulated by the rice CBL1-CIPK23 complex. Plant Cell 2014, 26, 3387–3402. [Google Scholar] [CrossRef] [PubMed]
  42. Qi, Z.; Hampton, C.R.; Shin, R.; Barkla, B.J.; White, P.J.; Schachtman, D.P. The high affinity K+ transporter AtHAK5 plays a physiological role in planta at very low K+ concentrations and provides a caesium uptake pathway in Arabidopsis. J. Exp. Bot. 2008, 59, 595–607. [Google Scholar] [CrossRef]
  43. Rubio, F.; Nieves-Cordones, M.; Alemán, F.; Martínez, V. Relative contribution of AtHAK5 and AtAKT1 to K+ uptake in the high-affinity range of concentrations. Physiol. Plant. 2008, 134, 598–608. [Google Scholar] [CrossRef] [PubMed]
  44. Mäser, P.; Thomine, S.; Schroeder, J.I.; Ward, J.M.; Hirschi, K.; Sze, H.; Talke, I.N.; Amtmann, A.; Maathuis, F.J.; Sanders, D.J. Phylogenetic relationships within cation transporter families of Arabidopsis. Plant Physiol. 2001, 126, 1646–1667. [Google Scholar] [CrossRef]
  45. Bailey, T.L.; Boden, M.; Buske, F.A.; Frith, M.; Grant, C.E.; Clementi, L.; Ren, J.; Li, W.W.; Noble, W.S. MEME SUITE: Tools for motif discovery and searching. Nucleic Acids Res. 2009, 37, W202–W208. [Google Scholar] [CrossRef]
  46. Chen, C.; Chen, H.; Zhang, Y.; Thomas, H.R.; Frank, M.H.; He, Y.; Xia, R.J. TBtools: An integrative toolkit developed for interactive analyses of big biological data. Mol. Plant 2020, 13, 1194–1202. [Google Scholar] [CrossRef] [PubMed]
  47. Nguyen, L.T.; Schmidt, H.A.; Von Haeseler, A.; Minh, B.Q. IQ-TREE: A fast and effective stochastic algorithm for estimating maximum-likelihood phylogenies. Mol. Biol. Evol. 2015, 32, 268–274. [Google Scholar] [CrossRef]
  48. Wang, Y.; Tang, H.; DeBarry, J.D.; Tan, X.; Li, J.; Wang, X.; Lee, T.h.; Jin, H.; Marler, B.; Guo, H.J. MCScanX: A toolkit for detection and evolutionary analysis of gene synteny and collinearity. Nucleic Acids Res. 2012, 40, e49. [Google Scholar] [CrossRef] [PubMed]
  49. Kim, D.; Paggi, J.M.; Park, C.; Bennett, C.; Salzberg, S.L. Graph-based genome alignment and genotyping with HISAT2 and HISAT-genotype. Nat. Biotechnol. 2019, 37, 907–915. [Google Scholar] [CrossRef]
Figure 1. Phylogenetic analysis of the HAK families in quinoa, Arabidopsis thaliana, Beta vulgaris and Oryza sativa. The phylogenetic tree was constructed using the IQ tree. Four clusters (I, II, III, IV) were labeled as red, blue, green and yellow respectively.
Plants 12 03747 g001
Figure 2. Phylogenetic relationships, gene structure, and motifs of the HAK genes in C. quinoa using TBtools. (A) The ML method constructed the phylogenetic tree based on the full-length sequences of the CqHAK proteins. (B) The motif and domain composition of the CqHAK proteins. The conserved domains and motifs were indicated on the protein sequences’ upper and lower sides, respectively. (C) Exon–intron structures of the CqHAK genes. Blue–green boxes indicate untranslated 5′- and 3′- regions, yellow boxes indicate exons, and black lines indicate introns.
Plants 12 03747 g002
Figure 3. Chromosome distributions of the HAK genes in C. quinoa using TBtools. (A) The chromosomal location and interchromosomal relationship of the HAK genes in C. quinoa. (B) Synteny analysis of the HAK genes between C. quinoa and A. thaliana, and C. quinoa and B. vulgaris. Gray lines in the background indicate the collinear blocks, and the red lines highlight the syntenic HAK gene pairs.
Plants 12 03747 g003
Figure 4. Putative cis-acting elements and transcription factor binding sites in the promoter regions of the HAK genes in C. quinoa (A), and four functional types of cis-acting elements and their proportion in all the CqHAKs genes (B).
Plants 12 03747 g004
Figure 5. Heatmap of HAK gene expression in different tissues (A) and treatments in the quinoa roots and shoots (B). CK represented as blank control group, where quinoa was grown in soil without any treatment.
Plants 12 03747 g005
Figure 6. Expression profiling of the CqHAK genes under salt (300 mM NaCl) and alkali (40 mM Na2CO3 and NaHCO3 mixture, with mole ratio = 1:2, pH = 9.38) stresses, respectively, in the quinoa roots (A) and leaves (B) at the seedling stage. The expression levels of CqTUB-9 was used to normalize the expression levels of the CqHAK genes. CK represent the treatment of quinoa seedlings with 1/2 Hogland nutrient solution. The data are the mean ± SEM of three independent biological samples, and the vertical bar represents the standard error of the mean. Lowercase letters indicated the significant difference at p  <  0.05.
Plants 12 03747 g006
Table 1. Properties of the predicted HAK proteins in C. quinoa.
NameGene IDLength (aa)IntronMolecular Weight (Da)Theoretical PISubcellular LocalizationLocation
CqHAK1AUR62021456650672,965.388.18Plasma membraneChr01: 18278493–18282659
CqHAK2AUR62042411774787,036.046.74Plasma membraneChr01: 88160907–88166983
CqHAK3AUR62040746731981,227.698.83Plasma membraneChr01: 90527306–90533106
CqHAK4AUR62028032742883,030.027.32Plasma membraneChr01: 104924582–104937024
CqHAK5AUR62010943640771,619.978.21Plasma membraneChr02: 54650085–54654440
CqHAK6AUR62034910744783,398.356.78Plasma membraneChr03: 61032690–61040255
CqHAK7AUR62012363756884,438.676.74Plasma membraneChr03: 77154455–77160490
CqHAK8AUR620314919101210,2229.376.93Plasma membraneChr04: 71229–79662
CqHAK9AUR62020693768786,037.897.88Plasma membraneChr04: 17190576–17199015
CqHAK10AUR62035954687677,129.186.48Plasma membraneChr04: 21795245–21801387
CqHAK11AUR62026895720880,136.438.96Plasma membraneChr04: 45774326–45780518
CqHAK12AUR62014006698677,969.086.91Plasma membraneChr05: 31254125–31259655
CqHAK13AUR62014007835892,889.216.22Plasma membraneChr05: 31289460–31294418
CqHAK14AUR62017474784887,191.168.7Plasma membraneChr06: 44873117–44879731
CqHAK15AUR62033186770786,317.466.4Plasma membraneChr07: 95200544–95206655
CqHAK16AUR62001622786988,068.47.88Plasma membraneChr07: 102724390–102734985
CqHAK17AUR62003489681675,594.818.66Plasma membraneChr09: 2936029–2942420
CqHAK18AUR62003490590765,465.156.1Plasma membraneChr09: 2945466–2951051
CqHAK19AUR62026619809890,741.817.88Plasma membraneChr10: 23716177–23724950
CqHAK20AUR620107726551072,550.639.17Plasma membraneChr13: 7774288–7788227
CqHAK21AUR62042858784887,071.958.56Plasma membraneChr14: 46675721–46682205
CqHAK22AUR62005353696677,683.747.08Plasma membraneChr14: 50083331–50089025
CqHAK23AUR62005354826991,509.166.43Plasma membraneChr14: 50115909–50122274
CqHAK24AUR62017798754883,549.368.45Plasma membraneChr15: 19349048–19362387
CqHAK25AUR62017799708778,514.066.52Plasma membraneChr15: 19364004–19370291
CqHAK26AUR62025122737881,976.916.92Plasma membraneChr15: 52273038–52277536
CqHAK27AUR62019774706879,121.869.15Plasma membraneChr16: 70971581–70976287
CqHAK28AUR62036631476354,185.716.8Plasma membraneChr17: 53383724–53386568
CqHAK29AUR62037170741882,669.676.92Plasma membraneChr18: 11688609–11693135
CqHAK30AUR62020155745983,356.38.66Plasma membraneChr18: 31295458–31306880
Disclaimer/Publisher’s Note: The statements, opinions and data contained in all publications are solely those of the individual author(s) and contributor(s) and not of MDPI and/or the editor(s). MDPI and/or the editor(s) disclaim responsibility for any injury to people or property resulting from any ideas, methods, instructions or products referred to in the content.

