
An Inverse Scaling Relationship between Stomatal Density and Mean Nearest Neighbor Distance: Evidence from a Photinia Hybrid and One of Its Parents


Abstract
:1. Introduction
2. Materials and Methods
2.1. Sampling Site
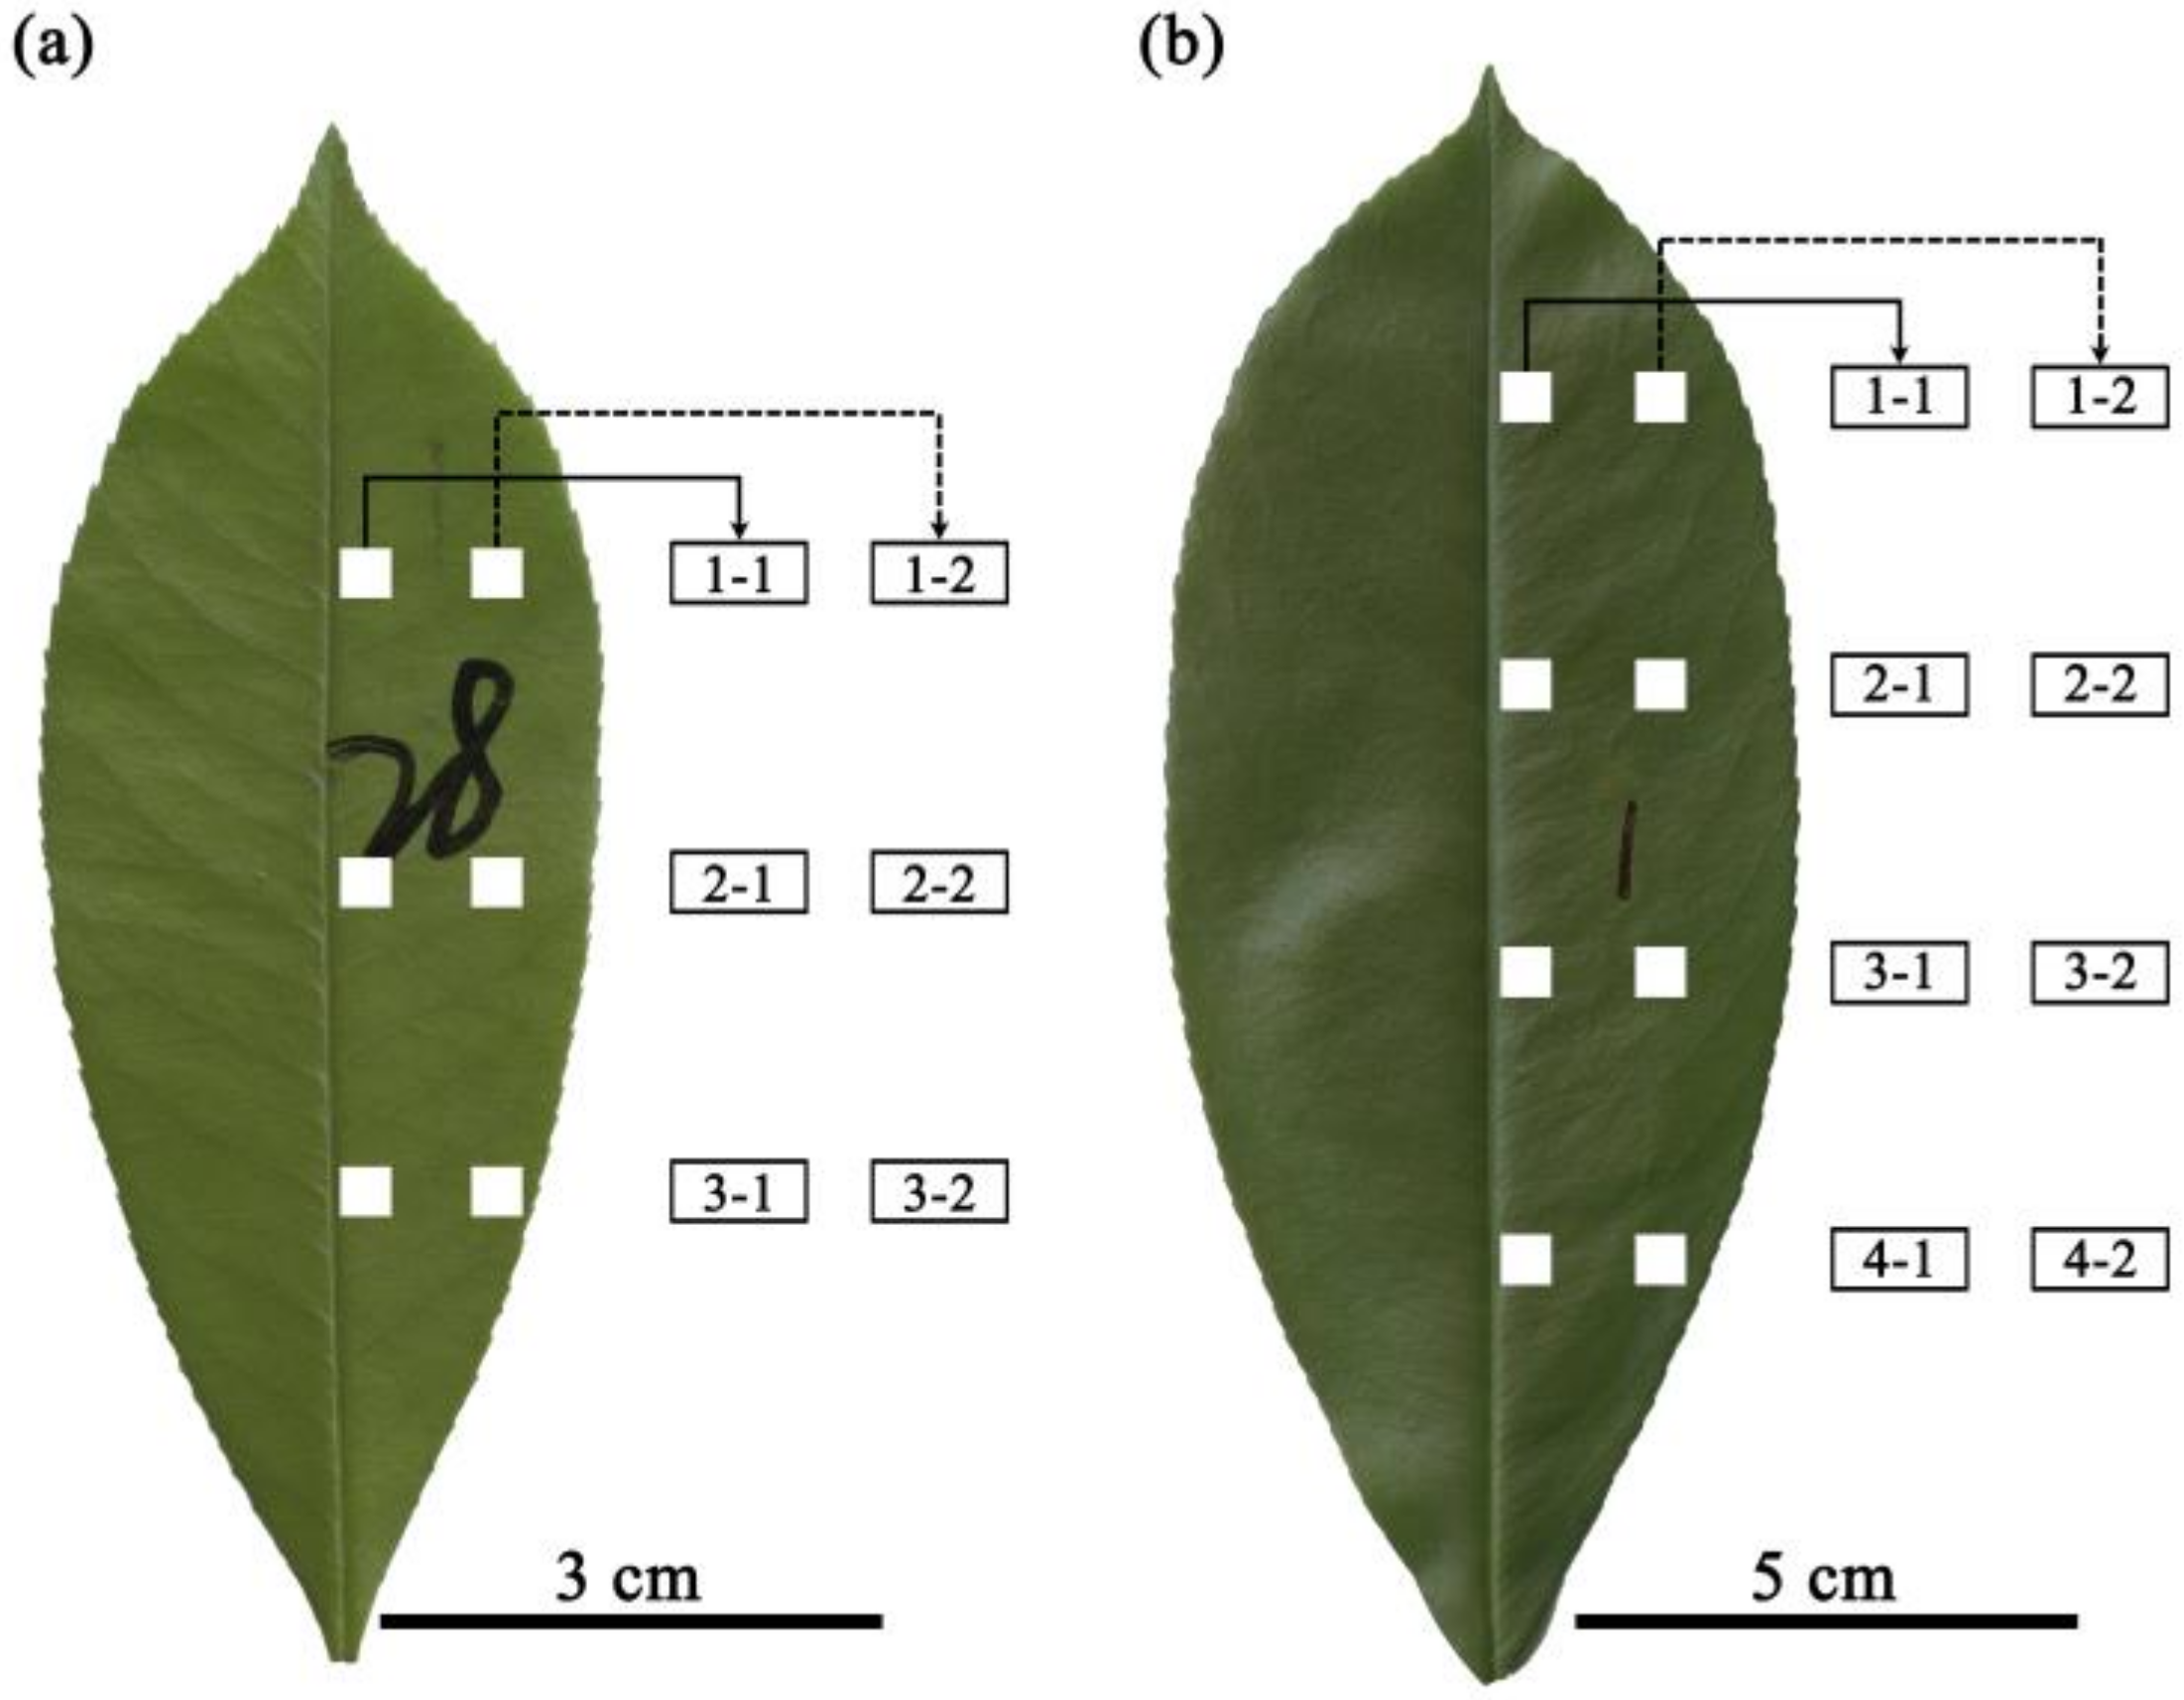
2.2. Lamina Section Sampling
2.3. Extraction of Stomata and Planar Coordinates of Stomatal Centers
2.4. Calculation of Stomatal Density and Mean Nearest Neighbor Distance
2.5. Data Analysis
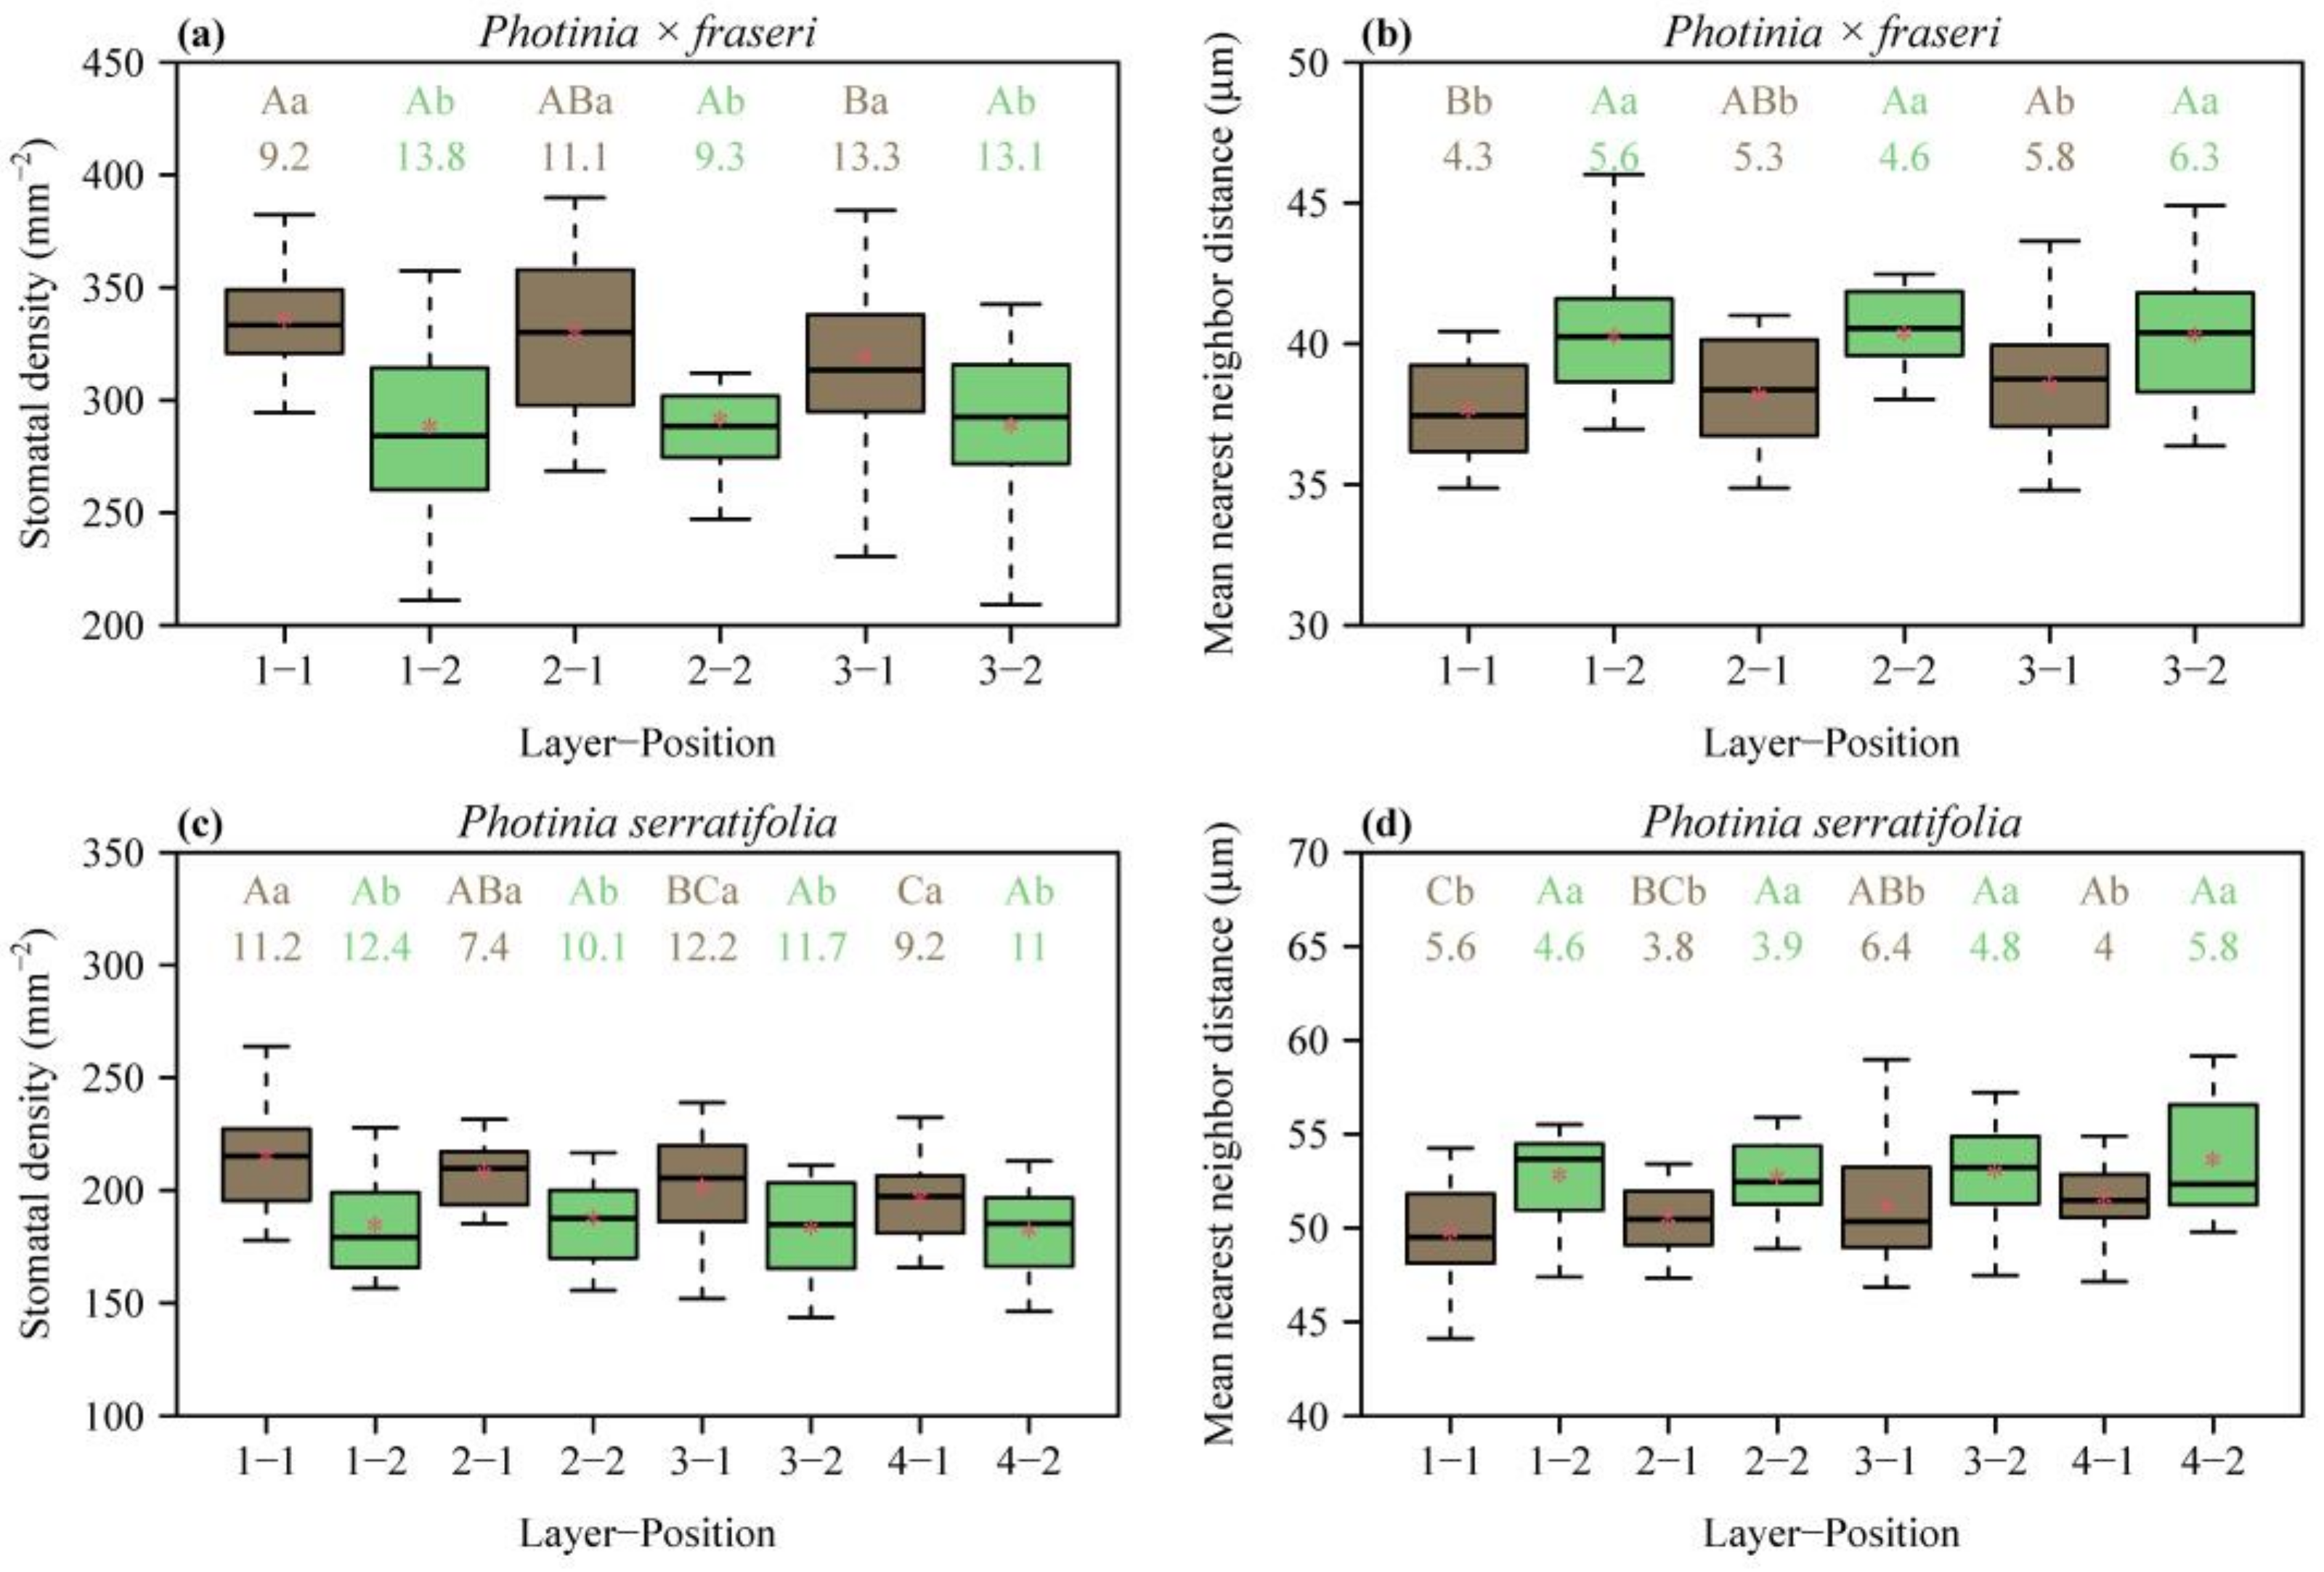
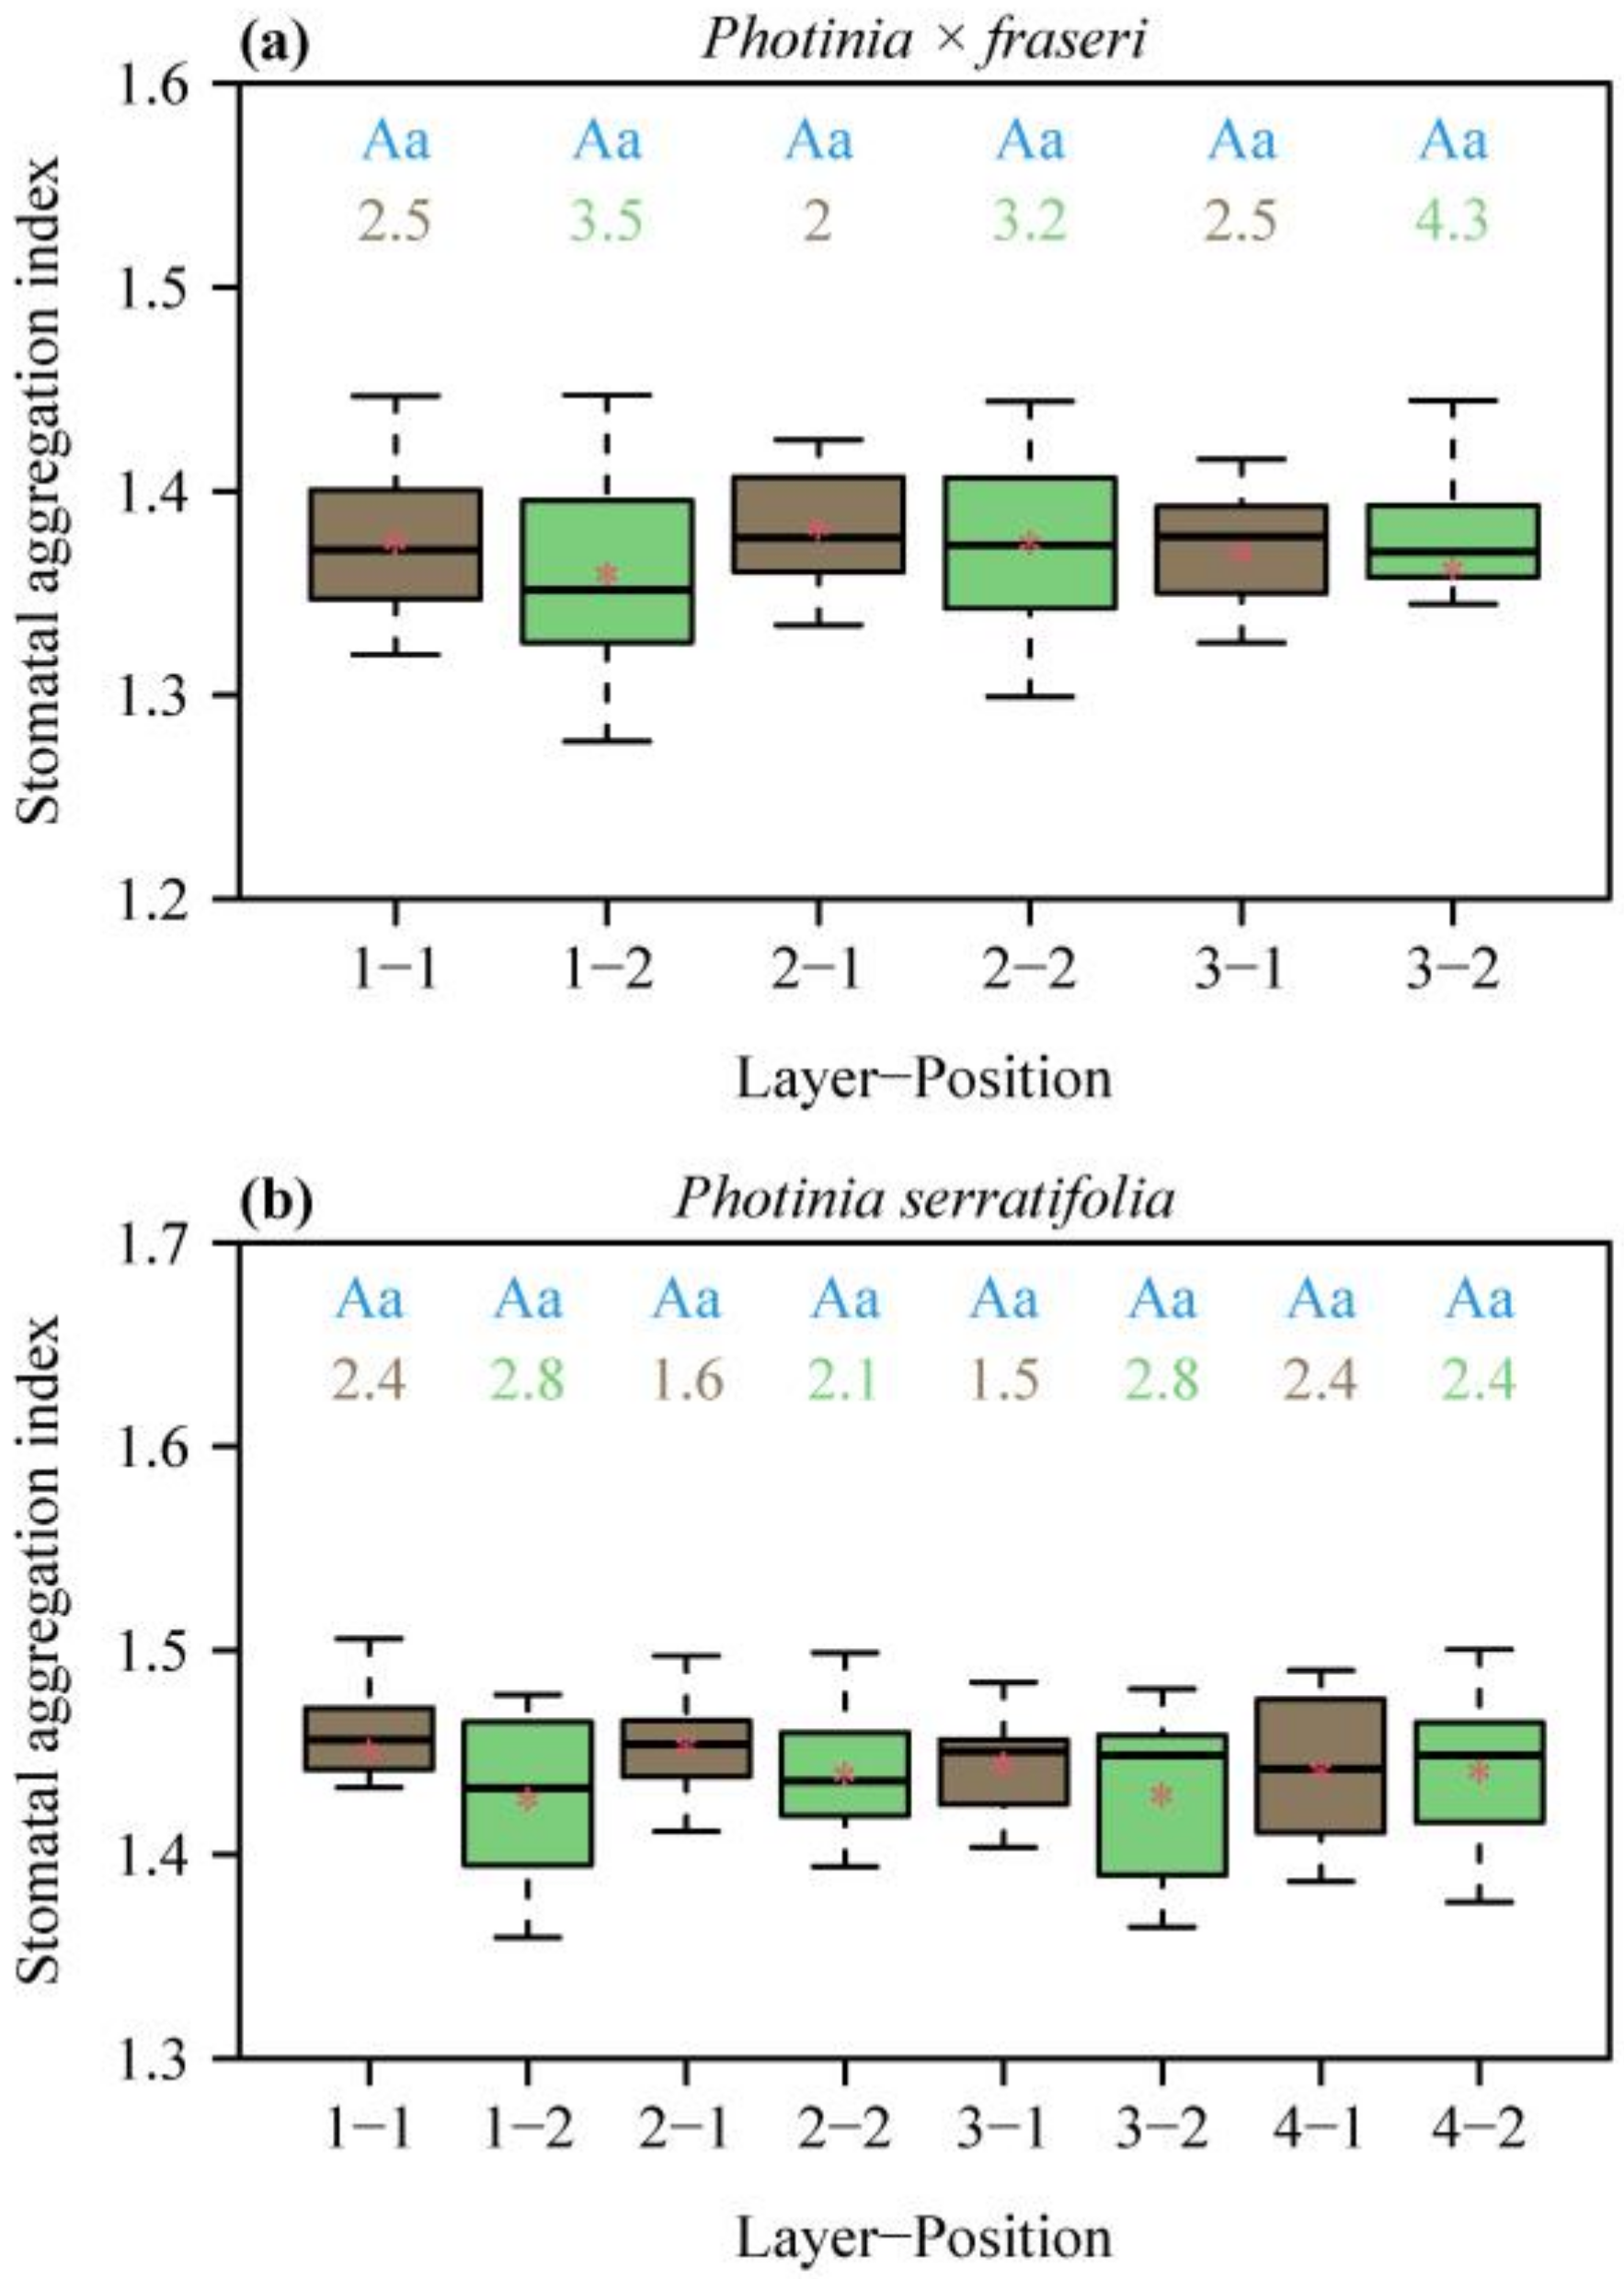
3. Results
4. Discussion
4.1. Spatial Variation in Stomatal Density
4.2. Spatial Repulsion between Stomata and Its Influence on the Estimation of Stomatal Density
5. Conclusions
Supplementary Materials
Author Contributions
Funding
Data Availability Statement
Acknowledgments
Conflicts of Interest
References
- Giuliani, R.; Koteyeva, N.; Voznesenskaya, E.; Evans, M.A.; Cousins, A.B.; Edwards, G.E. Coordination of leaf photosynthesis, transpiration, and structural traits in rice and wild relatives (genus oryza). Plant Physiol. 2013, 162, 1632–1651. [Google Scholar] [CrossRef] [PubMed]
- Henry, C.; John, G.P.; Pan, R.; Bartlett, M.K.; Fletcher, L.R.; Scoffoni, C.; Sack, L. A stomatal safety-efficiency trade-off constrains responses to leaf dehydration. Nat. Commun. 2019, 10, 3398. [Google Scholar] [CrossRef] [PubMed]
- Gong, L.; Liu, X.; Zeng, Y.; Tian, X.; Li, Y.; Turner, N.C.; Fang, X. Stomatal morphology and physiology explain varied sensitivity to abscisic acid across vascular plant lineages. Plant Physiol. 2021, 186, 782–797. [Google Scholar] [CrossRef] [PubMed]
- Franks, P.J.; Leitch, I.J.; Ruszala, M.; Hetherington, A.M.; Beerling, D.J. Physiological framework for adaptation of stomata to CO2 from glacial to future concentrations. Philos. Trans. R. Soc. Lond. B Biol. Sci. 2012, 367, 537–546. [Google Scholar] [CrossRef] [PubMed]
- Dow, G.J.; Bergmann, D.C. Patterning and processes: How stomatal development defines physiological potential. Curr. Opin. Plant Biol. 2014, 21, 67–74. [Google Scholar] [CrossRef] [PubMed]
- Bertolino, L.T.; Caine, R.S.; Gray, J.E. Impact of stomatal density and morphology on water-use efficiency in a changing world. Front. Plant Sci. 2019, 10, 225. [Google Scholar] [CrossRef] [PubMed]
- Niinemets, Ü. Leaf trait plasticity and evolution in different plant functional types. Ann. Plant Rev. Online 2020, 3, 473–522. [Google Scholar]
- Franks, P.J.; Beerling, D.J. Maximum leaf conductance driven by CO2 effects on stomatal size and density over geologic time. Proc. Natl. Acad. Sci. USA 2009, 106, 10343–10347. [Google Scholar] [CrossRef]
- Kübarsepp, L.; Laanisto, L.; Niinemets, Ü.; Talts, E.; Tosens, T. Are stomata in ferns and allies sluggish? Stomatal responses to CO2, humidity and light and their scaling with size and density. New Phytol. 2020, 225, 183–195. [Google Scholar] [CrossRef]
- Xiong, D.; Flexas, J. From one side to two sides: The effects of stomatal distribution on photosynthesis. New Phytol. 2020, 228, 1754–1766. [Google Scholar] [CrossRef]
- Liu, C.; Sack, L.; Li, Y.; Zhang, J.; Yu, K.; Zhang, Q.; He, N.; Yu, G. Relationships of stomatal morphology to the environment across plant communities. Nat. Commun. 2023, 14, 6629. [Google Scholar] [CrossRef]
- Toscano, S.; Ferrante, A.; Tribulato, A.; Romano, D. Leaf physiological and anatomical responses of lantana and ligustrum species under different water availability. Plant Physiol. Biochem. 2018, 127, 380–392. [Google Scholar] [CrossRef]
- Vráblová, M.; Vrábl, D.; Hronková, M.; Kubásek, J.; Šantrůček, J. Stomatal function, density and pattern, and CO2 assimilation in arabidopsis thaliana tmm1 and sdd1–1 mutants. Plant Biol. 2017, 19, 689–701. [Google Scholar] [CrossRef] [PubMed]
- Wuyun, T.; Niinemets, Ü.; Hõrak, H. Species-specific stomatal ABA responses in juvenile ferns grown from spores. New Phytol. 2023, in press. [Google Scholar] [CrossRef]
- Taylor, S.H.; Franks, P.J.; Hulme, S.P.; Spriggs, E.; Christin, P.A.; Edwards, E.J.; Woodward, F.I.; Osborne, C.P. Photosynthetic pathway and ecological adaptation explain stomatal trait diversity amongst grasses. New Phytol. 2012, 193, 387–396. [Google Scholar] [CrossRef] [PubMed]
- Fanourakis, D.; Giday, H.; Milla, R.; Pieruschka, R.; Kjaer, K.H.; Bolger, M.; Vasilevski, A.; Nunes-Nesi, A.; Fiorani, F.; Ottosen, C.O. Pore size regulates operating stomatal conductance, while stomatal densities drive the partitioning of conductance among leaf sides. Ann. Bot. 2015, 115, 555–565. [Google Scholar] [CrossRef]
- Shi, P.; Jiao, Y.; Diggle, P.J.; Turner, R.; Wang, R.; Niinemets, Ü. Spatial distribution characteristics of stomata at the areole level in Michelia cavaleriei var. platypetala (Magnoliaceae). Ann. Bot. 2021, 128, 875–886. [Google Scholar] [CrossRef] [PubMed]
- Shi, P.; Wang, L.; Niinemets, U.; Jiao, Y.; Niklas, K.J. Estimation of stomatal density of leaves with hierarchical reticulate venation. Bot. Lett. 2023, 170, 269–277. [Google Scholar] [CrossRef]
- Cochard, H.; Breda, N.; Granier, A. Whole tree hydraulic conductance and water loss regulation in Quercus during drought: Evidence for stomatal control of embolism? Ann. For. Sci. 1996, 53, 197–206. [Google Scholar] [CrossRef]
- Jones, H.G. Use of infrared thermometry for estimation of stomatal conductance as a possible aid to irrigation scheduling. Agric. For. Meteorol. 1999, 95, 139–149. [Google Scholar] [CrossRef]
- Zhu, J.; Yu, Q.; Xu, C.; Li, J.; Qin, G. Rapid estimation of stomatal density and stomatal area of plant leaves based on object-oriented classification and its ecological trade-off strategy analysis. Forests 2018, 9, 616. [Google Scholar] [CrossRef]
- Du, J.; Wei, X. A new kind of red-leaf garden plant—Photinia × fraseri. J. Anhui Agric. Sci. 2009, 37, 5263–5265. [Google Scholar]
- Han, W.; Gai, S.; Liu, Z.; Xu, R.; Wang, S.; Zhang, Y. Ecological service function evaluation of urban greening shrubs in Guanzhong region, Shaanxi Province. Bull. Soil Water Conser. 2023, 43, 61–68. [Google Scholar]
- Jiao, Y.; Niklas, K.J.; Wang, L.; Yu, K.; Li, Y.; Shi, P. Influence of leaf age on the scaling relationships of lamina mass vs. area. Front. Plant Sci. 2022, 13, 860206. [Google Scholar] [CrossRef]
- Urbanek, S.; Johnson, K. Tiff: Read and Write TIFF Images. R Package Version 0.1-11. Available online: https://CRAN.R-project.org/package=tiff (accessed on 14 October 2022).
- R Core Team. R: A Language and Environment for Statistical Computing; R Foundation for Statistical Computing: Vienna, Austria, 2022; Available online: https://www.r-project.org/ (accessed on 1 June 2022).
- Rowlingson, B.S.; Diggle, P.J. Splancs: Spatial point pattern analysis code in S-plus. Comput. Geosci. 1993, 19, 627–655. [Google Scholar] [CrossRef]
- Pinheiro, J.C.; Bates, D.M. Mixed-Effects Models in S and S-PLUS; Springer: New York, NY, USA, 2000. [Google Scholar]
- Clark, P.J.; Evans, F.C. Distance to nearest neighbor as a measure of spatial relationships in populations. Ecology 1954, 35, 445–453. [Google Scholar] [CrossRef]
- von Groll, U.; Altmann, T. Stomatal cell biology. Curr. Opin. Plant Biol. 2001, 4, 555–560. [Google Scholar] [CrossRef]
- Liu, C.; Li, Y.; Xu, L.; Li, M.; Wang, J.; Yan, P.; He, N. Stomatal arrangement pattern: A new direction to explore plant adaptation and evolution. Front. Plant Sci. 2021, 12, 655255. [Google Scholar] [CrossRef]
- Niklas, K.J. Plant Allometry; University of Chicago Press: Chicago, IL, USA, 1994. [Google Scholar]
- Quinn, G.P.; Keough, M.J. Experimental Design and Data Analysis for Biologists; Cambridge University Press: Cambridge, IL, USA, 2002. [Google Scholar]
- Efron, B.; Tibshirani, R.J. An Introduction to the Bootstrap; Chapman and Hall: London, UK, 1993. [Google Scholar]
- Sandhu, H.S.; Shi, P.; Kuang, X.; Xue, F.; Ge, F. Applications of the bootstrap to insect physiology. Fla. Entomol. 2011, 94, 1036–1041. [Google Scholar] [CrossRef]
- McElwain, J.C.; Yiotis, C.; Lawson, T. Using modern plant trait relationships between observed and theoretical maximum stomatal conductance and vein density to examine patterns of plant macroevolution. New Phytol. 2016, 209, 94–103. [Google Scholar] [CrossRef]
- Scoffoni, C.; Rawls, M.; McKown, A.; Cochard, H.; Sack, L. Decline of leaf hydraulic conductance with dehydration: Relationship to leaf size and venation architecture. Plant Physiol. 2011, 156, 832–843. [Google Scholar] [CrossRef] [PubMed]
- Shi, P.; Miao, Q.; Niinemets, Ü.; Liu, M.; Li, Y.; Yu, K.; Niklas, K.J. Scaling relationships of leaf vein and areole traits versus leaf size for nine Magnoliaceae species differing in venation density. Am. J. Bot. 2022, 109, 899–909. [Google Scholar] [CrossRef] [PubMed]
- Paudel, I.; Halpern, M.; Wagner, Y.; Raveh, E.; Yermiyahu, U.; Hoch, G.; Klein, T. Elevated CO2, compensates for drought effects in lemon saplings via stomatal down regulation, increased soil moisture, and increased wood carbon storage. Environ. Exp. Bot. 2018, 148, 117–127. [Google Scholar] [CrossRef]
- Yun, S.C.; Laurence, J.A. The response of clones of Populus tremuloides differing in sensitivity to ozone in the field. New Phytol. 1999, 141, 411–421. [Google Scholar] [CrossRef]
- Brown, V.K.; Lawton, J.H. Herbivory and the evolution of leaf size and shape. Philos. Trans. R. Soc. Lond. B Biol. Sci. 1991, 333, 265–272. [Google Scholar]
- Campitelli, B.E.; Simonsen, A.K.; Wolf, A.R.; Manson, J.S.; Stinchcombe, J.R. Leaf shape variation and herbivore consumption and performance: A case study with Ipomoea hederacea and three generalists. Arthropod Plant Interact. 2008, 2, 9–19. [Google Scholar] [CrossRef]
- Lawson, T.; Blatt, M.R. Stomatal size, speed, and responsiveness impact on photosynthesis and water use efficiency. Plant Physiol. 2014, 164, 1556–1570. [Google Scholar] [CrossRef]
- Haworth, M.; Marino, G.; Loreto, F.; Centritto, M. Integrating stomatal physiology and morphology: Evolution of stomatal control and development of future crops. Oecologia 2021, 197, 867–883. [Google Scholar] [CrossRef]
- Hussain, S.; Ulhassan, Z.; Brestic, M.; Zivcak, M.; Zhou, W.; Allakhverdiev, S.I.; Yang, X.; Safdar, M.E.; Yang, W.; Liu, W. Photosynthesis research under climate change. Photosyn. Res. 2021, 150, 5–19. [Google Scholar] [CrossRef]
- Jiao, Y.; Wang, R.; Shi, P. Study on spatial distribution characteristics of stomata in the leaf of Michelia maudiae. Anhui Sci Technol. 2021, 47, 7–12. [Google Scholar]


Disclaimer/Publisher’s Note: The statements, opinions and data contained in all publications are solely those of the individual author(s) and contributor(s) and not of MDPI and/or the editor(s). MDPI and/or the editor(s) disclaim responsibility for any injury to people or property resulting from any ideas, methods, instructions or products referred to in the content. |
© 2023 by the authors. Licensee MDPI, Basel, Switzerland. This article is an open access article distributed under the terms and conditions of the Creative Commons Attribution (CC BY) license (https://creativecommons.org/licenses/by/4.0/).
Share and Cite
Sun, M.; Niinemets, Ü.; Li, Q.; Jiao, Y.; Yao, W.; Shi, P. An Inverse Scaling Relationship between Stomatal Density and Mean Nearest Neighbor Distance: Evidence from a Photinia Hybrid and One of Its Parents. Plants 2023, 12, 3701. https://doi.org/10.3390/plants12213701
Sun M, Niinemets Ü, Li Q, Jiao Y, Yao W, Shi P. An Inverse Scaling Relationship between Stomatal Density and Mean Nearest Neighbor Distance: Evidence from a Photinia Hybrid and One of Its Parents. Plants. 2023; 12(21):3701. https://doi.org/10.3390/plants12213701
Chicago/Turabian StyleSun, Manli, Ülo Niinemets, Qiying Li, Yabing Jiao, Weihao Yao, and Peijian Shi. 2023. "An Inverse Scaling Relationship between Stomatal Density and Mean Nearest Neighbor Distance: Evidence from a Photinia Hybrid and One of Its Parents" Plants 12, no. 21: 3701. https://doi.org/10.3390/plants12213701
APA StyleSun, M., Niinemets, Ü., Li, Q., Jiao, Y., Yao, W., & Shi, P. (2023). An Inverse Scaling Relationship between Stomatal Density and Mean Nearest Neighbor Distance: Evidence from a Photinia Hybrid and One of Its Parents. Plants, 12(21), 3701. https://doi.org/10.3390/plants12213701