


Analysis of Net Primary Productivity Variation and Quantitative Assessment of Driving Forces—A Case Study of the Yangtze River Basin
 ,
,  ,
, 

Abstract
:1. Introduction
2. Data and Methods
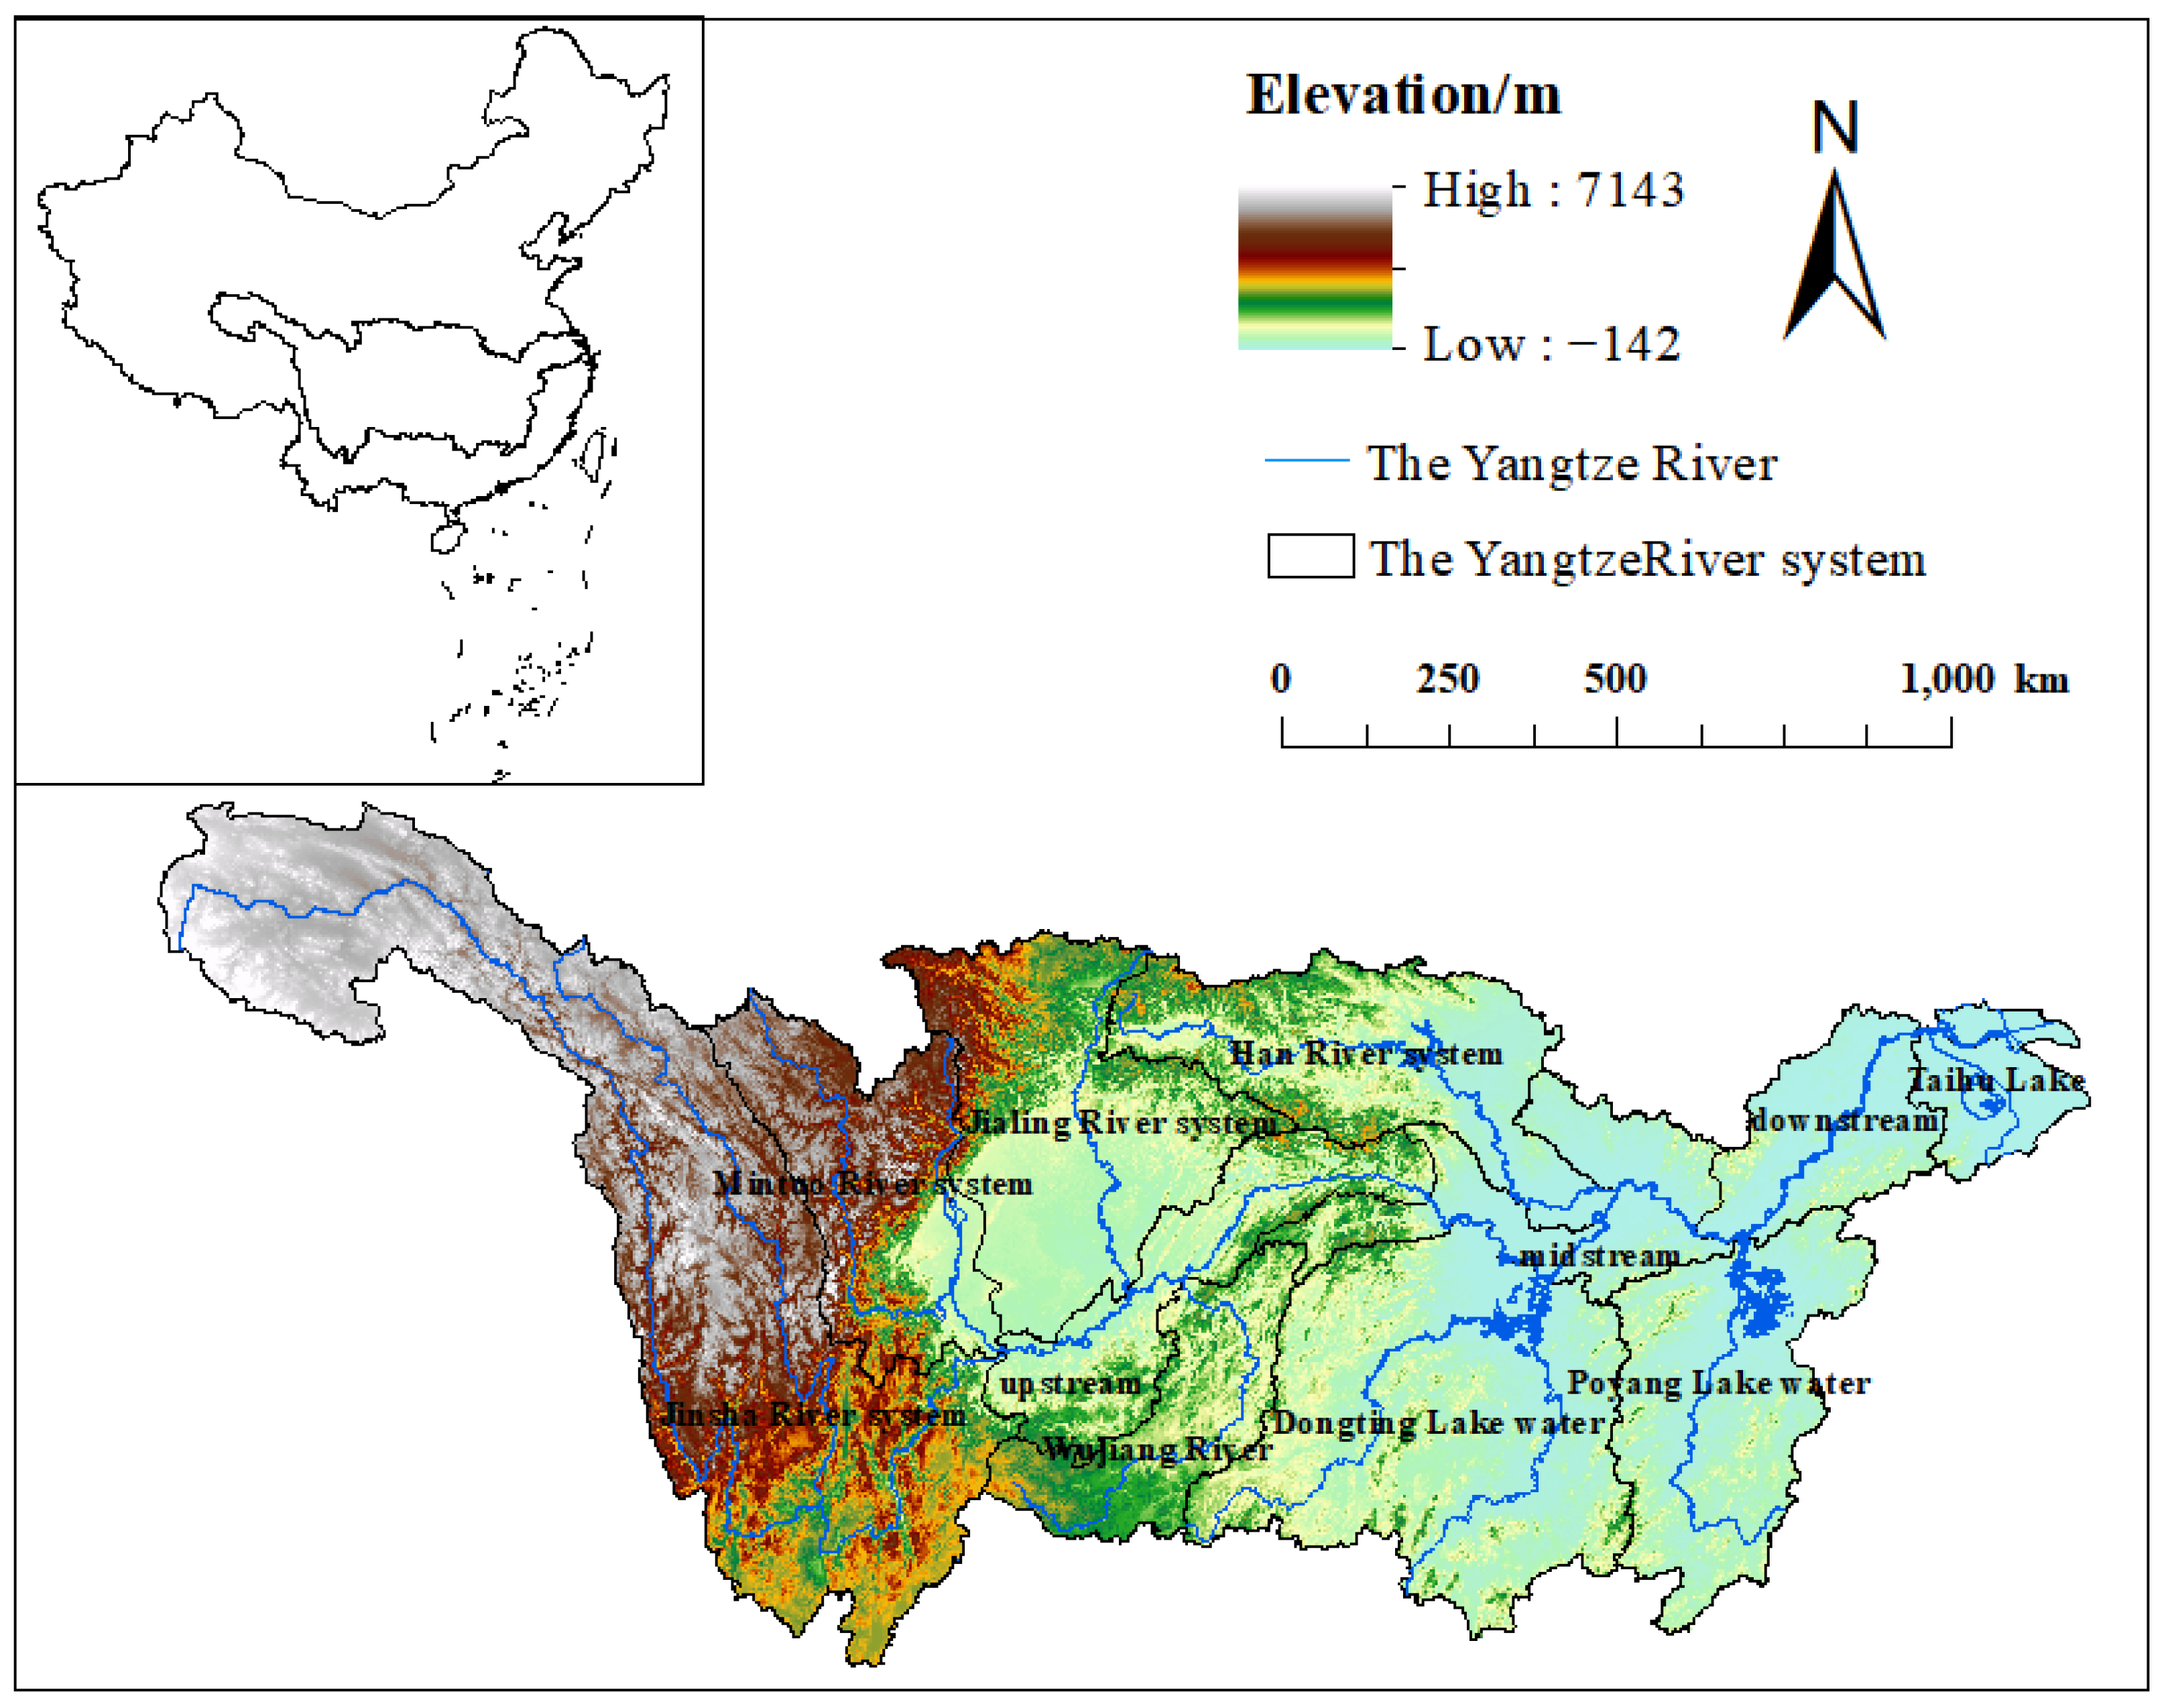
2.1. Study Area
2.2. Data Source
2.3. Methods
2.3.1. Trend Analysis Method
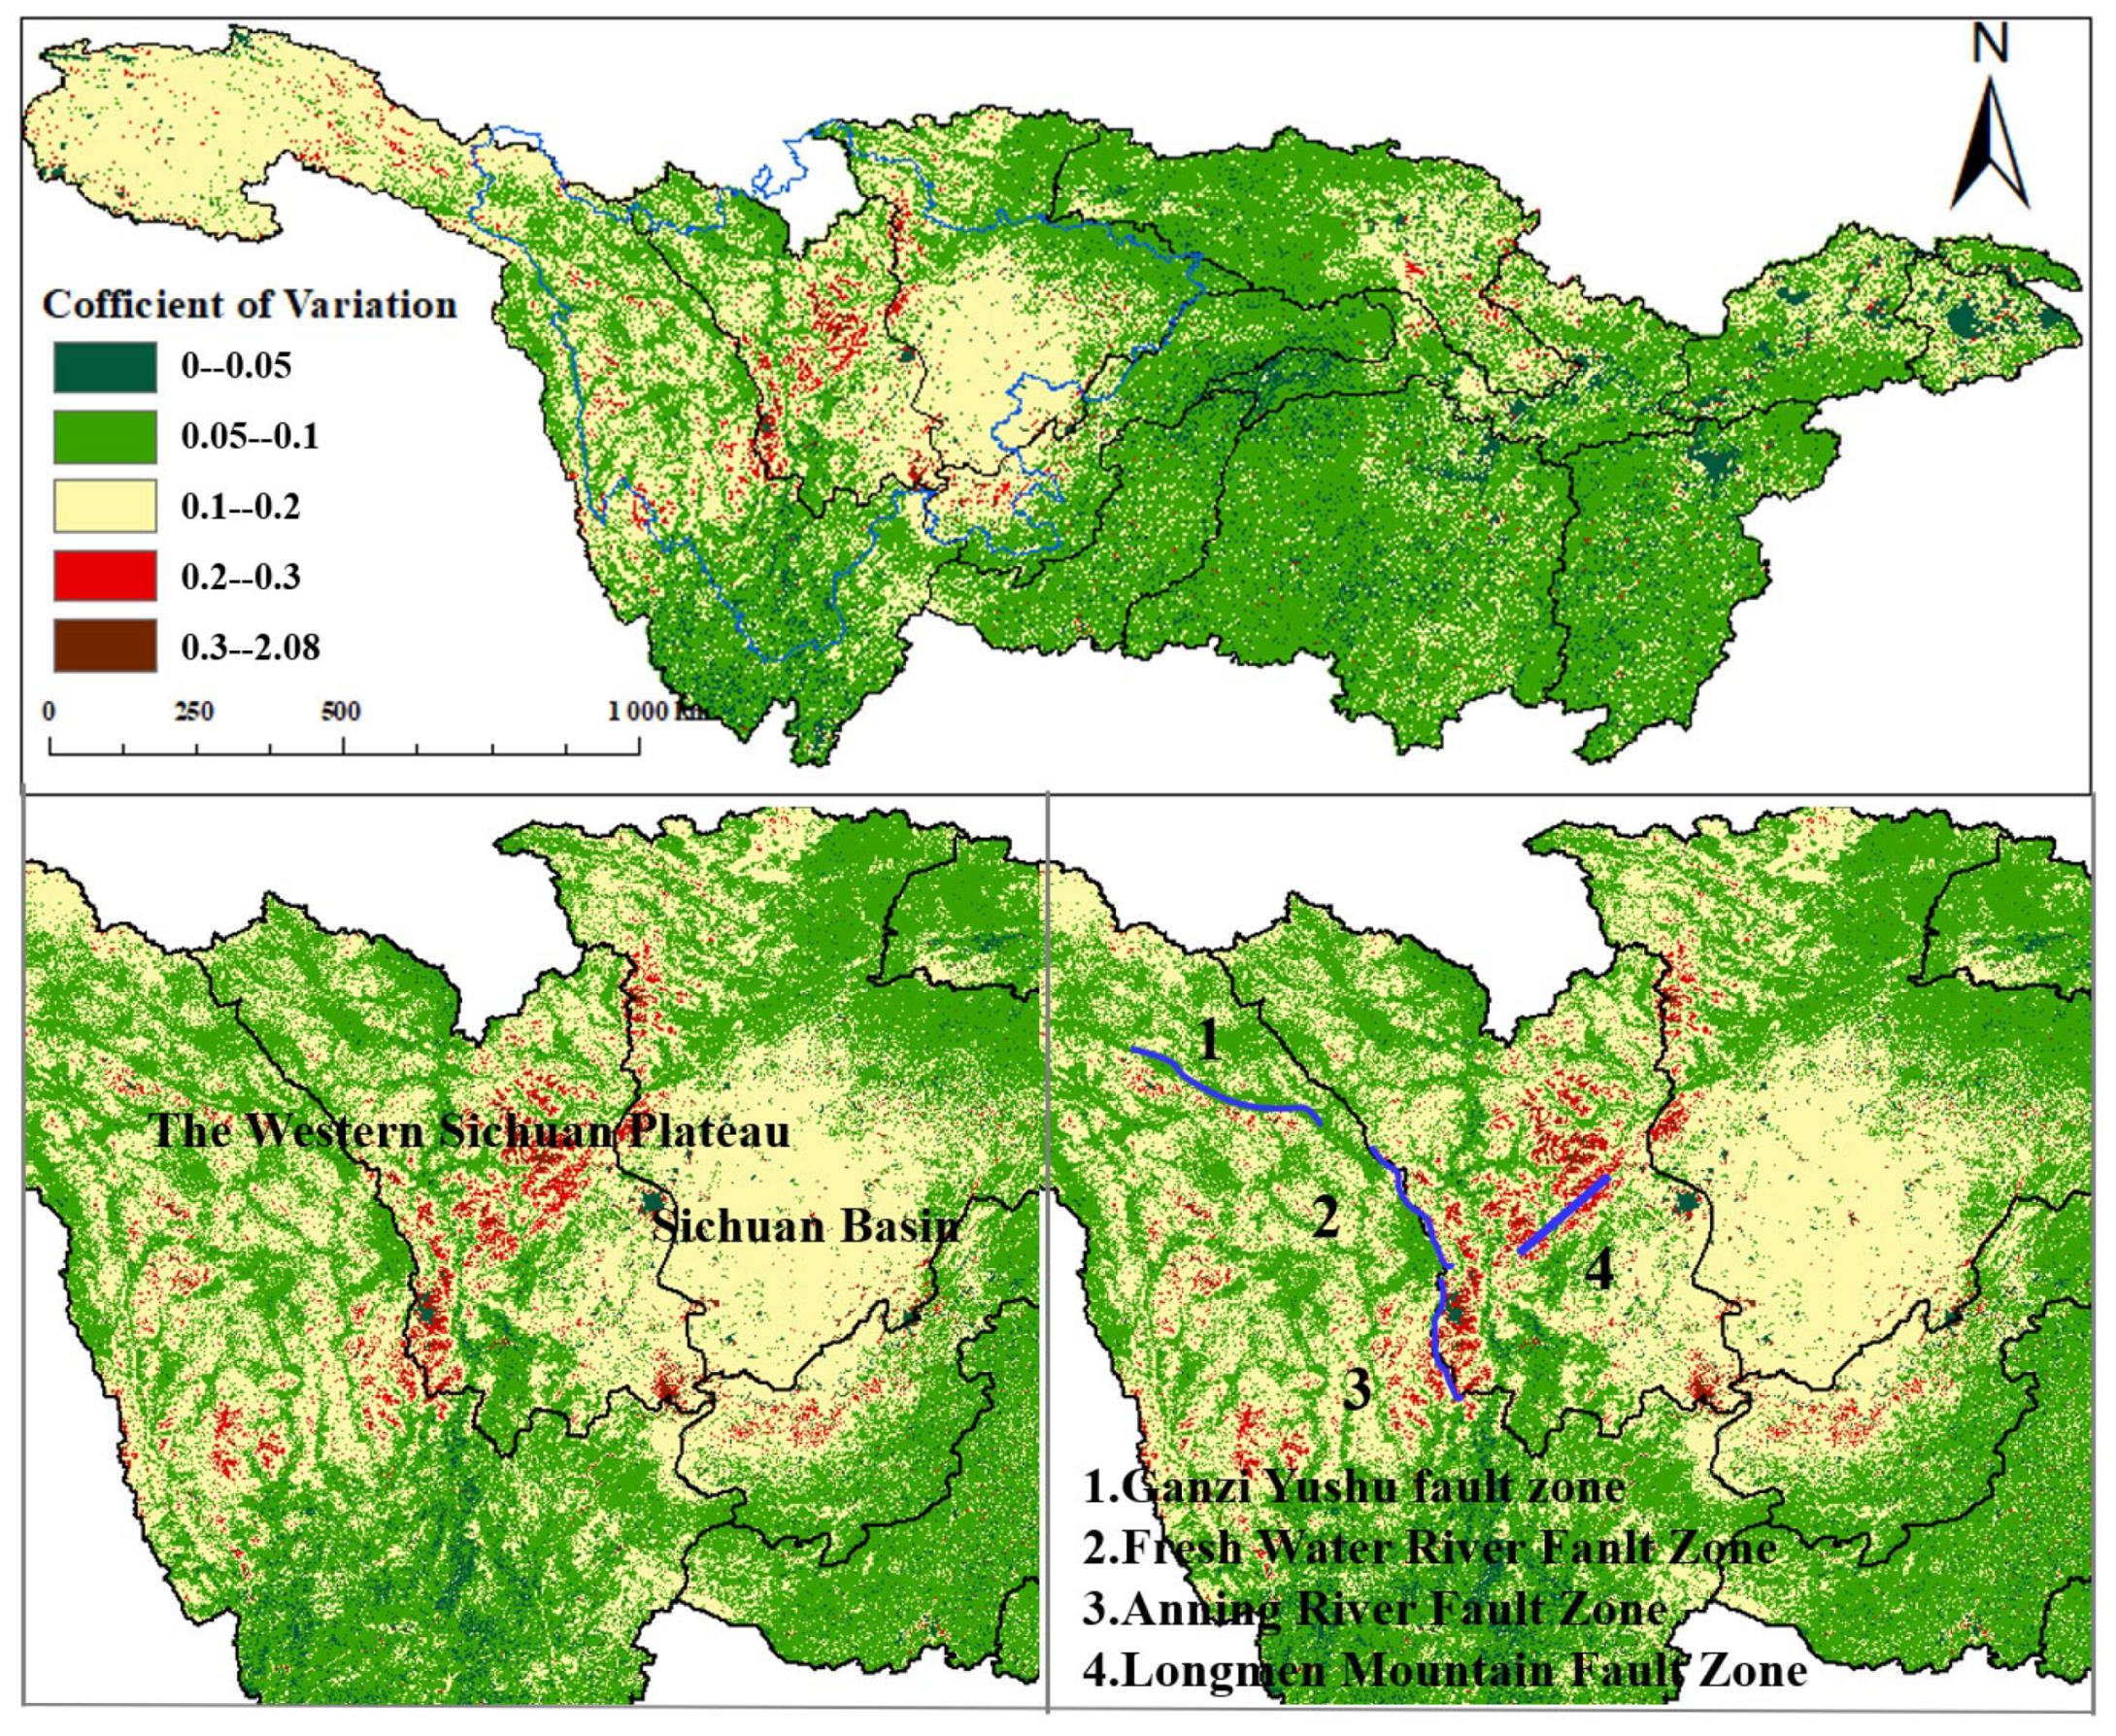
2.3.2. Stability Analysis
2.3.3. Partial Correlation Analysis
2.3.4. Multivariate Regression Residual Analysis
3. Results
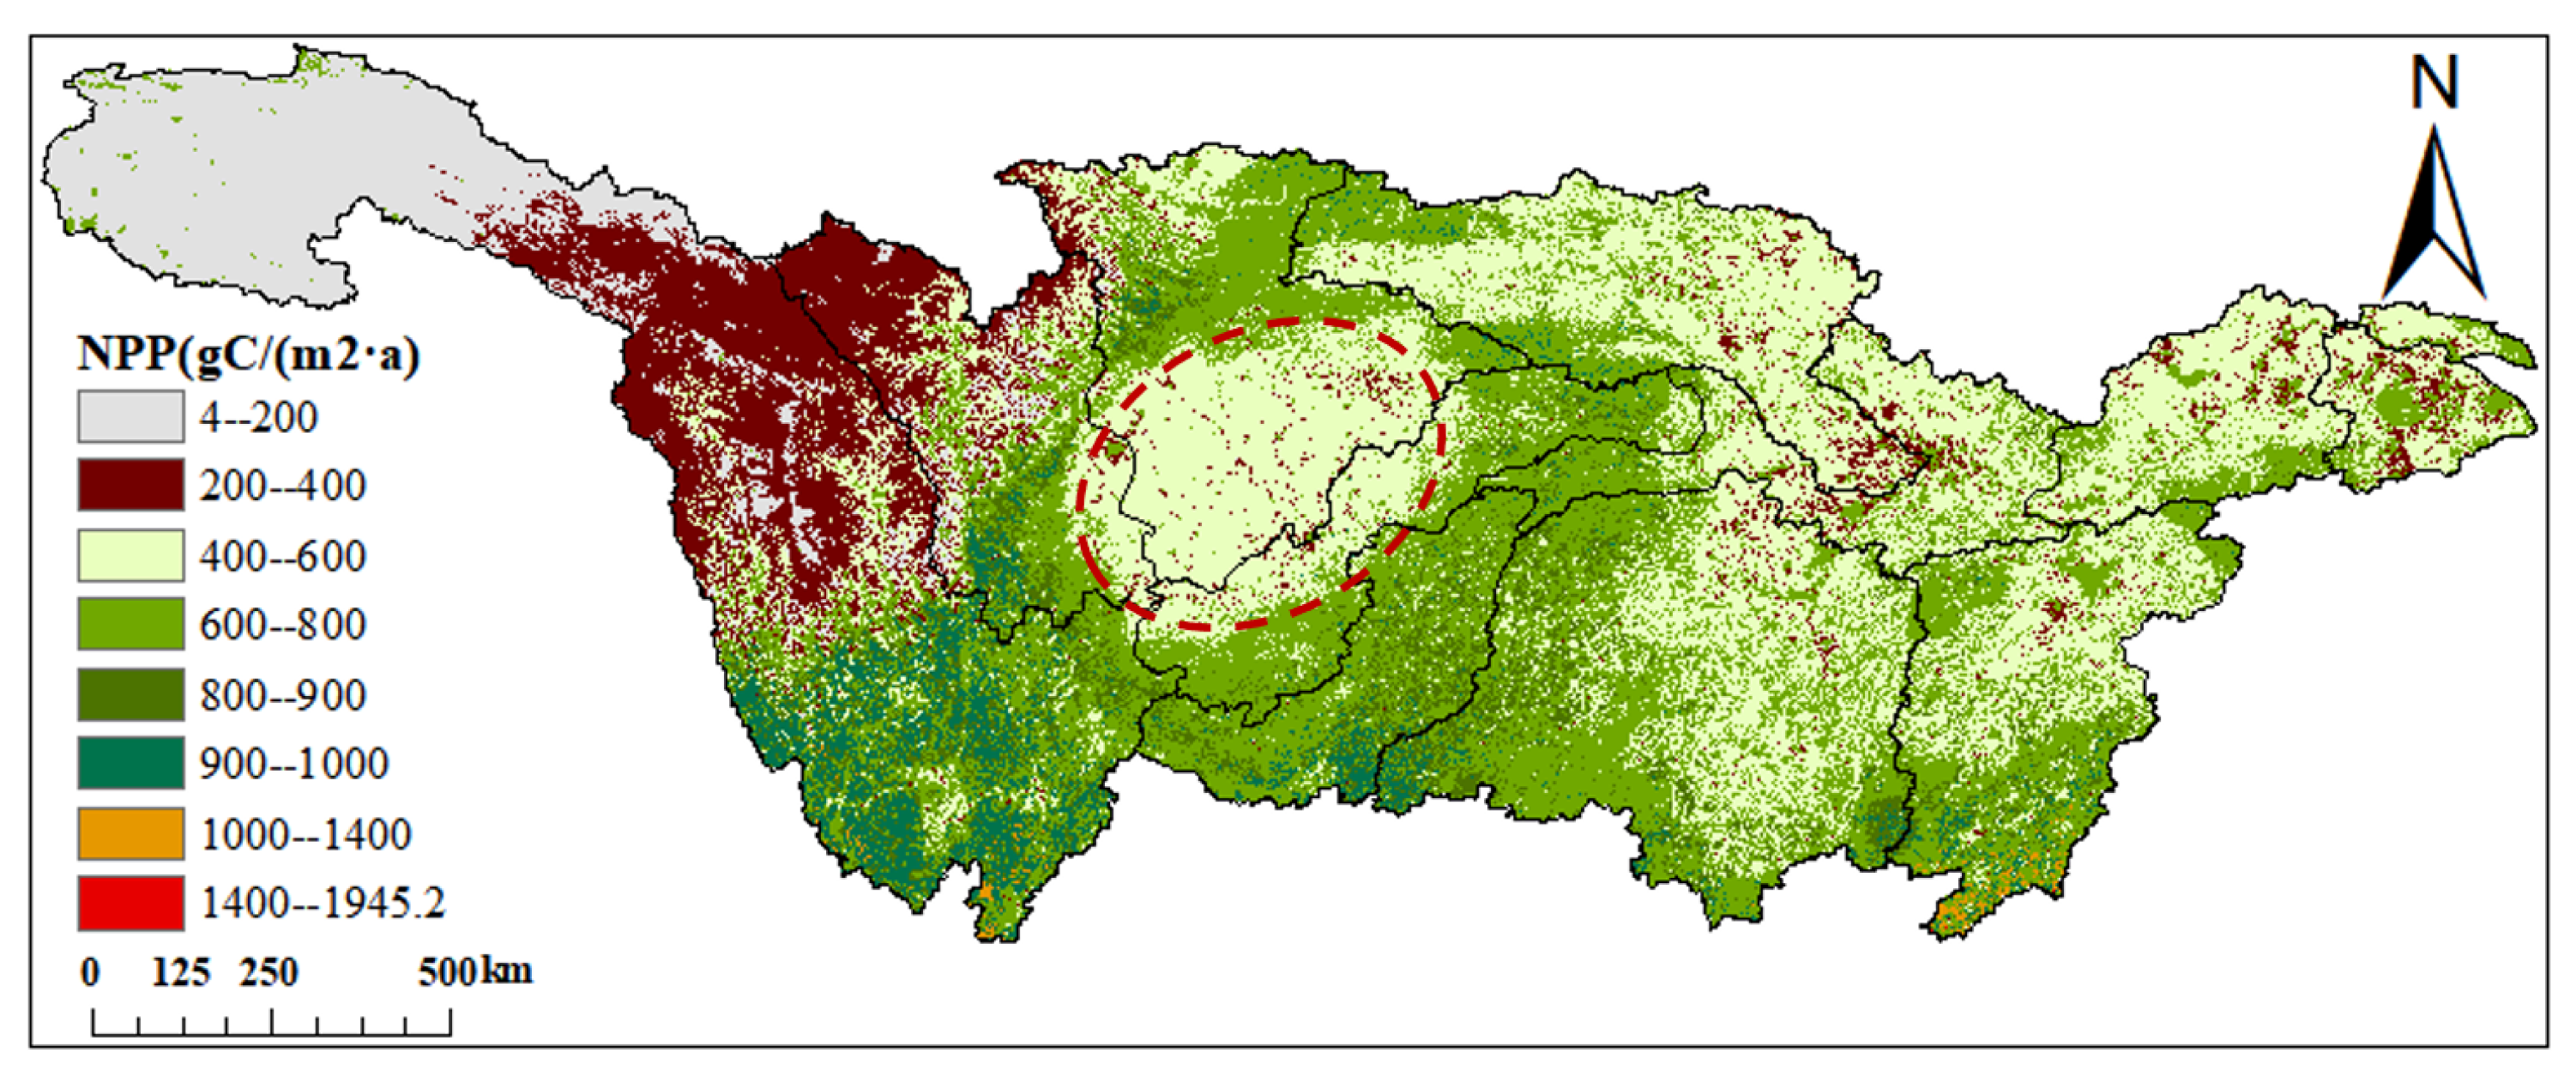
3.1. Spatial Distribution of Average NPP
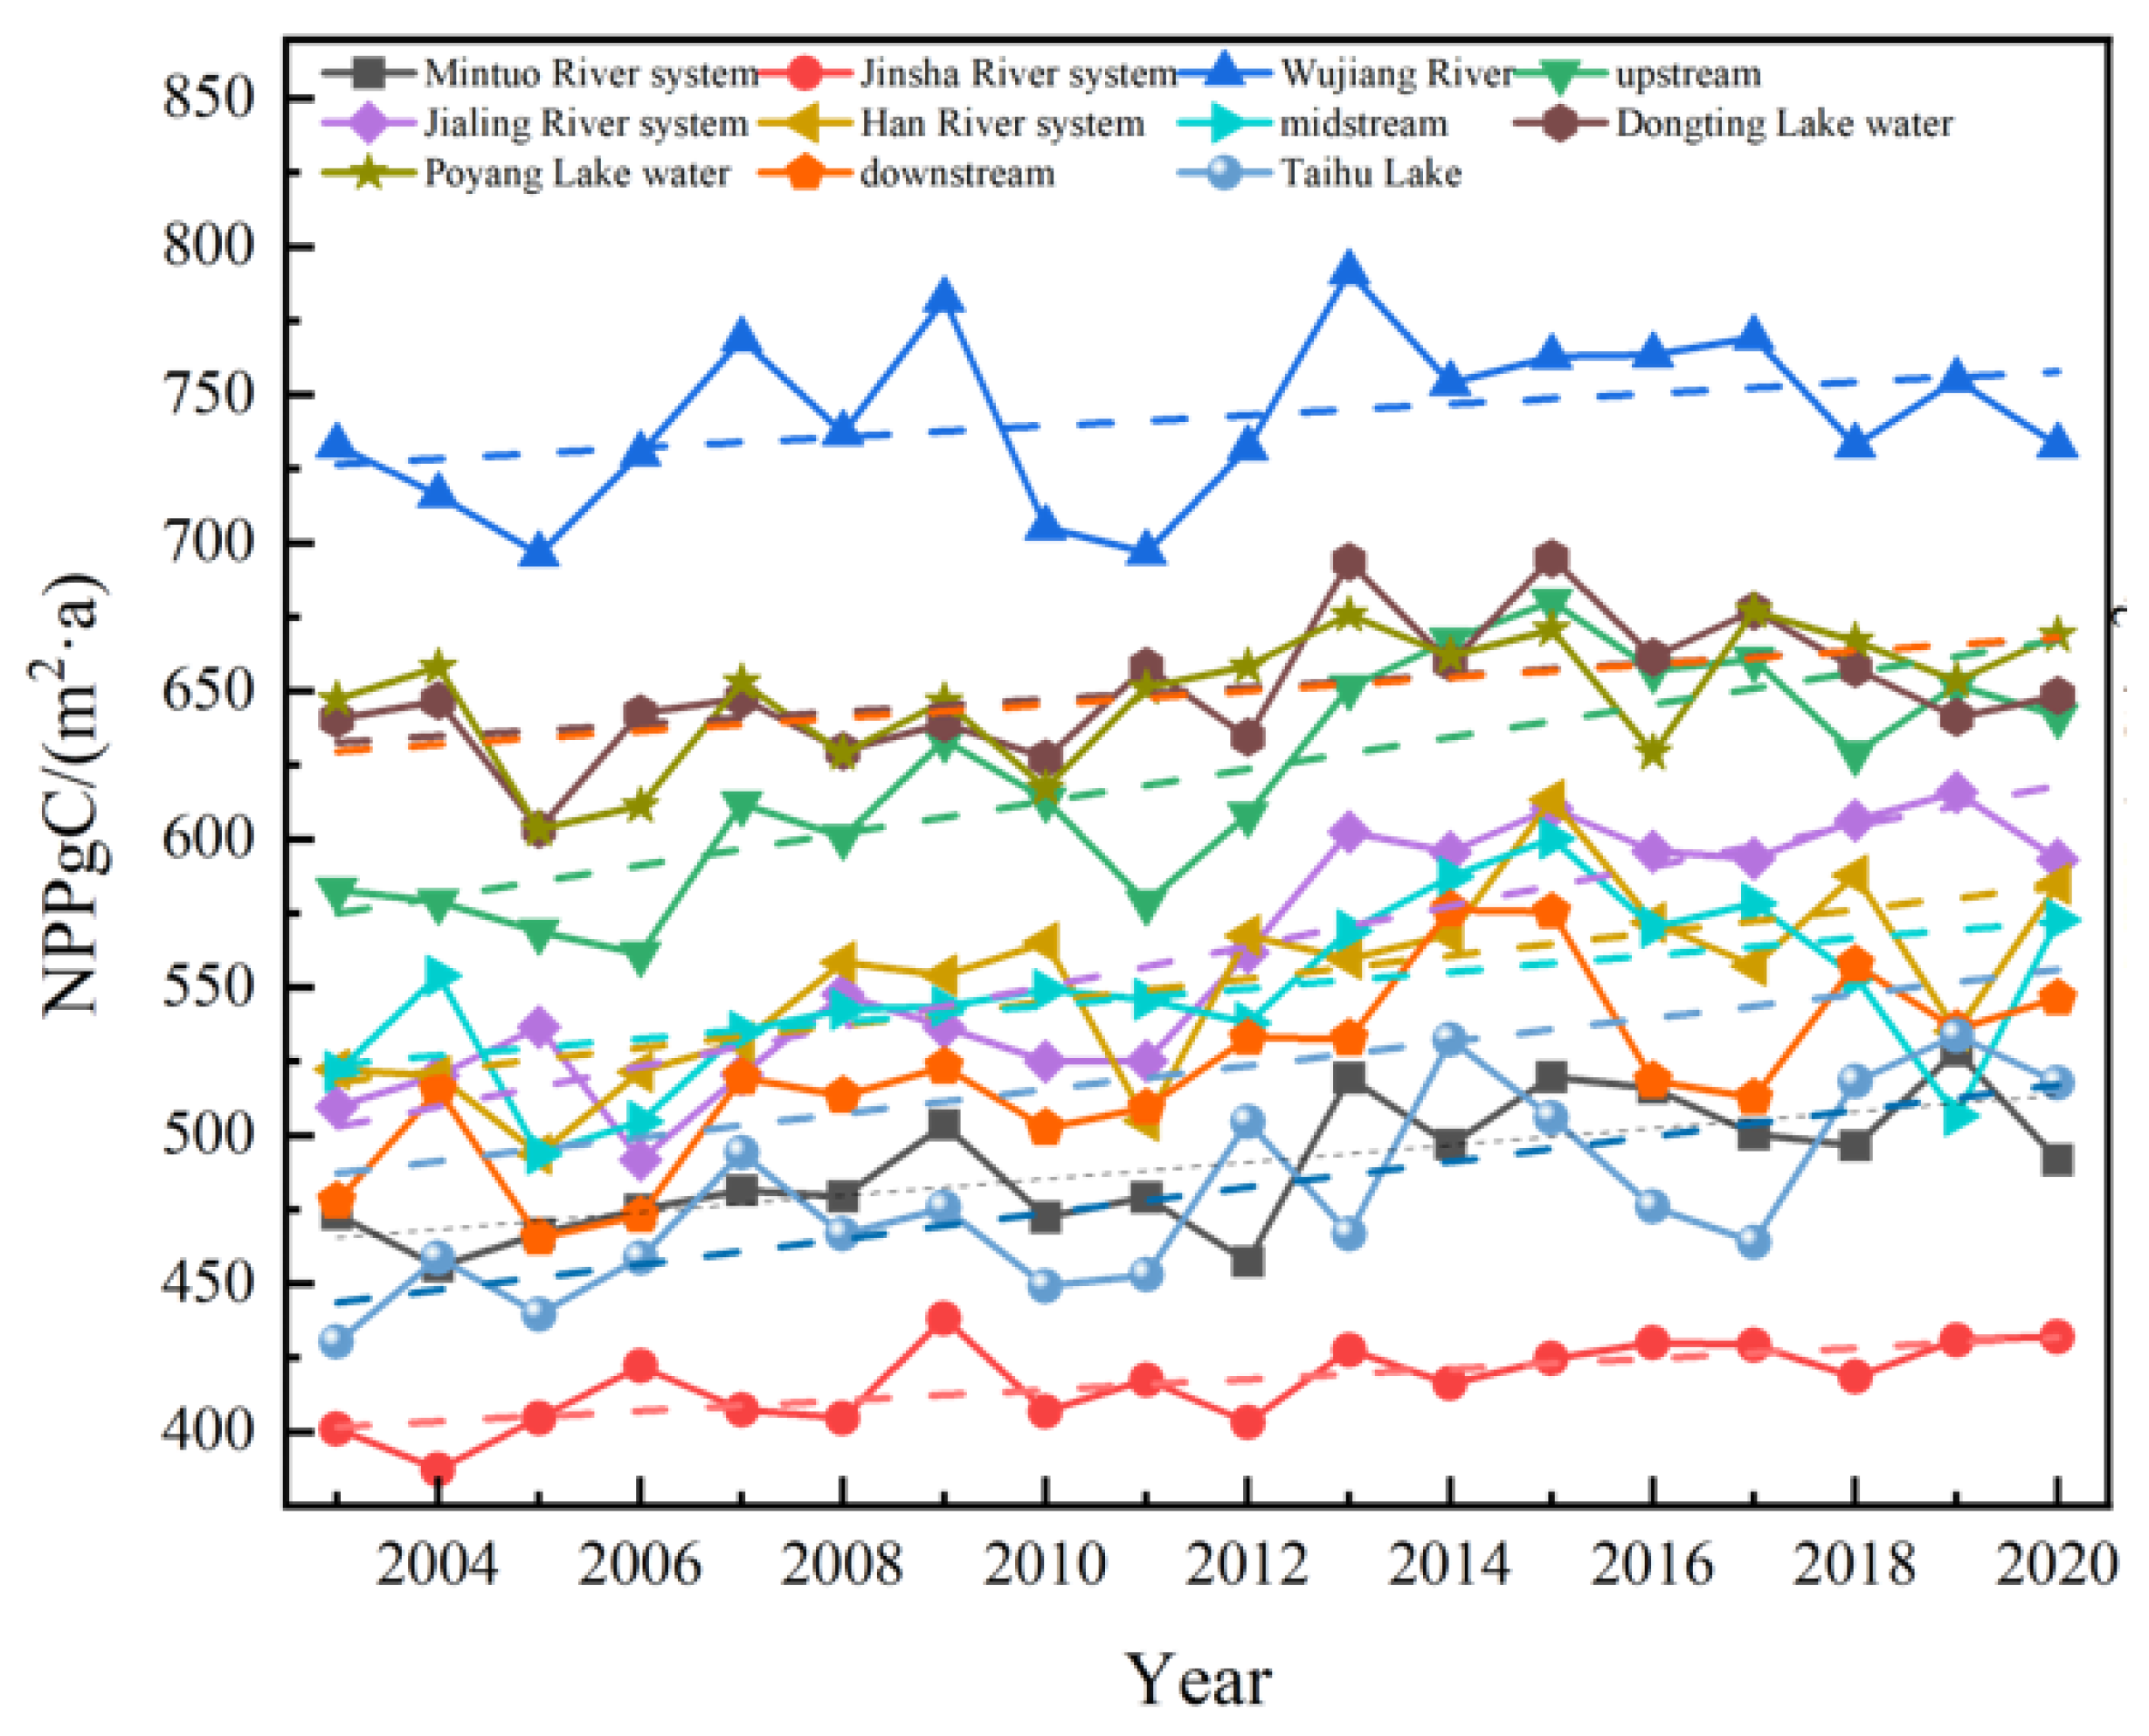
3.2. Time-Series Characteristics of NPP
3.3. Spatial Distribution of Change Trends of NPP
3.4. Correlation Analysis between Climate Change and NPP Variation
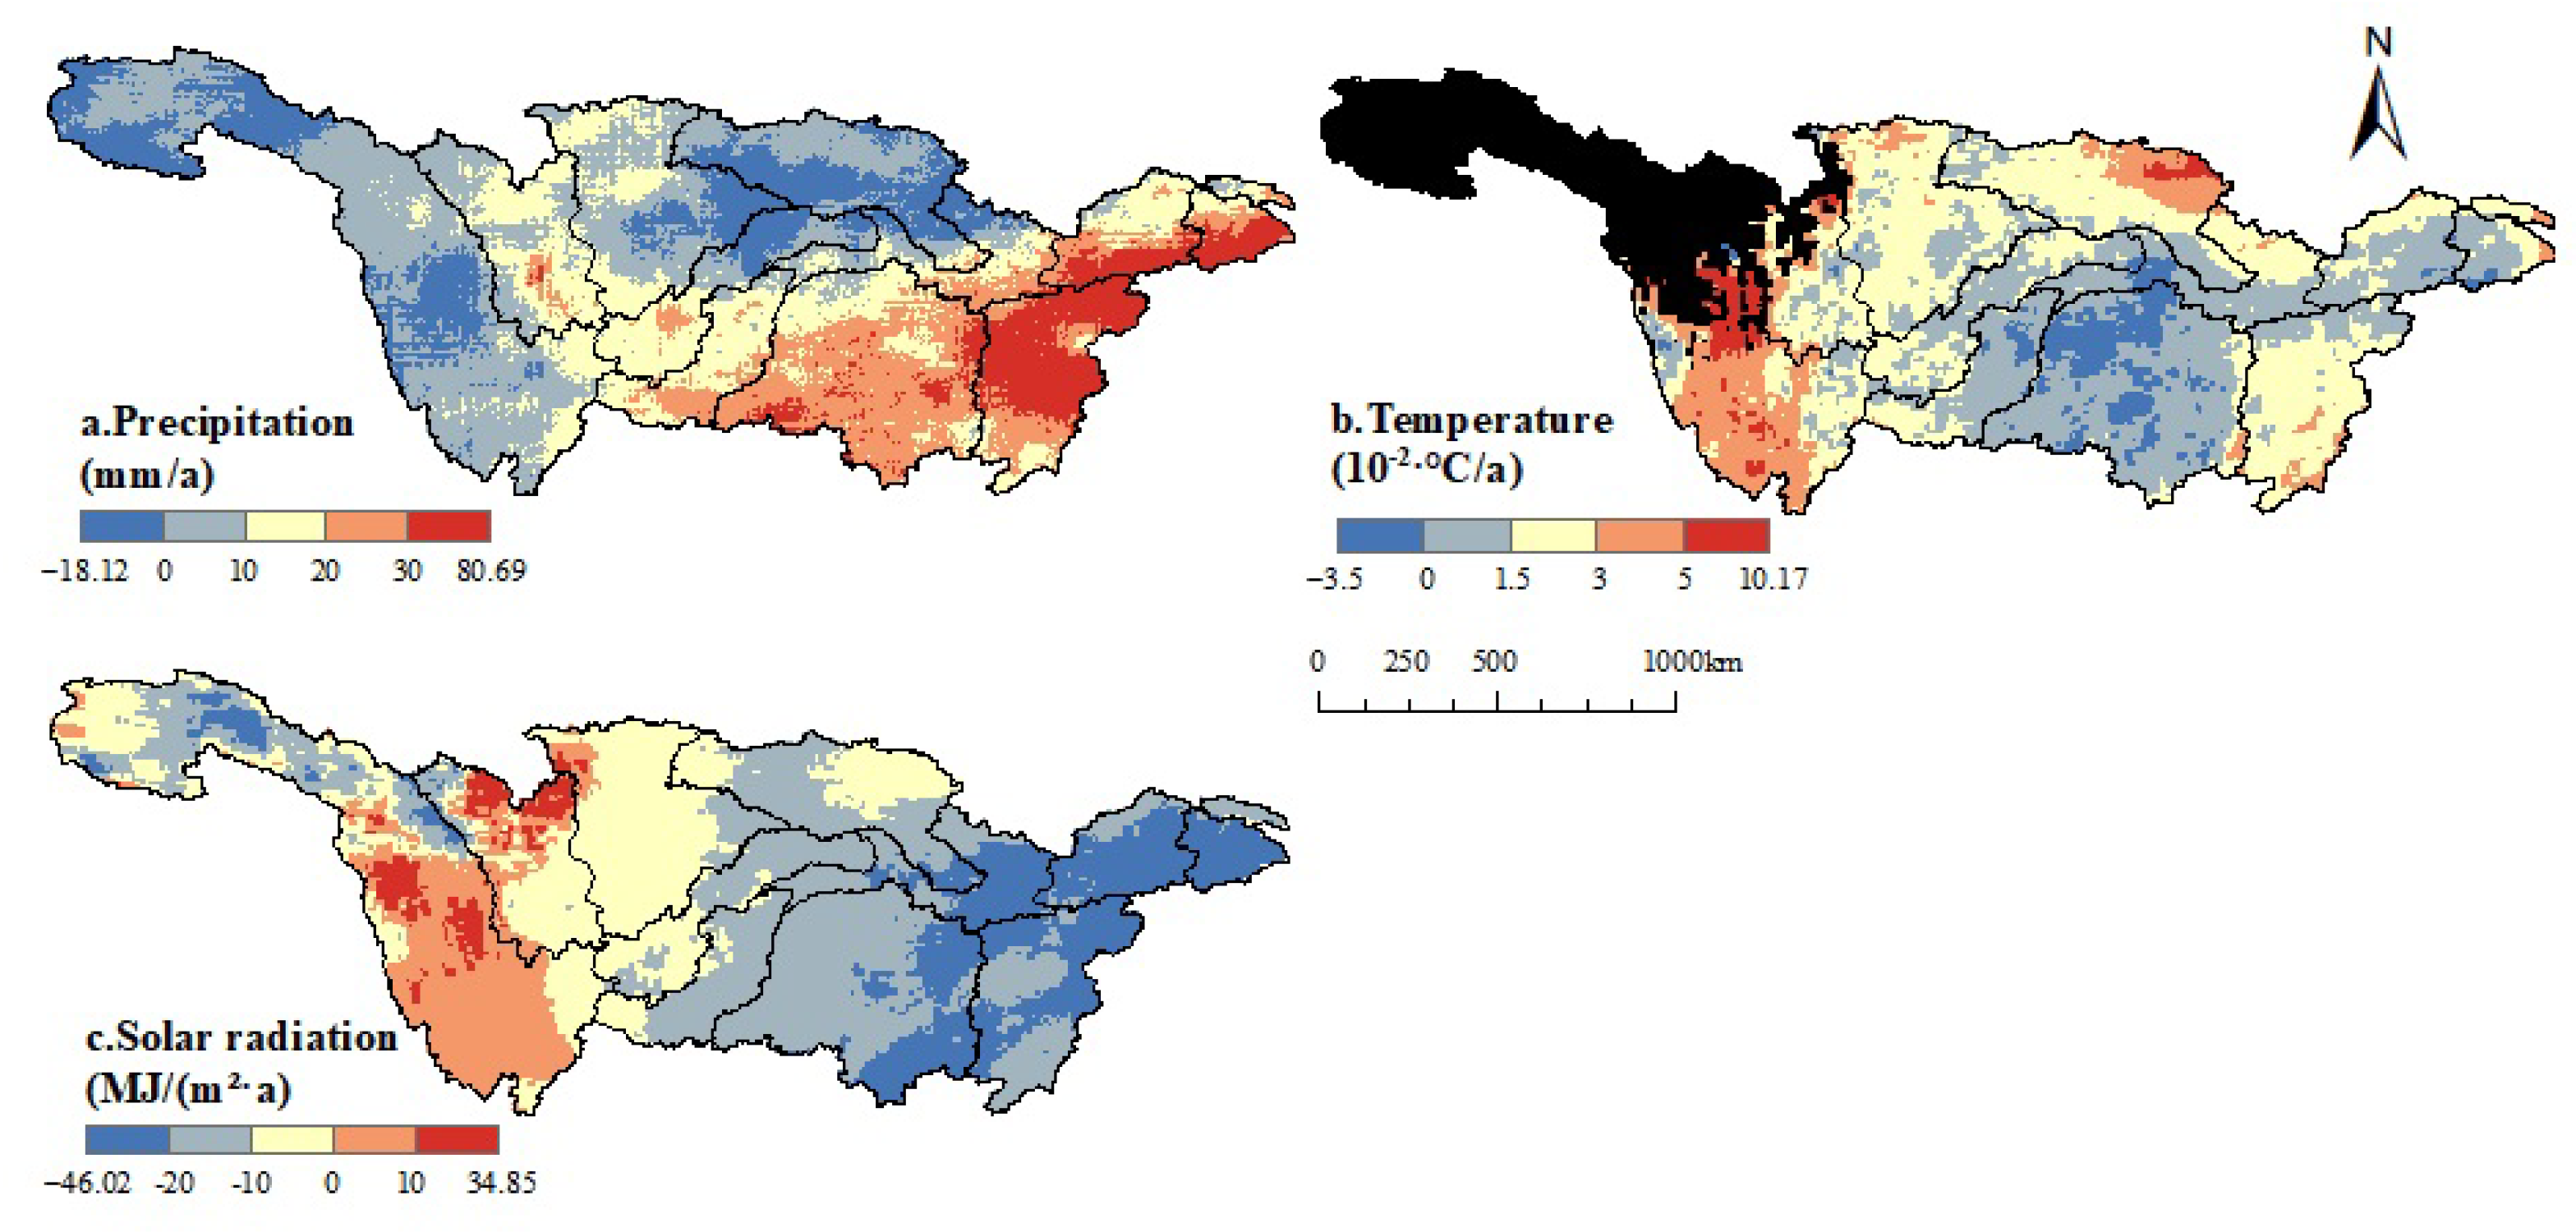
3.4.1. Spatiotemporal Characteristics of Climate Factors
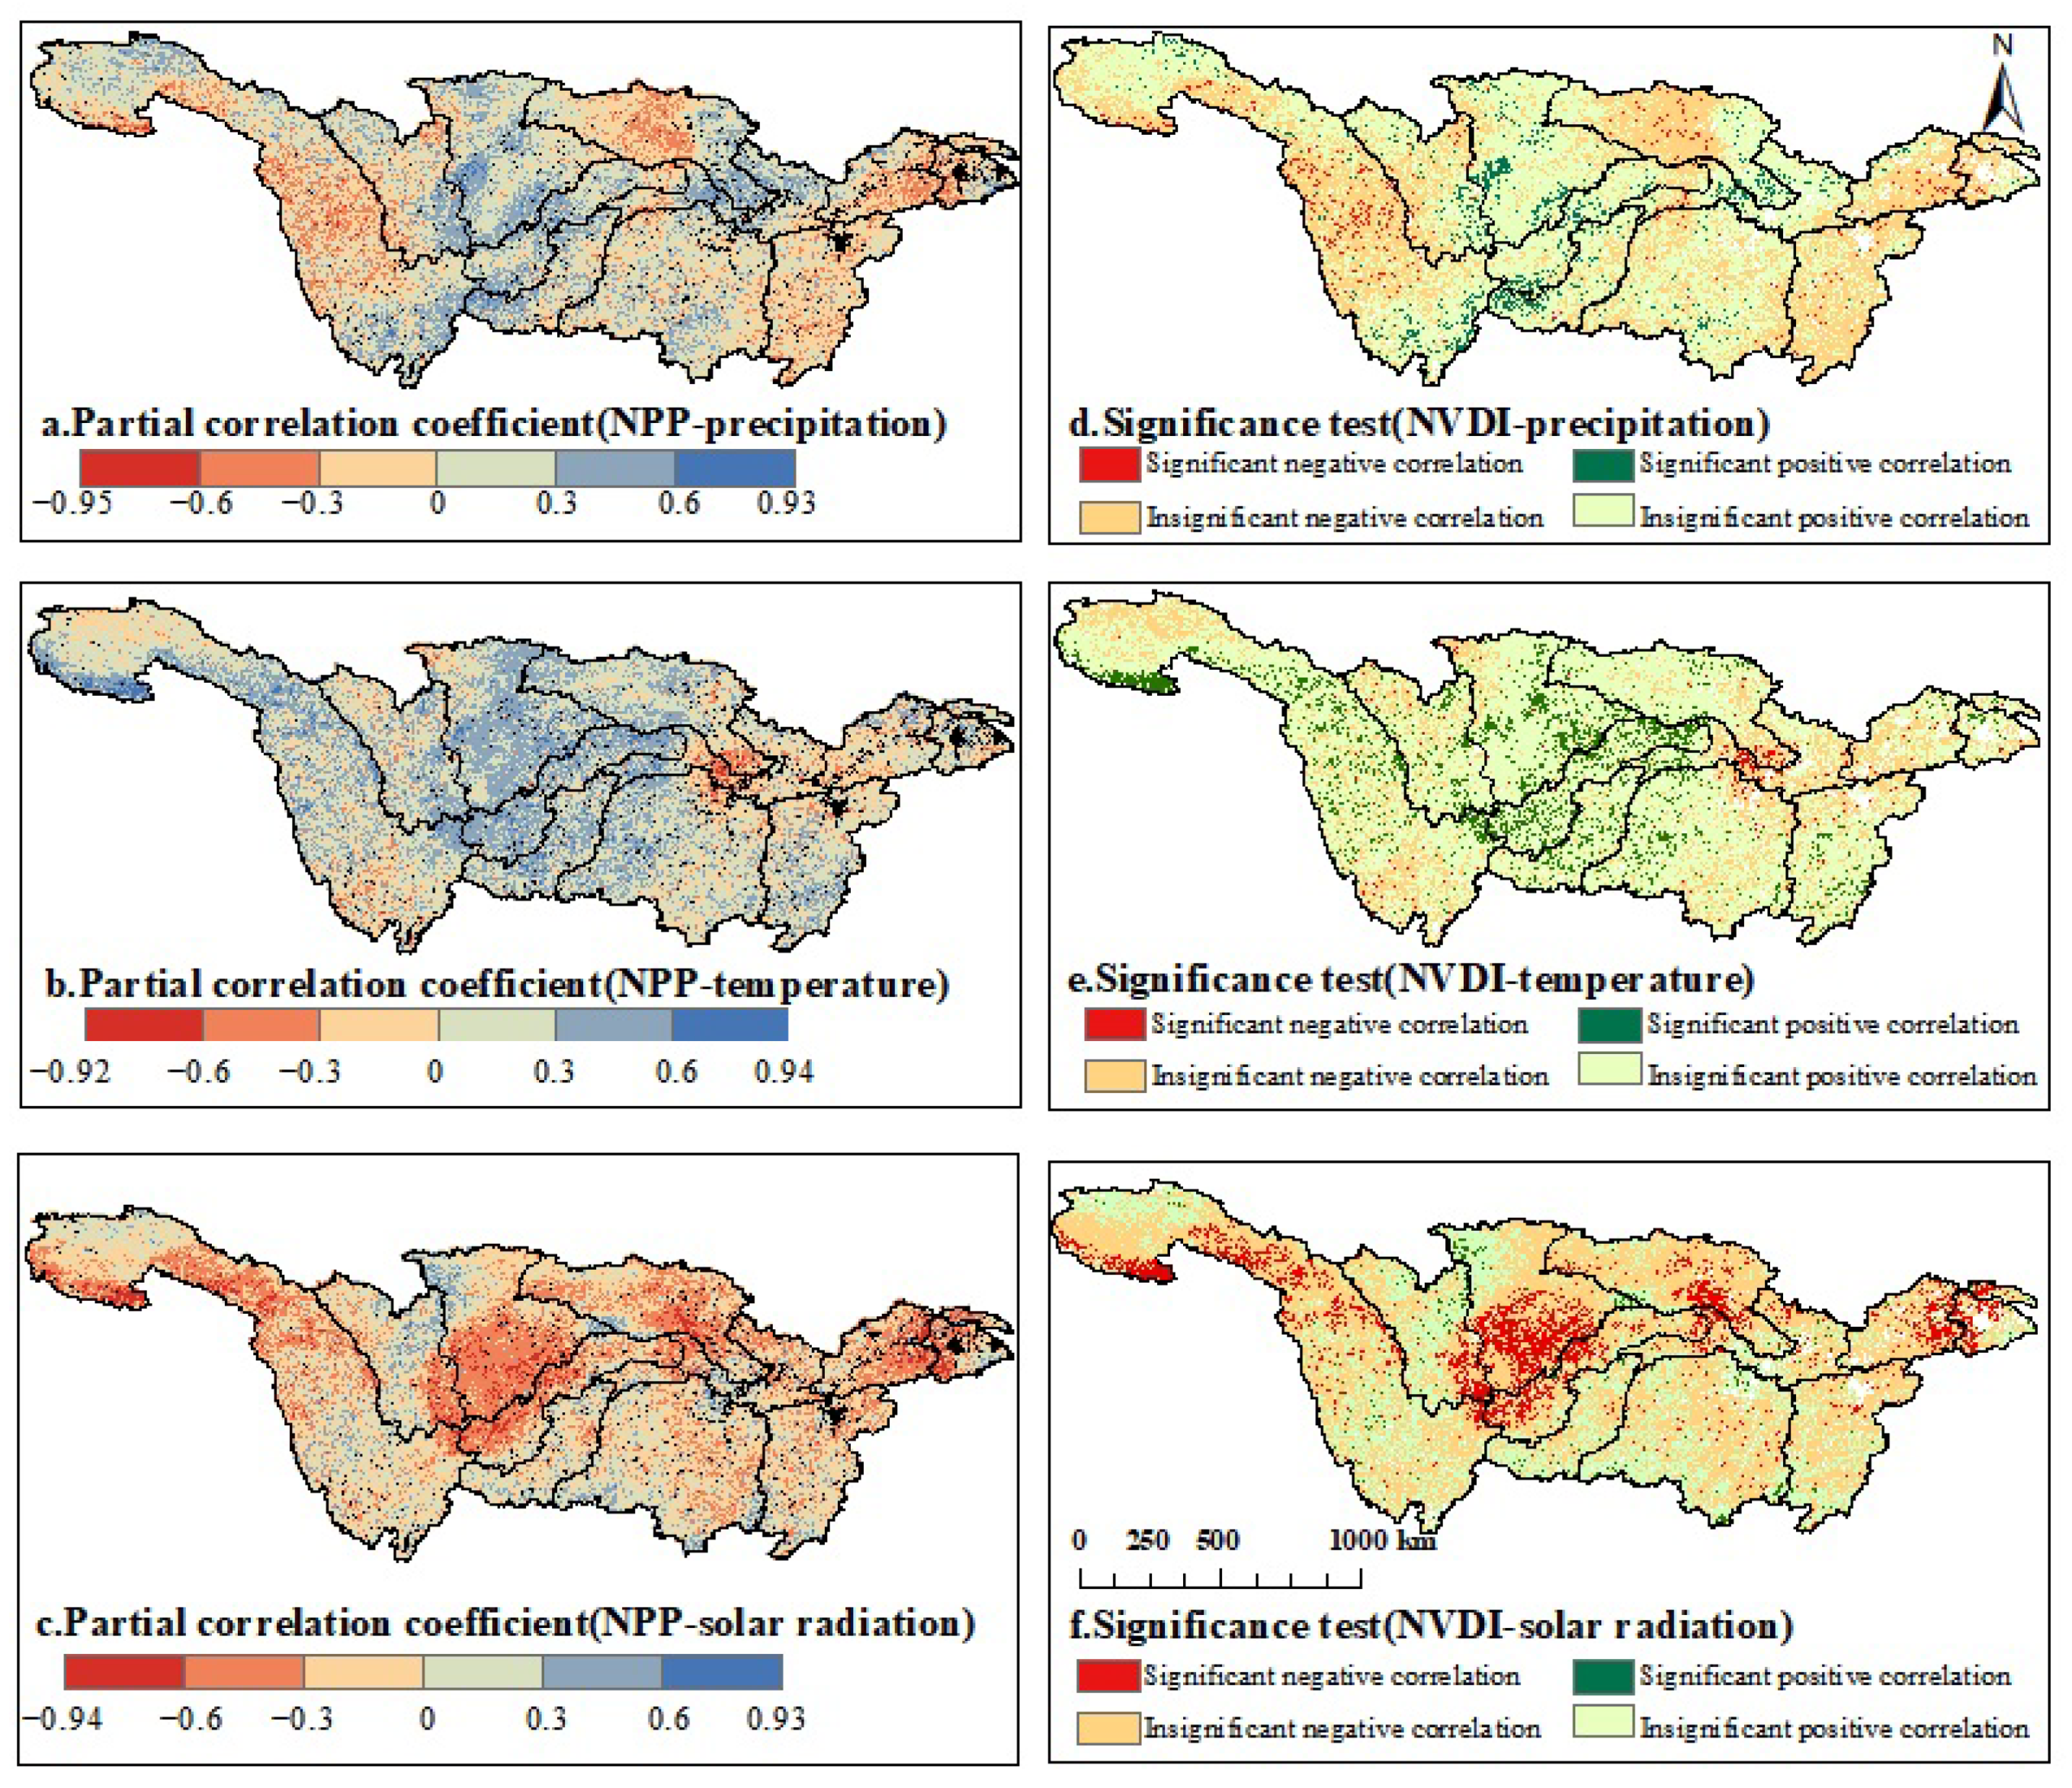
3.4.2. Partial Correlation Analysis between NPP and Climate Factors
3.5. Driving Mechanisms and Relative Contributions to NPP Variability
3.5.1. Driving Mechanisms of NPP Variability
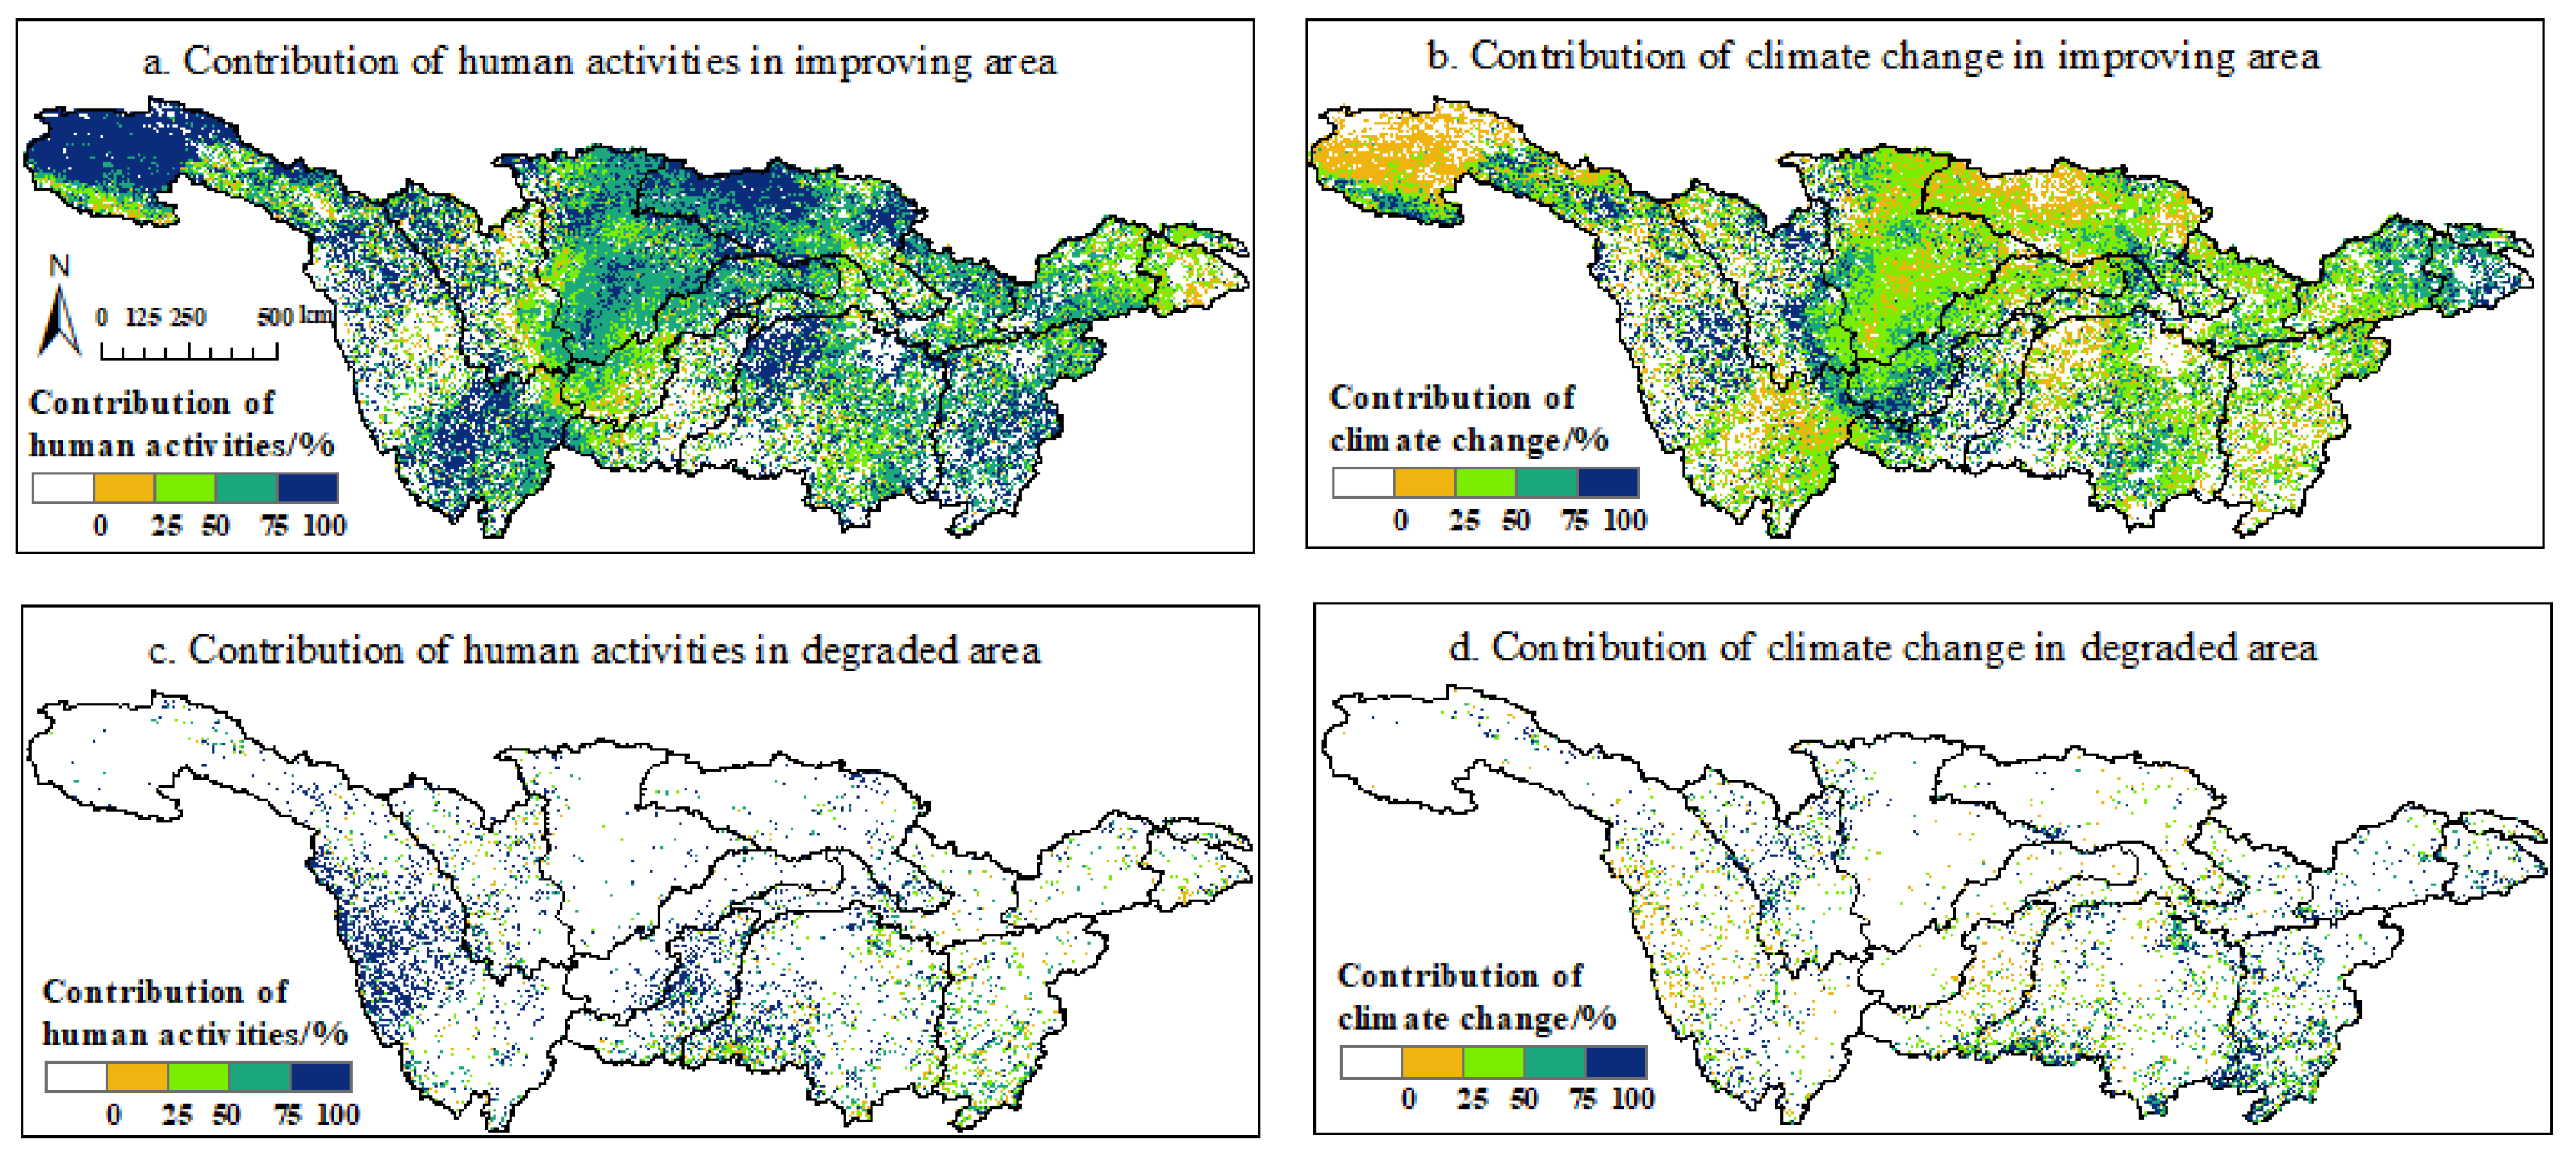
3.5.2. Relative Contributions of Different Influential Factors to NPP Variations
4. Discussion
4.1. Spatiotemporal Distribution and Change of NPP
4.2. Relationship between Affecting Factors and NPP
4.3. Limitations and Recommendations
5. Conclusions
Author Contributions
Funding
Acknowledgments
Conflicts of Interest
Abbreviations
| YRB | Yangtze River Basin |
| NPP | Net primary productivity |
| GPP | Gross primary productivity |
| GEE | Google Earth Engine |
References
- Sha, Z.; Bai, Y.; Li, R.; Lan, H.; Zhang, X.; Li, J.; Liu, X.; Chang, S.; Xie, Y. The global carbon sink potential of terrestrial vegetation can be increased substantially by optimal land management. Commun. Earth Environ. 2022, 3, 8. [Google Scholar] [CrossRef]
- Fernández-Martínez, M.; Sardans, J.; Chevallier, F.; Ciais, P.; Obersteiner, M.; Vicca, S.; Canadell, J.; Bastos, A.; Friedlingstein, P.; Sitch, S.; et al. Global trends in carbon sinks and their relationships with CO2 and temperature. Nat. Clim. Chang. 2019, 9, 73–79. [Google Scholar] [CrossRef]
- Qiao, Y.; Miao, S.; Li, Q.; Jin, J.; Luo, X.; Tang, C. Elevated CO2 and temperature increase grain oil concentration but their impacts on grain yield differ between soybean and maize grown in a temperate region. Sci. Total Environ. 2019, 666, 405–413. [Google Scholar] [CrossRef] [PubMed]
- Zhang, Y.; Liu, H.; Qi, J.; Feng, P.; Zhang, X.; Li Liu, D.; Marek, G.W.; Srinivasan, R.; Chen, Y. Assessing impacts of global climate change on water and food security in the black soil region of Northeast China using an improved SWAT-CO2 model. Sci. Total Environ. 2023, 857, 159482. [Google Scholar] [CrossRef] [PubMed]
- Xiao, D.; Li Liu, D.; Feng, P.; Wang, B.; Waters, C.; Shen, Y.; Qi, Y.; Bai, H.; Tang, J. Future climate change impacts on grain yield and groundwater use under different cropping systems in the North China Plain. Agric. Water Manag. 2021, 246, 106685. [Google Scholar] [CrossRef]
- Zhang, J.; Liu, M.; Zhang, M.; Yang, J.; Cao, R.; Malhi, S.S. Changes of vegetation carbon sequestration in the tableland of Loess Plateau and its influencing factors. Environ. Sci. Pollut. Res. 2019, 26, 22160–22172. [Google Scholar] [CrossRef] [PubMed]
- Schimel, D.S. Terrestrial ecosystems and the carbon cycle. Glob. Chang. Biol. 1995, 1, 77–91. [Google Scholar] [CrossRef]
- Tang, X.; Zhao, X.; Bai, Y.; Tang, Z.; Wang, W.; Zhao, Y.; Wan, H.; Xie, Z.; Shi, X.; Wu, B.; et al. Carbon pools in China’s terrestrial ecosystems: New estimates based on an intensive field survey. Proc. Natl. Acad. Sci. USA 2018, 115, 4021–4026. [Google Scholar] [CrossRef]
- Xu, L.; Shi, S.; Gong, W.; Shi, Z.; Qu, F.; Tang, X.; Chen, B.; Sun, J. Improving leaf chlorophyll content estimation through constrained PROSAIL model from airborne hyperspectral and LiDAR data. Int. J. Appl. Earth Obs. Geoinf. 2022, 115, 103128. [Google Scholar] [CrossRef]
- Joiner, J.; Yoshida, Y.; Zhang, Y.; Duveiller, G.; Jung, M.; Lyapustin, A.; Wang, Y.; Tucker, C.J. Estimation of terrestrial global gross primary production (GPP) with satellite data-driven models and eddy covariance flux data. Remote Sens. 2018, 10, 1346. [Google Scholar] [CrossRef]
- Cramer, W.; Kicklighter, D.W.; Bondeau, A.; Iii, B.M.; Churkina, G.; Nemry, B.; Ruimy, A.; Schloss, A.L.; NPP Model Intercomparison. Comparing global models of terrestrial net primary productivity (NPP): Overview and key results. Glob. Chang. Biol. 1999, 5, 1–15. [Google Scholar] [CrossRef]
- Zhou, G.; Zhang, X. A natural vegetation NPP model. Chin. J. Plant Ecol. 1995, 19, 193. [Google Scholar]
- Chen, T.; Tang, G.; Yuan, Y.; Guo, H.; Xu, Z.; Jiang, G.; Chen, X. Unraveling the relative impacts of climate change and human activities on grassland productivity in Central Asia over last three decades. Sci. Total Environ. 2020, 743, 140649. [Google Scholar] [CrossRef] [PubMed]
- Deng, Y.; Wang, X.; Wang, K.; Ciais, P.; Tang, S.; Jin, L.; Li, L.; Piao, S. Responses of vegetation greenness and carbon cycle to extreme droughts in China. Agric. For. Meteorol. 2021, 298, 108307. [Google Scholar] [CrossRef]
- Zhao, J.; Ma, J.; Zhu, Y. Evaluating impacts of climate change on net ecosystem productivity (NEP) of global different forest types based on an individual tree-based model FORCCHN and remote sensing. Glob. Planet. Chang. 2019, 182, 103010. [Google Scholar] [CrossRef]
- Pörtner, H.O.; Roberts, D.C.; Adams, H.; Adler, C.; Aldunce, P.; Ali, E.; Begum, R.A.; Betts, R.; Kerr, R.B.; Biesbroek, R.; et al. Climate Change 2022: Impacts, Adaptation and Vulnerability; IPCC: Geneva, Switzerland, 2022. [Google Scholar]
- Zhang, X.; Tarpley, D.; Sullivan, J.T. Diverse responses of vegetation phenology to a warming climate. Geophys. Res. Lett. 2007, 34. [Google Scholar] [CrossRef]
- Liu, Q.; Fu, Y.H.; Zeng, Z.; Huang, M.; Li, X.; Piao, S. Temperature, precipitation, and insolation effects on autumn vegetation phenology in temperate China. Glob. Chang. Biol. 2016, 22, 644–655. [Google Scholar] [CrossRef]
- Liu, Q.; Fu, Y.H.; Zhu, Z.; Liu, Y.; Liu, Z.; Huang, M.; Janssens, I.A.; Piao, S. Delayed autumn phenology in the Northern Hemisphere is related to change in both climate and spring phenology. Glob. Chang. Biol. 2016, 22, 3702–3711. [Google Scholar] [CrossRef] [PubMed]
- Xu, L.; Myneni, R.; Chapin Iii, F.; Callaghan, T.V.; Pinzon, J.; Tucker, C.J.; Zhu, Z.; Bi, J.; Ciais, P.; Tømmervik, H.; et al. Temperature and vegetation seasonality diminishment over northern lands. Nat. Clim. Chang. 2013, 3, 581–586. [Google Scholar] [CrossRef]
- Kitayama, K.; Ushio, M.; Aiba, S.I. Temperature is a dominant driver of distinct annual seasonality of leaf litter production of equatorial tropical rain forests. J. Ecol. 2021, 109, 727–736. [Google Scholar] [CrossRef]
- Papagiannopoulou, C.; Miralles, D.; Dorigo, W.A.; Verhoest, N.; Depoorter, M.; Waegeman, W. Vegetation anomalies caused by antecedent precipitation in most of the world. Environ. Res. Lett. 2017, 12, 074016. [Google Scholar] [CrossRef]
- Zeng, X.; Hu, Z.; Chen, A.; Yuan, W.; Hou, G.; Han, D.; Liang, M.; Di, K.; Cao, R.; Luo, D. The global decline in the sensitivity of vegetation productivity to precipitation from 2001 to 2018. Glob. Chang. Biol. 2022, 28, 6823–6833. [Google Scholar] [CrossRef] [PubMed]
- Zeppel, M.; Wilks, J.V.; Lewis, J.D. Impacts of extreme precipitation and seasonal changes in precipitation on plants. Biogeosciences 2014, 11, 3083–3093. [Google Scholar] [CrossRef]
- Chen, S.; Zhang, Y.; Wu, Q.; Liu, S.; Song, C.; Xiao, J.; Band, L.E.; Vose, J.M. Vegetation structural change and CO2 fertilization more than offset gross primary production decline caused by reduced solar radiation in China. Agric. For. Meteorol. 2021, 296, 108207. [Google Scholar] [CrossRef]
- Mitsch, W.J.; Gosselink, J.G. The value of wetlands: Importance of scale and landscape setting. Ecol. Econ. 2000, 35, 25–33. [Google Scholar] [CrossRef]
- Bai, Y.; Cotrufo, M.F. Grassland soil carbon sequestration: Current understanding, challenges, and solutions. Science 2022, 377, 603–608. [Google Scholar] [CrossRef]
- Landuyt, D.; De Lombaerde, E.; Perring, M.P.; Hertzog, L.R.; Ampoorter, E.; Maes, S.L.; De Frenne, P.; Ma, S.; Proesmans, W.; Blondeel, H.; et al. The functional role of temperate forest understorey vegetation in a changing world. Glob. Chang. Biol. 2019, 25, 3625–3641. [Google Scholar] [CrossRef]
- Qu, S.; Wang, L.; Lin, A.; Yu, D.; Yuan, M.; Li, C. Distinguishing the impacts of climate change and anthropogenic factors on vegetation dynamics in the Yangtze River Basin, China. Ecol. Indic. 2020, 108, 105724. [Google Scholar] [CrossRef]
- Zhang, W.; Wang, L.; Xiang, F.; Qin, W.; Jiang, W. Vegetation dynamics and the relations with climate change at multiple time scales in the Yangtze River and Yellow River Basin, China. Ecol. Indic. 2020, 110, 105892. [Google Scholar] [CrossRef]
- Qu, S.; Wang, L.; Lin, A.; Zhu, H.; Yuan, M. What drives the vegetation restoration in Yangtze River basin, China: Climate change or anthropogenic factors? Ecol. Indic. 2018, 90, 438–450. [Google Scholar] [CrossRef]
- Yuan, J.; Xu, Y.; Xiang, J.; Wu, L.; Wang, D. Spatiotemporal variation of vegetation coverage and its associated influence factor analysis in the Yangtze River Delta, eastern China. Environ. Sci. Pollut. Res. 2019, 26, 32866–32879. [Google Scholar] [CrossRef] [PubMed]
- Jiang, W.; Wang, L.; Feng, L.; Zhang, M.; Yao, R. Drought characteristics and its impact on changes in surface vegetation from 1981 to 2015 in the Yangtze River Basin, China. Int. J. Climatol. 2020, 40, 3380–3397. [Google Scholar] [CrossRef]
- Cui, L.; Wang, L.; Singh, R.P.; Lai, Z.; Jiang, L.; Yao, R. Association analysis between spatiotemporal variation of vegetation greenness and precipitation/temperature in the Yangtze River Basin (China). Environ. Sci. Pollut. Res. 2018, 25, 21867–21878. [Google Scholar] [CrossRef] [PubMed]
- Yang, H.; Zhong, X.; Deng, S.; Xu, H. Assessment of the impact of LUCC on NPP and its influencing factors in the Yangtze River basin, China. Catena 2021, 206, 105542. [Google Scholar] [CrossRef]
- Wang, J.; Delang, C.O.; Hou, G.; Gao, L.; Lu, X. Net primary production increases in the Yangtze River Basin within the latest two decades. Glob. Ecol. Conserv. 2021, 26, e01497. [Google Scholar] [CrossRef]
- Zhang, F.; Zhang, Z.; Kong, R.; Chang, J.; Tian, J.; Zhu, B.; Jiang, S.; Chen, X.; Xu, C.Y. Changes in forest net primary productivity in the Yangtze River Basin and its relationship with climate change and human activities. Remote Sens. 2019, 11, 1451. [Google Scholar] [CrossRef]
- Mhawej, M.; Abunnasr, Y. Daily Ten-ST-GEE: An open access and fully automated 10-m LST downscaling system. Comput. Geosci. 2022, 168, 105220. [Google Scholar] [CrossRef]
- Dalponte, M.; Jucker, T.; Liu, S.; Frizzera, L.; Gianelle, D. Characterizing forest carbon dynamics using multi-temporal lidar data. Remote Sens. Environ. 2019, 224, 412–420. [Google Scholar] [CrossRef]
- Elnashar, A.; Zeng, H.; Wu, B.; Gebremicael, T.G.; Marie, K. Assessment of environmentally sensitive areas to desertification in the Blue Nile Basin driven by the MEDALUS-GEE framework. Sci. Total Environ. 2022, 815, 152925. [Google Scholar] [CrossRef]
- Bai, Y.; Li, S.; Liu, M.; Guo, Q. Assessment of vegetation change on the Mongolian Plateau over three decades using different remote sensing products. J. Environ. Manag. 2022, 317, 115509. [Google Scholar] [CrossRef]
- Pei, H.; Liu, M.; Jia, Y.; Zhang, H.; Li, Y.; Xiao, Y. The trend of vegetation greening and its drivers in the Agro-pastoral ecotone of northern China, 2000–2020. Ecol. Indic. 2021, 129, 108004. [Google Scholar] [CrossRef]
- Li, J.; Wang, J.; Zhang, J.; Zhang, J.; Kong, H. Dynamic changes of vegetation coverage in China-Myanmar economic corridor over the past 20 years. Int. J. Appl. Earth Obs. Geoinf. 2021, 102, 102378. [Google Scholar] [CrossRef]
- Gu, Z.; Duan, X.; Shi, Y.; Li, Y.; Pan, X. Spatiotemporal variation in vegetation coverage and its response to climatic factors in the Red River Basin, China. Ecol. Indic. 2018, 93, 54–64. [Google Scholar] [CrossRef]
- Zhai, X.; Liang, X.; Yan, C.; Xing, X.; Jia, H.; Wei, X.; Feng, K. Vegetation dynamic changes and their response to ecological engineering in the Sanjiangyuan Region of China. Remote Sens. 2020, 12, 4035. [Google Scholar] [CrossRef]
- Yang, W.; Qi, W. Spatial-temporal dynamic monitoring of vegetation recovery after the Wenchuan earthquake. IEEE J. Sel. Top. Appl. Earth Obs. Remote Sens. 2016, 10, 868–876. [Google Scholar] [CrossRef]
- Yi, L.; Sun, Y.; Ouyang, X.; Yin, S. Identifying the Impacts of Climate Change and Human Activities on Vegetation Cover Changes: A Case Study of the Yangtze River Basin, China. Int. J. Environ. Res. Public Health 2022, 19, 6239. [Google Scholar] [CrossRef]
- Zhang, L.; Luo, H.; Zhang, X. Land-Greening Hotspot Changes in the Yangtze River Economic Belt during the Last Four Decades and Their Connections to Human Activities. Land 2022, 11, 605. [Google Scholar] [CrossRef]
- Zhang, M.; Liu, H.; Wang, K.; Chen, Y.; Ren, Y.; Yue, Y.; Deng, Z.; Zhang, C. Nonlinear trends of vegetation changes in different geomorphologic zones and land use types of the Yangtze River basin, China. Land Degrad. Dev. 2023, 34, 2548–2559. [Google Scholar] [CrossRef]
- Schloss, A.; Kicklighter, D.; Kaduk, J.; Wittenberg, U.; Intercomparison, T.P.O.T.P.N.M. Comparing global models of terrestrial net primary productivity (NPP): Comparison of NPP to climate and the Normalized Difference Vegetation Index (NDVI). Glob. Chang. Biol. 1999, 5, 25–34. [Google Scholar] [CrossRef]
- Meng, Y.; Hu, Z.; Chen, X.; Yao, J. Subtracted histogram: Utilizing mutual relation between features for thresholding. IEEE Trans. Geosci. Remote Sens. 2018, 56, 7415–7435. [Google Scholar] [CrossRef]
- Shi, S.; Xu, L.; Gong, W.; Chen, B.; Chen, B.; Qu, F.; Tang, X.; Sun, J.; Yang, J. A convolution neural network for forest leaf chlorophyll and carotenoid estimation using hyperspectral reflectance. Int. J. Appl. Earth Obs. Geoinf. 2022, 108, 102719. [Google Scholar] [CrossRef]
- Shi, S.; Chen, B.; Bi, S.; Li, J.; Gong, W.; Sun, J.; Chen, B.; Du, L.; Yang, J.; Xu, Q.; et al. A spatial–spectral classification framework for multispectral LiDAR. Geo-Spat. Inf. Sci. 2023, 1–15. [Google Scholar] [CrossRef]
- Cui, L.; Chen, Y.; Yuan, Y.; Luo, Y.; Huang, S.; Li, G. Comprehensive evaluation system for vegetation ecological quality: A case study of Sichuan ecological protection redline areas. Front. Plant Sci. 2023, 14, 1178485. [Google Scholar] [CrossRef] [PubMed]
- Wang, G.; Peng, W.; Zhang, L.; Zhang, J.; Xiang, J. Vegetation EVI Changes and Response to Natural Factors and Human Activities Based on Geographically and Temporally Weighted Regression. Glob. Ecol. Conserv. 2023, 45, e02531. [Google Scholar] [CrossRef]
- Zhang, J.; Zhang, Y.; Sun, G.; Song, C.; Dannenberg, M.P.; Li, J.; Liu, N.; Zhang, K.; Zhang, Q.; Hao, L. Vegetation greening weakened the capacity of water supply to China’s South-to-North Water Diversion Project. Hydrol. Earth Syst. Sci. 2021, 25, 5623–5640. [Google Scholar] [CrossRef]
- He, X.; Yu, Y.; Cui, Z.; He, T. Climate change and ecological projects jointly promote vegetation restoration in three-river source region of China. Chin. Geogr. Sci. 2021, 31, 1108–1122. [Google Scholar] [CrossRef]
- Zhao, J.; Zhang, Q.; Wang, D.; Wu, W.; Yuan, R. Machine learning-based evaluation of susceptibility to geological hazards in the Hengduan mountains region, China. Int. J. Disaster Risk Sci. 2022, 13, 305–316. [Google Scholar] [CrossRef]
- Fan, X.; Scaringi, G.; Korup, O.; West, A.J.; van Westen, C.J.; Tanyas, H.; Hovius, N.; Hales, T.C.; Jibson, R.W.; Allstadt, K.E.; et al. Earthquake-induced chains of geologic hazards: Patterns, mechanisms, and impacts. Rev. Geophys. 2019, 57, 421–503. [Google Scholar] [CrossRef]
- Liu, Y.; Liu, R.; Ge, Q. Evaluating the vegetation destruction and recovery of Wenchuan earthquake using MODIS data. Nat. Hazards 2010, 54, 851–862. [Google Scholar] [CrossRef]
- Cui, P.; Lin, Y.m.; Chen, C. Destruction of vegetation due to geo-hazards and its environmental impacts in the Wenchuan earthquake areas. Ecol. Eng. 2012, 44, 61–69. [Google Scholar] [CrossRef]
- Wang, J.; Wang, Z.; Cheng, H.; Kang, J.; Liu, X. Land Cover Changing Pattern in Pre-and Post-Earthquake Affected Area from Remote Sensing Data: A Case of Lushan County, Sichuan Province. Land 2022, 11, 1205. [Google Scholar] [CrossRef]
- Xiang, M.; Deng, Q.; Duan, L.; Yang, J.; Wang, C.; Liu, J.; Liu, M. Dynamic monitoring and analysis of the earthquake Worst-hit area based on remote sensing. Alex. Eng. J. 2022, 61, 8691–8702. [Google Scholar] [CrossRef]
- Ding, Y.; Li, Z.; Peng, S. Global analysis of time-lag and-accumulation effects of climate on vegetation growth. Int. J. Appl. Earth Obs. Geoinf. 2020, 92, 102179. [Google Scholar] [CrossRef]
- Jin, H.; Wang, S.; Yan, P.; Qiao, L.; Sun, L.; Zhang, L. Spatial and temporal characteristics of surface solar radiation in China and its influencing factors. Front. Environ. Sci. 2022, 10, 916748. [Google Scholar] [CrossRef]
- Ge, W.; Deng, L.; Wang, F.; Han, J. Quantifying the contributions of human activities and climate change to vegetation net primary productivity dynamics in China from 2001 to 2016. Sci. Total Environ. 2021, 773, 145648. [Google Scholar] [CrossRef]
- Xiaoci, W.; Shuangjun, L.; Yingjie, M. Characteristics and difference analysis of main rainstorm processes in Yangtze River Basin from June to July during 2016–2020. J. Arid. Meteorol. 2021, 39, 921. [Google Scholar]
- Zhang, Y.; Liu, S.; Xu, J.; Shangguan, D. Glacier change and glacier runoff variation in the Tuotuo River basin, the source region of Yangtze River in western China. Environ. Geol. 2008, 56, 59–68. [Google Scholar] [CrossRef]
- Yin, J.; Yao, M.; Yuan, Z.; Yu, G.; Xiaofan, L.; Qi, L. Spatial-temporal variations in vegetation and their responses to climatic and anthropogenic factors in upper reaches of the Yangtze River during 2000 to 2019. Watershed Ecol. Environ. 2023, 5, 114–124. [Google Scholar] [CrossRef]
- Cao, Y.; Wang, Y.; Li, G.; Fang, X. Vegetation response to urban landscape spatial pattern change in the Yangtze River Delta, China. Sustainability 2019, 12, 68. [Google Scholar] [CrossRef]
- Peng, W.; Kuang, T.; Tao, S. Quantifying influences of natural factors on vegetation NDVI changes based on geographical detector in Sichuan, western China. J. Clean. Prod. 2019, 233, 353–367. [Google Scholar] [CrossRef]
- Yang, S.; Liu, J.; Wang, C.; Zhang, T.; Dong, X.; Liu, Y. Vegetation dynamics influenced by climate change and human activities in the Hanjiang River Basin, central China. Ecol. Indic. 2022, 145, 109586. [Google Scholar] [CrossRef]
- Michaletz, S.T.; Cheng, D.; Kerkhoff, A.J.; Enquist, B.J. Convergence of terrestrial plant production across global climate gradients. Nature 2014, 512, 39–43. [Google Scholar] [CrossRef] [PubMed]
- Staal, A.; Fetzer, I.; Wang-Erlandsson, L.; Bosmans, J.H.; Dekker, S.C.; van Nes, E.H.; Rockström, J.; Tuinenburg, O.A. Hysteresis of tropical forests in the 21st century. Nat. Commun. 2020, 11, 4978. [Google Scholar] [CrossRef] [PubMed]


| Absolute Value of Z | Reliability |
|---|---|
| ≥1.65 | 90% |
| ≥1.96 | 95% |
| ≥1.96 | 99% |
| Driving Factor | Relative Contribution/% | ||||
|---|---|---|---|---|---|
| Climate Change | Human Activities | ||||
| >0 | >0 | Double-driven improvement | |||
| >0 | >0 | <0 | human-driven improvement | 100 | 0 |
| <0 | >0 | climate-driven improvement | 0 | 100 | |
| <0 | <0 | Double-driven degradation | |||
| <0 | <0 | >0 | human-driven degradation | 100 | 0 |
| >0 | <0 | climate-driven degradation | 0 | 100 | |
| Coefficient of Variation | Stability | Area Ratio |
|---|---|---|
| High stability, low volatility | 6.99% | |
| Higher stability, relatively low volatility | 55.37% | |
| Medium stability | 35.42% | |
| lower stability, relatively high volatility | 1.92% | |
| low stability, high volatility | 0.29% |
Disclaimer/Publisher’s Note: The statements, opinions and data contained in all publications are solely those of the individual author(s) and contributor(s) and not of MDPI and/or the editor(s). MDPI and/or the editor(s) disclaim responsibility for any injury to people or property resulting from any ideas, methods, instructions or products referred to in the content. |
© 2023 by the authors. Licensee MDPI, Basel, Switzerland. This article is an open access article distributed under the terms and conditions of the Creative Commons Attribution (CC BY) license (https://creativecommons.org/licenses/by/4.0/).
Share and Cite
Liu, C.; Shi, S.; Wang, T.; Gong, W.; Xu, L.; Shi, Z.; Du, J.; Qu, F. Analysis of Net Primary Productivity Variation and Quantitative Assessment of Driving Forces—A Case Study of the Yangtze River Basin. Plants 2023, 12, 3412. https://doi.org/10.3390/plants12193412
Liu C, Shi S, Wang T, Gong W, Xu L, Shi Z, Du J, Qu F. Analysis of Net Primary Productivity Variation and Quantitative Assessment of Driving Forces—A Case Study of the Yangtze River Basin. Plants. 2023; 12(19):3412. https://doi.org/10.3390/plants12193412
Chicago/Turabian StyleLiu, Chenxi, Shuo Shi, Tong Wang, Wei Gong, Lu Xu, Zixi Shi, Jie Du, and Fangfang Qu. 2023. "Analysis of Net Primary Productivity Variation and Quantitative Assessment of Driving Forces—A Case Study of the Yangtze River Basin" Plants 12, no. 19: 3412. https://doi.org/10.3390/plants12193412
APA StyleLiu, C., Shi, S., Wang, T., Gong, W., Xu, L., Shi, Z., Du, J., & Qu, F. (2023). Analysis of Net Primary Productivity Variation and Quantitative Assessment of Driving Forces—A Case Study of the Yangtze River Basin. Plants, 12(19), 3412. https://doi.org/10.3390/plants12193412