Article

Analysis of the Tomato mTERF Gene Family and Study of the Stress Resistance Function of SLmTERF-13

1
Tomato Research Institute, College of Horticulture and Landscape Architecture, Northeast Agricultural University, Harbin 150030, China
2
Key Laboratory of Biology and Genetic Improvement of Horticultural Crops (Northeast Region), Ministry of Agriculture and Rural Affairs, Northeast Agricultural University, Harbin 150030, China
*
Authors to whom correspondence should be addressed.
Plants 2023, 12(15), 2862; https://doi.org/10.3390/plants12152862
Submission received: 7 July 2023 / Revised: 26 July 2023 / Accepted: 2 August 2023 / Published: 3 August 2023
(This article belongs to the Special Issue Molecular Basis of Crops and Fruit Plants in Response to Stress)

Abstract

:
Mitochondrial transcription termination factor (mTERF) is a DNA-binding protein that is encoded by nuclear genes, ultimately functions in mitochondria and can affect gene expression. By combining with mitochondrial nucleic acids, mTERF regulates the replication, transcription and translation of mitochondrial genes and plays an important role in the response of plants to abiotic stress. However, there are few studies on mTERF genes in tomato, which limits the in-depth study and utilization of mTERF family genes in tomato stress resistance regulation. In this study, a total of 28 mTERF gene family members were obtained through genome-wide mining and identification of the tomato mTERF gene family. Bioinformatics analysis showed that all members of the family contained environmental stress or hormone response elements. Gene expression pattern analysis showed that the selected genes had different responses to drought, high salt and low temperature stress. Most of the genes played key roles under drought and salt stress, and the response patterns were more similar. The VIGS method was used to silence the SLmTERF13 gene, which was significantly upregulated under drought and salt stress, and it was found that the resistance ability of silenced plants was decreased under both kinds of stress, indicating that the SLmTERF13 gene was involved in the regulation of the tomato abiotic stress response. These results provide important insights for further evolutionary studies and contribute to a better understanding of the role of the mTERF genes in tomato growth and development and abiotic stress response, which will ultimately play a role in future studies of tomato gene function.

1. Introduction

The most obvious difference between eukaryotes and prokaryotes is the presence or absence of organelles. Most of the organelle genes in chloroplasts and mitochondria have been transferred to the nucleus or lost during evolution from their bacterial progenitors in different plant species; nowadays, only a few genes related to photosynthesis, electron transport chains, and gene expression remain in chloroplasts and mitochondria [1,2]. Most of the proteins contained in mitochondria and chloroplasts are encoded by nuclear genes, and organellar gene expression (OGE) requires the regulation of nuclear gene proteins. Mitochondrial transcription termination factor (mTERF) is a DNA-binding protein encoded by a nuclear gene, contains an mTERF motif (composed of 30 tandem repeats of amino acid residues, including three leucine zipper-like structures), and functions in mitochondria [3]. This protein can combine with mitochondrial nucleic acids and plays a regulatory role in mitochondrial gene replication, transcription and translation [4]. By separating and purifying human mitochondrial lysates, Kruse et al. [5] first discovered mTERF, which can promote the termination of mitochondrial DNA (mtDNA) transcription. Since then, more mTERF genes have been found in animals and plants. In metazoans and plants, mTERF can be divided into four subfamilies, named mTERF1–mTERF4 [3,6]. But there are more mTERF gene family members in terrestrial plants than in animals, with approximately 30 members currently present in the former [4,7]. For example, 35 mTERFs have been identified in Arabidopsis and pepper, and 33, 31, and 25 mTERFs exist in rice, corn, and grape, respectively [8,9,10,11].
Members of the mTERF family of plants can regulate the function of mitochondrial and chloroplast genes and play an important role in biological evolution, plant growth and development, and stress resistance, functioning in mitochondria and chloroplasts [3,12,13]. For example, Chlamydomonas contains a family of MOC proteins (MOC1~MOC6) with characteristics similar to those of mTERF. One study found that if MOC1 was missing, the stability of the mitochondrial respiratory chain complex was disrupted, leading to termination of mtDNA transcription [14]. In Arabidopsis, mTERF5 and PED191 (mTERF6) are in chloroplasts. The deletion of mTERF5 enhances the tolerance of plants to salt stress, weakens the sensitivity of plants to abscisic acid (ABA), and lightens the color of plant leaves, stems, and sepals [15]. Early chloroplast development of PED191 mutants is hindered, resulting in albinism of seedlings and seedling death [16,17]. Deletion of mTERF18, which localizes in mitochondria, leads to the enhanced heat tolerance of Arabidopsis thaliana plants and increases the expression of multiple stress response genes, and the leaves become dark green [18]. Zm-TERF4 in the chloroplast matrix of maize has been shown to react with multiple introns in chloroplast genes by immunoprecipitation. The deletion of this gene leads to the deletion of ribosomes in the plastids, and homozygous Zm-TERF4 mutants die when they reach the 3~4-leaf stage [19].
Tomato has rich nutritional value and unique flavor and is of the horticultural crop varieties, and the fruit contains a variety of vitamins, carotenoids, phenolic amino acids, and minerals [20]. In addition, tomato has high economic value and medicinal value, with anti-inflammatory, antioxidant, anti-cancer, and other effects and has been widely cultivated around the world [21,22]. mTERF plays an important role in plant growth, development, and stress response. At present, the mTERF gene family has been studied in Arabidopsis, maize, and other crop species. However, whether mTERF gene can have a regulatory effect on growth and development and stress in tomato remains to be studied. Therefore, in this study, the whole genome of tomato was mined for mTERF gene family members using bioinformatics methods, and relevant structure and function prediction analyses of the family members were carried out. Moreover, through the analysis of the expression pattern of the stress response and the preliminary functional study of key response genes, the role of this family gene in the regulation of the tomato stress resistance response was clarified, which laid the foundation for the application of these family members in the genetic improvement of tomato stress resistance.

2. Results

2.1. Identification of mTERF Gene Family Members and Construction of an Evolutionary Tree of Tomato

Based on HMM and structure domain analysis, a total of 28 mTERF genes were identified, named SLmTERF1SLmTERF28, and the basic information of these gene family members is shown in Table 1. As shown in the table, the sequence length of mTERF proteins is between 202 (SLmTERF19) and 1222 (SLmTERF20) amino acids. The relative molecular weight of the proteins ranges from 24,224.60 (SLmTERF19) to 134,350.96 (SLmTERF20) Da, and the theoretical isoelectric point ranges from 5.67 to 9.78. The minimum aliphatic amino acid index is 38.02 (SLmTERF20), and the maximum is 110.59 (SLmTERF25). The analysis of the instability coefficient of encoded proteins showed that 11 mTERFs were stable proteins (instability coefficient < 40), and the rest were unstable proteins. The results of the neural algorithm network (Figure S1) showed that only the SLmTERF3 protein had a signal peptide sequence, and the splicing site was most likely located at amino acid positions 18–19, indicating that the SLmTERF3 protein may play a role in signal recognition in transmembrane transport.
To explore the evolutionary relationship between the mTERF gene families of tomato and Arabidopsis, MEGA 7 software was used to construct a phylogenetic tree (Figure 1). As shown in the figure, 45 mTERFs were divided into six groups, named groups 1–6. Among them, group 1 and group 6 had the largest number of SLmTERF members—10. Group 2 and group 3 contained three SLmTERFs. Group 4 and group 5 each contained only one SLmTERF.

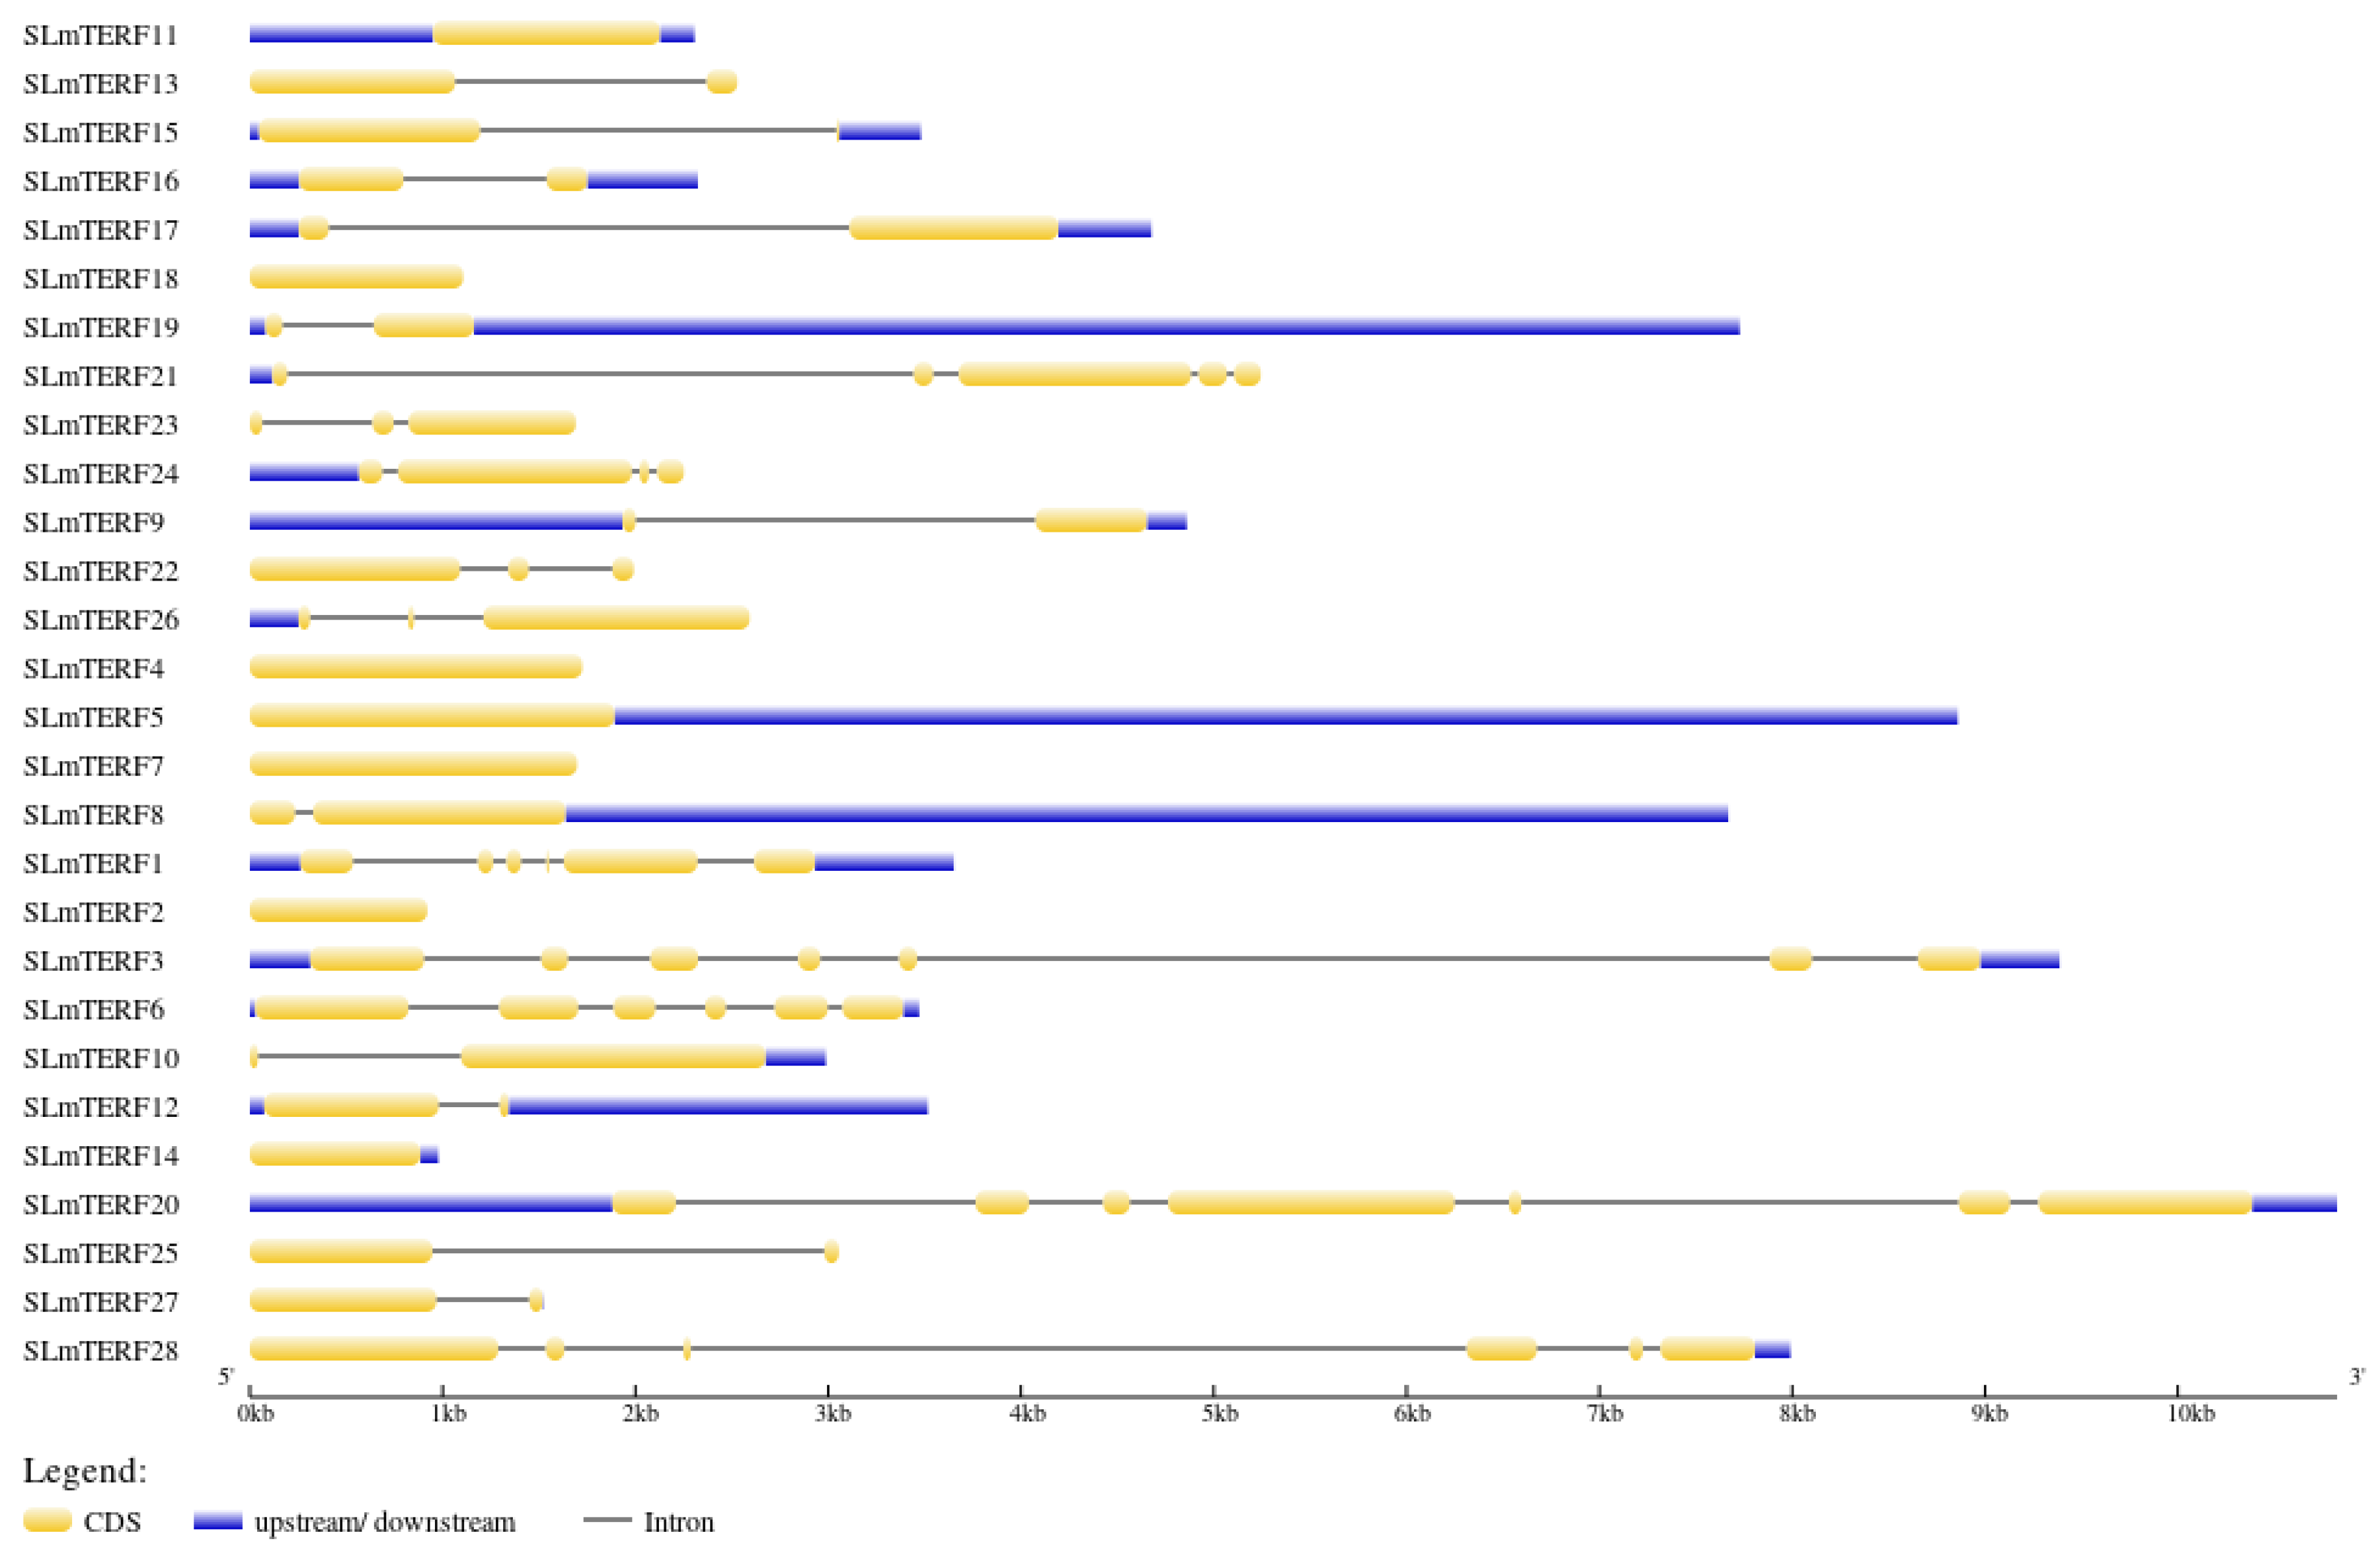
2.2. mTERF Gene Structure, Protein Secondary Structure, and Motif Analysis in Tomato

The results of gene structure mapping are shown in Figure 2. The number of exons in the 28 tomato mTERF genes ranged from 1 to 7. Only SLmTERF2, SLmTERF4, SLmTERF5, SLmTERF7, SLmTERF11, SLmTERF14, and SLmTERF18 have no introns, and the number of introns in genes with introns ranges from 1 to 6. The results of protein secondary structure analysis are shown in Table 2. Tomato mTERF proteins have α helices, extended chains, and random coils, among which α helices and random coils account for the largest proportion. The tomato mTERF protein conserved motif information is shown in Figure 3. As shown in the figure, a total of 13 motifs were identified in tomato mTERFs. Among them, the members of the G3 group all have motif 1, motif 2, motif 7, motif 8, and motif 11.

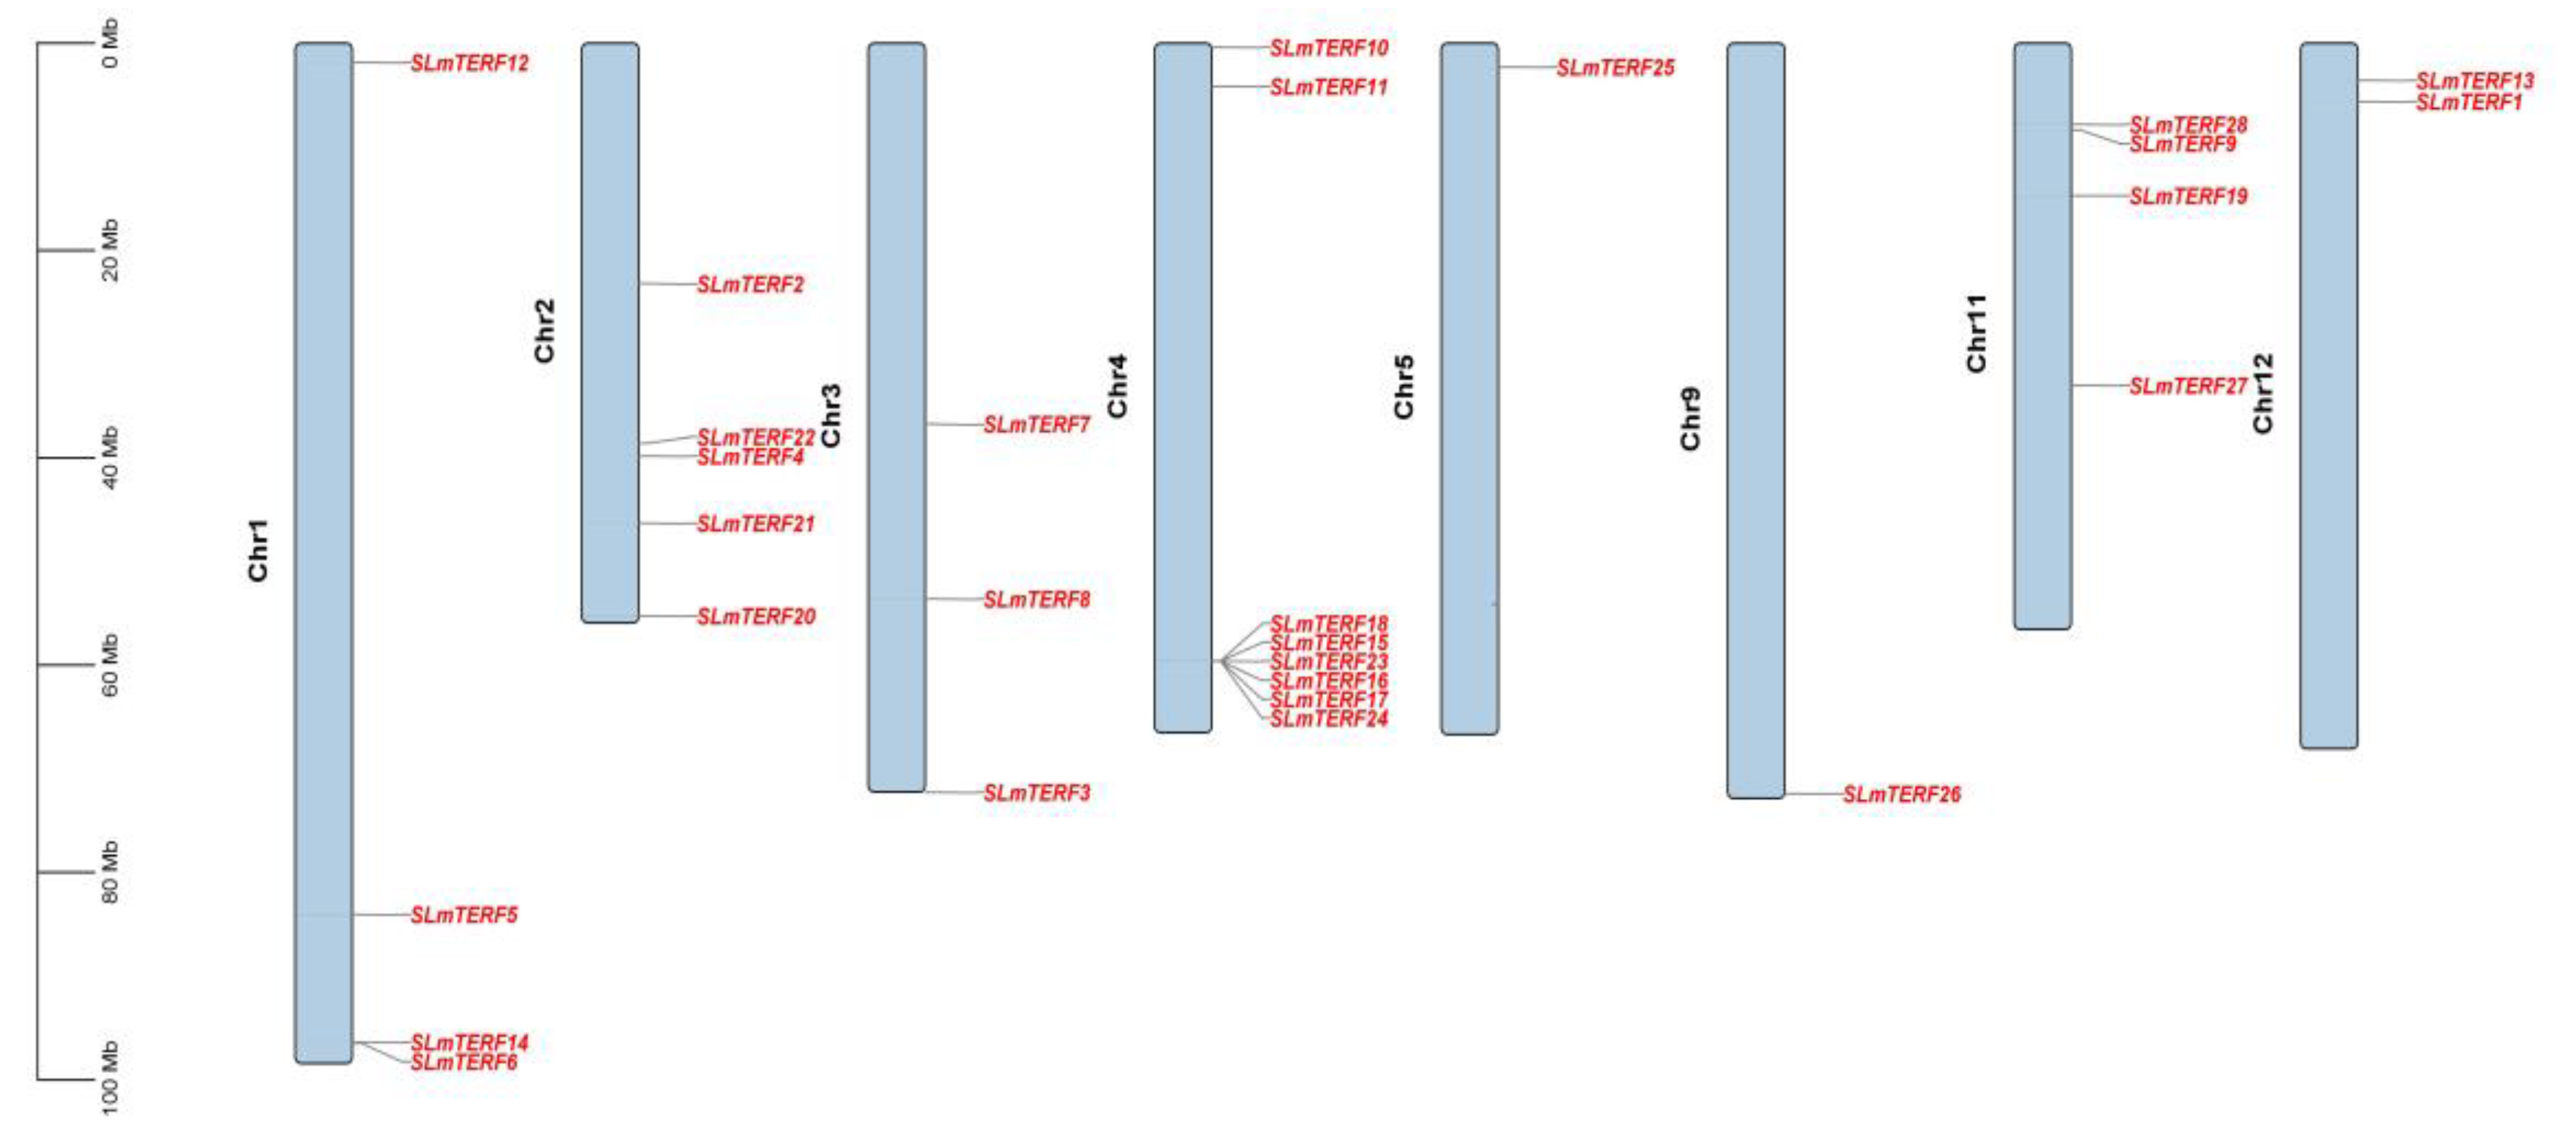
2.3. Chromosome Localization Prediction, Subcellular Localization, and Cis-Acting Element Analysis

The chromosome localization results are shown in Figure 4; the 28 tomato mTERF genes showed uneven distribution across the chromosomes. Chromosome 4 contained the largest number of genes—a total of eight—and showed coaggregation, which may be related to the tandem duplication of chromosomes; chromosome 5 and chromosome 9 each contained one gene; chromosome 1 and chromosome 11 had four genes; and chromosome 2, chromosome 3, and chromosome 12 contained five, three, and two genes, respectively. As shown in Table S1, a total of 15 SLmTERF proteins were in mitochondria or chloroplasts, and these SLmTERFs may play a role in regulating mitochondrial and chloroplast genes. In addition, the remaining 13 SLmTERF proteins were in other locations. The specific location of these proteins needs to be verified by further experiments. Figure 5 shows the analysis results of cis-acting elements. As shown in the figure, the members of the tomato mTERF gene family contain abiotic stress-responsive elements such as those corresponding to light, salt stress, drought, and low temperature. In addition, it also has responsive elements such as hormones (ABA, GA, MeJA, IAA), circadian rhythm, defense, and stress. The results indicated that tomato mTERFs may play a regulatory role in tomato growth and development and the response to abiotic stress.

2.4. Tissue Specificity Analysis of the mTERF Gene in Tomato

The specific expression of genes at different stages of plant growth regulates the normal growth and development of plants. Figure 6 shows the expression heatmap of 15 typical SLmTERF genes in different tissues constructed. These 15 genes were expressed to different degrees in the five tissues, and the differences were significant. Compared with other genes, SLmTERF6 and SLmTERF21 were expressed significantly in tomato fruit. The expression of SLmTERF28 was the highest in the flowers. SLmTERF21 and SLmTERF28 were highly expressed in the roots. The expression of SLmTERF4 and SLmTERF13 in the leaves was significant. The expression of SLmTERF17 and SLmTERF18 in the stems was weakly significant. We hypothesize that these significantly expressed mTERF genes maintain normal plant growth and development by affecting mitochondrial or chloroplast gene replication, transcription, or translation in different tissues.

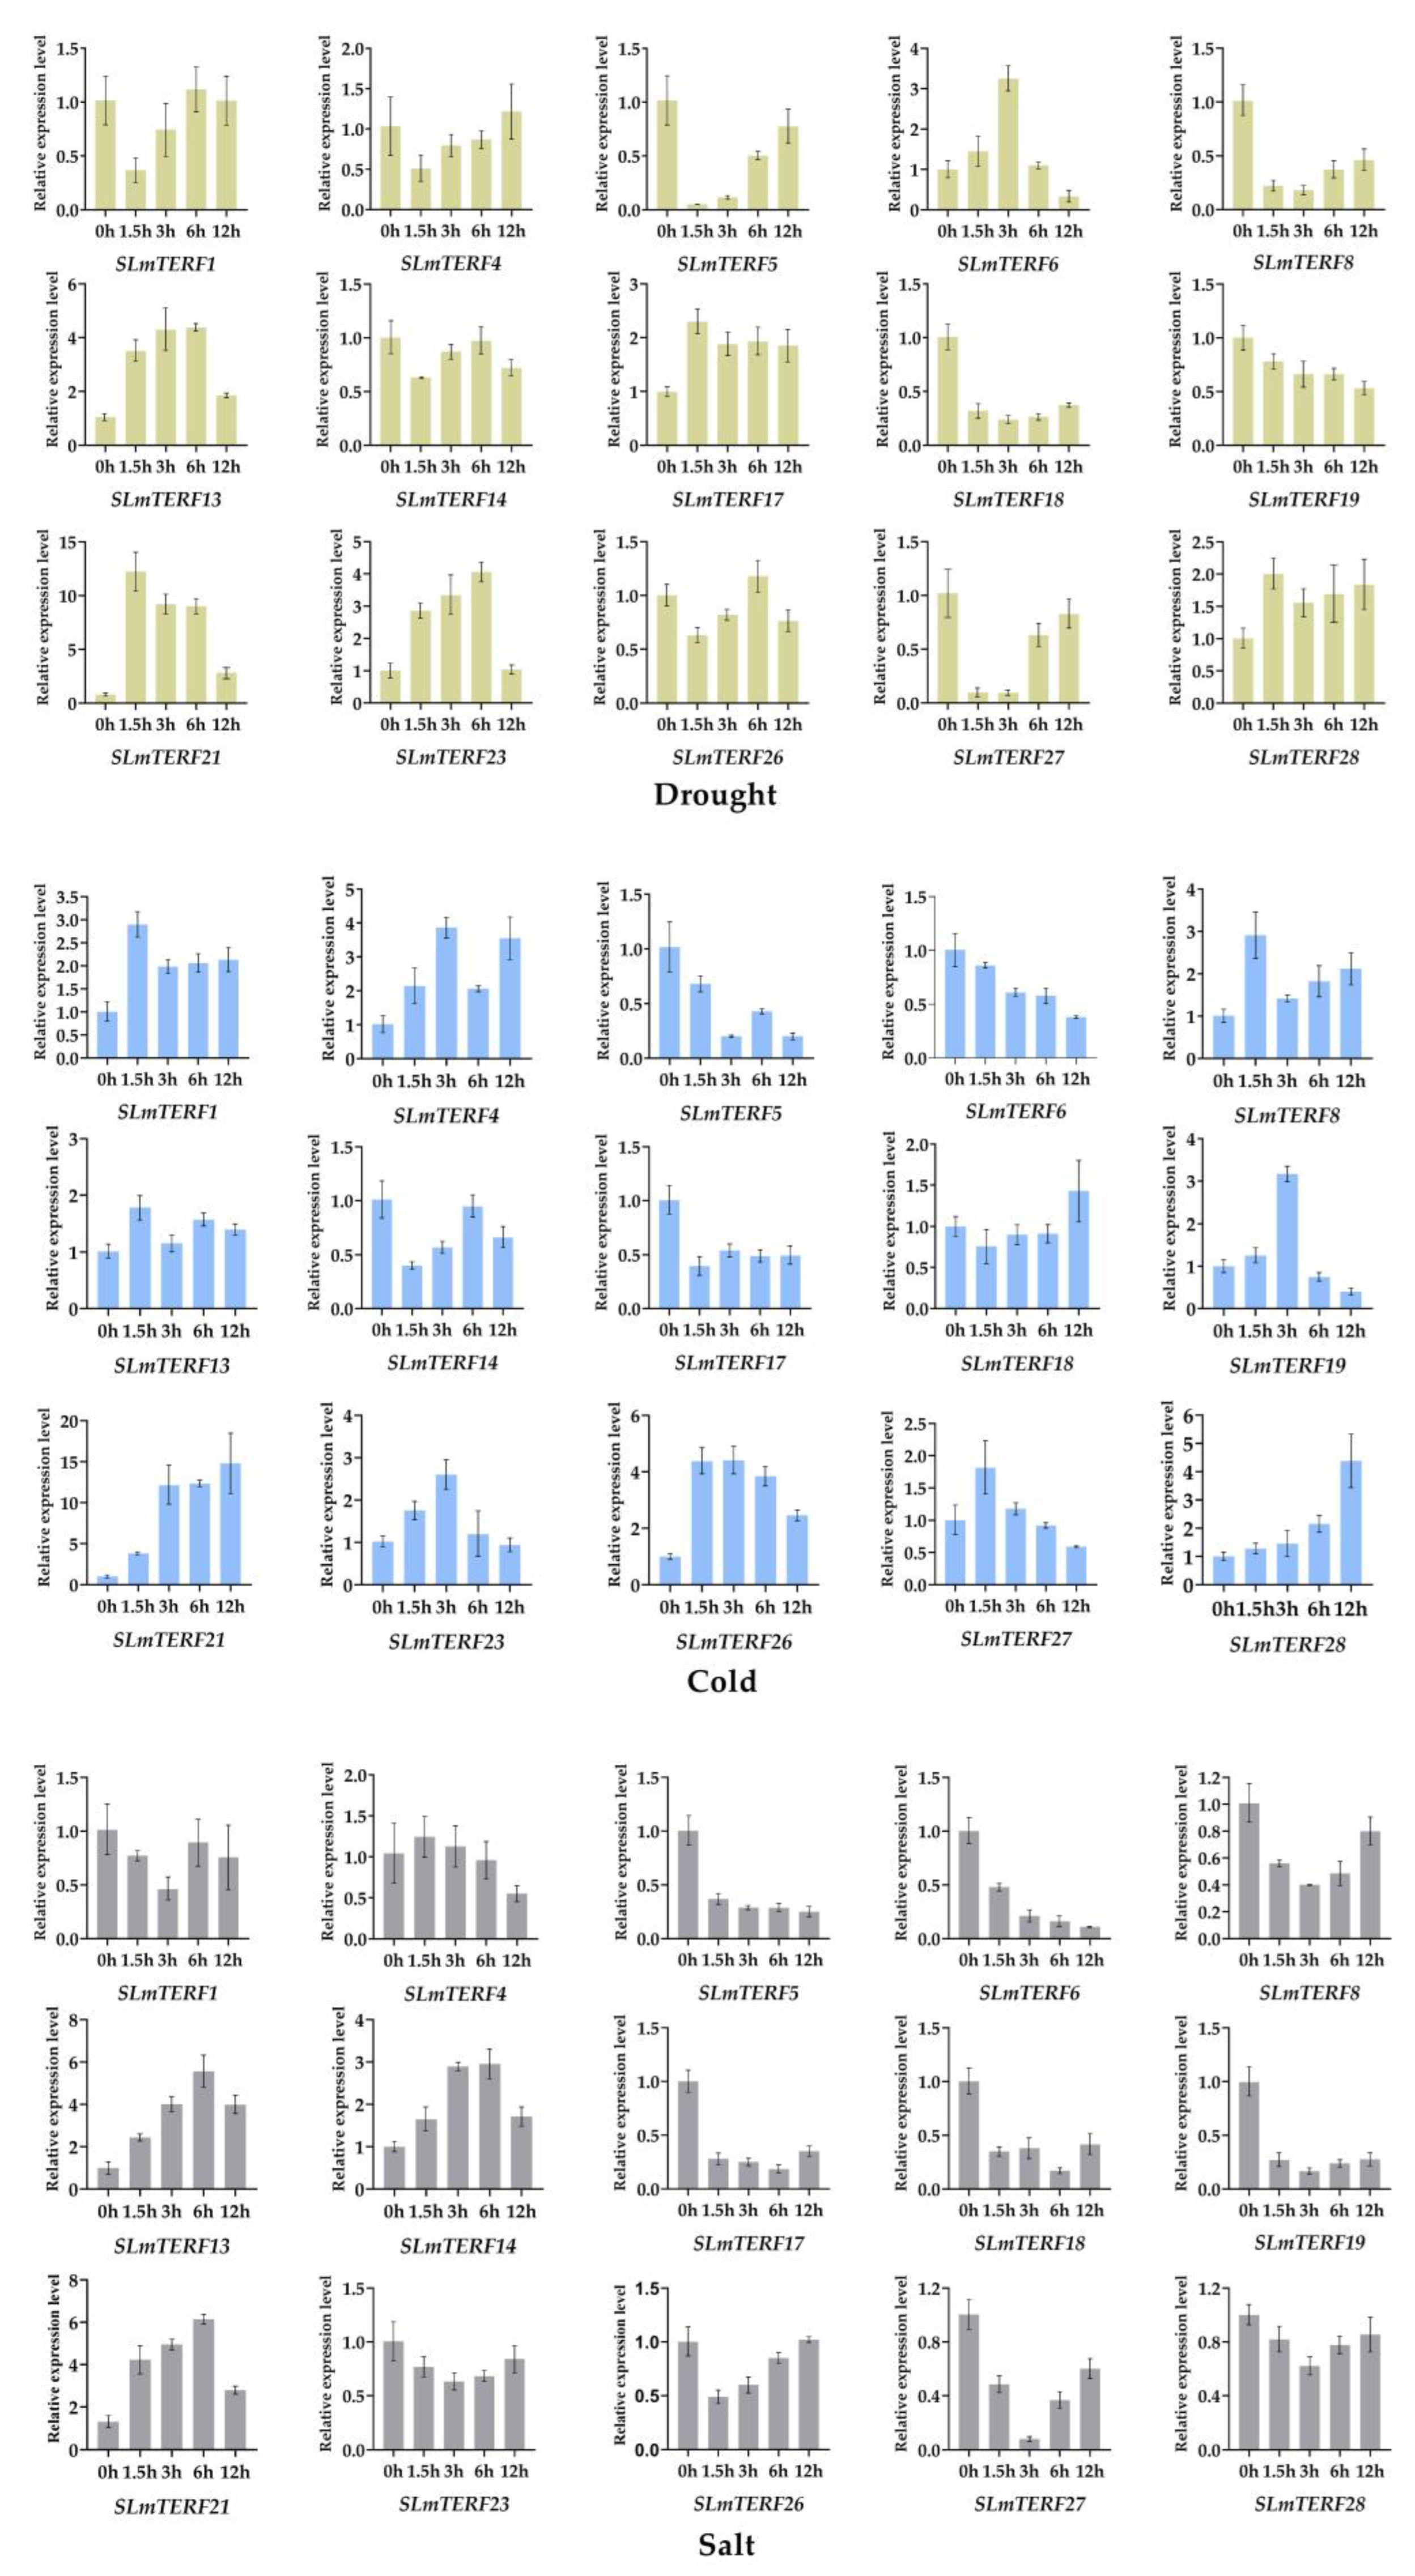
2.5. Analysis of mTERF Gene Expression in Tomato under Abiotic Stress

The 15 typical SLmTERF genes screened on the basis of their phylogenetic relationships were subjected to qRT-PCR to analyze the changes in the expression of the tomato mTERF gene family members when the plants were under abiotic stress conditions (Figure 7). The expression levels of six genes were upregulated under drought stress, and the expression levels of three genes, SLmTEF13, SLmTERF21, and SLmTERF23, were significantly upregulated. After cold stress treatment, a total of nine genes were upregulated, of which the expression of SLmTERF21 and SLmTERF26 increased significantly. However, under salt stress, the expression of most genes showed a downward trend, but the expression of SLmTERF13 and SLmTERF21 increased significantly. SLmTERF13, whose expression was significantly upregulated under drought and salt stress, was selected for subsequent functional verification.

2.6. Cloning and Subcellular Localization of the SLmTERF13 Gene

Homologous cloning and sequencing revealed that the SLmTERF13 gene sequence was completely consistent with the sequence in the database, and the comparison rate reached 100%. Further subcellular localization experiments showed that the gene was localized in the nucleus (Figure 8).

2.7. Functional Analysis of the SLmTERF13 Gene

2.7.1. Phenotypic Analysis of Stress Resistance of Gene-Silenced Plants

After albino PDS-silenced indicated plants (Figure 9a), plants with more than a 50% reduction in target gene expression (Figure 9b) were selected for drought and salt stress treatments.
The phenotypic changes after treatment are shown in Figure 10. With prolonged treatment time, the degree of plant damage gradually increased. However, the occurrence time of leaf wilting and stem bending of the SLmTERF13-silenced plants was earlier than that in the control plants, and the degree of plant damage at each time point was more obvious than that of the control plants.

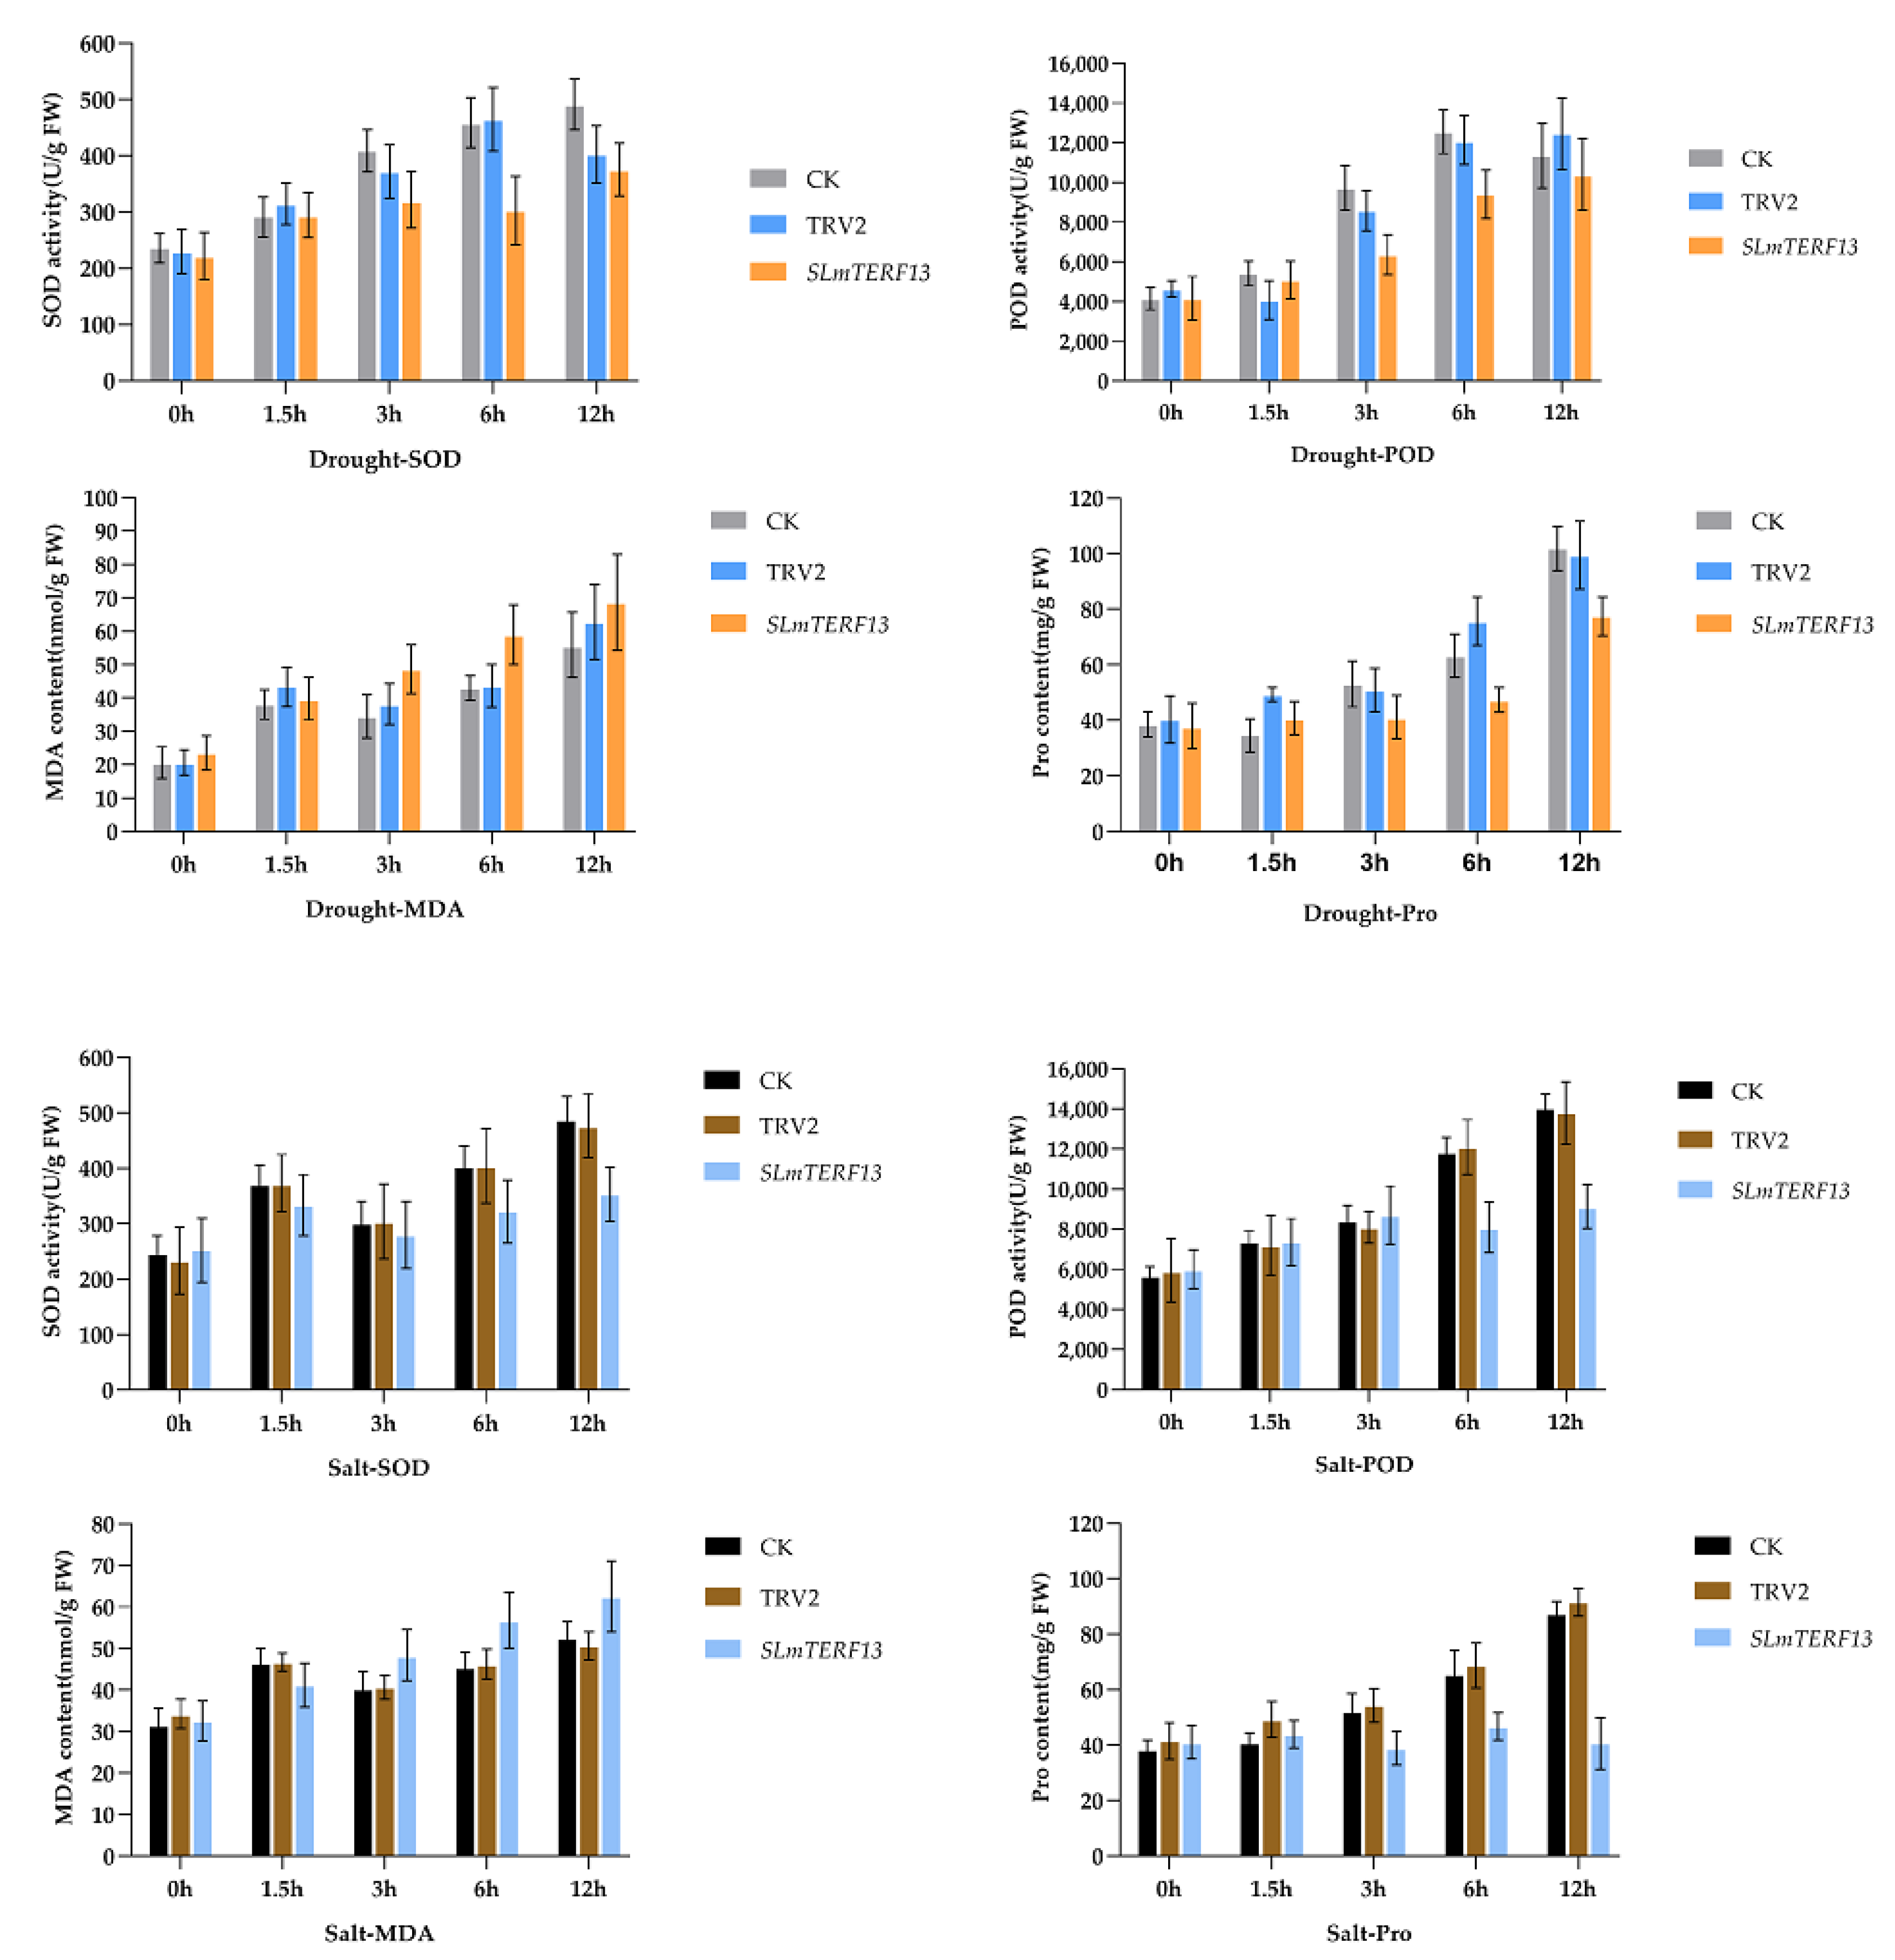
2.7.2. Physiological Index Measurements

The physiological indexes after 12 h of abiotic stress are shown in Figure 11. As shown in the figure, SOD activity, POD activity, Pro content, and MDA content all showed an increasing trend. Except for the MDA content, which was significantly higher than that of the control group, the other values of SLmTERF13-silenced plants were significantly lower than those of the control group.

2.7.3. Active Oxygen Staining

Figure 12 shows the results of DAB and NBT staining under drought and salt stress.
As time progressed, the staining area of the leaves of the three groups of tomato plants gradually increased, and the staining degree gradually intensified. However, compared with the control plants, the SLmTERF13-silenced plants had a larger staining area and more intense degree of staining at the same time points.

2.7.4. Chlorophyll Content and Electrical Conductivity Determination

As shown in Figure 13, compared with the control, in SLmTERF13-silenced plants, the degree of decrease in chlorophyll content was slightly higher than that in the control group, but the increase in electrical conductivity was significantly higher.

3. Discussion

A total of 28 members of the tomato mTERF family were identified in this study. There were 35 genes of this family in Arabidopsis thaliana, and 35, 33, 31, and 25 genes in capsicum, rice, maize, and grape, respectively, indicating that the family number of genes in different species was similar, and the number of family members had little relationship with the genome size of species. The genes of this family in tomato can be divided into six groups, but the distribution of the number of genes in the six groups is quite different. Group 1 and Group 6, which have more members, are closer to the end of evolution, indicating that the genes of this family have a significant bias in the process of evolution. This phenomenon also appears in the genes of the same family in Arabidopsis. This suggests that this evolutionary trend may be common among different plants.
Cis-acting elements are important molecular switches that play an important role in plant growth and development and abiotic stress responses through their participation in transcriptional regulation [23,24,25]. In this study, 28 mTERF gene family members all contained different cis-acting elements, including 13 types related to abiotic stress, hormones, and other related response elements. Abscisic acid response elements (ABREs), low temperature response elements (LTREs), drought response elements (DREs), etc., have been shown to be closely related to stress resistance. Twelve genes, such as SLmTERF1, SLmTERF9, SLmTERF11, and SLmTERF13, contain ABREs, and reports have shown that cis-acting elements play a role in regulating osmotic stress and cold stress in ABA-dependent genes [26]. For example, the RAB16 gene containing ABREs in rice is expressed in late embryogenetic seeds and in vegetative tissues induced by ABA and osmotic stress [27,28]. RAB16 enhances the stress resistance of rice by encoding proteins related to osmotic stress or other protective effects. SLmTERF4, SLmTERF8, SLmTERF10, SLmTERF13, a total of 10 genes contain LTRE. Genes containing LTRE play a key role in the regulation of plant low temperature. For example, in Brassica napus, mutation of the core pentamer CCGAC in the LTRE in the 5′-proximal region of the BN115 gene affects the low-temperature regulation expression of BN115 [29]. The presence of these cis-acting elements provides a structural basis for the participation of these SLmTERF genes in the regulation of stress resistance.
To further explore the response rules of the tomato mTERF gene family to different stresses, we analyzed the expression patterns of the tomato mTERF gene family under drought, salt and low temperature stresses. The results showed that all the selected genes had different responses under different stresses, and most of the genes showed different response modes under the three stresses. For example, SLmTERF17 was upregulated under drought stress and downregulated under salt stress and cold stress; SLmTERF6 was slowly downregulated under cold stress and rapidly downregulated under salt stress but was first upregulated and then downregulated under drought stress. By association evolutionary relationship analysis, we found that the family members divided into the same group had completely different response rules, indicating that the structural evolution of the family genes had little relationship with functional selection. Further analysis combined with cis-acting elements showed that the stress response patterns of multiple genes were consistent with the prediction of their component functions, but there were also some genes, such as SLmTERF21, that had no drought response-related elements but were significantly upregulated under drought stress. This suggests that genes in this family may also be involved in the regulation of the stress response through other signals or indirect pathways. In all the analysis of expression patterns, we found that SLmTERF1, SLmTERF21, and SLmTERF17 showed significant expression changes in the early stage of cold stress, drought stress, and salt stress, respectively; SLmTERF28 showed a significant increase in the late stage of cold stress; SLmTERF23 showed a sharp increase in the early stage and a sharp decline in the later stage under drought stress. This phenomenon indicates that tomato mTERF family members may play a role in different stages of stress resistance regulation.
For SLmTERF13, which was significantly upregulated under drought and salt stress, VIGS technology was used for preliminary functional verification. The results showed that the downregulation of the gene led to a decrease in the drought and salt tolerance of tomato plants. When the physiological indexes of SLmTERF13-silenced plants were detected, it was found that the changes in SOD and POD activities and MDA and Pro contents of SLmTERF13-silenced plants were similar under drought stress and salt stress, but the changes in chlorophyll content and electrical conductivity were obviously different in the early stage of the two stresses; but the trends were consistent in the later stage. These results suggest that the SLmTERF13 gene may have some differences in the regulation of drought and salt stress responses, but both play positive regulatory functions in the end. Due to the limitations of VIGS, the functional verification method for SLmTERF13 in this study and the process of this gene’s participation in drought and salt stress should be further explored in detail to further clarify the similarities and differences in the regulation of this gene under different adversities. In this study, SLmTERF13 was in the nucleus, which is consistent with the localization prediction of this gene and the localization characteristics of this gene family. Previous studies have shown that most of the genes in this family are encoded in the nucleus and then transferred to the chloroplast or mitochondria for function. In this study, the chlorophyll content of plants silenced by SLmTERF13 did not change significantly compared with that of control plants, but the chlorophyll content of plants silenced by SLmTERF13 decreased more during the whole process after stress, indicating that the decrease in the expression of this gene would not affect chlorophyll accumulation under normal circumstances but would aggravate chlorophyll loss when stress occurred. Combined with the upregulated expression trend of this gene under drought and salt stress, we speculated that SLmTERF13 may reduce chlorophyll loss and maintain chlorophyll content balance through some positive regulatory pathway and then positively regulate the resistance of tomato plants.

4. Materials and Methods

4.1. Identification of mTERF Gene Family Members and Construction of an mTERF Evolutionary Tree in Tomato

The hidden Markov model (HMM) of the mTERF conserved domain (numberPF02536) was obtained from the Pfam database (http://pfam.xfam.org/family/ (accessed on 1 June 2020)) to screen candidate genes [30]. The nucleotide sequence and amino acid sequence (https://sgn.cornell.edu/help/index.pl/ (accessed on 5 June 2020)) of 28 candidate tomato mTERF genes were downloaded from the Ensembl Plants database (http://plants.ensembl.org/index.html/ (accessed on 7 June 2020)) for subsequent analysis [31]. The conserved domains of 28 tomato mTERF genes were verified by the SMART database (http://smart.embl-heidelberg.de/ (accessed on 12 June 2020)).
Thirty-five Arabidopsis mTERF protein sequences were obtained from The Arabidopsis Information Resource (TAIR) (http://www.arabidopsis.org/ (accessed on 15 June 2020)) [32]. The mTERF protein sequences of tomato and Arabidopsis were subjected to multiple sequence alignment via ClusterX. Based on the comparison results, MEGA 7 was used to construct a rootless developmental tree using the neighbor-joining (NJ) method (bootstraps = 1000) [33].

4.2. Analysis of the Physical and Chemical Properties of Tomato mTERF Proteins

The amino acid number, relative molecular weight, and theoretical isoelectric point of the mTERFs were predicted by the ProtParam tool (https://web.expasy.org/protparam/ (accessed on 21 June 2020)) of ExPASy [34]. SignalP 4.1 (http://www.cbs.dtu.dk/services/SignalP/ (accessed on 23 June 2020)) was used to predict signal peptides of 28 tomato mTERF proteins [35].

4.3. Gene Structure, Protein Secondary Structure, and Motif Analysis of Tomato mTERFs

The full-length sequences and CDSs of the 28 tomato mTERF genes were imported into the Gene Structure Display Server (GSDS) (http://gsds.gao-lab.org/index.php (accessed on 28 June 2020)) for gene structure analysis [36]. The 28 tomato mTERF protein sequences were submitted to Prabi (https://npsa-prabi.ibcp.fr (accessed on 3 July 2020)) and MEME (https://meme-suite.org/meme/ (accessed on4 July 2020)) for protein secondary structure and motif analysis, respectively [37].

4.4. Chromosome Localization Prediction, Subcellular Localization, and Cis-Acting Element Analysis of Tomato mTERFs

The annotation information of 28 tomato mTERF genomes was retrieved by SGN (https://sgn.cornell.edu/help/index.pl (accessed on 11 July 2020)), and the position of tomato mTERF on chromosomes was obtained by MG2C (http://mg2c.iask.in/mg2c_v2.0/ (accessed on 11 July 2020)). The subcellular location of tomato mTERF was predicted by TargetP-2.0 (http://www.cbs.dtu.dk/services/TargetP (accessed on 18 July 2020)) combined with 28 tomato mTERF protein sequences. From the tomato genome database (https://solgenomics.net/ (accessed on 20 July 2020)), the 2000 bp upstream promoter sequences of the 28 candidate genes were downloaded and submitted to Plant-CARE (http://bioinformatics.psb.ugent./webtools/plantcare/html/ (accessed on 21 July 2020)) for the prediction of cis-acting elements in the promoter regions.

4.5. Plant Materials and Treatment Methods

The tomato variety “Ailsa Craig” and the tobacco variety “Nicotiana benthami-ana” were used in this experiment. The above experimental materials were provided by the Tomato Research Institute of Northeast Agricultural University.
“Ailsa Craig” plants were grown in a greenhouse (13 h light, 26 °C temperature, 45% relative humidity). Tomato seedlings exhibiting the same growth were selected and subjected to low temperature (4 °C), drought (15% PEG6000), or salt (0.2 mol/L NaCl). At 0, 1.5, 3, 6, and 12 h after the abiotic stress treatments, 3–4 leaves of the tomato seedlings were randomly sampled (three biological replicates each). The samples were frozen in liquid nitrogen and stored at −80 °C. The samples were used for gene expression level analysis.
“Ailsa Craig” plants were grown in a greenhouse (11 h light, 21 °C temperature, 45% relative humidity). When the tomato fruits were ripe, the roots, stems, leaves, flowers and fruits were sampled, and three biological replicates were collected. The samples were used for tissue-specific expression analysis.
The gene silencing material “Ailsa Craig” and the subcellular localization material “Nicotiana benthamiana” were grown in a greenhouse (13 h light, 26 °C, 45% relative humidity).

4.6. cDNA Synthesis and qRT-PCR

RNA extraction from tomato leaves. The kit selected for RNA extraction was an RNA mini kit (Watson, China). The synthesized cDNA was reverse transcribed into RNA, and the reverse transcription kit was sourced from Beijing TransGen Biotech. qRT-PCR was used for gene expression analysis and tissue-specific expression analysis of 15 SLmTERFs selected after phylogenetic tree relationships were combined. NCBI online software (https://www.ncbi.nlm.nih.gov/tools/primer-blast/ (accessed on 6 September 2020)) was used to design primers for the 15 SLmTERF genes (Table S2), with tomato Actin-7 as the internal reference [38,39]. The reaction mixture for fluorescence quantification was 20 µL, comprising 10 µL of SYBR master mix, 0.5 µL of forward and reverse primers, 1 µL of cDNA template, and 8 µL of ddH2O. The qRT-PCR protocol was as follows: 95 °C for 30 s, 95 °C for 10 s, 60 °C for 30 s, 95 °C for 15 s, and 60 °C for 60 s, for which there were 40 cycles. Gene expression was calculated using the 2−ΔΔCt method [40].

4.7. Gene Silencing and Stress Resistance Treatments in Silenced Plants

SLmTERF13 gene silencing fragments were designed using the SGN-Vigs tool (http://vigs.solgenomics.net/ (accessed on 15 January 2021)) [41], and the gene silencing primer information can be found in Table S2 for details. After PCR amplification of the gene silencing fragments, the target gene and plasmid were digested with EcoR1 and BamH1. The target fragment and the TRV2 plasmid were reconstituted using T4 ligase, the recombinant plasmid was transformed into DH5α Escherichia coli, and the plasmid was extracted using the bacterial solution that was successfully sequenced. Finally, the extracted plasmid was transferred to Agrobacterium GV3101 for culture for the infection experiment.
The bacterial solutions of TRV2 empty vector-containing, PDS-TRV2 and SLmTERF13-TRV2, were used to infect the leaves of tomato seedlings with the same growth and free of diseases and pests using a 1ml syringe. High-moisture conditions in the dark for 72 h were used to promote infection, and then the leaves were incubated in a room with a temperature of 21 °C, a photoperiod of 15 h, and a relative humidity of 70%. Each group consisted of 35 infected tomato seedlings, and three biological repeats were carried out. The gene silencing system was suggested to be effective when the tomato seedlings infected with PDS-TRV2 were albino. Afterward, the leaves of the SLmTERF13 gene-silenced plants were removed to detect the silencing efficiency by qRT-PCR.
Since the phenotypes of the gene-silenced plants and the control plants were not significantly different under the cold stress environment for 12 h, subsequent tests were conducted only under drought and salt stress. The selected gene-silenced tomato plants were divided into a drought group (15% PEG6000) and a salt stress group (200 mol/L NaCl), and wild-type and TRV2 empty vector-containing plants were used as controls. The plant phenotypes were observed, and leaf samples were taken at 5 time points (0, 1.5, 3, 6, and 12 h). The leaves were subsequently stored at −80 °C. Each treatment was repeated three times.

4.8. Physiological Index Measurements

4.8.1. Determination of Superoxide Dismutase (SOD) and Peroxidase (POD) Activities and Proline (Pro) and Malondialdehyde (MDA) Contents

The activities of SOD and POD and the contents of Pro and MDA in the leaves of wild-type plants, TRV2 empty vector-containing plants, and SLmTERF13 gene-silenced plants were measured according to the operation steps of the kits used (Keming, China).

4.8.2. Reactive Oxygen Staining Observation

Leaves of wild-type plants, TRV2 empty vector-containing plants, and SLmTERF13 gene-silenced plants were immersed in 3,3′-diaminobenzidine (DAB) and nitroblue tetrazolium (NBT) dye solution. After incubating in the dark for 12 h, the dye solution was discarded, 30 mL of absolute ethanol was added, and the materials were heated in a 100 °C water bath for 12 min while being shaken every 3 min. If the color of the leaves had not completely faded, they were washed again with absolute ethanol several times. The completely faded leaves were placed on a slide to observe the staining and collect images.

4.8.3. Determination of Chlorophyll Content and Electrical Conductivity

The chlorophyll content was determined using a chlorophyll assay kit (Solarbio, China). One gram of leaf tissue of wild tomato, TRV2 empty vector-containing tomato, and silenced tomato plants were weighed and placed in a centrifuge tube filled with 25 mL of sterile water. After being sealed and soaked for 16 h in the dark, the initial electrical conductivity of the solution was measured using a conductance meter. Then, the centrifuge tube was heated in a water bath for 30 min and allowed to cool to room temperature to determine the final conductivity of the solution. The relative conductivity = initial conductivity/final conductivity × 100% [42]. Three replications were performed, and the average value was taken.

4.9. Subcellular Localization of SLmTERF13 Protein

The YFP-SLmTERF13 primer was designed using NCBI software (Table S3), and then Primer Premier 5.0 was used to detect whether the designed primer sequence contained the restriction sites of BamH I and Kpn I. After detection, Beijing Tsingke Biotech Co., Ltd. (Beijing, China) was commissioned to conduct primer synthesis. The methods of cutting target gene and plasmid, recombining target fragment with plasmid, transferring recombinant plasmid into Escherichia coli, transferring plasmids into Agrobacterium, and infecting tobacco plants were similar to 4.7. After 3 days of cultivation in the dark, the leaf area was torn off, and fluorescence imaging was performed by laser coaggregation microscopy.

5. Conclusions

This study analyzed the tomato mTERF gene family at the whole-genome level, revealing a total of 28 SLmTERFs that were then divided into six groups. Then, the phylogenetic relationships, physicochemical properties, gene structures, chromosome positions, cis-acting elements, and conserved motifs were characterized using bioinformatics methods. The expression of 15 SLmTERFs was analyzed by qRT-PCR, and it was found that most genes could respond to abiotic stresses(Figure 14a). Afterward, the function of the SLmTERF13 gene was verified by gene silencing under stress conditions, and it was found that SLmTERF13 had a positive regulatory effect under salt stress and drought stress (Figure 14b). Finally, the SLmTERF13 gene was located in the nucleus using subcellular localization. These results can help us further explore the regulatory mechanism of tomato mTERF gene family members in response to abiotic stress and provide a foundation for the genetic improvement of tomato resistance.

Supplementary Materials

The following supporting information can be downloaded at: https://www.mdpi.com/article/10.3390/plants12152862/s1. Table S1. Subcellular localization of 28 SLmTERF proteins; Table S2. Primers for fluorescent quantitative PCR of tomato mTERF gene family and SLmTERF13 gene silencing; Table S3. YFP-SLmTERF13 gene PCR primers; Figure S1. Prediction of the SLmTERF3 signal peptide.

Author Contributions

Conceptualization, A.S., S.G., X.X. and T.Z.; methodology, A.S., S.G. and B.Z.; software, A.S., Z.W., L.Z. and X.Y.; validation, Z.W., Z.Z., X.Y. and Y.W.; formal analysis, A.S., B.Z. and Z.Z.; investigation, A.S., S.G. and B.Z.; resources, A.S., L.Z. and T.Z.; data curation, S.G., Y.W., D.L. and H.Z.; writing—original draft preparation, A.S. and S.G.; writing—review and editing, A.S., X.X. and T.Z.; visualization, A.S. and S.G.; supervision, D.L., H.Z., X.X. and T.Z.; project administration, X.X. and T.Z.; funding acquisition, X.X. and T.Z.; All authors have read and agreed to the published version of the manuscript.

Funding

This research was funded by the National Natural Science Foundation of China (Grant No. 32102390), the National Natural Science Foundation of China (Grant No. 32072589), the China Agriculture Research System (CARS-23-A11), the Heilongjiang Provincial Natural Science Foundation of China (Grant No. YQ2021C013), Northeast Agricultural University Scholars Program (Grant No. 20XG28) and Key research and development plan of Heilongjiang Province (2022ZX02B07).

Data Availability Statement

All data are displayed in the manuscript and Supplementary Files.

Conflicts of Interest

The authors declare no conflict of interest.

References

  1. Gray, M.W.; Burger, G.; Lang, B.F. Mitochondrial Evolution. Science 1999, 283, 1476–1481. [Google Scholar] [CrossRef] [Green Version]
  2. Lang, B.F.; Gray, M.W.; Burger, G. Mitochondrial genome evolution and the origin of eukaryotes. Annu. Rev. Genet. 1999, 33, 351–397. [Google Scholar] [CrossRef]
  3. Roberti, M.; Polosa, P.L.; Bruni, F.; Manzari, C.; Deceglie, S.; Gadaleta, M.N.; Cantatore, P. The MTERF family proteins: Mitochondrial transcription regulators and beyond. Biochim. Biophys. Acta 2009, 1787, 303–311. [Google Scholar] [CrossRef] [Green Version]
  4. Quesada, V. The roles of mitochondrial transcription termination factors (MTERFs) in plants. Physiol. Plant 2016, 157, 389–399. [Google Scholar] [CrossRef]
  5. Kruse, B.; Narasimhan, N.; Attardi, G. Termination of transcription in human mitochondria: Identification and purification of a DNA binding protein factor that promotes termination. Cell 1989, 58, 391–397. [Google Scholar] [CrossRef]
  6. Linder, T.; Park, C.B.; Asin-Cayuela, J.; Pellegrini, M.; Larsson, N.-G.; Falkenberg, M.; Samuelsson, T.; Gustafsson, C.M. A family of putative transcription termination factors shared amongst metazoans and plants. Curr. Genet. 2005, 48, 265–269. [Google Scholar] [CrossRef]
  7. Leister, D.; Kleine, T. Extending the Repertoire of mTERF Proteins with Functions in Organellar Gene Expression. Mol. Plant 2020, 13, 817–819. [Google Scholar] [CrossRef]
  8. Kleine, T. Arabidopsis thaliana mTERF proteins: Evolution and functional classification. Front. Plant Sci. 2012, 3, 233. [Google Scholar] [CrossRef] [Green Version]
  9. Tang, B.; Xie, L.; Yi, T.; Lv, J.; Yang, H.; Cheng, X.; Liu, F.; Zou, X. Genome-Wide Identification and Characterization of the Mitochondrial Transcription Termination Factors (mTERFs) in Capsicum annuum L. Int. J. Mol. Sci. 2019, 21, 269. [Google Scholar] [CrossRef] [Green Version]
  10. Yin, X.; Gao, Y.; Song, S.; Hassani, D.; Lu, J. Identification, characterization and functional analysis of grape (Vitis vinifera L.) mitochondrial transcription termination factor (mTERF) genes in responding to biotic stress and exogenous phytohormone. BMC Genom. 2021, 22, 136. [Google Scholar] [CrossRef]
  11. Zhao, Y.; Cai, M.; Zhang, X.; Li, Y.; Zhang, J.; Zhao, H.; Kong, F.; Zheng, Y.; Qiu, F. Genome-wide identification, evolution and expression analysis of mTERF gene family in maize. PLoS ONE 2014, 9, e94126. [Google Scholar] [CrossRef] [Green Version]
  12. Babiychuk, E.; Vandepoele, K.; Wissing, J.; Garcia-Diaz, M.; De Rycke, R.; Akbari, H.; Joubes, J.; Beeckman, T.; Jansch, L.; Frentzen, M.; et al. Plastid gene expression and plant development require a plastidic protein of the mitochondrial transcription termination factor family. Proc. Natl. Acad. Sci. USA 2011, 108, 6674–6679. [Google Scholar] [CrossRef]
  13. Robles, P.; Quesada, V. Research Progress in the Molecular Functions of Plant mTERF Proteins. Cells 2021, 10, 205. [Google Scholar] [CrossRef]
  14. Wobbe, L.; Nixon, P.J. The mTERF protein MOC1 terminates mitochondrial DNA transcription in the unicellular green alga Chlamydomonas reinhardtii. Nucleic Acids Res. 2013, 41, 6553–6567. [Google Scholar] [CrossRef]
  15. Robles, P.; Micol, J.L.; Quesada, V. Arabidopsis MDA1, a nuclear-encoded protein, functions in chloroplast development and abiotic stress responses. PLoS ONE 2012, 7, e42924. [Google Scholar] [CrossRef]
  16. Zhang, X.L. Preliminary Study on the Function of mTERF Protein PDE191 in Arabidopsis Thaliana. Master’s Thesis, Shanghai Normal University, Shanghai, China, 2011. Available online: https://kns.cnki.net/kcms2/article/abstract?v=3uoqIhG8C475KOm_zrgu4lQARvep2SAkWGEmc0QetxDh64Dt3veMp9WlHuIlcOUegHxiiC9JpkuwF0vFy65JH81Abp2071Q4&uniplatform=NZKPT (accessed on 5 July 2020). (In Chinese).
  17. Romani, I.; Manavski, N.; Morosetti, A.; Tadini, L.; Maier, S.; Kuhn, K.; Ruwe, H.; Schmitz-Linneweber, C.; Wanner, G.; Leister, D.; et al. A Member of the Arabidopsis Mitochondrial Transcription Termination Factor Family Is Required for Maturation of Chloroplast Transfer RNAIle(GAU). Plant Physiol. 2015, 169, 627–646. [Google Scholar] [CrossRef] [Green Version]
  18. Kim, M.; Lee, U.; Small, I.; des Francs-Small, C.C.; Vierling, E. Mutations in an Arabidopsis mitochondrial transcription termination factor-related protein enhance thermotolerance in the absence of the major molecular chaperone HSP101. Plant Cell 2012, 24, 3349–3365. [Google Scholar] [CrossRef] [Green Version]
  19. Hammani, K.; Barkan, A. An mTERF domain protein functions in group II intron splicing in maize chloroplasts. Nucleic Acids Res. 2014, 42, 5033–5042. [Google Scholar] [CrossRef] [Green Version]
  20. Lu, Y.; Zhu, H. The regulation of nutrient and flavor metabolism in tomato fruit. Veg. Res. 2022, 2, 1–14. [Google Scholar] [CrossRef]
  21. Bruno, A.; Durante, M.; Marrese, P.P.; Migoni, D.; Laus, M.N.; Pace, E.; Pastore, D.; Mita, G.; Piro, G.; Lenucci, M.S. Shades of red: Comparative study on supercritical CO2 extraction of lycopene-rich oleoresins from gac, tomato and watermelon fruits and effect of the α-cyclodextrin clathrated extracts on cultured lung adenocarcinoma cells’ viability. J. Food Compos. Anal. 2018, 65, 23–32. [Google Scholar] [CrossRef]
  22. Muscatello, M.R.A.; Zoccali, R.A.; Bruno, A. Citrus Fruit Polyphenols and Flavonoids: Applications to Psychiatric Disorders. In Polyphenols: Mechanisms of Action in Human Health and Disease; Elsevier Inc.: Amsterdam, The Netherlands, 2018; pp. 119–131. [Google Scholar]
  23. Baker, S.S.; Wilhelm, K.S.; Thomashow, M.F. The 5’-region of Arabidopsis thaliana corl5a has cis-acting elements that confer cold-, drought- and ABA-regulated gene expression. Plant Mol. Biol. 1994, 24, 701–713. [Google Scholar] [CrossRef]
  24. Khong, G.; Richaud, F.; Coudert, Y.; Pati, P.K.; Santi, C.; Perin, C.; Breitler, J.C.; Meynard, D.; Vinh Do, N.; Guiderdoni, E.; et al. Modulating rice stress tolerance by transcription factors. Biotechnol. Genet. Eng. Rev. 2008, 25, 381–403. [Google Scholar] [CrossRef] [Green Version]
  25. Nakashima, K.; Ito, Y.; Yamaguchi-Shinozaki, K. Transcriptional regulatory networks in response to abiotic stresses in Arabidopsis and grasses. Plant Physiol. 2009, 149, 88–95. [Google Scholar] [CrossRef] [Green Version]
  26. Yamaguchi-Shinozaki, K.; Shinozaki, K. Organization of cis-acting regulatory elements in osmotic- and cold-stress-responsive promoters. Trends Plant Sci. 2005, 10, 88–94. [Google Scholar] [CrossRef]
  27. Mundy, J. Nuclear proteins bind conserved elements in the abscisic acid-responsive promoter of a rice rab gene. Proc. Natl. Acad. Sci. USA 1990, 87, 1406–1410. [Google Scholar] [CrossRef]
  28. Mundy, J.; Chua, N.H. Abscisic acid and water: Tress induce the expression of a novel rice gene. EMBO J. 1988, 7, 2279–2286. [Google Scholar] [CrossRef]
  29. Jiang, C.; Iu, B.; Singh, J. Requirement of a CCGAC cis -acting element for cold induction of the BN115 gene from winter Brassica napus. Plant Mol. Biol. 1996, 30, 679–684. [Google Scholar] [CrossRef]
  30. El-Gebali, S.; Mistry, J.; Bateman, A.; Eddy, S.R.; Luciani, A.; Potter, S.C.; Qureshi, M.; Richardson, L.J.; Salazar, G.A.; Smart, A.; et al. The Pfam protein families database in 2019. Nucleic Acids Res. 2019, 47, D427–D432. [Google Scholar] [CrossRef]
  31. Turkoglu, M.; Yanikoğlu, B.; Hanbay, D. PlantDiseaseNet: Convolutional neural network ensemble for plant disease and pest detection. Signal Image Video Process. 2021, 16, 301–309. [Google Scholar] [CrossRef]
  32. Swarbreck, D.; Wilks, C.; Lamesch, P.; Berardini, T.Z.; Garcia-Hernandez, M.; Foerster, H.; Li, D.; Meyer, T.; Muller, R.; Ploetz, L.; et al. The Arabidopsis Information Resource (TAIR): Gene structure and function annotation. Nucleic Acids Res. 2008, 36, D1009–D1014. [Google Scholar] [CrossRef]
  33. Sudhir, K.; Glen, S.; Koichiro, T. MEGA7: Molecular Evolutionary Genetics Analysis Version 7.0 for Bigger Datasets. Mol. Biol. Evol. 2016, 33, 1870–1874. [Google Scholar]
  34. Gasteiger, E.; Gattiker, A.; Hoogland, C.; Ivanyi, I.; Appel, R.D.; Bairoch, A. ExPASy: The proteomics server for in-depth protein knowledge and analysis. Nucleic Acids Res. 2003, 31, 3784–3788. [Google Scholar] [CrossRef] [Green Version]
  35. Nordahl, P.T.; Søren, B.; Gunnar, V.H.; Henrik, N. SignalP 4.0: Discriminating signal peptides from transmembrane regions. Nat. Methods 2011, 8, 785–786. [Google Scholar]
  36. Bo, H.; Jinpu, J.; An-Yuan, G.; He, Z.; Jingchu, L.; Ge, G. GSDS 2.0: An upgraded gene feature visualization server. Bioinformatics 2015, 31, 1296–1297. [Google Scholar]
  37. Bailey, T.L.; Boden, M.; Buske, F.A.; Frith, M.; Grant, C.E.; Clementi, L.; Ren, J.; Li, W.W.; Noble, W.S. MEME SUITE: Tools for motif discovery and searching. Nucleic Acids Res. 2009, 37, W202–W208. [Google Scholar] [CrossRef] [PubMed]
  38. Qayyum, A.; Khan, A.A.; Cheema, H.; Aslam, U.; Malik, W. Biology. Transcriptome analysis of pigment related genes in colored cotton. Int. J. Agric. 2015, 17, 205–210. [Google Scholar]
  39. Niu, Y.L.; Jiang, X.M.; Xu, X.Y. Bioinformatics analysis of GRAS transcription factor family in tomato. Chin. Agric. Sci. Bull. 2016, 32, 106–116. (In Chinese) [Google Scholar]
  40. Livak, K.J.; Schmittgen, T. Analysis of relative gene expression data using real-time quantitative PCR and the 2-DDCt method. Methods 2001, 25, 402–408. [Google Scholar] [CrossRef]
  41. Fernandez-Pozo, N.; Rosli, H.G.; Martin, G.B.; Mueller, L.A. The SGN VIGS Tool: User-Friendly Software to Design Virus-Induced Gene Silencing (VIGS) Constructs for Functional Genomics. Mol. Plant 2015, 8, 486–488. [Google Scholar] [CrossRef] [Green Version]
  42. Lin, Y.; Guo, W.Z.; Xu, Z.H.; Jia, Z.K. Study on cold resistance of Privet macrophylla and changes of leaf relative conductivity in winter. Tianjin Agric. Sci. 2012, 18, 145–149. (In Chinese) [Google Scholar]
Figure 1. Phylogenetic tree of mTERF in Arabidopsis thaliana and tomato. The phylogenetic tree was constructed using the NJ method, with 1000 bootstrap replications. The 45 mTERFs were divided into 6 groups: blue, red, purple, yellow, pink, and green. The red five-pointed stars and white triangles represent tomato and Arabidopsis, respectively.
Plants 12 02862 g001
Figure 2. Structure of the mTERF gene in tomato. CDSs, upstream and downstream coding regions, and introns are represented by yellow, purple, and black lines, respectively.
Plants 12 02862 g002
Figure 3. Motif analysis of SLmTERFs. The motif types are represented by different colored squares.
Plants 12 02862 g003
Figure 4. Chromosomal mapping of the mTERF gene in tomato. The chromosome number is located at the top of each chromosome, and the scale value on the left corresponds to the chromosome length.
Plants 12 02862 g004
Figure 5. Cis-acting elements of the mTERF genes in tomato. The different colored squares represent different cis-acting elements.
Plants 12 02862 g005
Figure 6. Expression of 15 SLmTERF genes in different tissues. The chromaticity on the right side of the heatmap shows the relative expression, and the color gradient from green to red corresponds to an increase in expression.
Plants 12 02862 g006
Figure 7. Under abiotic stress conditions, the expression levels of 15 SLmTERF genes changed during different periods.
Plants 12 02862 g007
Figure 8. Results of SLmTERF13 subcellular localization.
Plants 12 02862 g008
Figure 9. Detection of gene-silenced plants. (a) PDS-silenced indicator plants exhibit albino phenomena. (b) Expression levels in SLmTERF13-silenced plants.
Plants 12 02862 g009
Figure 10. Phenotypic changes in plants under abiotic stress at different periods.
Plants 12 02862 g010
Figure 11. Under abiotic stress, SOD and POD activities and MDA and Pro contents changed at different time points.
Plants 12 02862 g011
Figure 12. Changes in DAB and NBT staining of plant leaves at different time points under abiotic stress. The top image shows DAB staining, and the bottom image shows NBT staining.
Plants 12 02862 g012
Figure 13. Chlorophyll content and electrical conductivity changes at different time points during abiotic stress.
Plants 12 02862 g013
Figure 14. (a) Functions involved by the SLmTERFs gene family. (b) SLmTERF13 gene silencing decreased plant resistance to drought and salt stress.
Plants 12 02862 g014
Table 1. Database number, gene name, amino acid number, relative molecular weight, theoretical isoelectric point, aliphatic amino acid index, and instability coefficient of the tomato mTERF gene family.
GENE IDGENE NAMENumber of Amino Acids (aa)Molecular Weight (Da)Theoretical pIAliphatic IndexGRAVYInstability Index
Solyc12g015640.2.1SLmTERF148256,021.919.2387.34−0.49444.09
Solyc02g021430.1.1SLmTERF230634,876.538.7893.33−0.14846.43
Solyc03g124040.3.1SLmTERF357465,951.339.1897.65−0.09052.19
Solyc02g069320.1.1SLmTERF457465,300.508.7696.11−0.14735.39
Solyc01g090500.3.1SLmTERF563072,679.448.1888.83−0.13346.50
Solyc01g109630.3.1SLmTERF670581,980.168.9689.67−0.28345.02
Solyc03g063390.1.1SLmTERF756565,319.429.12101.42−0.10740.83
Solyc03g081300.3.1SLmTERF851457,846.317.65103.170.01542.70
Solyc11g017430.2.1SLmTERF921524,380.796.8279.30−0.38548.39
Solyc04g005630.3.1SLmTERF1054061,573.697.6197.22−0.15045.02
Solyc04g011700.2.1SLmTERF1139244,616.779.78107.090.01738.51
Solyc01g007750.3.1SLmTERF1231736,039.249.1895.52−0.00859.20
Solyc12g010650.1.1SLmTERF1340747,343.829.59102.65−0.04626.94
Solyc01g109550.2.1SLmTERF1429434,528.119.3287.55−0.23345.58
Solyc04g072510.3.1SLmTERF1538743,999.619.17105.990.01535.54
Solyc04g072530.2.1SLmTERF1625028,271.089.28102.880.13030.46
Solyc04g072540.3.1SLmTERF1741246,777.199.77103.110.02537.75
Solyc04g072500.1.1SLmTERF1836842,229.619.73101.11−0.04228.78
Solyc11g022600.2.1SLmTERF1920224,224.609.6986.39−0.25358.63
Solyc02g093950.3.1SLmTERF201222134,350.967.9938.020.103101.82
Solyc02g082010.2.1SLmTERF2156764,440.599.5597.090.05346.81
Solyc02g067960.2.1SLmTERF2243550,317.119.5897.52−0.11641.46
Solyc04g072520.2.1SLmTERF2334639,620.679.6096.88−0.17830.62
Solyc04g072550.2.1SLmTERF2451459,546.289.55104.590.07632.91
Solyc05g007840.3.1SLmTERF2534038,787.688.86110.590.10643.82
Solyc09g097920.2.1SLmTERF2649356,722.418.87100.75−0.10041.31
Solyc11g044360.2.1SLmTERF2734539,458.319.2598.23−0.17038.39
Solyc11g017050.2.1SLmTERF2878187,309.935.6798.00−0.10039.10
Table 2. Secondary structure of the mTERF gene family in tomato.
IDAlpha HelixExtended StrandRandom Coil
SLmTERF1149.23%15.82%34.95%
SLmTERF1352.09%14.74%33.17%
SLmTERF1550.39%11.63%37.98%
SLmTERF1640.00%19.60%40.40%
SLmTERF1745.87%14.81%39.32%
SLmTERF1844.29%20.65%35.05%
SLmTERF1945.05%12.38%42.57%
SLmTERF2151.32%14.99%33.69%
SLmTERF2341.91%17.34%40.75%
SLmTERF2451.36%15.95%32.68%
SLmTERF935.35%14.88%49.77%
SLmTERF2259.54%6.90%33.56%
SLmTERF2646.04%14.60%39.35%
SLmTERF441.64%15.85%42.51%
SLmTERF544.60%12.54%42.86%
SLmTERF747.79%13.10%39.12%
SLmTERF843.00%14.40%42.61%
SLmTERF130.71%19.92%49.38%
SLmTERF238.89%15.36%45.75%
SLmTERF348.43%12.37%49.38%
SLmTERF646.95%14.47%38.58%
SLmTERF1048.15%7.96%43.89%
SLmTERF1239.43%15.14%45.43%
SLmTERF1442.86%13.61%43.54%
SLmTERF2049.18%13.83%36.99%
SLmTERF2537.94%18.82%43.24%
SLmTERF2749.86%15.65%34.49%
SLmTERF2838.80%13.83%47.38%
Disclaimer/Publisher’s Note: The statements, opinions and data contained in all publications are solely those of the individual author(s) and contributor(s) and not of MDPI and/or the editor(s). MDPI and/or the editor(s) disclaim responsibility for any injury to people or property resulting from any ideas, methods, instructions or products referred to in the content.

