Article

Signaling Cross-Talk between Salicylic and Gentisic Acid in the ‘Candidatus Phytoplasma Solani’ Interaction with Sangiovese Vines

1
Department of Biological and Environmental Sciences and Technologies, University of Salento, Via Provinciale Lecce-Monteroni, 73100 Lecce, Italy
2
Department of Agricultural and Environmental Sciences, Production, Landscape, Agroenergy (DiSAA), University of Milan, Via Celoria 2, 20133 Milano, Italy
3
Department of Pharmacy, University of Salerno, Via Giovanni Paolo II, 132, 84084 Fisciano, Italy
4
Department of Agriculture, Food and Environment (DAFE), University of Pisa, Via del Borghetto 80, 56124 Pisa, Italy
*
Author to whom correspondence should be addressed.
Plants 2023, 12(14), 2695; https://doi.org/10.3390/plants12142695
Submission received: 16 June 2023 / Revised: 13 July 2023 / Accepted: 14 July 2023 / Published: 19 July 2023

Abstract

:
“Bois noir” disease associated with ‘Candidatus Phytoplasma solani’ seriously compromises the production and survival of grapevines (Vitis vinifera L.) in Europe. Understanding the plant response to phytoplasmas should help to improve disease control strategies. Using a combined metabolomic and transcriptomic analysis, this work, therefore, investigated the phytoplasma–grapevine interaction in red cultivar Sangiovese in a vineyard over four seasonal growth stages (from late spring to late summer), comparing leaves from healthy and infected grapevines (symptomatic and symptomless). We found an accumulation of both conjugate and free salicylic acids (SAs) in the leaves of ‘Ca. P. solani’-positive plants from early stages of infection, when plants are still asymptomatic. A strong accumulation of gentisic acid (GA) associated with symptoms progression was found for the first time. A detailed analysis of phenylpropanoids revealed a significant accumulation of hydroxycinnamic acids, flavonols, flavan 3-ols, and anthocyanin cyanidin 3-O-glucoside, which are extensively studied due to their involvement in the plant response to various pathogens. Metabolomic data corroborated by gene expression analysis indicated that phenylpropanoid biosynthetic and salicylic acid-responsive genes were upregulated in ‘Ca. P. solani-positive plants compared to -negative ones during the observed period.

Graphical Abstract

1. Introduction

Phytoplasmas are plant pathogenic bacteria in the class Mollicutes transmitted by phloem sap-feeding insects. They have a broad range of hosts among plant species worldwide, including many economically important crops such as grapevine, fruit trees, and ornamental plants [1,2]. In Europe, ‘Candidatus Phytoplasma solani’ (‘Ca. P. solani’), taxonomic subgroup 16SrXII-A [3] is associated with “Bois noir” (BN) disease, which can lead to serious losses of grape clusters [4]. BN is endemic in the Euro-Mediterranean area, and it is characterized by a disease cycle, including insect vectors and many herbaceous plants as phytoplasma reservoirs [5,6]. Phytoplasma are still poorly characterized plant pathogens because of their low concentration in plants and the difficulties of in vitro cultivation. Agricultural interest has arisen from the possibilities of controlling phytoplasma diseases through new effective strategies.
Although phytoplasmas interfere with plant physiological processes [7,8], the biochemical and molecular mechanisms responsible for the interaction with their host remain uncertain. However, some studies on the phytoplasma genome have identified the presence of phytoplasma effectors, such as SAP11, SAP54, and TENGU, describing their role in molecular interactions with plant hosts. These effectors modify the activity of plant transcription factors, regulating the expression of genes involved in several metabolic pathways [9,10,11].
Traditional biochemical studies, transcriptomic, proteomic, and metabolomic approaches have been used to study plant–phytoplasma interactions, highlighting the alterations of many metabolic pathways [12,13], above all, sugars [14] and flavonoid biosynthesis [15] in phytoplasma-infected plants.
Plants have complex defense systems to counteract pathogens. When they perceive pathogen signals, they immediately react and induce a complex signaling mechanism, which enhances the expression of plant defense-related genes and the synthesis of phenylpropanoids [16].
There is growing evidence that the elicitation of a specific and appropriate plant response to a pathogen requires the integration and coordination of multiple signaling pathways regulated by plant growth regulators, mainly salicylic acid (SA), jasmonic acid (JA), and ethylene (ET) [17].
SA-mediated defense appears to be a common strategy against phytoplasmas [18]: a high level of SA was detected in apple trees infected by ‘Candidatus Phytoplasma mali’ [19]. Many SA-related genes were found to be highly expressed upon phytoplasma infection in tomato, grape, and periwinkle [12,20,21]. For example, infected periwinkle plants showed a high level of SA and the upregulation of PR1 (pathogenesis-related protein 1), a marker gene of SA signaling [18]. SA also enhances the expression of genes involved in flavonoid metabolism and the accumulation of non-enzymatic antioxidant compounds, such as hydroxycinnamic acids and flavonols [22].
Studies on grapevine responses to phytoplasmas, carried out during the late growing season when grapevine shows disease symptoms, have focused on the transcriptomic as well as metabolomic analyses of infected plants compared with healthy ones [13,15,23,24,25,26]. Overall, the data have revealed the modulation of genes coding for proteins involved in various metabolic pathways, and the upregulation of defense-related genes, such as NPR1 (non-expressor of pathogenesis-related protein 1), coding for an SA receptor, and PR1, PR2, and PR5 (pathogenesis-related proteins 1, 2, and 5), commonly used as molecular markers for SA signaling in systemic-acquired resistance (SAR) [27,28]. Plants produce high local concentrations of SA during the hypersensitive response (HR), leading to host tissue collapse to limit resources for pathogens, and develop systemic-acquired resistance, which is a form of long-term immune memory [29]. In plants, the hormone has been found in both free and conjugated forms and different derivatives can be produced through hydroxylation, amino acid conjugation, and methylation. These modifications inactivate SA, fine-tuning its activity and making up a temporary, readily available SA storage [30].
Several SA-derived compounds have been identified; however, the mode of action of SA-related metabolites is not completely understood [31]. The main SA derivatives associated with the response to several pathogens are 2,5-dihydroxybenzoic acid (known as gentisic acid) and 2,3-dihydroxybenzoic acid [32].
Gentisic acid (GA) is present in considerable amounts in gentiana (Gentiana spp.), grapes (Vitis vinifera), citrus fruit (Citrus spp.), olives (Olea europaea), and sesame (Sesamum indicum). Many studies have reported positive effects of GA on human health, such as its antioxidant, neuroprotective, and antimicrobial activities, and therefore, it has been proposed for the treatment of many diseases [33].
The few data available on the accumulation of SA and its glycosylated forms or derivatives in grapevine leaves infected by ‘Ca. P. solani’ [13,26] or Flavescence dorée phytoplasma [34] have revealed a higher content in infected leaves compared with healthy ones. However, no studies have been reported to date on the accumulation of GA in grapevines infected by phytoplasmas, except for Prezelj et al. [34] and Rotter et al. [35]. The latter authors reported data regarding the overexpression of the DMR6 gene showing 69% of identity to the sequence of Arabidopsis AtDMR6 gene, coding for a SA 5-hydroxylase (E.C. 1.14.13.1) [36].
In addition, an SA 3-hydroxylase, which catalyzes the formation of 2,3-DHBA, seems to play a pivotal role in SA catabolism and homeostasis during the expression of pathogen resistance [31] and leaf senescence [37].
In the present work, we extend our previous study [38] by exploring over four seasonal growth stages the accumulation and physiological role of SA and its derivatives, GA and 2,3-DHBA, in a compatible interaction between ‘Ca. P. solani’ and Sangiovese, a susceptible red grape from central Italy. The metabolomic analysis included the evaluation of changes in phenylpropanoid, quantifying the phenolics, flavonols, anthocyanins, and proanthocyanidins through high-performance liquid chromatography–mass spectrometry (HPLC-MS). A transcriptomic analysis showed the expression of genes involved in the phenylpropanoid biosynthesis and, among several PR genes, PR1, PR2, and PR5.
Our findings highlight the importance of SA- and GA-mediated defense against ‘Ca. P. solani’ in grapevine and offer insights into grapevine–phytoplasma interactions to develop new strategies for controlling BN disease.

2. Results

2.1. Plant Symptoms

Leaves from ‘Ca. P. solani’-positive and -negative plants were sampled in four periods, from the late spring to late summer (May, July, August, and September) of 2020. In May and July, samples were collected from ‘Ca. P. solani’-positive plants showing symptoms of severity class 0 (no symptoms observed). On the other hand, in August, ‘Ca. P. solani’-positive plants were classified as belonging to severity class 2 (the symptoms were mild), and lastly, in September, the plants selected for analysis were classified as belonging to severity class 3 (more than three shoots with reddening leaves) [39]. Therefore, samples collected in May and July from ‘Ca. P. solani’-positive plants were considered as asymptomatic, while those collected in August and September were considered as symptomatic. Leaves collected from ‘Ca. P. solani’-negative plants were classified as class 0 (no symptoms observed) during all sampling stages.

2.2. Characterization of Phenylpropanoids Accumulated in Phytoplasma Infected Plants

2.2.1. Qualitative Analysis

Table 1 reports the phenolic compounds identified by negative ionization mode using HPLC/MS/TOF in leaves of ‘Ca. P. solani’-positive or -negative plants. All compounds were detected, although in different amounts, in both positive and negative plants.
Most of the compounds were present in either glucoside or glucuronide forms, as previously reported in literature [40,41,42]. We found different benzoic acid derivatives, such as dihydroxybenzoic acid glucoside isomer 1(1A); gentisic acid (2A) and dihydroxybenzoic acid glucoside isomer 2 (3A); 2,3 dihydroxybenzoic acid (5A); hydroxybenzoic glucoside (6A); and salicylic acid (15A).
Among the phenylpropanoids, caffeic acid glucoside (4A), coumaric acid glucoside (8A), and ferulic acid glucoside (10A) were identified.
Among the flavonoids, we detected flavan-3-ols, such as catechin glucoside (11A) and epicatechin glucoside (13A); different conjugated forms of flavanol myricetin, such as myricetin 3-O-glucuronide (12A) and myricetin 3-O-glucoside (14A); quercetin 3-O-glucoside (16A), quercetin 3-O-glucuronide (17A), and quercetin 3-O-rhamnoside (21A); and kaempferol 3-O-glucoside (18A), kaempferol 3-O-rutinoside (19A), and kaempferol 3-O-glucuronide (20A). Extracts also contained resveratrol glucoside (22A).
To verify the presence of cyanidin 3-O-glucoside, which was detected in our previous study [38] in leaves of ‘Ca. P. solani’-positive plants, all extracts were also analyzed by positive ionization mode, confirming the presence of cyanidin 3-O-glucoside (24A) and two other anthocyanins, i.e., delphinidin 3-O-glucoside (23A) and peonidin 3-O-glucoside (25A).
Table 1. Putative identification of main phenolic compounds extracted from leaves collected from Vitis vinifera cv. Sangiovese ‘Ca. P. solani’-positive and -negative plants detected by high-performance liquid chromatography time-of-flight mass spectrometry HPLC ESI/MS-TOF.
No.CompoundRT a (min)m/z exp. bm/z calc. c(M-H)Error (ppm)Reference
1ADihydroxybenzoic acid-glucoside is. 12.626315.0736315.0722C13H15O9−4.44[43,44,45]
2AGentisic acid *3.703153.0194153.0193C7H5O4−0.65
3ADihydroxybenzoic acid-glucoside is. 24.500315.0754315.0733C13H15O9−10.15[44,46]
4ACaffeic acid glucoside5.129341.0896341.0878C15H17O9−5.73[47]
5A2,3 Dihydroxybenzoic acid *5.184153.0208153.0193C7H5O4−9.80
6AHydroxybenzoic acid glucoside 5.827299.0789299.0772C13H16O8−5.68[44]
7ACatechin *5.889289.0721289.0718C15H13O6−1.03
8ACoumaric-3-O- acid glucoside6.374325.0940325.0920C15H17O8−6.15[43,45]
9AEpicatechin *6.952289.0737289.0718C15H13O6−6.57
10AFerulic acid-3-O-glucoside7.204355.1049355.1035C16H20O9−3.94[48]
11ACatechin-3-O-glucoside7.253451.1324451.1318C21H23O11−1.33[43]
12AMyricetin-3-O-glucuronide8.796493.0640493.0624C21H17O14−3.24[46]
13AEpicatechin- 3-O-glucoside8.819451.1278451.1318C21H23O118.86[43]
14AMyricetin-3-O-glucoside8.845479.0842479.0831C21H19O13−2.29[45]
15ASalicylic acid *9.426137.0248137.0244C7H5O3−3.04
16AQuercetin-3-O-glucoside *9.488463.0908463.0882C21H19O12−5.61[46]
17AQuercetin 3-O-glucuronide9.940477.0726477.0675C21H17O13−10.69[46]
18AKaempferol 3-O-glucoside *10.438447.0960447.0933C21H19O11−6.03[46]
19AKaempferol 3-O-rutinoside10.637593.1513593.1512C27H29O15−0.16[47]
20AKaempferol 3-O-glucuronide10.808461.0750461.0725C21H17O12−5.42[46]
21AQuercetin 3-O-rhamnoside10.819447.0968447.0933C21H19O11−7.82[47]
22AResveratrol 3-O-glucoside *11.167389.1253389.1242C20H21O8−2.82[47]
No.CompoundRT a (min)m/z exp. bm/z calc. c(M-H)+Error (ppm)Reference
23ADelphinidin 3-O-glucoside *8.357465.1033465.1028C21H21O12−1.07[49]
24ACyanidin 3-O-glucoside *9.637449.1114449.1078C21H21O11−8.01[49]
25APeonidin 3-O-glucoside *12.241463.1253463.1235C22H23O11−3.88[49]
a Retention time (min), b m/z experimental, c m/z calculated from software Agilent Mass Hunter 7.0. * Compound verified by a comparison with authentical chemical standard.

2.2.2. Identification of Phenylpropanoid Compounds

Because many of the phenylpropanoids are detected in glycosylated form, to confirm and quantify each compound identified, extracts from leaves collected from ‘Ca. P. solani’ -positive and -negative plants were digested by β-glucosidase. The typical chromatogram is presented in Figure 1.
Table 2 shows the compounds identified after the enzymatic treatment: mainly two dihydroxybenzoic acids, the 2,5 dihydroxybenzoic acid (or GA), the 2,3 dihydroxybenzoic acid, (compounds 1B and 2B, respectively), and salicylic acid (compound 8B, o-hydroxybenzoic acid).
We also confirmed the presence of hydroxycinnamic acids, i.e., p-coumaric, caffeic and ferulic acids, as well as the aglycon form of flavonoids quercetin, myricetin, kaempferol, and the flavan-3-ol catechin and epicatechin.

2.3. Phenolic Compounds Accumulate in ‘Ca. P. solani’-Positive Plants

To evaluate the changes in phenylpropanoid contents with regard to BN health status, a quantitative analysis was carried out using chemical standards.
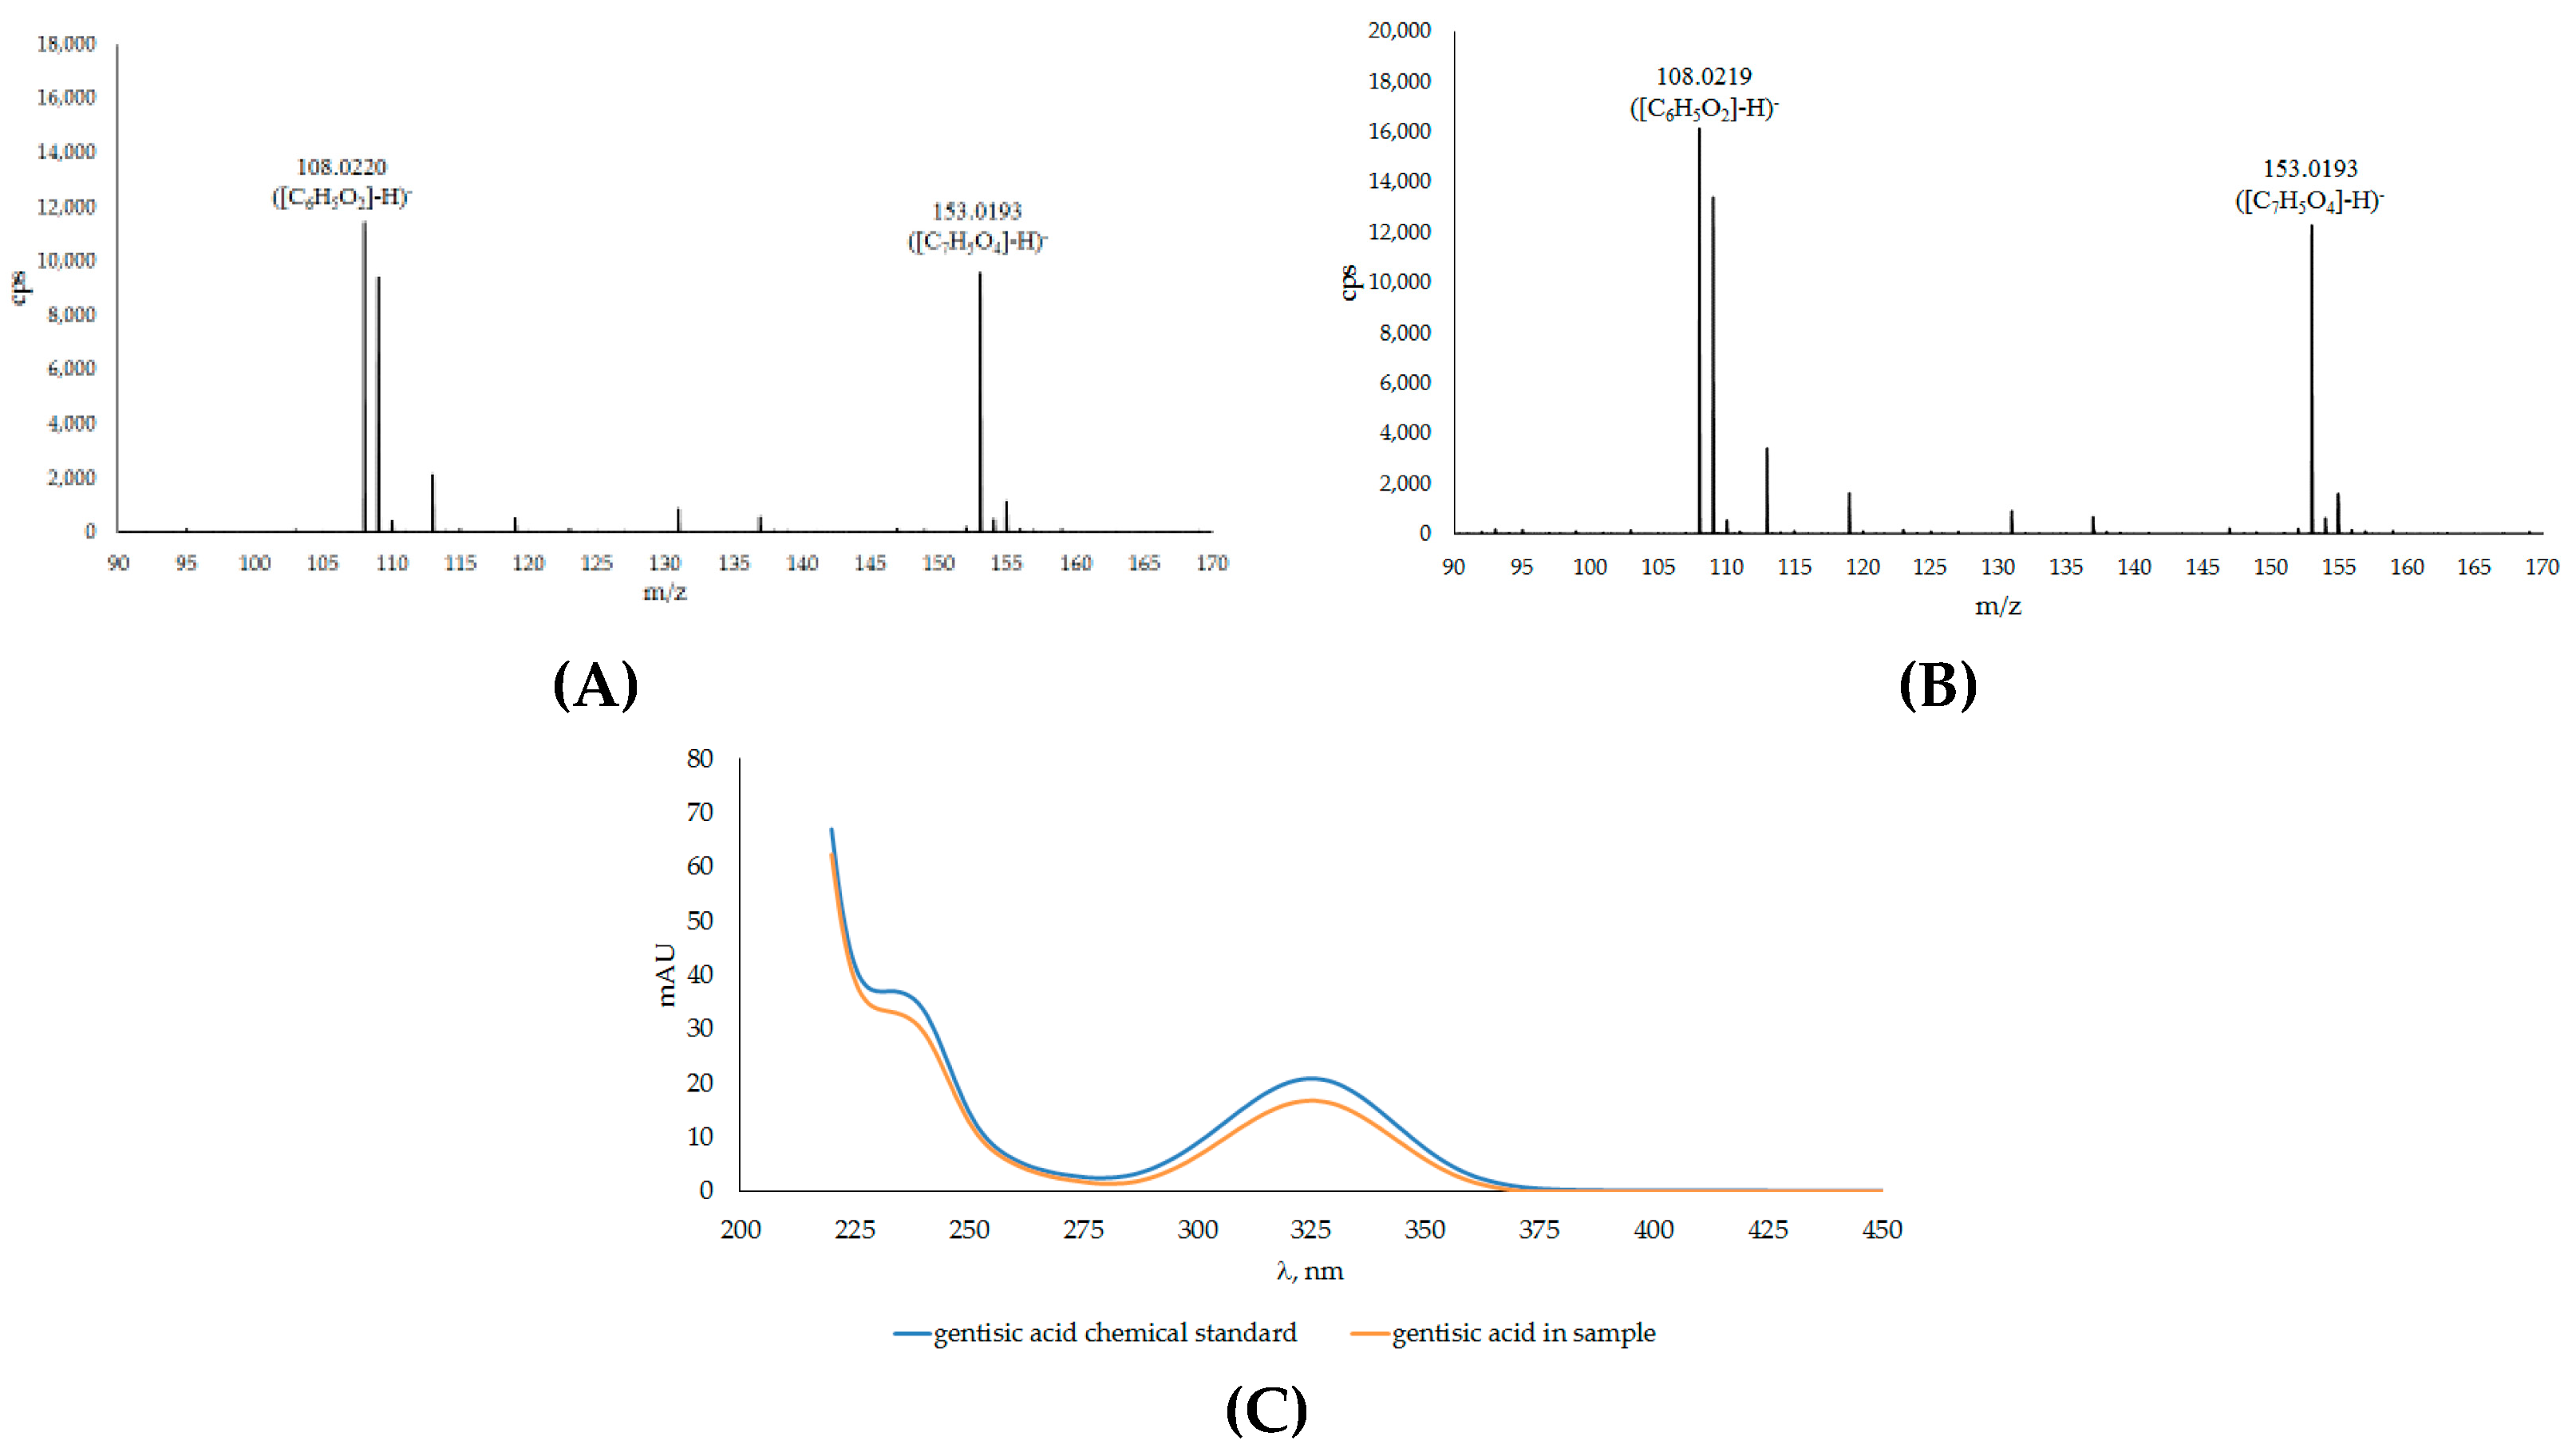
In the chromatogram (Figure 1), the peak 1B corresponds to gentisic acid, resulting from its coelution with standard 2,5 DHBA under the same chromatographic conditions and by comparing its retention time with those previously reported [50]. Figure 2 shows the mass spectra of the compound obtained by ESI in negative ion mode and their UV/Vis peaks. The mass spectrum from the total ion current chromatogram showed a main fragment, which corresponded with the molecular weight of gentisic acid. The mass spectrum also showed an ion at m/z 108, probably arising from the decarboxylation of gentisic acid. The relative intensities of the mass peaks from plant extracts precisely matched those of the standard 2,5 DHBA.
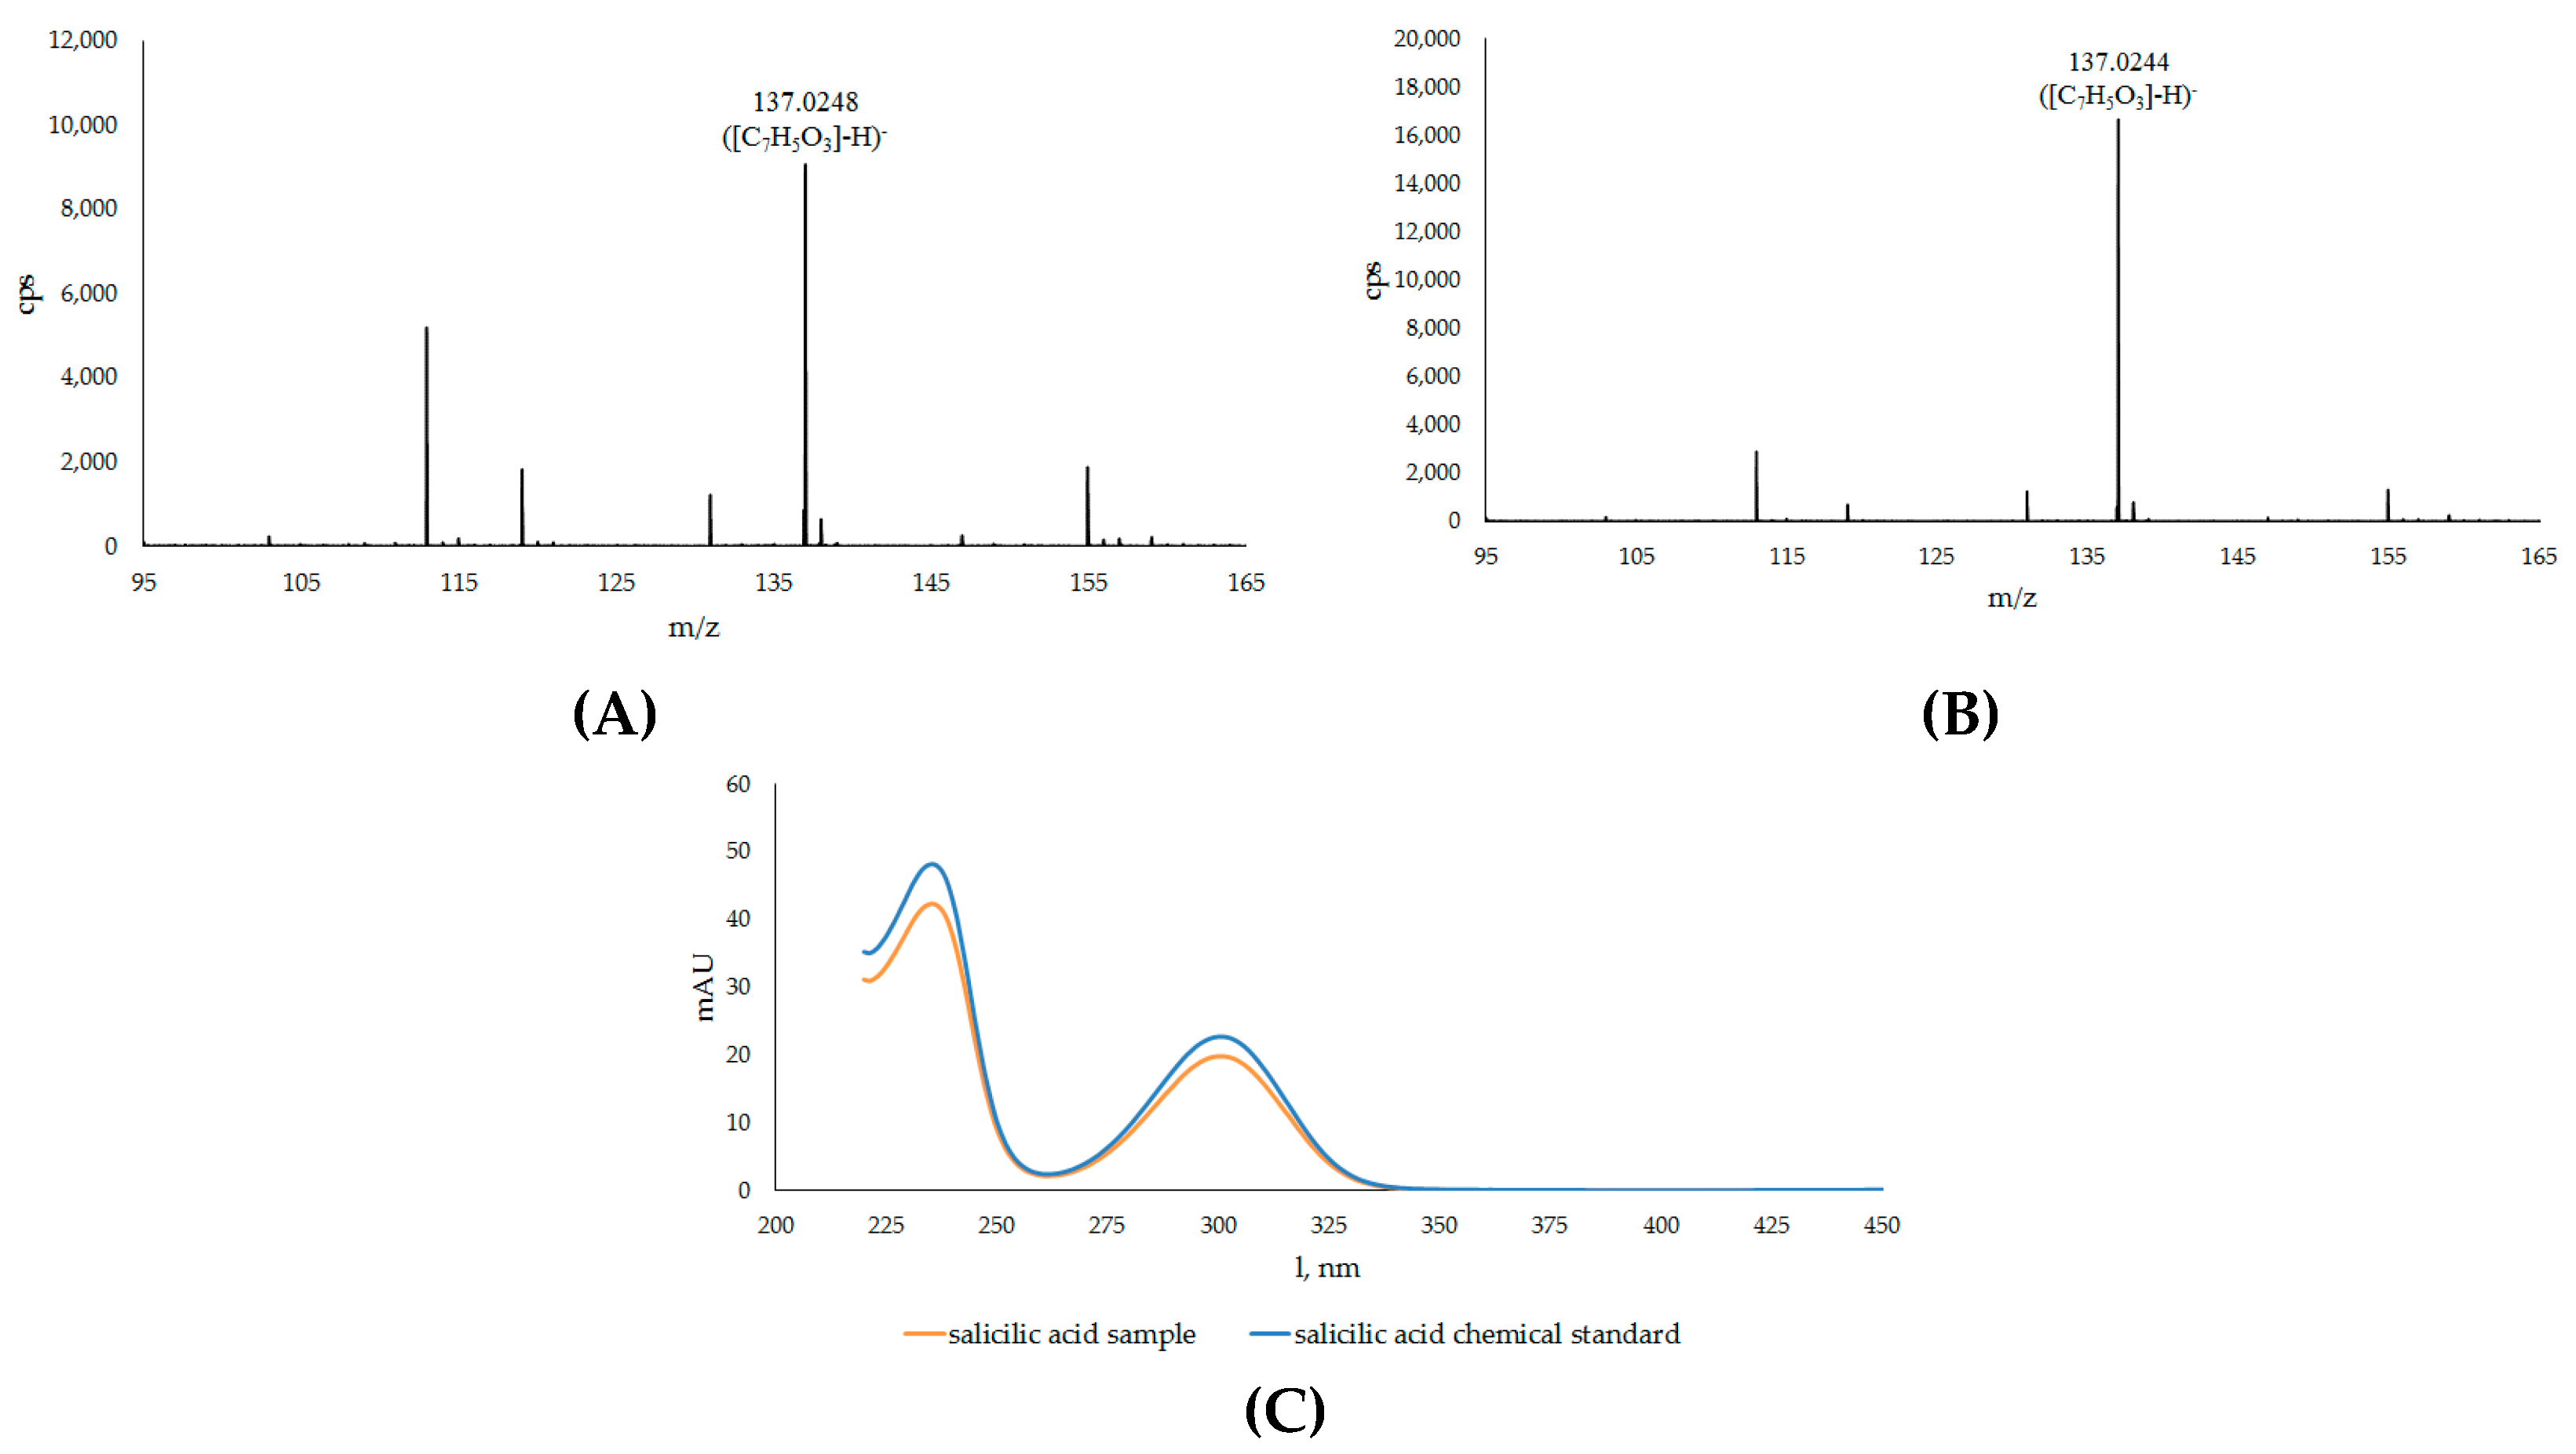
A comparison of the characteristics of compound no. 8B with the MS-spectrum of SA (as standard) showed a perfect match, thus confirming the identity of the two compounds (Figure 3).
Similarly, peak no. 2B was coeluted with standard 2,3 DHBA, and showed a retention time identical to the peak of the compound found by Zhang et al. [37] (Figure S1).
To investigate the accumulation of phenolic acids in free and conjugated forms, we carried out a time-course quantitative analysis, comparing leaf extracts collected from ‘Ca. P. solani’-positive or -negative plants and with different symptom levels according to the different seasons (Figure 4).
We followed the analysis pattern of free GA and SA along the disease progression (Figure 4), which revealed that the presence of free GA was very low in spring and early summer in leaves from ‘Ca. P. solani’-negative plants, similarly to that in the positive ones. However, free GA underwent a slight increase in positive plants in August (0.27 μg/g FW), while in September, it reached a level of about 44 times higher than in negative plants (Figure 4A).
The free SA basal content, in leaves collected from negative plants, was constant throughout the entire growth season, with an average value of about 0.23 μg/g FW. In positive plants, the SA level increased from spring to early summer compared to healthy ones, and in September, free SA increased roughly threefold, reaching the GA content in the same sample (Figure 4B).
In ‘Ca. P. solani’-positive plants, a progressive accumulation of conjugated GA was observed, while in ‘Ca. P. solani’-negative plants, its level remained nearly constant from late spring to early summer, but tripled in August, and finally returned to the initial level in September (Figure 4A). Conversely, in ‘Ca. P. solani’-positive plants, the conjugated GA content gradually increased from May to August, in September, when disease symptoms were pronounced, reaching a high value (about 200 μg/g FW), which was about 25-fold higher than -negative plants and more than 100-fold higher than the GA free amount in the same sample (Figure 4A,C).
The data on conjugated SA (Figure 4D) showed a constant low level in ‘Ca. P. solani’-negative plants (class = 0) for the entire analysis period, and a slightly higher level (average value about 4 μg/g FW) in leaves of ‘Ca. P. solani’-positive plants from May (asymptomatic plants, class = 0) to August. This was the period when the leaves showed mild BN disease symptoms (class = 2), reaching a maximum level of 14 μg/g FW (about three times higher than the basal level) in September, when the plants showed evident disease symptoms (class = 3). Interestingly, in September, in the leaves of positive plants, the level of conjugated GA was more than nine times higher than conjugated SA.
The other SA catabolite, 2,3 DHBA, was not found in free form and, after β-glucosidase digestion, it was undetected in the leaves of both ‘Ca. P. solani’-positive and -negative plants in the late spring and in early summer. On the other hand, it was found in ‘Ca. P. solani’-positive samples at a low level in August (about 2.9 μg/g FW) and increased, about threefold, in infected plants in September (Figure 5A). In ‘Ca. P. solani’-negative plants, levels of 2,3 DHBA in mid and late summer were very low compared to positive plants.
It is known that hydroxycinnamic acids and monocyclic phenylpropanoids are involved in the interactions between pathogens and host plants. When methanol extracts from ‘Ca. P. solani’-positive and -negative grapevine plants were digested with β-glucosidase, p-coumaric and ferulic acid were clearly detected. Both p-coumaric and ferulic acid showed a similar trend during seasonal growth (Figure 5B,C); the increase in hydroxycinnamic acids occurred in parallel with the development and severity of symptoms. The p-coumaric acid levels (Figure 5B) measured in late spring and early summer were either low or absent in both negative and positive plants, whereas in August, the amount increased for both positive and negative plants but without a significant difference. In the last growth stage, p-coumaric levels showed a consistent increase (up to about 100 μg/g FW) in ‘Ca. P. solani’-positive plants, whilst in ‘Ca. P. solani’-negative plants, the levels decreased approximately to 5 μg/g FW. Ferulic acid started to accumulate in August in both ‘Ca. P. solani’-positive and -negative plants, and it reached a peak (33 μg/g FW) only in positive plants in September. In ‘Ca. P. solani’-negative plants, ferulic acid was undetectable (Figure 5C).
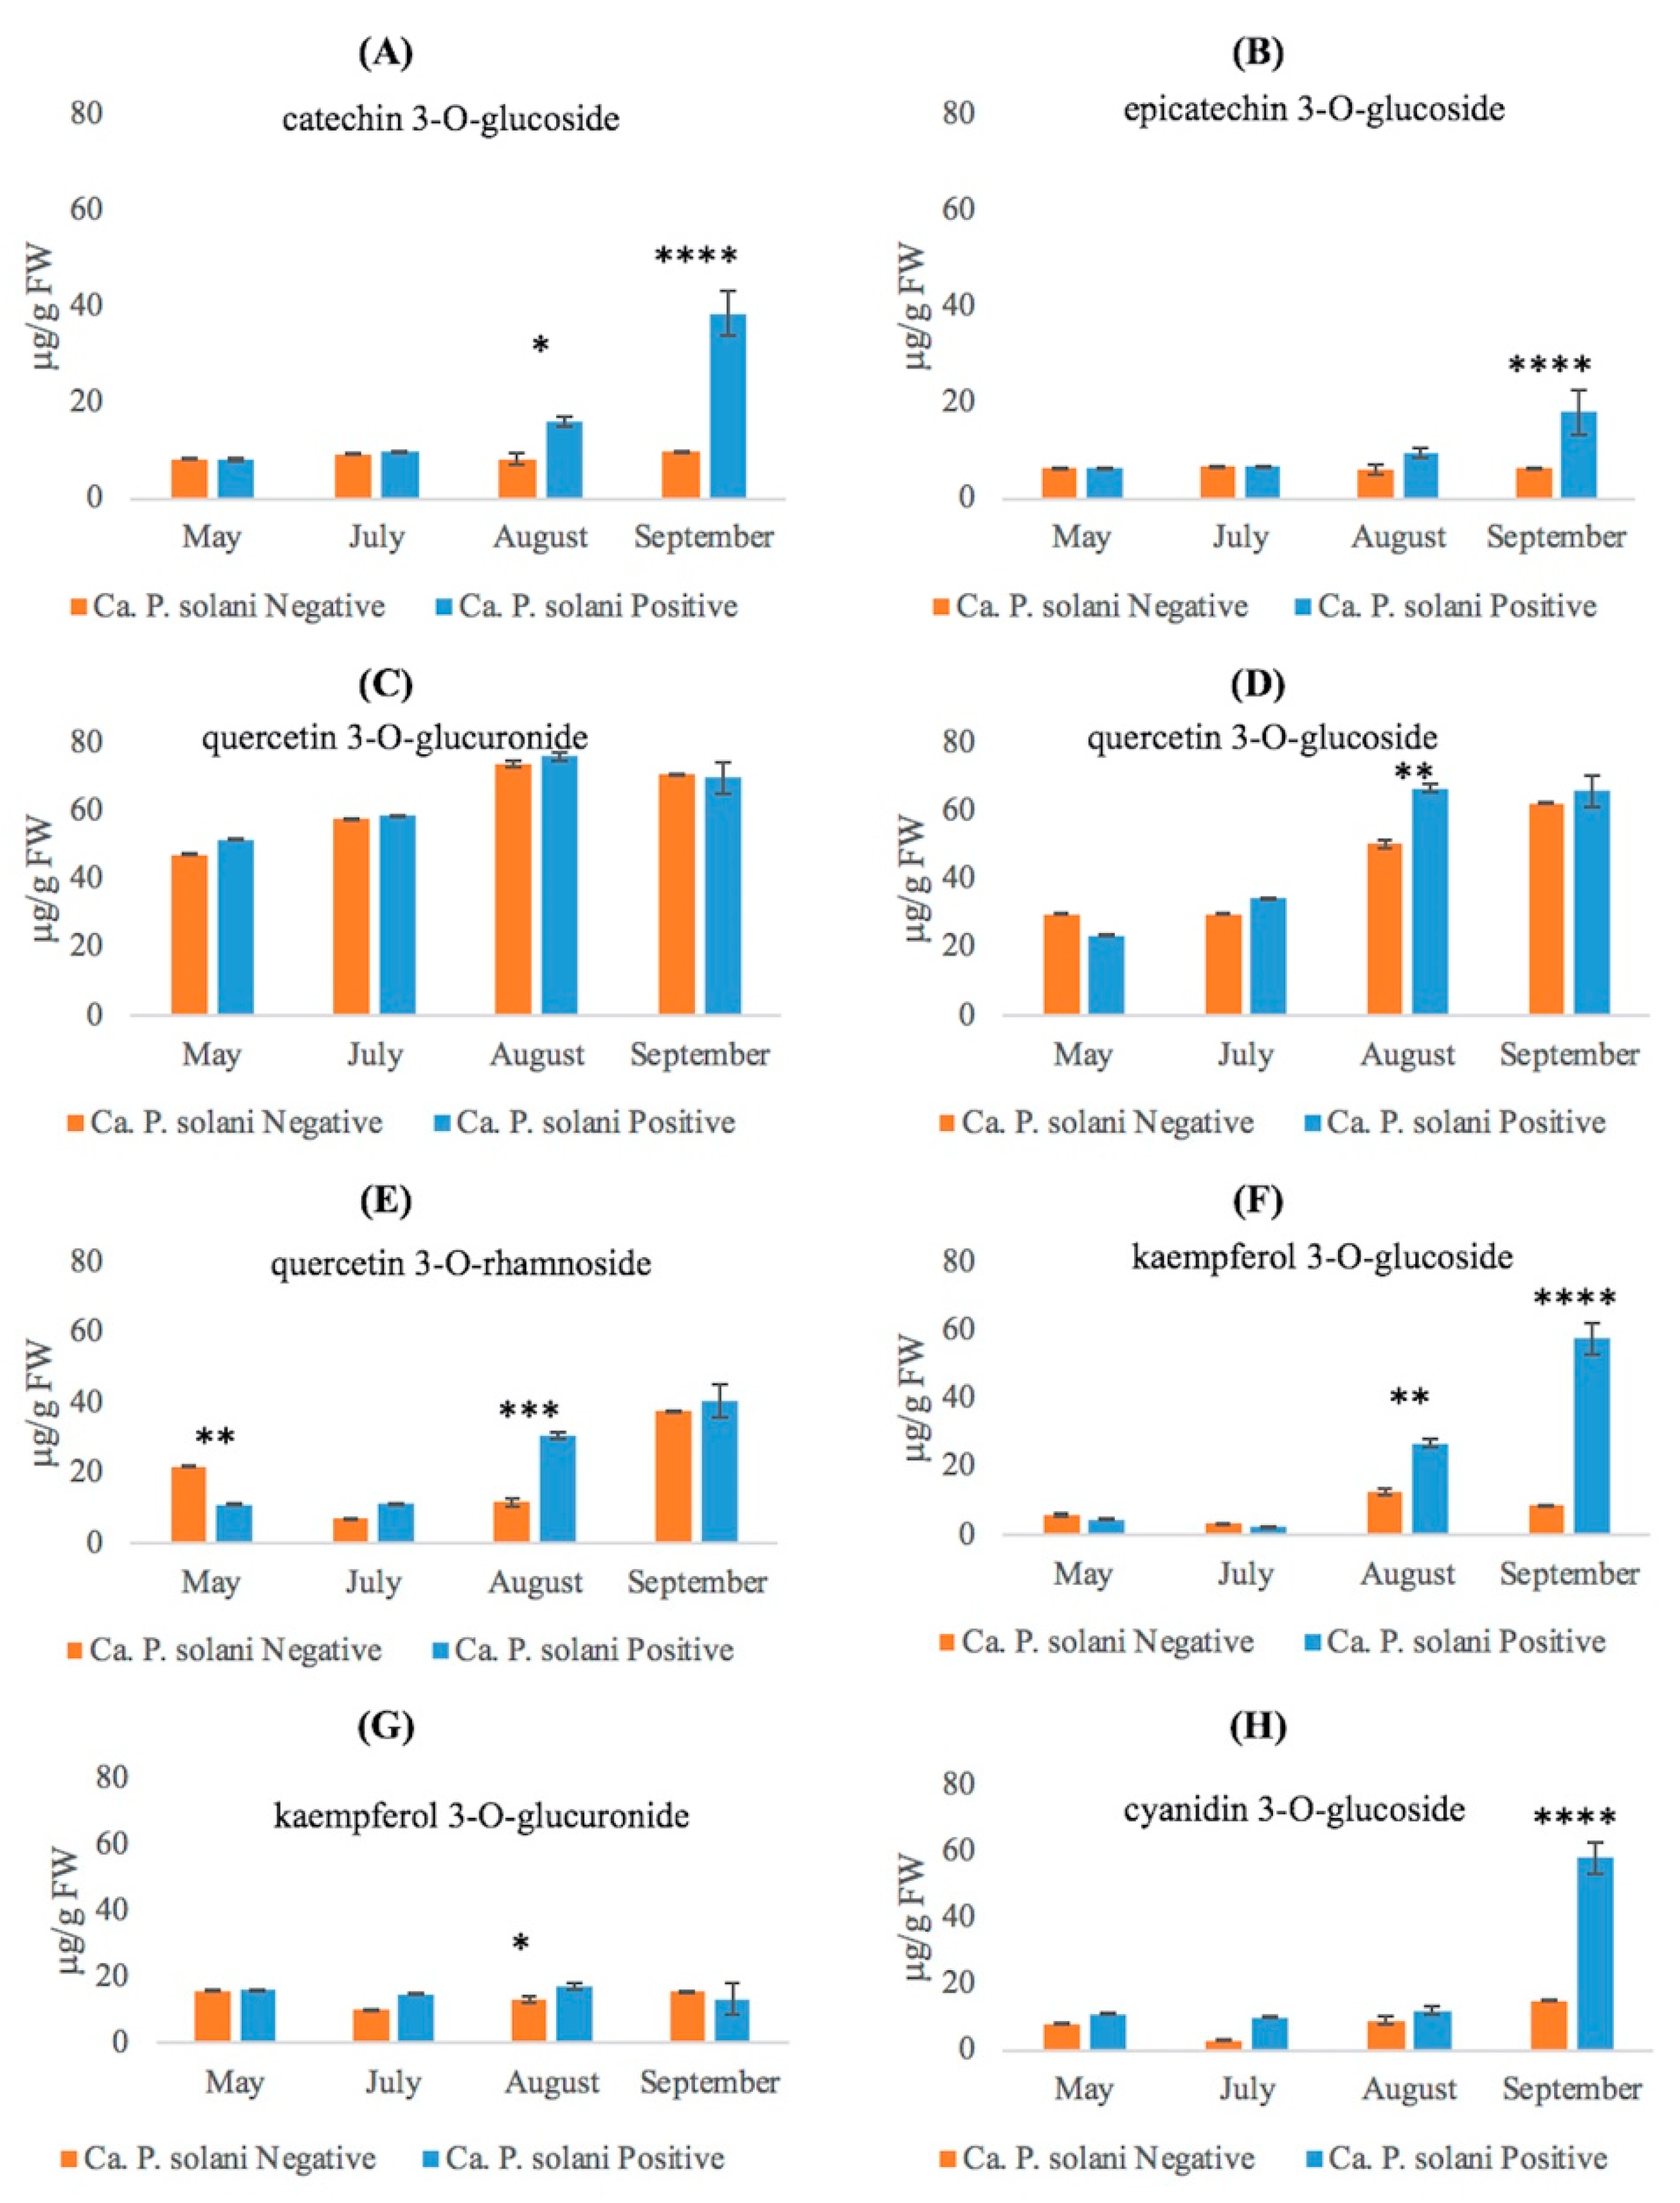
Flavan-3-ols, catechin and epicatechin, identified in all analyzed samples, maintained throughout the seasons approximately the same concentration in the leaves of negative plants. In May and July, no significant differences between ‘Ca. P. solani’-negative and -positive plants were detected, whilst infected plants showed, in August, a 2-fold and 1.5-fold higher content of catechin and epicatechin, respectively, than negative plants. A significant increase (about 3.8-folds) was found in extracts of leaves from ‘Ca. P. solani’-positive plants for catechin and about threefold for epicatechin in September (Figure 6A,B).
Flavonols are typical compounds of grapevine leaves. We found three main forms of conjugated quercetin: the most represented molecule was quercetin 3-O-glucuronide (Figure 6C). Its trend was similar throughout the growth season in both ‘Ca. P. solani’-negative and -positive plants. The quercetin glucoside level (Figure 6D) was similar in negative plants compared to positive ones with a maximum value recorded in August and September for both health statuses. The quercetin 3-O-rhamnoside content (Figure 6E) was the lowest and was the only compound with higher levels in spring in negative plants compared to positive plants. In May, it was twofold higher in ‘Ca. P. solani’-negative plants compared to -positive ones, whereas in early and mid-summer, the amount decreased and then increased again in late summer. The trend in ‘Ca. P. solani’-positive plants was more linear, with low levels in spring and early summer and a significant increase in mid and late summer (Figure 6D). In addition, quercetin 3-O-rhamnoside reached similarly high levels for both health statuses in late summer, increasing earlier in ‘Ca. P. solani’-positive plants, as it reached a high level (3-folds higher than negative plants) from mid-summer.
Another key flavonol, kaempferol, was predominantly present as kaempferol 3-O- glucoside (Figure 6F,G), showing an increase only in ‘Ca. P. solani’-positive plants in late summer. Kaempferol 3-O-glucuronide instead maintained a relatively constant amount during all sampling periods, regardless of the health status.
Among anthocyanins, we identified cyanidin 3-O-glucoside in the leaf extracts. As shown in Figure 6H, there was no significant change in its content with regard to health status from spring to mid-summer, whereas in line with complete leaf reddening, its concentration reached a peak value (about 58 μg/g FW) in ‘Ca. P. solani’-positive plants.

2.4. Expression Analysis

2.4.1. Modulation of Phenylpropanoid Biosynthetic Pathway Genes

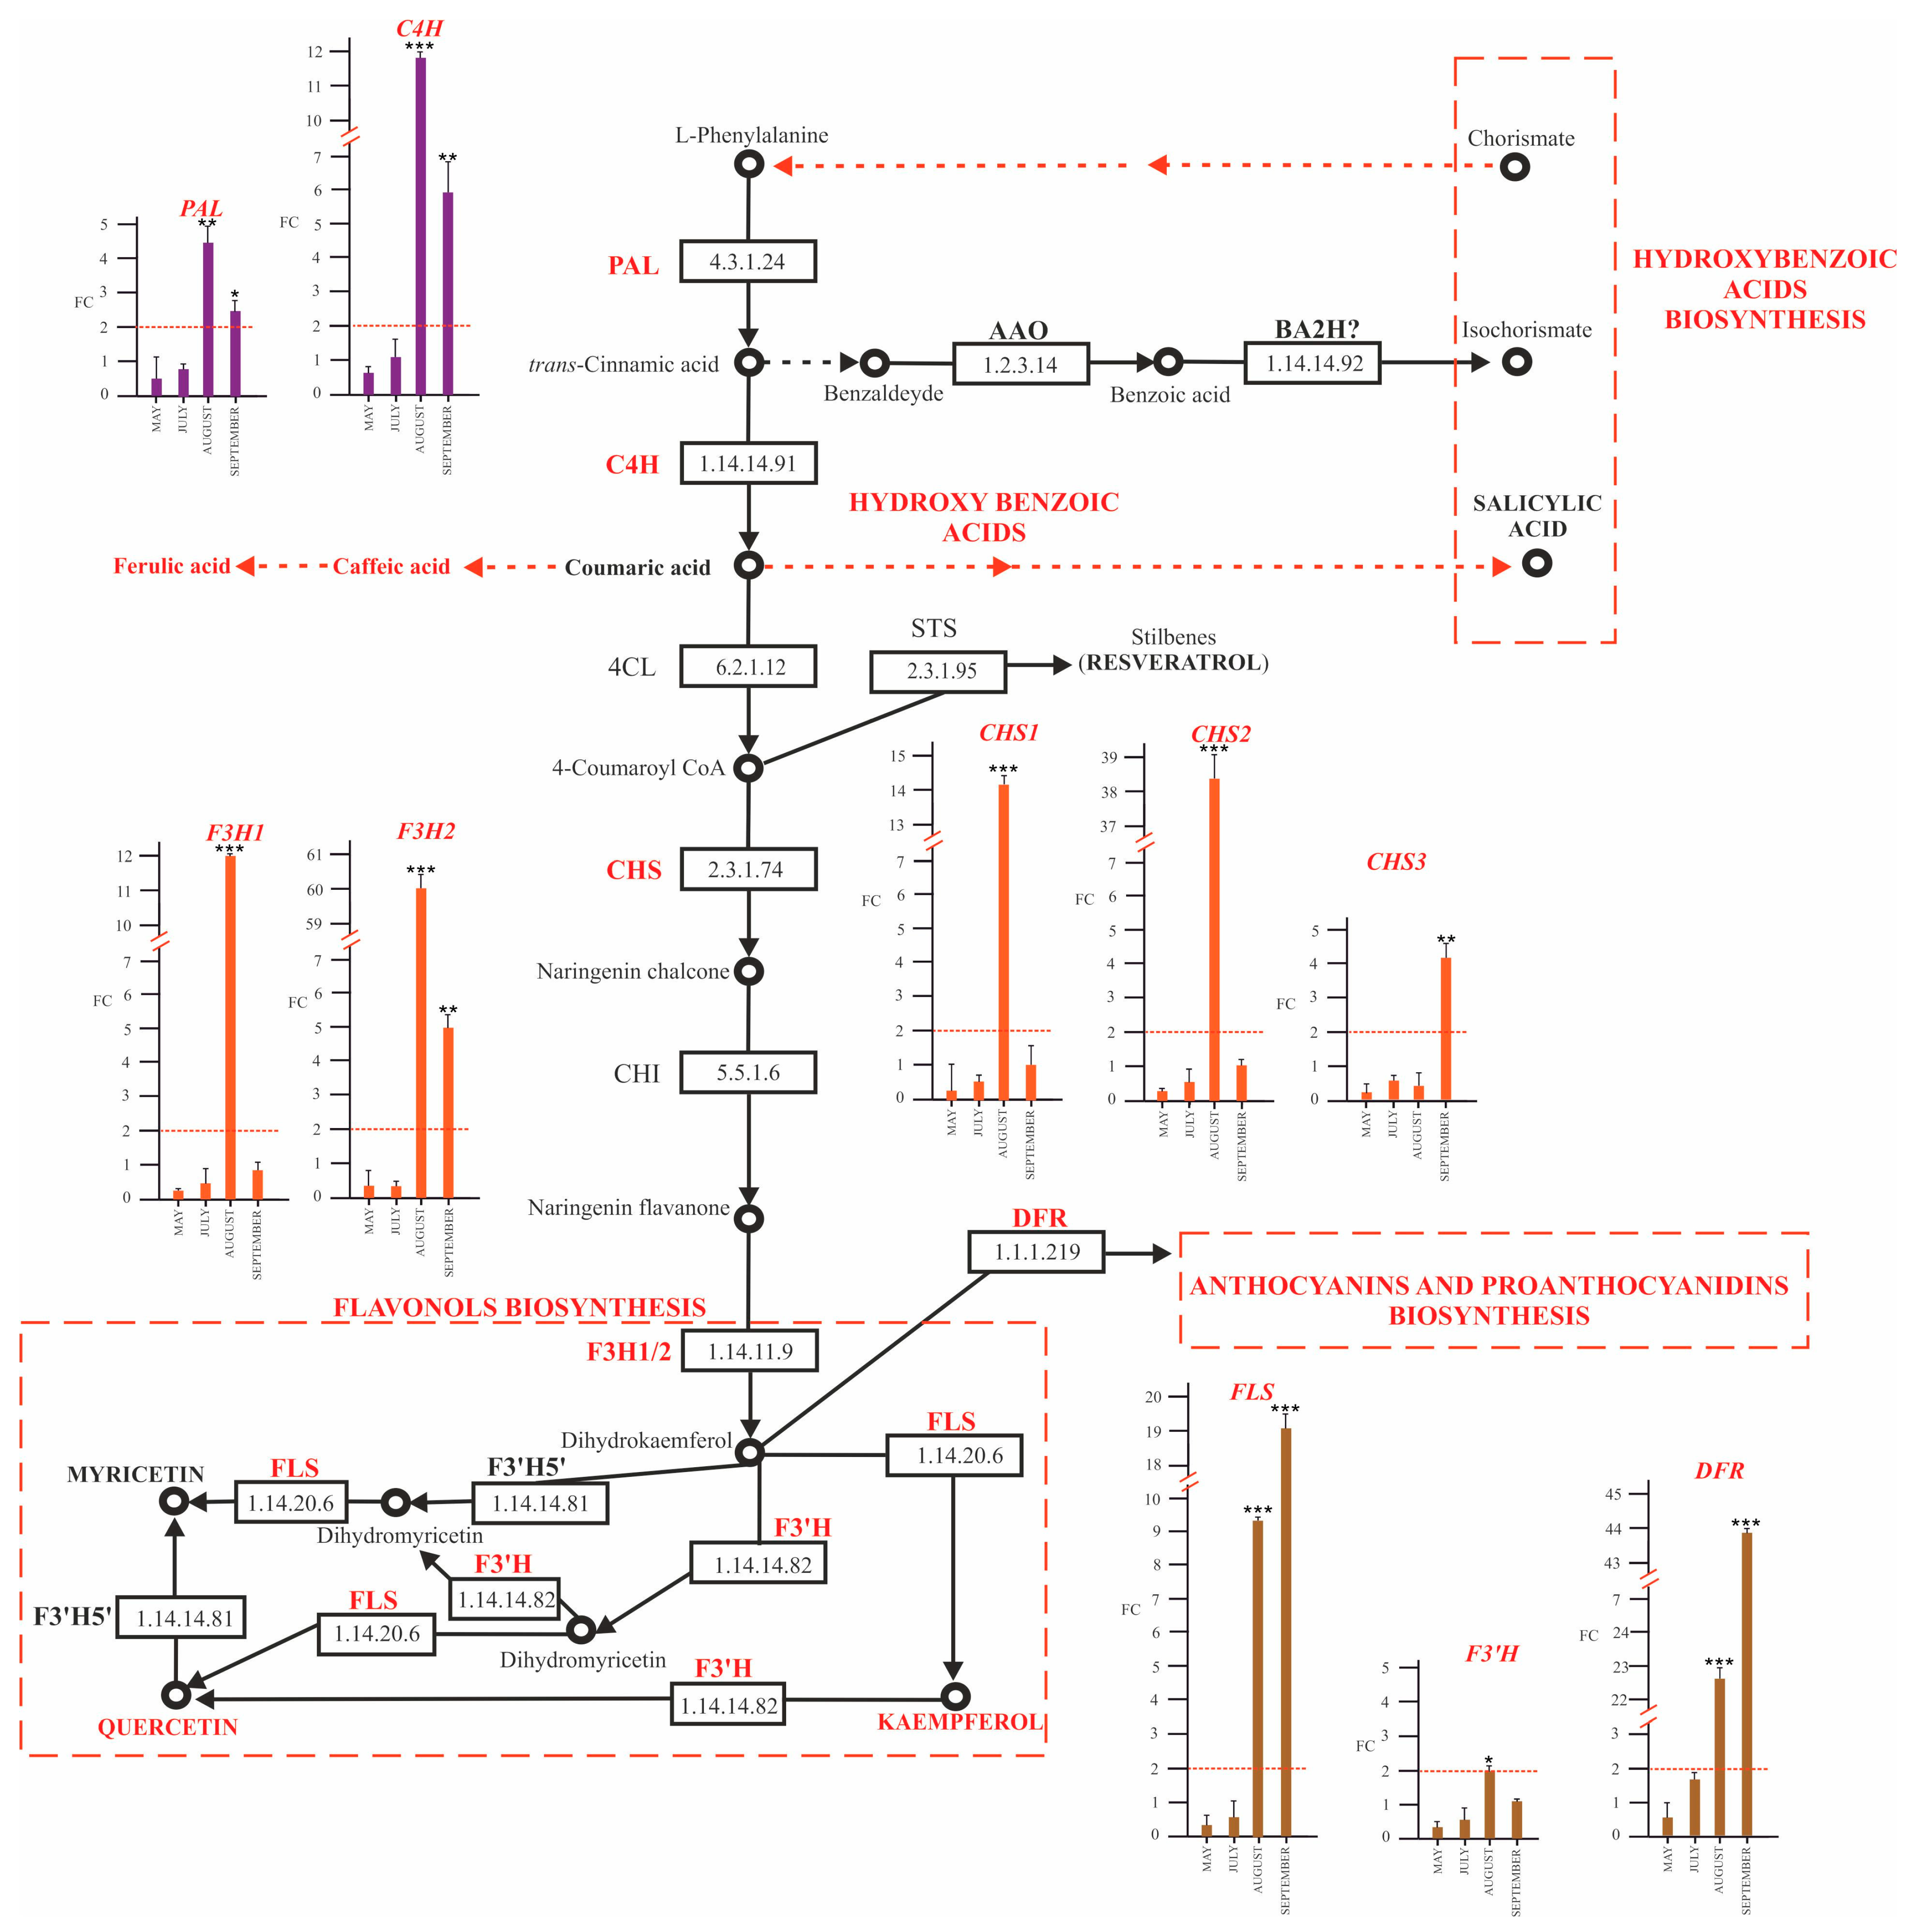
We performed a qPCR assay on a subset of genes involved in phenylpropanoids biosynthesis, including phenylalanine ammonia-lyase (E.C. 4.3.1.5., PAL), coding the first key enzyme in the phenylpropanoid pathway as: “early genes” (cinnamate 4-hydroxylase, E.C. 1.14.14.91, C4H; chalcone synthase E.C.2.3.1.74, CHS; flavanone-3-hydroxylase E.C. 1.14.11.9, F3H; flavonoid-3′-hydroxylase E.C. 1.14.14.82, F3′H; and flavonol synthase, 1.14.20.6, FLS; dihydroflavonol reductase, 1.1.1.219, DFR) (Figure 7) and “late genes” (leucoanthocyanidin dioxygenase, E.C. 1.14.20.4, LDOX; UDP-glucose flavonoid 3-O-glucosyltransferase, E.C. 2.4.2.115, UFGT; and leucoanthocyanidin reductase, EC 1.17.1.13, LAR) of the flavonoid biosynthetic pathway (Figure 8). We assumed that genes were significantly upregulated or downregulated only in the case of a fold change (FC) greater than or equal to 2 or less than equal to −2, respectively.
At the transcriptional level, compared with healthy plants, phytoplasma infection significantly upregulated the expression of genes coding for PAL and C4H in the mid and late summer (August and September) (Figure 7).
For CHS1 and CHS2, we registered an overexpression of about a 14- and 38-fold change in positive plants compared to negative ones in August (Figure 7), respectively, while CHS3 transcript was upregulated (about 4-fold change) in September.
The two isoforms of F3H (F3H1 and F3H2) coding flavanone-3-hydroxylase involved in dihydrokaempferol synthesis showed a similar behavior. In May and July, F3H1 and F3H2 transcripts showed no significant changes, but in August, both genes reached the highest expression (about a 12- and 60-fold change, respectively); in September, the F3H2 transcript overexpression in positive plants was approximatively a 5-fold change.
F’3H coding a flavonoid-3′-hydroxylase showed no significant change in expression with regard to health status.
A high expression level of the FLS gene, involved in the biosynthesis of three main flavonols, quercetin, kaempferol, and myricetin, were observed (Figure 8) in Ca. P. solani- positive plants from mid-summer with a 9-fold change in August and a 19-fold change in September.
DFR coding a NADPH-dependent dihydroflavonol reductase for leucoanthocyanidins synthesis showed a high expression, 22- and 43-fold (Figure 7), respectively, in August and September in positive plants.
Among the “late genes”, specific for the anthocyanin’s biosynthesis, LDOX, which is specific for the conversion of leucoanthocyanidins to anthocyanidins, was overexpressed in September in positive plants (about a 3-fold change) (Figure 8). We also registered an increase in the UF3GT transcript, coding a 3-O-glucosyltransferase, which is involved in the synthesis of cyanidin-3-O-glucoside. The gene was upregulated in leaves of ‘Ca. P. solani’-positive plants only in September (Figure 8). The LAR gene, involved in proanthocyanins (flavan 3-ols) synthesis, was upregulated by 3-fold in July in ‘Ca. P. solani’-positive plants and even more in mid-summer (16-fold), while in late summer, although overexpressed, the transcript level decreased (4-fold) (Figure 8).

2.4.2. SA and Biosynthesis of Its Derivatives

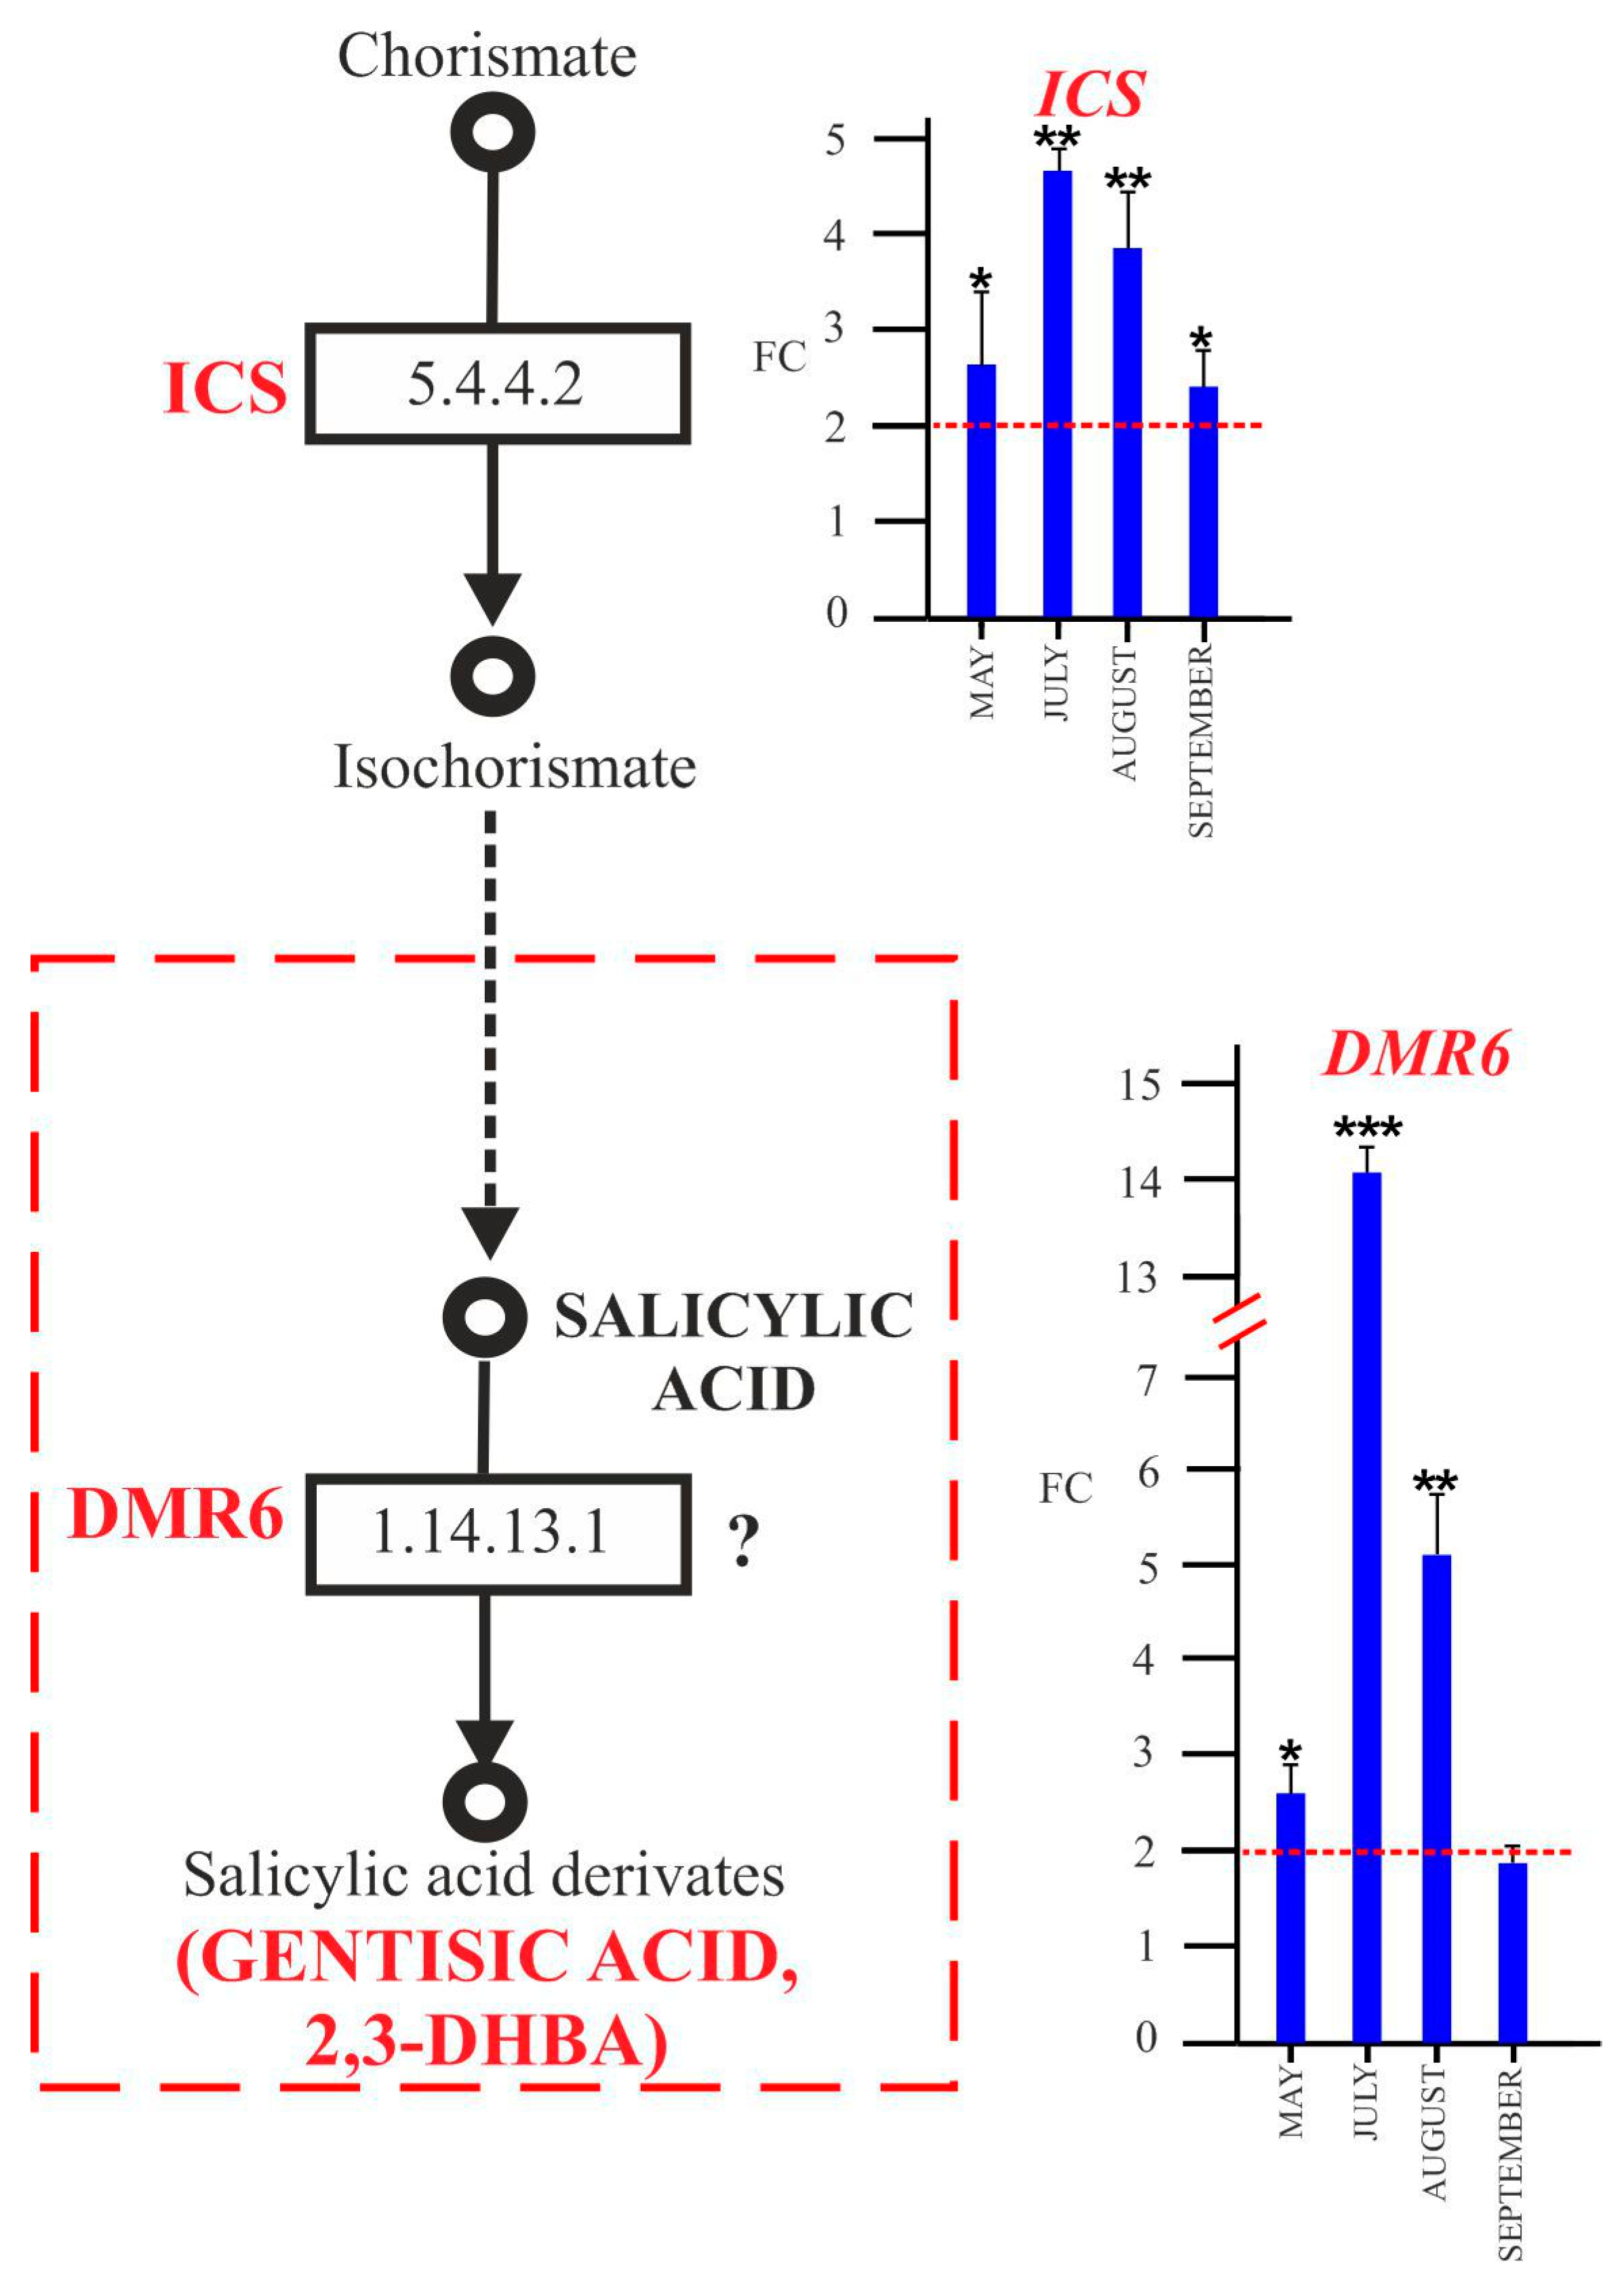
With the data obtained on SA accumulation and the increase in its GA derivative, we investigated the expression of genes such as ICS (E.C. 5.4.4.2) and DMR6 (E.C. 1.14.11) (Figure 9) (in addition to PAL, whose expression profile is presented above in Figure 7), which are responsible for SA and GA syntheses, as indicated by several authors [15,41,42,51,52].
The ICS gene was upregulated in ‘Ca. P. solani’-positive plants for the full growth season (Figure 9). The expression of DMR6 was already high in positive plants (Figure 9) in spring and reached its highest level of overexpression in July (about 14-fold change), maintaining the upregulation in August (about 5-fold change) and September (about 2-fold change).

2.4.3. Expression Patterns of SA-Dependent Defense-Related Genes

In addition, we have analyzed the expression of plant pathogenesis-related genes PR1, PR2, and PR5 and their activator NPR1 (Figure 10). The results highlighted that the NPR1 gene was still upregulated in spring and maintained its upregulation until August. PR1 was upregulated in grapevine leaves upon infection starting from July and reached its maximum level of overexpression in September. The PR2 transcript showed a higher expression in positive plants in the final sampling, while PR5 was upregulated in positive plants from August to September.

3. Discussion

Many studies on plant response to phytoplasma infection have analyzed the late growing season, when the disease symptoms are well evident, analyzing the metabolome and the expression of targeted genes [12,53]. Instead, in our study, we covered a complete growing season to evaluate both the early response of grapevine to ‘Ca. P. solani’ and the late response when disease symptoms appear.
As previously stated, typical BN symptoms on Sangiovese grapevines in central Italy are generally not evident in spring and become visible in the late summer [13]. In fact, our experiments confirmed that the leaves of ‘Ca. P. solani’-positive plants showed no symptoms in spring and in early summer (May and July). On the other hand, weak symptoms, such as reddish bands, appeared along the main veins in August, and gradually covered large leaf areas in September, when plants showed severe symptoms such as discoloration of veins and the reddening of laminas. A similar behavior was observed in ‘Nebbiolo’, which is less susceptible to the Flavescence dorée phytoplasma. In this variety, symptoms are evident only in mid-summer, while in ‘Barbera’, a susceptible cultivar, severe symptoms are already manifest in early summer [15]. Moreover, in ‘Manzoni Bianco’, a BN medium-susceptible cultivar, the symptoms on the leaves are delayed in late summer, with yellowing near the veins [24].
In our work, the analysis of the metabolites highlighted the presence of different phenolic compounds, regardless of health status, including SA and GA. Comparing free and conjugated forms of both phenolics, most were in the conjugated form, in accordance with previous works regarding other compatible interactions [54,55].
In our study, plant immunity seems to be exclusively related to SA and GA, because jasmonic acid, which is known to be involved in the plant response to phytoplasmas [26], was not detected through HPLC analysis in any sample (data not shown). This therefore suggests that, in the interaction between the grapevine cv. Sangiovese and ‘Ca. P. solani’, a key role is played by SA and its derivatives, such as GA.
Ca. P. solani’ seems to induce a high level of conjugated SA forms in infected leaves at the beginning of the growth season, which was maintained constant until the onset of severe disease symptoms, when the conjugated SA reached the maximum accumulation (Figure 4). GA in glycosylated form was constitutively present in the leaves of negative plants in all growth stages. However, in the leaves of positive plants, it gradually increased to approximatively 200 μg/g FW, which is about 13 times higher than conjugated SA when symptoms are more pronounced.
As reported in the literature, this behavior may be related to the required fine-tuning homeostasis of SA in plants. In addition to upstream regulation, an active SA level has been shown to be modulated through metabolic modifications, such as glycosylation, methylation, and hydroxylation [41]. SA hydroxylation is the major pathway for SA catabolism [31,37]. SA could therefore represent the early signaling molecule that triggers the plant response to pathogen. It was then catabolized by the hydroxylation reaction to its two principal derivatives, 2,3- DHBA and GA, which then became glycosylated (Figure 11).
We found that 2,3-DHBA was accumulated from mid-summer (Figure 5A), in line with Zhang et al. [37,40]. These authors reported that SA 3-hydroxylase, which is responsible for 2,3-DHBA biosynthesis, was more specifically expressed at the mature and senescence stage, suggesting its key role in preventing SA overaccumulation. In our experiment, 2,3-DHBA was detected in conjugated form, supporting the idea that this metabolite represents an inactive form of SA.
Most of GA (about 99%) was present in the leaves of positive plants as the conjugated form (Figure 4C). On the other hand, the maximum content of GA free-form content was detected in September, but representing less than 1% of the total (free + conjugated), and negative plants accumulated very low levels of free GA during the growth season (Figure 4A).
Although SA was also predominant in the conjugated form, in ‘Ca. P. solani’-positive plants, the free form was present at a higher level than in the leaves of negative plants, and it quickly increased (about threefold) to a similar level to free GA in September in positive plants (Figure 4B).
This could be explained by considering that free SA basal levels vary in different plant species (in Arabidopsis, the level ranges from 0.24 to 1 μg/g FW; in Oryza sativa, from 0.01 to 37.19 μg/g FW) [40]. Plants generally maintain SA homeostasis by fine-tuning the balance between the biosynthesis and catabolism of SA to regulate biological functions, photosynthesis, and pathogen responses [56]. Therefore, upon pathogen infection, a small amount of SA produced in planta remains in a free state in order to activate the defense response signaling. However, most SAs are subjected to biological modifications to prevent toxic accumulation as shown in Arabidopsis, where SA was glycosylated and then translocated to vacuole for storage [31,37]. Conjugated SA is the most common inactive form of SA, which can be transformed back into the active form when plants are attacked by pathogens [30].
Our finding agrees with the work of Zhang et al. [40], who reported that in Arabidopsis, free 2,3-DHBA and GA were not detected by HPLC analysis, indicating that the levels of these free acids are much lower than free SAs. In addition, according to previous findings [55,57], the conjugation of phenolics with sugar may regulate the endogenous level of free phenolics to protect plants from the toxic effects of free phenolics.
Conjugated GA accumulates in response to different types of plant pathogen interactions in much higher levels than conjugated SAs [58,59], and although the enzymes that catalyze GA glycosylation are known, the enzymes that convert SA in GA are still unknown. Some glycosyltransferases have been identified due to their function in the glycosylation of 2,3-DHBA and GA in vitro [60]. Huang et al. [41] demonstrated that the glycosylation reaction catalyzed by UGT76D1 glycosyltransferase (E.C. 2.4.1) on DHBAs plays a key role in the plant innate immune response through the modulation of SA homeostasis because UGT76D1 overexpression lines show the upregulation of the SA-responsive PR1 and PR2 genes. The same authors also suggested that the increase in conjugated DHBAs activates a mechanism of a positive feedback loop to induce SA biosynthesis, providing a continuous flux toward SAs and DHBAs, which occurs with an enhanced plant defense response.
SA biosynthesis requires the primary metabolite chorismate, and occurs through two major enzymatic pathways, one involving the phenylalanine ammonia lyase (PAL) pathway, and another involving a two-step process metabolized by the enzyme isochorismate synthase (ICS), which converts chorismate to isochorismate [42]. Our data showed an upregulation of the PAL transcript in leaves of ‘Ca. P. solani’-positive plants in late summer. On the other hand, ICS expression was higher in positive plants during all sampling stages (Figure 9), with a good correlation with SA accumulation during the growth season in the leaves of positive plants. In agreement with our results, several studies have revealed that the SA biosynthetic genes are upregulated in whole leaves of grapevines infected by ‘Ca. P. solani’ [23,25,26,35].
The importance of the two pathways varies in different species. In Arabidopsis, the ICS pathway seems to be more important for SA biosynthesis, while rice plants use the PAL pathway, and soybean activates both pathways [61]. For grapevine, we hypothesize (Figure 11) that plants react to phytoplasma infection by already activating the ICS pathway in spring, even if no symptoms are evident, preferring the ICS pathway for SA synthesis. On the other hand, the PAL upregulation registered in infected plants in late summer is probably linked to phenylpropanoid biosynthesis.
Our results on the expression profile of DMR6 (Figure 9) showed an upregulation in infected plants already in spring, correlating with the high content of GA observed in ‘Ca. P. solani’-positive plants. This suggests that GA could be synthesized from SA through a reaction catalyzed by the DMR6-like protein. In accordance with our data, DMR6 was shown to be upregulated early in BN-diseased and -recovered grapevine plants [25]. In addition, a statistical model of general plant pathology proposed by Rotter et al. [35] assumed that BN is linked to the differential expression of the DMR6 gene in infected and uninfected plants of ‘Chardonnay’ grapevine plants. In line with Prezelj et al. [34], this suggests that DMR6 represents a potential early marker gene in the diagnosis of BN grapevine disease. Zhang et al. [40] have proposed that DMR6, a 2-oxoglutarate-Fe (II) oxygenase, acts in Arabidopsis as a salicylic acid 5-hydroxylase (S5H), which converts SA in GA in vivo and in vitro. The same authors speculated that the role of DMR6 is to regulate SA homeostasis during the plant response to pathogens through a feedback mechanism induced by SA.
Although studies have highlighted its involvement in plant immunity through a direct and indirect role, the biological role of GA remains unclear. According to Belles et al. [50,58], GA represents a pathogen-inducible signal in addition to SA for the activation of plant defense, based on the accumulation of GA in conjugated form in the case of exocortis viroid (CEVd) or Prunus necrotic ringspot virus (PNRSV) infection in Cucumis sativus and Gynura aurantica. In addition, an increase in conjugated GA, although lower, was registered in cucumber inoculated with a low titer of Pseudomonas syringae pv. tomato.
Other authors [40,41,62] suggest that GA is involved in plant pathogen resistance by acting as a regulator of SA homeostasis.
To evaluate the probable role of GA in salicylic signaling function in response to phytoplasma attack, we analyzed the expression of the genes coding well-known plant pathogenesis-related proteins such as PR1, PR2, and PR5, which are considered as SA markers. We also analyzed the gene coding NPR1, a key regulator of SA-mediated signaling transduction, which is a useful molecular marker for the SAR response whose expression is salicylic acid responsive. The NPR protein could be considered a hub that controls the reprogramming of gene expression induced by SA, probably via interaction with other compounds [42,63].
Our results (Figure 9) showed that NPR1 was upregulated in infected grapevines from early summer, before the symptoms’ appearance, thus confirming that it represents the first activator of PR protein-mediated response. NPR1 should activate PR1, which seems to be involved in the “early” response, as it was upregulated in infected plants already in July and reached maximum expression in September when symptoms were well evident. Consistently with our data, PR1 were upregulated in ‘Chardonnay’, suggesting that in response to ‘Ca. P. solani infection, the SA signaling pathway is triggered [24].
According to Dermastia et al. [25], who showed that PR2 and PR5 genes were upregulated in the ‘Ca. P. solani’-infected grapevine cultivar ‘Chardonnay’, we found an upregulation of PR2 and PR5 in leaves of infected plants in the late summer, when symptoms appeared. Also, PR2 and PR5 genes are commonly considered as molecular markers for SA-dependent systemic-acquired resistance (SAR) signaling, and their expression is regulated by SA [27]. All these results suggest that ‘Ca. P. solani’ induces the SA-dependent response of infected Sangiovese grapevines, although we detected a higher conjugated GA level than conjugated SA in infected plants.
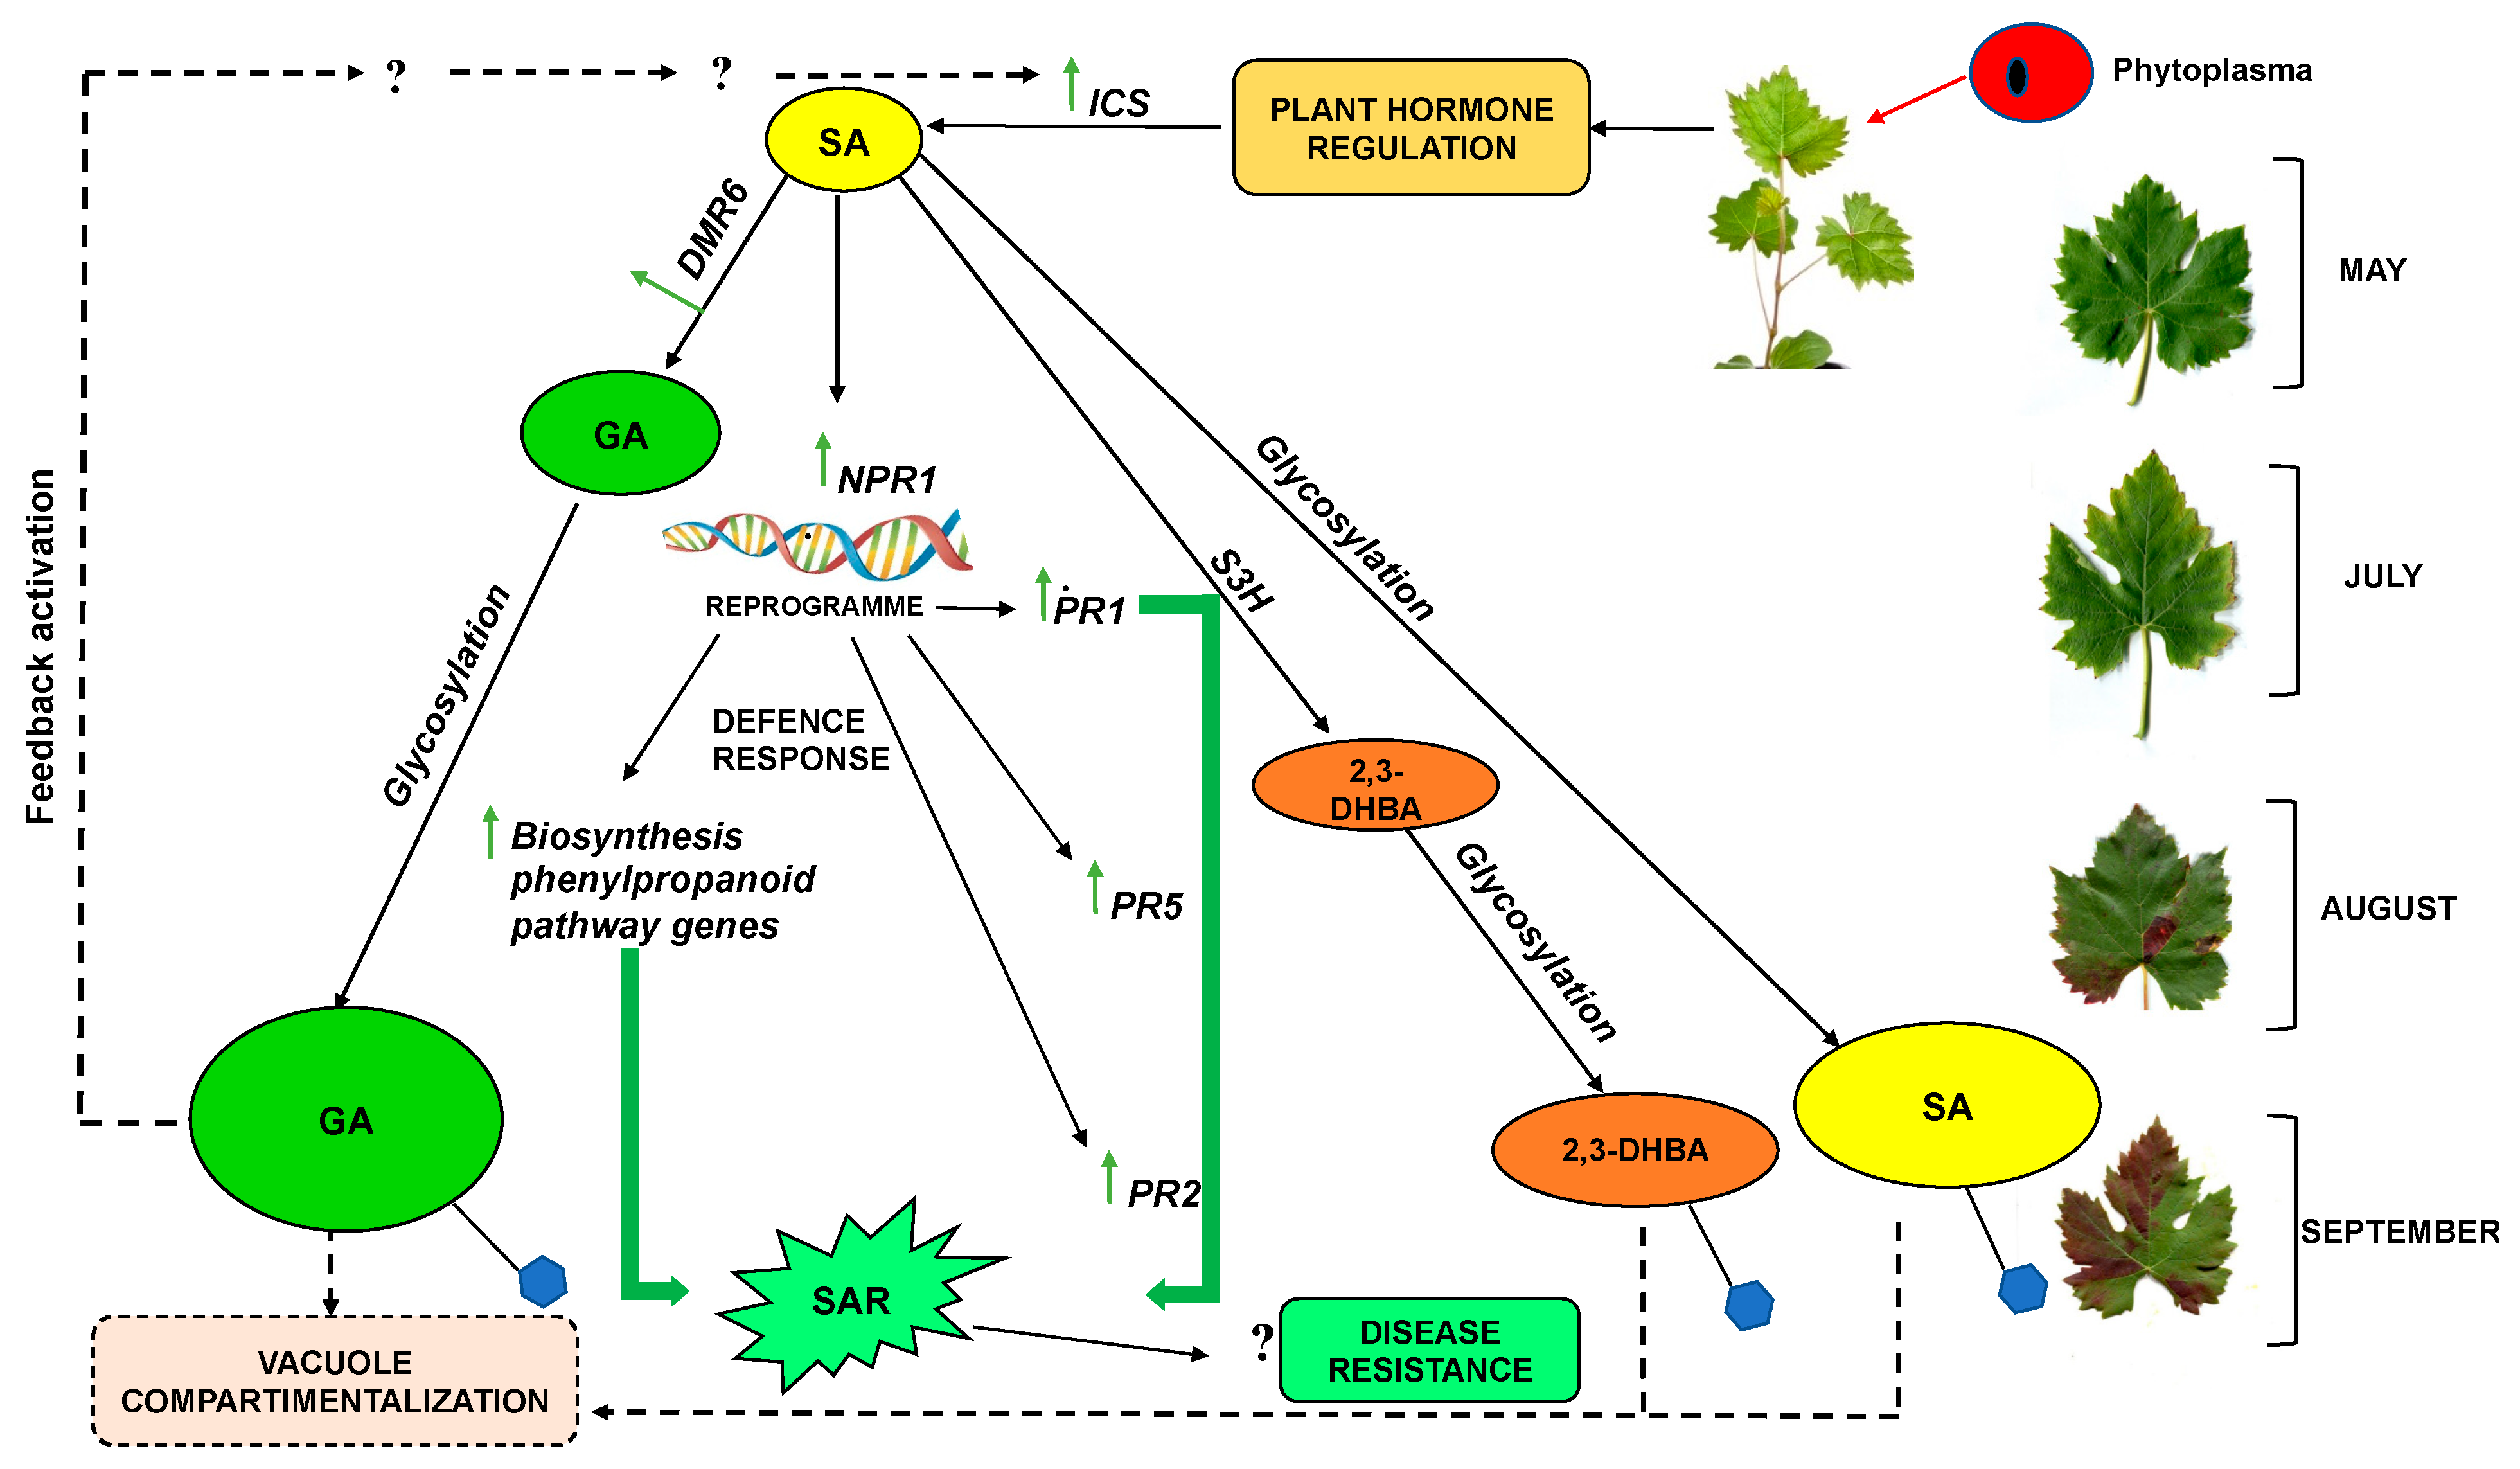
Therefore, in ‘Sangiovese’, as a probable regulator of the SA level, GA is somehow able to modulate the expression of NPR1 and pathogen-related genes, PR1, PR2, PR5, thus confirming that signaling mediated by SA and GA is responsible for the response to BN disease (Figure 11).
We analyzed the phenylpropanoid content in both health statuses, as the flavonoid metabolism is involved in SA-related stress signaling, as reported by other authors [22]. The accumulation of flavonoids and the activation of genes involved in the flavonoid biosynthesis have also been found in multiple phytoplasma infected plants, such as paulownia, grapevine, jujube, and Mexican lime [64]. An increased flavonoid synthesis in phytoplasma-infected plants may be part of the plant’s natural defensive response against pathogen infections. HPLC ESI/MS-TOF analysis identified some phenolic acids, known as hydroxycinnamic acids (HCAs) with a significant increase in p-coumaric and ferulic acid only in symptomatic ‘Ca. P. solani’-positive plants. Their accumulation has been frequently observed as a result of pathogen infections [65,66]. A variation of the HCA content was also reported by Geny et al. [67] after fungal infection in grape berries. On the other hand, an accumulation of ferulic acid has been observed in Vitis vinifera cv. ‘Chardonnay’ BN-diseased plants in earlier phenological stages of shoot lignification [68]. The increase in p-coumaric level in September in extracts obtained from the leaves of positive plants, together with the high upregulation of the CH4 gene, explains the role of p-coumaric acid as a precursor of many flavonoid compounds.
Our results showed higher levels of catechin and epicatechin in ‘Ca. P. solani’-positive plants in September. These results were complemented by transcript analysis, which underlined that in positive plants, the LAR transcript showed a consistent upregulation starting from July until late summer, for a longer period of time than indicated by Negro et al. [38].
Flavan-3-ols, including the monomeric catechin and polymeric proanthocyanidins (PAs), are major end products of the flavonoid biosynthetic pathway in many plant species [69]. They are involved in the protection against pathogen infection, as their biosynthesis is often induced by mechanical wounding and pathogen infections [70,71]. In poplar, their content increased in infected leaves; the transcript of LAR and anthocyanidine reductase (ANR) genes, involved in the last steps of biosynthesis, were upregulated upon infection [72].
An interesting result in relation to anthocyanins was that cyanidin 3-O-glucoside reached the highest level in ‘Ca. P. solani’-positive plants in the last sampling period. Because one of the typical symptoms provoked by phytoplasma is the leaf redness, the anthocyanins accumulation is likely responsible for this phenomenon [73]. In addition, we found a high level of quercetin and kaempferol in positive plants in mid and late summer, respectively. These flavonols, which are a subgroup of flavonoids, are primarily synthesized from dihydroflavonols by FLS; the trend of these compounds correlates with an increase in FLS expression, in infected leaves. Similarly, in grapevines infected by viruses, flavanols synthesis was enhanced by the higher expression of FLS than healthy ones [74]. These results confirm the assumption [13,23,74] that, upon phytoplasma infection through the activation of the NPR1 regulator, SA signaling determines a reprogramming of genes expression, which results in a modulation of phenylpropanoid biosynthetic pathway genes, which are generally upregulated in infected plants that show symptoms.
Our data suggest that SA represents the early signaling molecule that triggers several pathways involved in the ‘Sangiovese’ physiological response to BN, culminating with disease development. This mechanism could provide Sangiovese with a partial resistance to BN disease, although it is unable to completely combat it.
We proposed a hypothetical working model for the signal mechanisms mediated by SA in the interaction of Sangiovese grapevine–phytoplasma during the growth season (Figure 11). When plants are challenged by phytoplasma, this triggers plant hormone regulation, which significantly increases SA biosynthesis. SA immediately activates a signaling pathway in the host, mainly consisting of the reprogramming of different physiological mechanisms, through the induction of some phenylpropanoids biosynthetic and SA-responsive genes, such as NPR1, PR1, PR2, and PR5.
When SA is accumulated at a low basal level (May), a gene coding for SA hydroxylation, such as DMR6, was induced in infected leaves to prevent SA accumulation, thus increasing the GA content. Most of the GA produced was quickly glycosylated, and the continuous accumulation of glycosylated GA probably triggers an unknown positive feedback mechanism to synthetize SA, in line with the model proposed by Huang et al. [41]. This mechanism ensures a flux of SAs and DHBAs to maintain the activation of the plant response to phytoplasma, and at the same time, limiting SA toxicity.
In support of this hypothesis, a constant upregulation of ICS was detected during the growth season; moreover, although we did not analyze a grapevine glycosyltransferase, SA, GA, and 2,3-DHBA were found in the conjugate form throughout the experimental period, confirming the important role of glycosylation.

4. Materials and Methods

4.1. Plant Samples and Phytoplasma Detection

Field surveys were conducted in a cv. Sangiovese vineyard (Vitis vinifera, L. ‘Sangiovese’ I-SS F9 A5 48) located in Greve in Chianti (Tuscany, central Italy) where ‘Ca. P. solani’-positive and -negative plants were detected through multi-year monitoring. Leaf sampling was carried out at different periods according to symptom appearance from late spring to late summer (May, July, August, and September), following the gradual appearance of symptoms in positive plants. Sampling was always performed on the same plants all the time, collecting 10–15 leaves from five ‘Ca. P. solani’-positive plants and five ‘Ca. P. solani’-negative plants. In all sampling periods, the severity of symptoms was classified according to a grapevine reddening symptomatic scale from 0 to 3, as reported by Pierro et al. (2018): (i) symptom severity class 0 = plants with no symptoms, (ii) symptom severity class 1 = one shoot with mild leaf symptoms, (iii) symptom severity class 2 = two to three shoots with leaf symptoms, and (iv) symptom severity class 3 = more than three shoots with symptoms of reddening leaf and berry shrivel.
The collected leaves were stored at −20 °C until DNA extraction for phytoplasma detection or were lyophilized (Christ alpha 2-4 LSC plus, Osterode am Harz, Germany) for biochemical analysis. The DNA was extracted following the procedure described in Nicolì et al. [75]. Specific detection of ‘Ca. P. solani’ was carried out by amplification of 16S ribosomal DNA using a TaqMan assay following reaction conditions as described in Angelini et al. [76]. A threshold cycle of <37 was associated with the presence of ‘Ca. P. solani’.
Both ‘Ca. P. solani’-positive and ‘Ca. P. solani’-negative plants were tested for some of the most common viruses of Vitis spp. (European Commission directive 2005/43/EC). Diagnostic tests (real-time PCR) were carried out for grapevine fanleaf virus, arabis mosaic virus, grapevine leafroll-associated virus 1, grapevine leafroll-associated virus 3, and Grapevine fleck virus [77,78,79]. Both healthy and infected samples were collected from plants that had negative results in all diagnostic tests. In addition, the protection of ‘Ca. P. solani’-positive and ‘Ca. P. solani’-negative plants was carried out according to common practices in the area, and sampled plants showed no symptoms related to Uncinula necator (Schw.) Burr., Plasmopara viticola (Berk. et Curt.) Berl. et de Toni, Botrytis cinerea Pers, and Guignardia bidwellii (Ellis) Viala and Ravaz.

4.2. Extraction of Phenylpropanoids

Samples (about 0.5 g of tissue) were ground in a pre-cooled mortar to a fine powder using liquid nitrogen and then homogenized in 1.5 mL water/methanol 40/60 v/v. The extracts were centrifuged for 15 min at 10,000× g to remove cellular debris. The supernatant for each sample was divided into two equal aliquots and vacuum-dried at 40 °C. An aliquot was resuspended in 900 μL of 50 M−3 sodium acetate buffer (pH 4.5) and 100 μL of water to analyze free SA and GA together with phenolic compounds. Another aliquot was resuspended in 900 μL of 50 M−3 sodium acetate (pH 4.5) and 100 μL of water containing 10 U of almond β-glucosidase (3.2.1.21) (14.3 U mg−1, Sigma Aldrich, Milano, Italy) to remove sugars bound to phenolic compounds. The enzymatic reaction was incubated overnight at 37 °C and then stopped by adding 75 µL of water/perchloric acid 30/70 v/v to the incubation mixture and stored at 4 °C for 1 h. After centrifugation at 14,000× g for 15 min to remove polymers, the supernatants were extracted with 2.5 mL of cyclopentane/ethyl acetate 1/1 v/v. The organic upper phase was collected and dried at 40 °C. The residue was resuspended in 200 μL of methanol and filtered through 0.22 μm prior to HPLC analysis.

4.3. HPLC ESI/MS-TOF Analysis

The phenolic characterization and quantification of leaf extracts were performed using an Agilent 1200 High Performance Liquid Chromatography (HPLC) System (Agilent Technologies, Palo Alto, CA, USA) equipped with a standard autosampler and an Agilent Zorbax Extend-C18 analytical column (5 × 2.1 cm, 1.8 μm), as reported by Vergine et al. [80]. The HPLC system was coupled to an Agilent diode-array detector (wavelength 280 nm) and an Agilent 6320 TOF mass spectrometer equipped with a dual ESI interface (Agilent Technologies) operating in negative ion mode. Detection was carried out within a mass range of 50–1700 m/z. Accurate mass measurements of each peak from the total ion chromatograms (TICs) were obtained by an ISO Pump (Agilent G1310B) using a dual nebulizer ESI source that introduces a low flow (20 μL min−1) of a calibration solution containing the internal reference masses at m/z 112.9856, 301.9981, 601.9790, and 1033.9881, in negative ion mode. The anthocyanins were identified with the same method, but with positive ionization (detection wavelength 280 and 520 nm), using the internal reference masses at m/z 121.050873, 149.02332, 322.048121, and 922.009798, as reported by Aprile et al. [81].
The compounds were quantified using calibration curves of authentic standards (salicylic acid, gentisic acid, 2,3-DHBA, catechin, epicatechin, quercetin, kaempferol 3-O-glucoside, resveratrol glucoside, cyanidin 3-glucoside).

4.4. RNA Extraction and qRT-PCR

Leaf tissues sampled from healthy and infected plants at four growth stages were frozen in liquid nitrogen, and total RNA was isolated from 0.1 g of samples using TRIZOL (Invitrogen, Carlsbad, CA, USA). cDNA synthesis was carried out using TaqMan® Reverse Transcription Reagents (Applied Biosystems, Foster City, CA, USA) according to the manufacturer’s standard protocol. Amplification reactions were performed using the Applied Biosystems® QuantStudio® 3 Real-Time PCR System. Each reaction consisted of 2 ng of cDNA, 12.5 μL of Power SYBR Green RT-PCR Master mix (Applied Biosystems), 5.0 M-6 forward and reverse primers, and ultrapure DNase/RNase-free water (Carlo Erba Reagents S.r.l.) in a total volume of 25 μL. The cycling conditions were as follows: 2 min at 50 °C and 10 min at 95 °C, followed by 45 cycles of 95 °C for 15 s, and 60 °C for 1 min. Melting curve analysis was performed after PCR to evaluate the presence of non-specific PCR products and primer dimers.
The primers (Supplementary Table S1) were designed with Primer Express Software 3.0 on the mRNA sequences obtained from the literature [13,23,34,74].
Quantitative real-time PCR was used for rapid and reliable quantification of mRNA transcription. However, selecting an appropriate reference gene is crucial for an exact comparison of mRNA transcription in different samples. Of the various genes reported in the literature, we used COX (cytochrome c oxidase, E.C. 1.9.3.1) as a reference gene, as reported by Bertazzon et al. [82].
For the relative quantification of gene expression, we calculated the fold changes (FCs) using the following formula:
F= 2(−∆∆CT)
where:
∆∆CT = [(CT target gene) − (CT reference gene)]positive sample − [(CT target gene) − (CT reference gene)] healthy sample
The CT data are expressed as the average of 12 samples.
For each individual sample, four technical replicates were analyzed.
With the cut-off value of a 2-fold change in gene expression, we considered the upregulation in positive plants compared to negative plants.

4.5. Statistical Analysis

All data were reported as the mean ± SD in triplicate for each analyzed sample (n = 5, ‘Ca. P. solani’-positive and -negative plants, respectively). The statistical analysis was performed using multiple t-tests (FDR = 5%) to highlight the differences between ‘Ca. P. solani’-positive and -negative leaves for each physiological parameter analyzed. Statistical analyses were performed using GraphPad v. 6.01. A one-way ANOVA test was applied to expression gene data.

5. Conclusions

Our results confirm the previous evidence that phytoplasma interact with the SA pathway [36]. In addition, we identified a high level of conjugate gentisic acid in grapevine infected by Candidatus Phytoplasma solani.
The altered physiological conditions may also be a consequence of the phytoplasma effects on development and stress signaling pathways and of the interactions between them.
The biology of phytoplasmas and the actual defense mechanisms of plants are still unknown because the pathogens need plants and insects for survival in nature, which means that an “in vitro” cultivation is very difficult. However, the metabolomic and transcriptomic data that we obtained confirm that innate immunity, phytohormone signaling, and many phenylpropanoid compounds, which constitute a complex defense network in plants, are involved in the response of grapevine-to-phytoplasma infection.
Although SA is essential in the grapevine–phytoplasma interaction, it is not the exclusive signal, with GA appearing to play a role in enabling or modulating the grapevine response to phytoplasma infection. GA did not interfere with the biological effects of SA; however, it represents a component of the grapevine SA-dependent response, probably for the role to fine-tune the SA level.
Our results suggest a new point of view concerning the physiological mechanisms underlying phytoplasma–grapevine interactions aimed at improving disease control strategies.

Supplementary Materials

The following supporting information can be downloaded at: https://www.mdpi.com/article/10.3390/plants12142695/s1, Figure S1: Mass spectra of the 2,3 DHBA found in the sample (A) and of the chemical standard (B) and their UV/Vis absorption spectra of the peak 8B shown in Figure 1 after sample digestion with β-glucosidase (C); Table S1: Primer selected for the gene expression analysis.

Author Contributions

E.N., C.N. and A.L. planned the experimental design and wrote the manuscript. R.P., A.P. (Alessandra Panattoni) and C.M. performed sampling and symptoms evaluation. F.Q. and A.P. (Alessandro Passera) performed health analysis and wrote the first draft of the manuscript. M.D.P., E.N. and E.S. processed samples for mRNA extraction and qRT-PCR analysis. C.N. carried out HPLC ESI/MS-TOF analysis. P.A.B. and L.D.B. critically revised the manuscript. All authors have read and agreed to the published version of the manuscript.

Funding

This research received no external funding.

Data Availability Statement

Not applicable. All results are included in the article.

Conflicts of Interest

The authors declare no conflict of interest.

References

  1. Hogenhout, S.A.; Oshima, K.; Ammar, E.D.; Kingdom, H.N.; Namba, S. Phytoplasmas: Bacteria that manipulate plants and insects. Mol. Plant Pathol. 2008, 9, 403–423. [Google Scholar] [CrossRef] [PubMed]
  2. Maejima, K.; Oshima, K.; Namba, S. Exploring the phytoplasmas, plant pathogenic bacteria. J. Gen. Plant Pathol. 2014, 80, 210–221. [Google Scholar] [CrossRef] [Green Version]
  3. Quaglino, F.; Zhao, Y.; Casati, P.; Bulgari, D.; Bianco, P.A.; Wei, W.; Davis, E.R. ‘Candidatus Phytoplasma solani’, a novel taxon associated with stolbur and Bois noir-related diseases of plants. Int. J. Syst. Evol. Microbiol. 2013, 63, 2879–2894. [Google Scholar] [CrossRef] [Green Version]
  4. Starý, M.; Válová, P.; Šafářová, D.; Lauterer, P.; Ackermann, P.; Navrátil, M. Survey and molecular detection of Bois noir in vineyards of the Czech Republic. Hortic. Sci. 2013, 40, 83–87. [Google Scholar] [CrossRef] [Green Version]
  5. Belli, G.; Bianco, P.A.; Conti, M. Grapevine yellows in Italy: Past, present and future. J. Plant Pathology 2010, 92, 303–326. [Google Scholar]
  6. Cvrkovic, T.; Jovic, J.; Mitrovic, M.; Krstic, O.; Tosevski, I. Experimental and molecular evidence of Reptalus panzer as a natural vector of Bois noir. Plant Pathol. 2014, 63, 42–53. [Google Scholar] [CrossRef] [Green Version]
  7. Bertamini, M.; Nedunchezhian, N.; Tomasi, F.; Grando, M.S. Phytoplasma Stolbur-subgroup (Bois noir-BN) infection inhibits photosynthetic pigments, ribulose-1,5-bisphosphate carboxylase and photosynthetic activities in field grown grapevine (Vitis vinifera L. cv. Chardonnay) leaves. Physiol. Mol. Plant Pathol. 2002, 61, 357–366. [Google Scholar] [CrossRef]
  8. Rusjan, D.; Halbawirth, H.; Stich, K.; Mikulic-Petrovsek, M.; Veberic, R. Biochemical response of grapevine variety ‘Chardonnay (Vitis vinifera L.) to infection with grapevine yellows (Bois noir). Eur. J. Plant Pathol. 2012, 134, 231–237. [Google Scholar] [CrossRef]
  9. Maclean, A.M.; Sugio, A.; Makarova, O.V.; Findlay, K.C.; Grieve, V.M.; Toth, R.; Nicolaisen, M.; Hogenhout, S.A. Phytoplasma effector SAP54 induces indeterminate leaf-like flower development in Arabidopsis plants. Plant Physiol. 2011, 157, 831–841. [Google Scholar] [CrossRef] [Green Version]
  10. Minato, N.; Himeno, M.; Hoshi, A.; Maejima, K.; Komatsu, K.; Takebayashi, Y.; Kasahara, H.; Yusa, A.; Oshima, K.; Kamiya, Y.; et al. The phytoplasmal virulence factor TENGU causes plant sterility by downregulating of the jasmonic acid and auxin pathways. Sci. Rep. 2014, 4, 7399. [Google Scholar] [CrossRef] [Green Version]
  11. Sugio, A.; Maclean, A.M.; Hogenhout, S.A. The small phytoplasma virulence effector SAP11 contains distinct domains required for nuclear targeting and CIN-TCP binding and destabilization. New Phytol. 2014, 202, 838–848. [Google Scholar] [CrossRef] [PubMed] [Green Version]
  12. Gambino, G.; Boccacci, P.; Margaria, P.; Palmano, S.; Gribaudo, I. Hydrogen peroxide accumulation and transcriptional changes in Grapevines recovered from Flavescence Dorée disease. Phytopathology 2013, 103, 776–784. [Google Scholar] [CrossRef] [PubMed] [Green Version]
  13. Landi, L.; Romanazzi, G. Seasonal variation of defense-related gene expression in leaves from Bois noir affected and recovered grapevines. J. Agr. Food Chem. 2011, 59, 6628–6637. [Google Scholar] [CrossRef] [PubMed]
  14. Mou, H.Q.; Lu, J.; Zhu, S.F.; Lin, C.L.; Tian, G.Z.; Xu, X.; Zhao, W.J. Transcriptomic analysis of Paulownia infected by Paulownia witches’-broom Phytoplasma. PLoS ONE 2013, 8, e77217. [Google Scholar] [CrossRef]
  15. Margaria, P.; Ferrandino, A.; Caciagli, P.; Kedrina, O.; Schubert, A.; Palmano, S. Metabolic and transcript analysis of the flavonoid pathway in diseased and recovered Nebbiolo and Barbera grapevines (Vitis vinifera L.) following infection by Flavescence dorée phytoplasma. Plant Cell Environ. 2014, 37, 2183–2200. [Google Scholar] [CrossRef]
  16. Dixon, R.; Achnine, L.; Kota, P.; Liu, C.J.; Srinivasa Reddy, M.S. The phenylpropanoid pathway and plant defence. A genomics prospective. Mol. Mol. Plant Pathol. Pathol. 2002, 3, 371–390. [Google Scholar] [CrossRef]
  17. Yang, J.; Duan, G.; Li, C.; Liu, L.; Han, G.; Zhang, Y.; Wang, C. The Crosstalks Between Jasmonic Acid and Other Plant Hormone Signaling Highlight the Involvement of Jasmonic Acid as a Core Component in Plant Response to Biotic and Abiotic Stresses. Front. Plant Sci. 2019, 10, 1349. [Google Scholar] [CrossRef] [Green Version]
  18. Sung, Y.C.; Lin, C.P.; Hsu, H.J.; Chen, Y.L.; Chen, J.C. Silencing of CrNPR1 and CrNPR3 a Alters plant susceptibility to periwinkle leaf yellowing phytoplasma. Front. Plant Sci. 2019, 10, 1183. [Google Scholar] [CrossRef]
  19. Patui, S.; Bertolini, A.; Clincon, L.; Ermacora, P.; Braidot, E.; Vianello, A.; Zancani, M. Involvement of plasma membrane peroxidases and oxylipin pathway in the recovery from phytoplasma disease in apple (Malus domestica). Physiol. Plant 2013, 148, 200–213. [Google Scholar] [CrossRef]
  20. Ahmad, J.N.; Eveillard, S. Study of the expression of defense related protein genes in stolbur C and stolbur PO phytoplasma-infected tomato. Bull. Insectol. 2011, 64, S159–S160. [Google Scholar]
  21. Punelli, F.; Al Hassan, M.; Fileccia, V.; Uva, P.; Pasquini, G.; Martinelli, F. A microarray analysis highlights the role of tetrapyrrole pathways in grapevine responses to “stolbur” phytoplasma, phloem virus infections and recovered status. Physiol. Mol. Plant Pathol. 2016, 93, 129–137. [Google Scholar] [CrossRef]
  22. Gondor, O.K.; Janda, T.; Soós, V.; Pál, M.; Majláth, I.; Adak, M.K.; Balázs, E.; Szalai, G. Salicylic Acid Induction of Flavonoid Biosynthesis Pathways in Wheat Varies by Treatment. Front. Plant Sci. 2016, 7, 1447. [Google Scholar] [CrossRef] [PubMed] [Green Version]
  23. Hren, M.; Nikolic, P.; Rotter, P.; Blejec, A.; Terrier, N.; Ravnikar, M.; Dermastia, M.; Gruden, K. ‘Bois noir’ phytoplasma induces significant reprogramming of the leaf transcriptome in the field grown grapevine. BMC Genom. 2009, 10, 460. [Google Scholar] [CrossRef] [PubMed] [Green Version]
  24. Albertazzi, G.; Milc, J.; Caffagni, A.; Francia, E.; Roncaglia, E.; Ferrari, F.; Tagliafico, E.; Stefani, E.; Pecchioni, N. Gene expression in grapevine cultivars in response to Bois Noir phytoplasma infection. Plant Sci. 2009, 176, 792–804. [Google Scholar] [CrossRef]
  25. Dermastia, M.; Nikolic, P.; Chersicola, M.; Gruden, K. Transcriptional profiling in infected and recovered grapevine plant response to “Candidatus phytoplasma solani”. Phytopath. Moll. 2015, 5, S123. [Google Scholar] [CrossRef]
  26. Paolacci, A.R.; Catarcione, G.; Ederli, L.; Zadra, C.; Pasqualini, S.; Badiani, M.; Musetti, R.; Santi, S.; Ciaffi, M. Jasmonate-mediated defence responses, unlike salicylate-mediated responses, are involved in the recovery of grapevine from Bois noir disease. BMC Plant Biol. 2017, 17, 118. [Google Scholar] [CrossRef] [Green Version]
  27. Frías, M.; Brito, N.; González, C. The Botrytis cinerea cerato-platanin BcSpl1 is a potent inducer of systemic acquired resistance (SAR) in tobacco and generates a wave of salicylic acid expanding from the site of application. Mol. Plant Pathol. 2013, 14, 191–196. [Google Scholar] [CrossRef]
  28. Fu, Z.Q.; Dong, X. Systemic acquired resistance turning local infection into global defense. Ann. Rev. Plant Biol. 2013, 64, 839–863. [Google Scholar] [CrossRef] [Green Version]
  29. Conrath, U. Systemic acquired resistance. Plant Sign. Behav. 2006, 1, 179–184. [Google Scholar] [CrossRef]
  30. Dean, J.V.; Delaney, S.P. Metabolism of salicylic acid in wild- type, ugt74f1 and ugt74f2 glucosyltransferase mutants of Arabidopsis thaliana. Physiol. Plant. 2008, 132, 417–425. [Google Scholar] [CrossRef]
  31. Bartsch, M.; Bednarek, P.; Vivancos, P.D.; Schneider, B.; von Roepenack-Lahaye Foyer, C.H.; Kombrink, E.; Scheel, D.; Parker, J.E. Accumulation of isochorismate-derived 2,3-dihydroxybenzoic 3-O-beta-D-xyloside in Arabidopsis resistance to pathogens and ageing of leaves. J. Biol. Chem. 2010, 285, 25654–25665. [Google Scholar] [CrossRef] [PubMed] [Green Version]
  32. Dempsey, D.A.; Klessig, D.F. How does the multifaced plant hormone salicylic acid combat disease in plants and are similar mechanisms utilized in humans? BMC Biol. 2017, 15, 23. [Google Scholar] [CrossRef] [PubMed] [Green Version]
  33. Abedi, F.; Razavi, B.M.; Hosseinzadeh, H. A review on gentisic acid as a plant derived phenolic and metabolite of aspirin: Comprehensive pharmacology, toxicology, and some pharmaceutical aspects. Phytother. Res. 2019, 34, 729–741. [Google Scholar] [CrossRef] [PubMed]
  34. Prezelj, N.; Fragner, L.; Weckwerth, W.; Dermastia, M. Metabolic consequencea of infection of graopevine (Vitis vinifera L.) cv. “Modra frankinja” with Flavescence Dorée phytoplasma. Front. Plant Sci. 2016, 7, 711. [Google Scholar] [CrossRef] [PubMed] [Green Version]
  35. Rotter, A.; Nikolić, P.; Turnšec, N.; Kogovšek, P.; Blejec, A.; Gruden, K.; Dermastia, M. Statistical modeling of long-term grapevine response to ‘Candidatus Phytoplasma solani’ infection in the field. Eur. J. Plant Physiol. 2018, 150, 653–668. [Google Scholar] [CrossRef] [Green Version]
  36. Dermastia, M. Plant hormones in Phytoplasma Infected Plants. Front. Plant Sci. 2019, 10, 477. [Google Scholar] [CrossRef] [Green Version]
  37. Zhang, K.; Halitschke, R.; Yin, C.; Liu, C.; Gan, S. Salicylic acid 3-hydroxylase regulates Arabidopsis leaf longevity by mediating salicylic acid catabolism. Proc. Natl. Acad. Sci. USA 2013, 110, 14807–14812. [Google Scholar] [CrossRef]
  38. Negro, C.; Sabella, E.; Nicolì, F.; Pierro, R.; Materazzi, A.; Panattoni, A.; Aprile, A.; Nutricati, E.; Vergine, M.; Miceli, A. Biochemical changes in leaves of Vitis vinifera cv. Sangiovese infected by Bois noir phytoplasma. Pathogens 2020, 9, 269. [Google Scholar] [CrossRef] [Green Version]
  39. Pierro, R.; Passera, A.; Panattoni, A.; Casati, P.; Luvisi, A.; Rizzo, D.; Bianco, P.A.; Quaglino, F.; Materazzi, A. Molecular typing of ‘Bois noir’ phytoplasma strains in the Chianti Classico area (Tuscany, Central Italy) and their association with symptom severity in Vitis vinifera L. cv. Sangiovese. Phytopathology 2018, 108, 362–373. [Google Scholar] [CrossRef] [Green Version]
  40. Zhang, Y.; Zhao, L.; Zhao, J.; Li, Y.; Wang, J.; Guo, R.; Gan, S.S.; Liu, C.J.; Zhang, K. S5/DMR6 encodes a salicylic acid 5-hydroxylase that fine-tunes salicylic acid homeostasis. Plant Physiol. 2017, 175, 1082–1093. [Google Scholar] [CrossRef] [Green Version]
  41. Huang, X.; Zhu, G.; Liu, Q.; Chen, L.; Li, Y.; Hou, B. Modulation of plant salicylic acid-associated immune responses via glycosylation of Dihydroxybenzoic acids. Plant Physiol. 2018, 176, 3103–3119. [Google Scholar] [CrossRef] [PubMed]
  42. Ding, P.; Ding, Y. Stories of Salicylic Acid: A Plant Defence Hormone. Trends Plant Sci. 2020, 25, 549–565. [Google Scholar] [CrossRef] [PubMed]
  43. Perestrelo, R.; Lu, Y.; Santos, S.A.O.; Silvestre, A.J.D.; Neto, C.P.; Camara, J.S.; Rocha, S.M. Phenolic profile of Sercial and Tinta Negra Vitis vinifera L. grape skins by HPLC–DAD–ESI-MS novel phenolic compounds in Vitis vinifera L. grape. Food Chem. 2012, 135, 94–104. [Google Scholar] [CrossRef] [Green Version]
  44. Fang, N.; Yu, S.; Prior, R.L. LC/MS/MS characterization of phenolic constituents in dried plums. J. Agric. Food Chem. 2002, 50, 3579–3585. [Google Scholar] [CrossRef]
  45. Sun, J.; Liang, F.; Bin, Y.; Li, P.; Duan, C. Screening non-colored phenolics in red wines using liquid chromatography/ultraviolet and mass spectrometry/mass spectrometry libraries. Molecules 2007, 12, 679–693. [Google Scholar] [CrossRef] [Green Version]
  46. Goufo, P.; Kumar Singh, R.; Cortez, I. A reference list of phenolic compounds (including stilbenes) in grapevine (Vitis vinifera L.) roots, woods, canes, stems, and leaves. Antioxidants 2020, 9, 398. [Google Scholar] [CrossRef]
  47. Sandhu, A.K.; Gu, L. Antioxidant capacity, phenolic content, and profiling of phenolic compounds in the seeds, skin, and pulp of Vitis rotundifolia (Muscadine Grapes) as determined by HPLC-DAD-ESI-MS. J. Agric. Food Chem. 2010, 58, 4681–4692. [Google Scholar] [CrossRef]
  48. Tang, J.; Dunshea, F.R.; Suleria, H.A.R. LC_ESI_QTOF/MS characterization of phenolic compounds from medicinal plants (Hops and Juniper Berries) and their antioxidant activity. Foods 2019, 9, 7. [Google Scholar] [CrossRef] [Green Version]
  49. Lopes-Lutz, D.; Dettmann, J.; Nimalaratne, C.; Schieber, A. Characterization and quantification of polyfenols in Amazon grape (Pourouma cecropiifolia Martius). Molecules 2010, 15, 8543–8552. [Google Scholar] [CrossRef]
  50. Belles, J.M.; Garro, R.; Fayos, J.; Navarro, P.; Primo, J.; Conejero, V. Gentisic acid as pathogen-inducible signal, additional to salicylic acid for activation of plant defenses in tomato. MPMI 1999, 12, 227–235. [Google Scholar] [CrossRef] [Green Version]
  51. Dempsey, D.A.; Vlot, A.C.; Wildrmuth, M.C.; Klessig, D.F. Salicylic acid biosynthesis and metabolism. Arab. Book 2011, 9, e0156. [Google Scholar] [CrossRef] [PubMed] [Green Version]
  52. Margaria, P.; Palmano, S. Response of Vitis vinifera L. cv. ’Nebbiolo’ proteome to Flavescence dorée phytoplasma infection. Proteomics 2011, 11, 212–224. [Google Scholar] [CrossRef] [PubMed]
  53. Margaria, P.; Abbà, S.; Palmano, S. Novel aspects of grapevine response to phytoplasma infection investigated by a proteomic and phosphor-proteomic approach with data integration into functional network. BMC Genom. 2013, 14, 38. [Google Scholar] [CrossRef] [Green Version]
  54. López-Gresa, M.P.; Lisón, P.; Yenush, L.; Conejero, V.; Rodrigo, I.; Bellés, J.M. Salicylic acid is involved in the basal resistance of Tomato plants to Citrus Exocortis virois and Tomato Spotted Wilt virus. PLoS ONE 2016, 11, e0166938. [Google Scholar] [CrossRef] [PubMed] [Green Version]
  55. Fayos, J.; Belles, J.M.; López-Gresa, M.P.; Jaime Primo, J.; Vicente Conejero, V. Induction of gentisic acid 5-O-B-xylopyranoside in tomato and cucumber plant infected by different pathogens. Phytochemistry 2006, 67, 142–148. [Google Scholar] [CrossRef]
  56. Liu, T.; Song, T.; Zhang, X.; Yuan, H.; Su, L.; Li, W. Unconventionally secreted effectors of two filamentous pathogens target plant salicylate biosynthesis. Nat. Commun. 2014, 5, 4686. [Google Scholar] [CrossRef] [Green Version]
  57. Jones, P.; Vogt, T. Glycosyltransferases in secondary plant metabolism: Tranquilizers and stimulant controllers. Planta 2001, 213, 164–174. [Google Scholar] [CrossRef]
  58. Bellés, J.M.; Garro, R.; Pallaás, V.; Fayos, J.; Rodrigo, I.; Conejero, V. Accumulation of gentisic acid as associated with systemic infections but not with the hypersensitive response in plant-pathogen interactions. Planta 2006, 223, 500–511. [Google Scholar] [CrossRef]
  59. Campos, L.; Lisón, P.; López-Gresa, M.P.; Rodrigo, I.; Zacarés, L.; Conejero, V. Transgenic tomato plants overexpressing tyramine N-hydroxycinnamoyl transferase exhibit elevated hydroxycinnamic acid amide levels and enhanced resistance to Pseudomonas syringae. MPMI 2014, 27, 1159–1169. [Google Scholar] [CrossRef] [Green Version]
  60. Chen, H.Y.; Li, X. Identification of a residue responsible for UDP-sugar donor selectivity of a dihydroxybenzoic acid glycosyltransferase from Arabidopsis natural accessions. Plant J. 2017, 89, 195–203. [Google Scholar] [CrossRef]
  61. Lefevere, H.; Bauters, L.; Gheysen, G. Salicylic acid biosynthesis in plants. Front. Plant Sci. 2020, 11, 338. [Google Scholar] [CrossRef] [PubMed]
  62. de Toledo Thomazella, D.P.; Brail, Q.; Douglas, D.; Staskawicz, B. CRISPR-Cas9 mediated mutagenesis of a DMR6 ortholog in tomato confers broad-spectrum disease resistance. bioRxiv 2016, 064824. [Google Scholar] [CrossRef] [Green Version]
  63. Shigenaga, A.M.; Argueso, C.T. No hormone to rule them all: Interactions of plant hormones during the responses of plant to pathogens. J. Semin. Cell Dev. Biol. 2016, 56, 174–189. [Google Scholar] [CrossRef] [PubMed]
  64. Tan, Y.; Li, Q.; Zhao, Y.; Wie, H.; Wang, J.; Baker, C.J. Integration of metabolomics and existing omics data reveals new insights into phytoplasma-induced metabolic reprogramming in host plants. PLoS ONE 2021, 16, e0246203. [Google Scholar] [CrossRef]
  65. Rusjan, D.; Veberic, R.; Mikukic-Petkovsek, M.M. The response of phenolic compounds in grapes of the variety ‘Chardonnay’ (Vitis vinifera L.) to the infection by phytoplasma Bois noir. Eur. J. Plant Pathol. 2012, 133, 965–974. [Google Scholar] [CrossRef]
  66. Slatnar, A.; Mikulic Petkovsek, M.; Halbwirth, H.; Stampar, F.; Stich, K.; Veberic, R. Response of the phenylpropanoid pathway to Venturia inaequalis infection in maturing fruit of ‘Braeburn’ apple. J. Hortic. Sci. Biotechnol. 2010, 85, 465–472. [Google Scholar] [CrossRef] [Green Version]
  67. Geny, L.; Darrieumerlou, A.; Doneche, B. Conjugate polyamines and hydroxycinnamic acids in grape berries during Botrytis cinerea disease development: Differences between ‘noble rot’ and ‘grey mould’. Aust. J. Grape Wine Res. 2003, 9, 102–106. [Google Scholar] [CrossRef]
  68. Rusjan, D.; Petkovsek, M.M. Phenolic Responses in 1-Year-Old Canes of Vitis Vinifera cv. Chardonnay Induced by Grapevine Yellows (Bois noir); Australian Society of Viticulture and Oenology Inc.: Glen Osmond, Australia, 2014; pp. 123–134. [Google Scholar] [CrossRef]
  69. Dixon, R.A.; Xie, D.Y.; Sharma, S.B. Proanthocyanidins—A final frontier in flavonoid research? New Phytol. 2005, 165, 9–28. [Google Scholar] [CrossRef] [Green Version]
  70. Mellway, R.D.; Tran, L.T.; Prouse, M.B.; Campbell, M.M.; Constabel, C.P. The wound-, pathogen-, and ultraviolet B-responsive MYB134 gene encodes an R2R3 MYB transcription factor that regulates proanthocyanidin synthesis in poplar. Plant Physiol. 2009, 150, 924–941. [Google Scholar] [CrossRef]
  71. Ullah, C.; Unsicker, S.B.; Fellenberg, C.; Constabel, C.P.; Schmidt, A.; Gershenzon, J.; Hammerbacher, A. Flavan-3-ols are an effective chemical defense against rust infection. Plant Physiol. 2017, 175, 1560–1578. [Google Scholar] [CrossRef] [Green Version]
  72. Ullah, C.; Unsicker, S.B.; Reichet, M.; Gershenzon, J.; Hammerbacher, A. Accumulation of Catechin and Proanthocyanidins in Black Poplar Stems After Infection by Plectosphaerella populi: Hormonal Regulation, Biosynthesis and Antifungal Activity. Front. Plant Sci. 2019, 10, 1441. [Google Scholar] [CrossRef] [PubMed]
  73. Junqueira, A.; Bedendo, I.; Pascholati, S. Biochemical changes in corn plants infected by the maize bushy stunt phytoplasma. Physiol. Mol. Plant Pathol. 2004, 65, 181–185. [Google Scholar] [CrossRef]
  74. Gutha, L.R.; Casassa, L.F.; Harbertson, F.; Naidu, R.A. Modulation of flavonoid biosynthetic pathway genes and anthocyanins due to virus infection in grapevine (Vitis vinifera L.) leaves. BMC Plant Biol. 2010, 10, 187. [Google Scholar] [CrossRef] [PubMed] [Green Version]
  75. Nicoliì, F.; Negro, C.; Nutricati, E.; Vergine, M.; Aprile, A.; Sabella, E.; Damiano, G.; De Bellis, L.; Luvisi, A. Accumulation of azelaic acid in Xylella fastidiosa-infected olive trees: A mobile metabolite for health screening. Phytopathology 2019, 109, 318–325. [Google Scholar] [CrossRef] [PubMed] [Green Version]
  76. Angelini, E.; Bianchi, G.I.; Filippini, L.; Morassutti, C.; Borgo, M. A new TaqMan method the identification of phytoplasma associated with grapevine yellows by real time PCR assay. J. Microbiol. Methods 2007, 68, 613–622. [Google Scholar] [CrossRef]
  77. Osman, F.; Leutenegger, C.; Golino, D.; Rowhani, A. Realtime RT-PCR (TaqMan®) assays for the detection of Grapevine leafroll associated viruses 1–5 and 9. J. Virol. Methods 2007, 141, 22–29. [Google Scholar] [CrossRef]
  78. Osman, F.; Leutenegger, C.; Golino, D.; Rowhani, A. Comparison of low-density arrays, RT-PCR and real-time TaqMan RT-PCR in detection of grapevine viruses. J. Virol. Methods 2008, 149, 292–299. [Google Scholar] [CrossRef]
  79. Wei, T.; Lebas, B.S.M.; Shiller, J.B.; Quinn, B.D.; Clover, G.R.G. Detection of five viruses infecting dormant bulbs by TaqMan-based real-time RT-PCR. Australas. Plant Path. 2012, 41, 93–98. [Google Scholar] [CrossRef]
  80. Vergine, M.; Nicolì, F.; Negro, C.; Luvisi, A.; Nutricati, E.; Accogli, R.A.; Sabella, E.; Miceli, A. Phytochemical profiles and antioxidant activity of Salvia species from Southern Italy. Rec. Nat. Prod. 2019, 13, 205–215. [Google Scholar] [CrossRef]
  81. Aprile, A.; Negro, C.; Sabella, E.; Luvisi, A.; Nicolì, F.; Nutricati, E.; Vergine, M.; Blando, F.; De Bellis, L. Antioxidant activity and anthocyanin contents in olives (cv Cellina di Nardò) during ripening and after fermentation. Antioxidants 2019, 8, 138. [Google Scholar] [CrossRef] [Green Version]
  82. Bertazzon, N.; Bagnaresi, P.; Forte, V.; Mazzucotelli, E.; Filippin, L.; Guerra, D.; Zechini, A.; Cattivelli, L.; Angelini, E. Grapevine comparative early transcriptomic profiling suggests that Flavescence dorée phytoplasma represses plant responses induced by vector feeding in susceptible varieties. BMC Genom. 2019, 20, 526. [Google Scholar] [CrossRef] [PubMed] [Green Version]
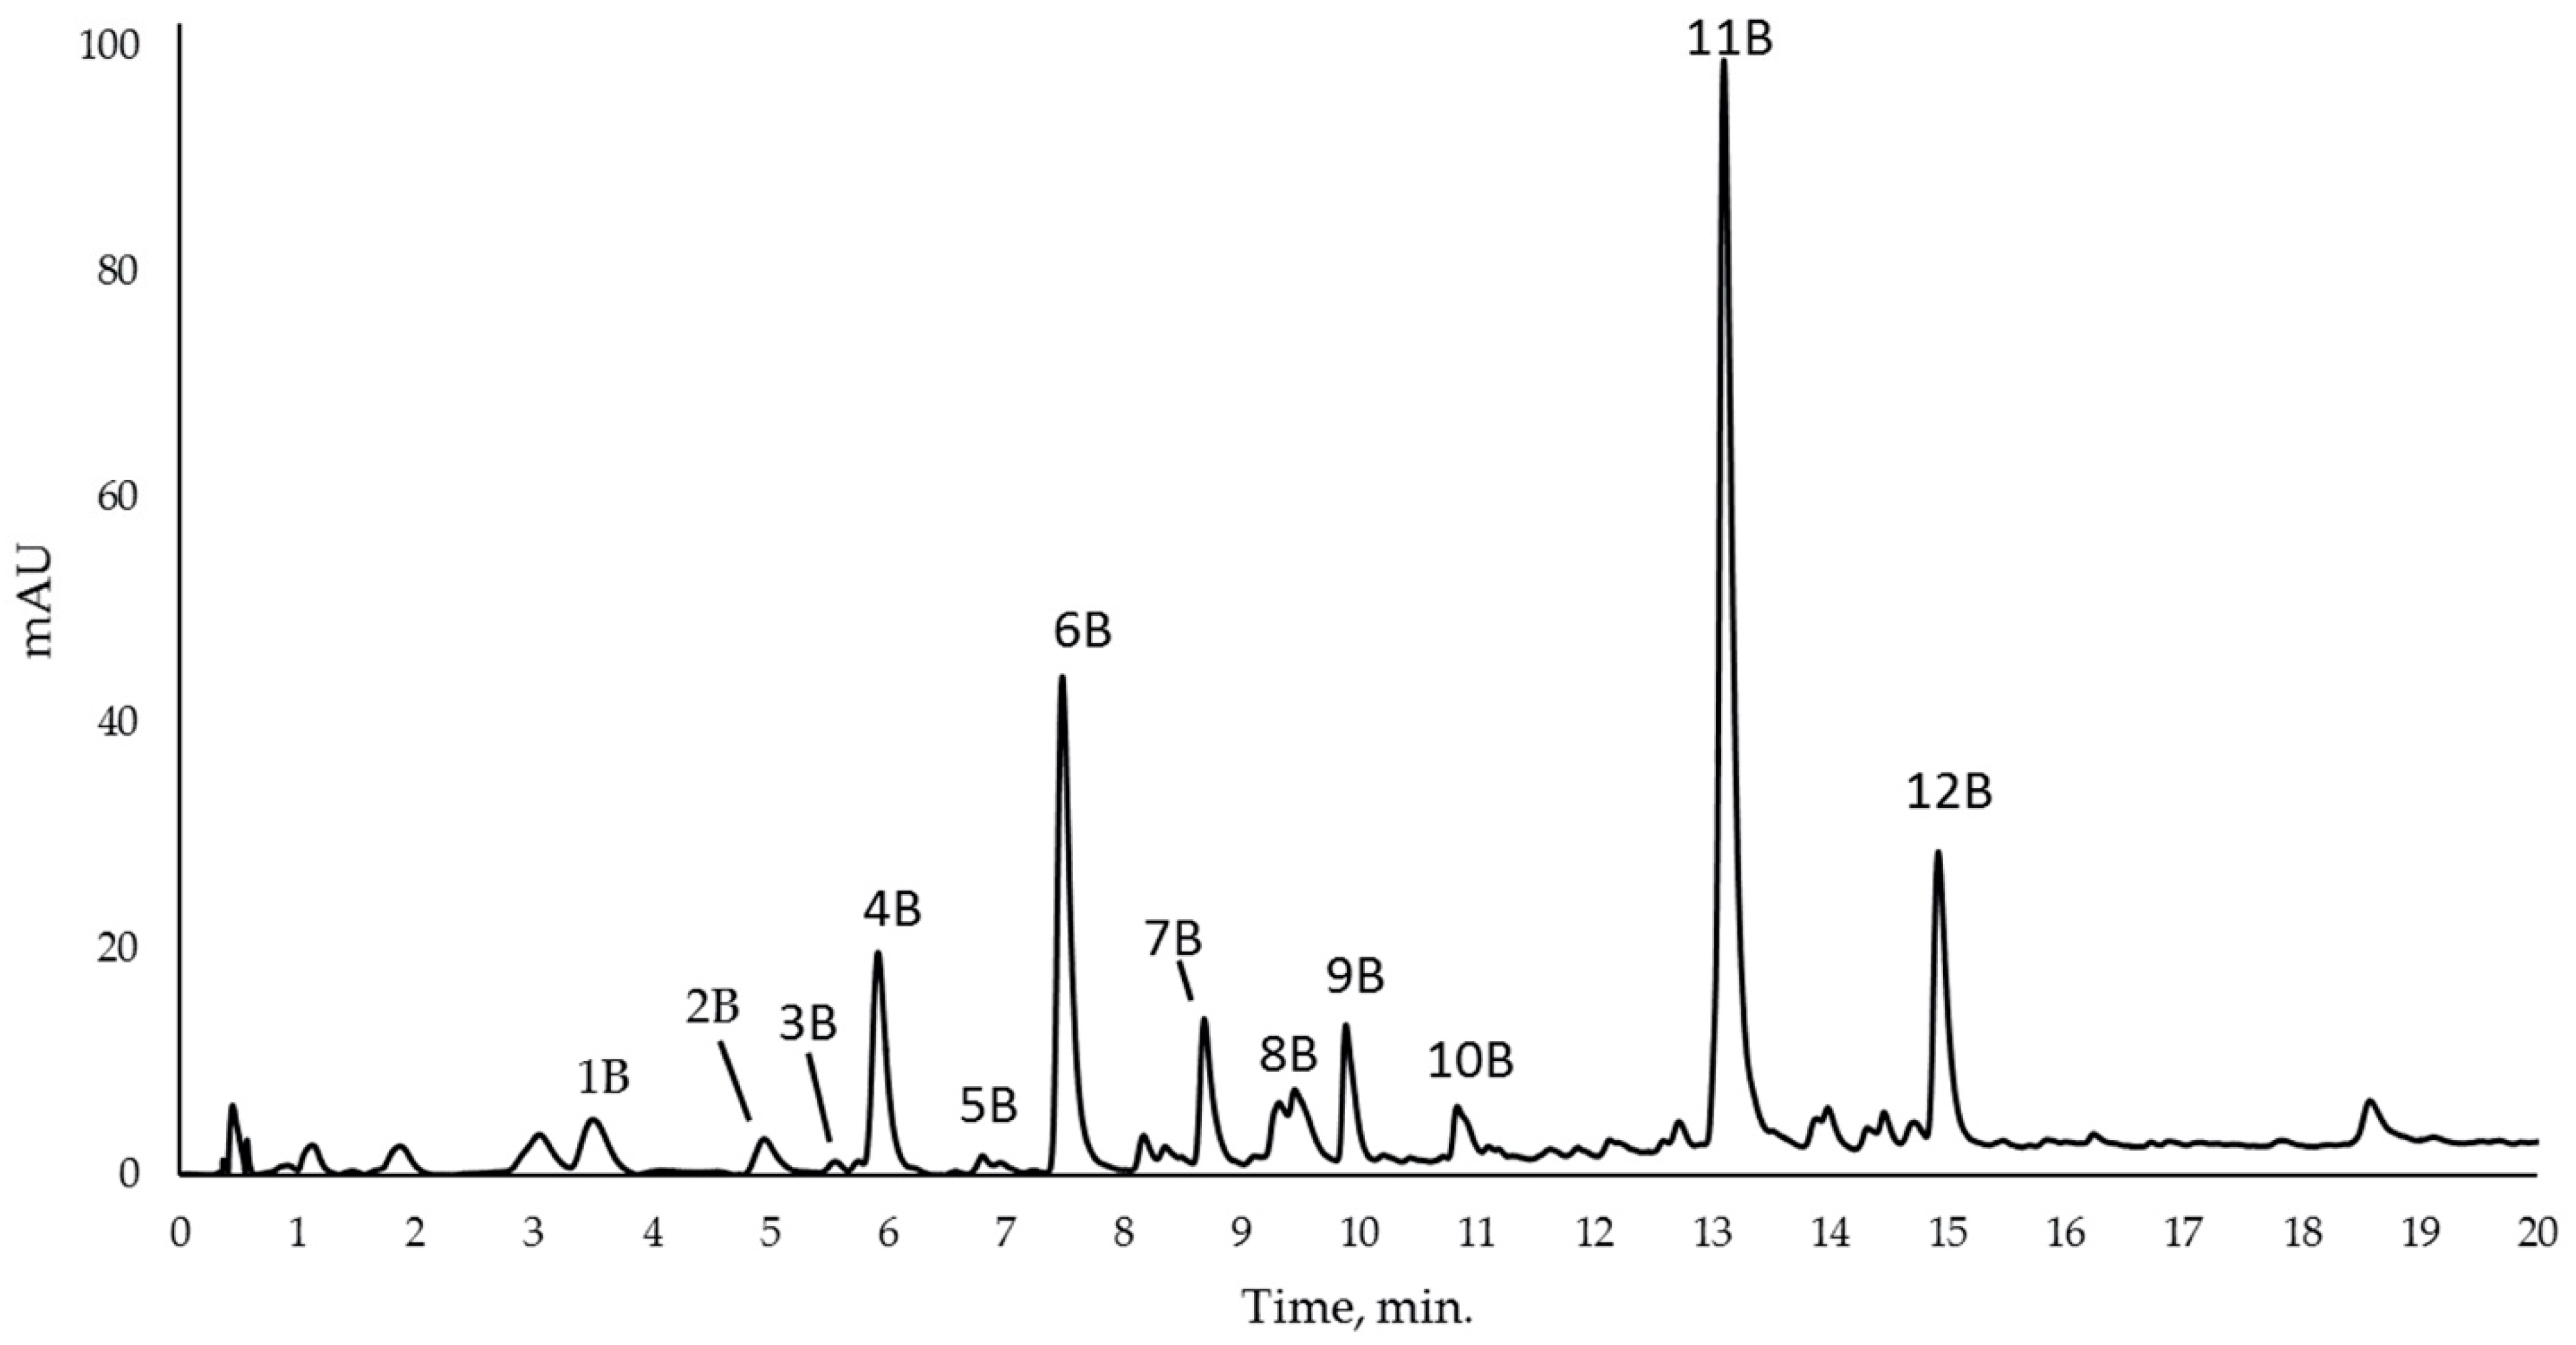
Figure 1. Typical chromatogram recorded at 280 nm of Vitis vinifera leaf sample extract after digestion with β-glucosidase for the identification of phenylpropanoid compounds. The identification of single peak is reported in Table 2.
Plants 12 02695 g001
Figure 2. Mass spectra of 2,5 dihydroxybenzoic acid (gentisic acid, GA) found in the sample (A) and of the chemical standard (B) and their UV/Vis absorption spectrum of the peak 1B shown in Figure 1 after sample digestion with β-glucosidase (C).
Plants 12 02695 g002
Figure 3. Mass spectra of the salicylic acid found in the sample (A) and of the chemical standard (B) and their UV/Vis absorption spectrum of the peak 8B shown in Figure 1 after sample digestion with β-glucosidase (C).
Plants 12 02695 g003
Figure 4. Quantification of gentisic acid (GA) and salicylic acid (SA) obtained from grapevine leaves collected from ‘Ca. P. solani’-negative or -positive plants at different growth stages: (A) free GA, (C) conjugated gentisic acid, (B) free SA, (D) conjugated salicylic acid. The statistical analysis between Ca. P. solani-negative and Ca. P. solani-positive leaves was carried out using a multiple t-test (FDR = 5%) and significant differences are marked by asterisks: * p < 0.05, ** p < 0.01, *** p < 0.001, **** p < 0.0001. Values are reported as means and standard deviation of five harvested samples (n = 5 ‘Ca. P. solani’-negative and ‘Ca. P. solani’-positive plants, respectively), each measured in three technical replicates.
Plants 12 02695 g004
Figure 5. Accumulation of phenolic compounds (A) 2,3 dihydroxybenzoic acid; (B) p-coumaric acid; (C) ferulic acid after digestion with β-glycosidase of samples obtained from grapevine leaves collected from ‘Ca. P. solani’-negative or -positive plants at different growth stages. The statistical analysis between leaves collected from ‘Ca. P. solani’-positive and -negative plants carried out using a multiple t-test (FDR = 5%) and significant differences are marked by asterisks: * p < 0.05, **** p < 0.0001. Values are reported as means and standard deviation of five harvested samples (n = 5 ‘Ca. P. solani’-negative and ‘Ca. P. solani’-positive plants, respectively), each measured in three technical replicates.
Plants 12 02695 g005
Figure 6. Quantitative determination of flavonoid compounds (A) catechin 3-O-glucoside; (B) epicatechin 3-O-glucoside; (C) quercetin 3-O-glucoronide; (D) quercetin 3-O-glucoside; (E) quercetin 3-O-rhamnoside; (F) kaempferol 3-O-glucoside; (G) kaempferol 3-O-glucuronide; and (H) cyanidin 3-O-glucoside in leaves collected from ‘Ca. P. solani’-positive and -negative plants at different growth stages. The statistical analysis between Ca. P. solani-negative and Ca. P. solani-positive leaves was carried out using a multiple t-test (FDR = 5%) and significant differences are marked by asterisks: * p < 0.05, ** p < 0.01, *** p < 0.001, **** p < 0.0001. Values are reported as means and standard deviation of five harvested samples (n = 5 ‘Ca. P. solani’-negative and ‘Ca. P. solani’-positive plants, respectively), each measured in three technical replicates.
Plants 12 02695 g006
Figure 7. General phenylpropanoid biosynthetic pathway and expression analysis by qRT-PCR of biosynthetic genes in leaves collected from ‘Ca. P. solani’-positive plants, expressed as fold change (FC) relative to ‘Ca. P. solani’-negative plants. Samples were collected in May, July, August, and September. The reported compounds detected by HPLC ESI/MS-TOF and key biosynthetic genes and relative enzymes are in red. PAL, phenylalanine ammonia-lyase; C4H cinnamate 4-hydroxylase; CHS, chalcone synthase; F3H, flavanone-3-hydroxylase; F3′H, flavonoid-3′-hydroxylase; FLS, flavonol synthase; DFR, dihydroflavonol reductase. Red lines highlight the 2-fold change to graphically identify genes upregulated in positive plants compared to negative ones. ANOVA results were reported based on their statistical significance. * p < 0.05, ** p < 0.01, *** p < 0.001.
Plants 12 02695 g007
Figure 8. Key steps of anthocyanin and proanthocyanidin biosynthetic pathways and expression analysis by qRT-PCR of genes involved in their biosynthesis in leaves collected from ‘Ca. P. solani’-positive plants, expressed as fold change (FC) relative to ‘Ca. P. solani’-negative plants. Samples were collected in May, July, August, and September. The reported compounds detected by HPLC ESI/MS-TOF and the key biosynthetic genes and relative enzymes are in red. LDOX, leucoanthocyanidin dioxygenase; UF3GT, UDP-glucose flavonoid 3-O-glucosyltransferase; LAR, leucoanthocyanidin reductase. Red lines highlight the 2-fold change to graphically identify genes upregulated in positive plants compared to negative ones. ANOVA results were reported based on their statistical significance. * p < 0.05, ** p < 0.01, *** p < 0.001.
Plants 12 02695 g008
Figure 9. Key steps of hydroxybenzoic acid biosynthetic pathway and expression analysis by qRT-PCR of genes involved in their biosynthesis in leaves collected from ‘Ca. P. solani’-positive plants, expressed as fold change (FC) relative to ‘Ca. P. solani’-negative plants. Samples were collected in May, July, August, and September. The reported compounds detected by HPLC ESI/MS-TOF and the key genes and relative biosynthetic enzymes are in red. ICS, isochorismate synthase; DMR6, downy mildew-resistant 6. Red lines highlight the 2-fold change to graphically identify genes upregulated in positive plants compared to negative ones. ANOVA results were reported based on their statistical significance. * p < 0.05, ** p < 0.01, *** p < 0.001.
Plants 12 02695 g009
Figure 10. Expression analysis by qRT-PCR of genes coding NPR1 (non-expressor of pathogenesis-related genes 1) and pathogen-related proteins (PRs) in leaves collected from ‘Ca. P. solani’-positive plants, expressed as fold change (FC) relative to ‘Ca. P. solani’-negative grapevine leaves sampled, respectively, in May, July, August, and September during a growth season. NPR1: Non-expressor of pathogenesis-related protein1, PR1, PR2, PR3: pathogenesis-related protein 1,2,5. Red lines highlight the 2-fold change to graphically identify genes upregulated in positive plants compared to negative. ANOVA results were reported based on their statistical significance. * p < 0.05, ** p < 0.01, *** p < 0.001.
Plants 12 02695 g010
Figure 11. Proposed scheme for the activation of SA signaling pathways and the regulation of SA accumulation during the infection of Sangiovese grapevine by ‘Ca. P. solani’. SA, free salicylic acid; GA, free gentisic acid; 2,3-DHBA, free 2,3 dihydroxybenzoic acid; S3H, salicylic acid 3- hydroxylase; DMR6, downy mildew resistant 6 gene; ICS, isochorismate synthase gene; NPR1, non-expressor of pathogenesis-related protein1, PR1, PR2, PR5, pathogenesis-related (1, 2, 5) genes. Sugar molecule is represented in blue.
Plants 12 02695 g011
Table 2. List of compounds identified from leaves collected from Vitis vinifera cv. Sangiovese ‘Ca. P. solani’-positive and -negative plants after digestion with β-glucosidase. All compounds were verified by a comparison with an authentic chemical standard.
No.CompoundRT a (min)m/z exp. bm/z calc. c(M-H)Error (ppm)
1B2,5 Dihydroxybenzoic acid
(Gentisic acid)
3.711153.0194153.0193C7H5O4−0.65
2B2,3 Dihydroxybenzoic acid5.102153.0196153.0193C7H5O4−1.55
3BCatechin5.881289.0728289.0718C15H13O6−3.45
4BMethyl benzoate5.997135.0468135.0452C8H7O2−11.84
5BEpicatechin6.874289.0723289.0718C15H13O6−1.72
6Bp-Coumaric acid7.785163.0410163.0401C9H7O3−5.52
7BFerulic acid8.845193.0514193.0506C10H9O4−4.14
8Bo-hydroxybenzoic acid (Salicylic acid)9.756137.0259137.0255C7H5O3−2.91
9BQuercetin 3-O-glucuronide9.952477.0653477.0675C21H17O134.61
10BMyricetin10.869317.0316317.0303C15H9O8−4.10
11BQuercetin13.231301.0355301.0354C15H9O7−0.33
12BKaempferol15.023285.0395285.0404C15H9O63.15
a Retention time (min), b m/z experimental, c m/z calculated from software Agilent Mass Hunter 7.0.
Disclaimer/Publisher’s Note: The statements, opinions and data contained in all publications are solely those of the individual author(s) and contributor(s) and not of MDPI and/or the editor(s). MDPI and/or the editor(s) disclaim responsibility for any injury to people or property resulting from any ideas, methods, instructions or products referred to in the content.