


An Integrated Analysis of Metabolome, Transcriptome, and Physiology Revealed the Molecular and Physiological Response of Citrus sinensis Roots to Prolonged Nitrogen Deficiency

 and
and
Abstract
1. Introduction
2. Results
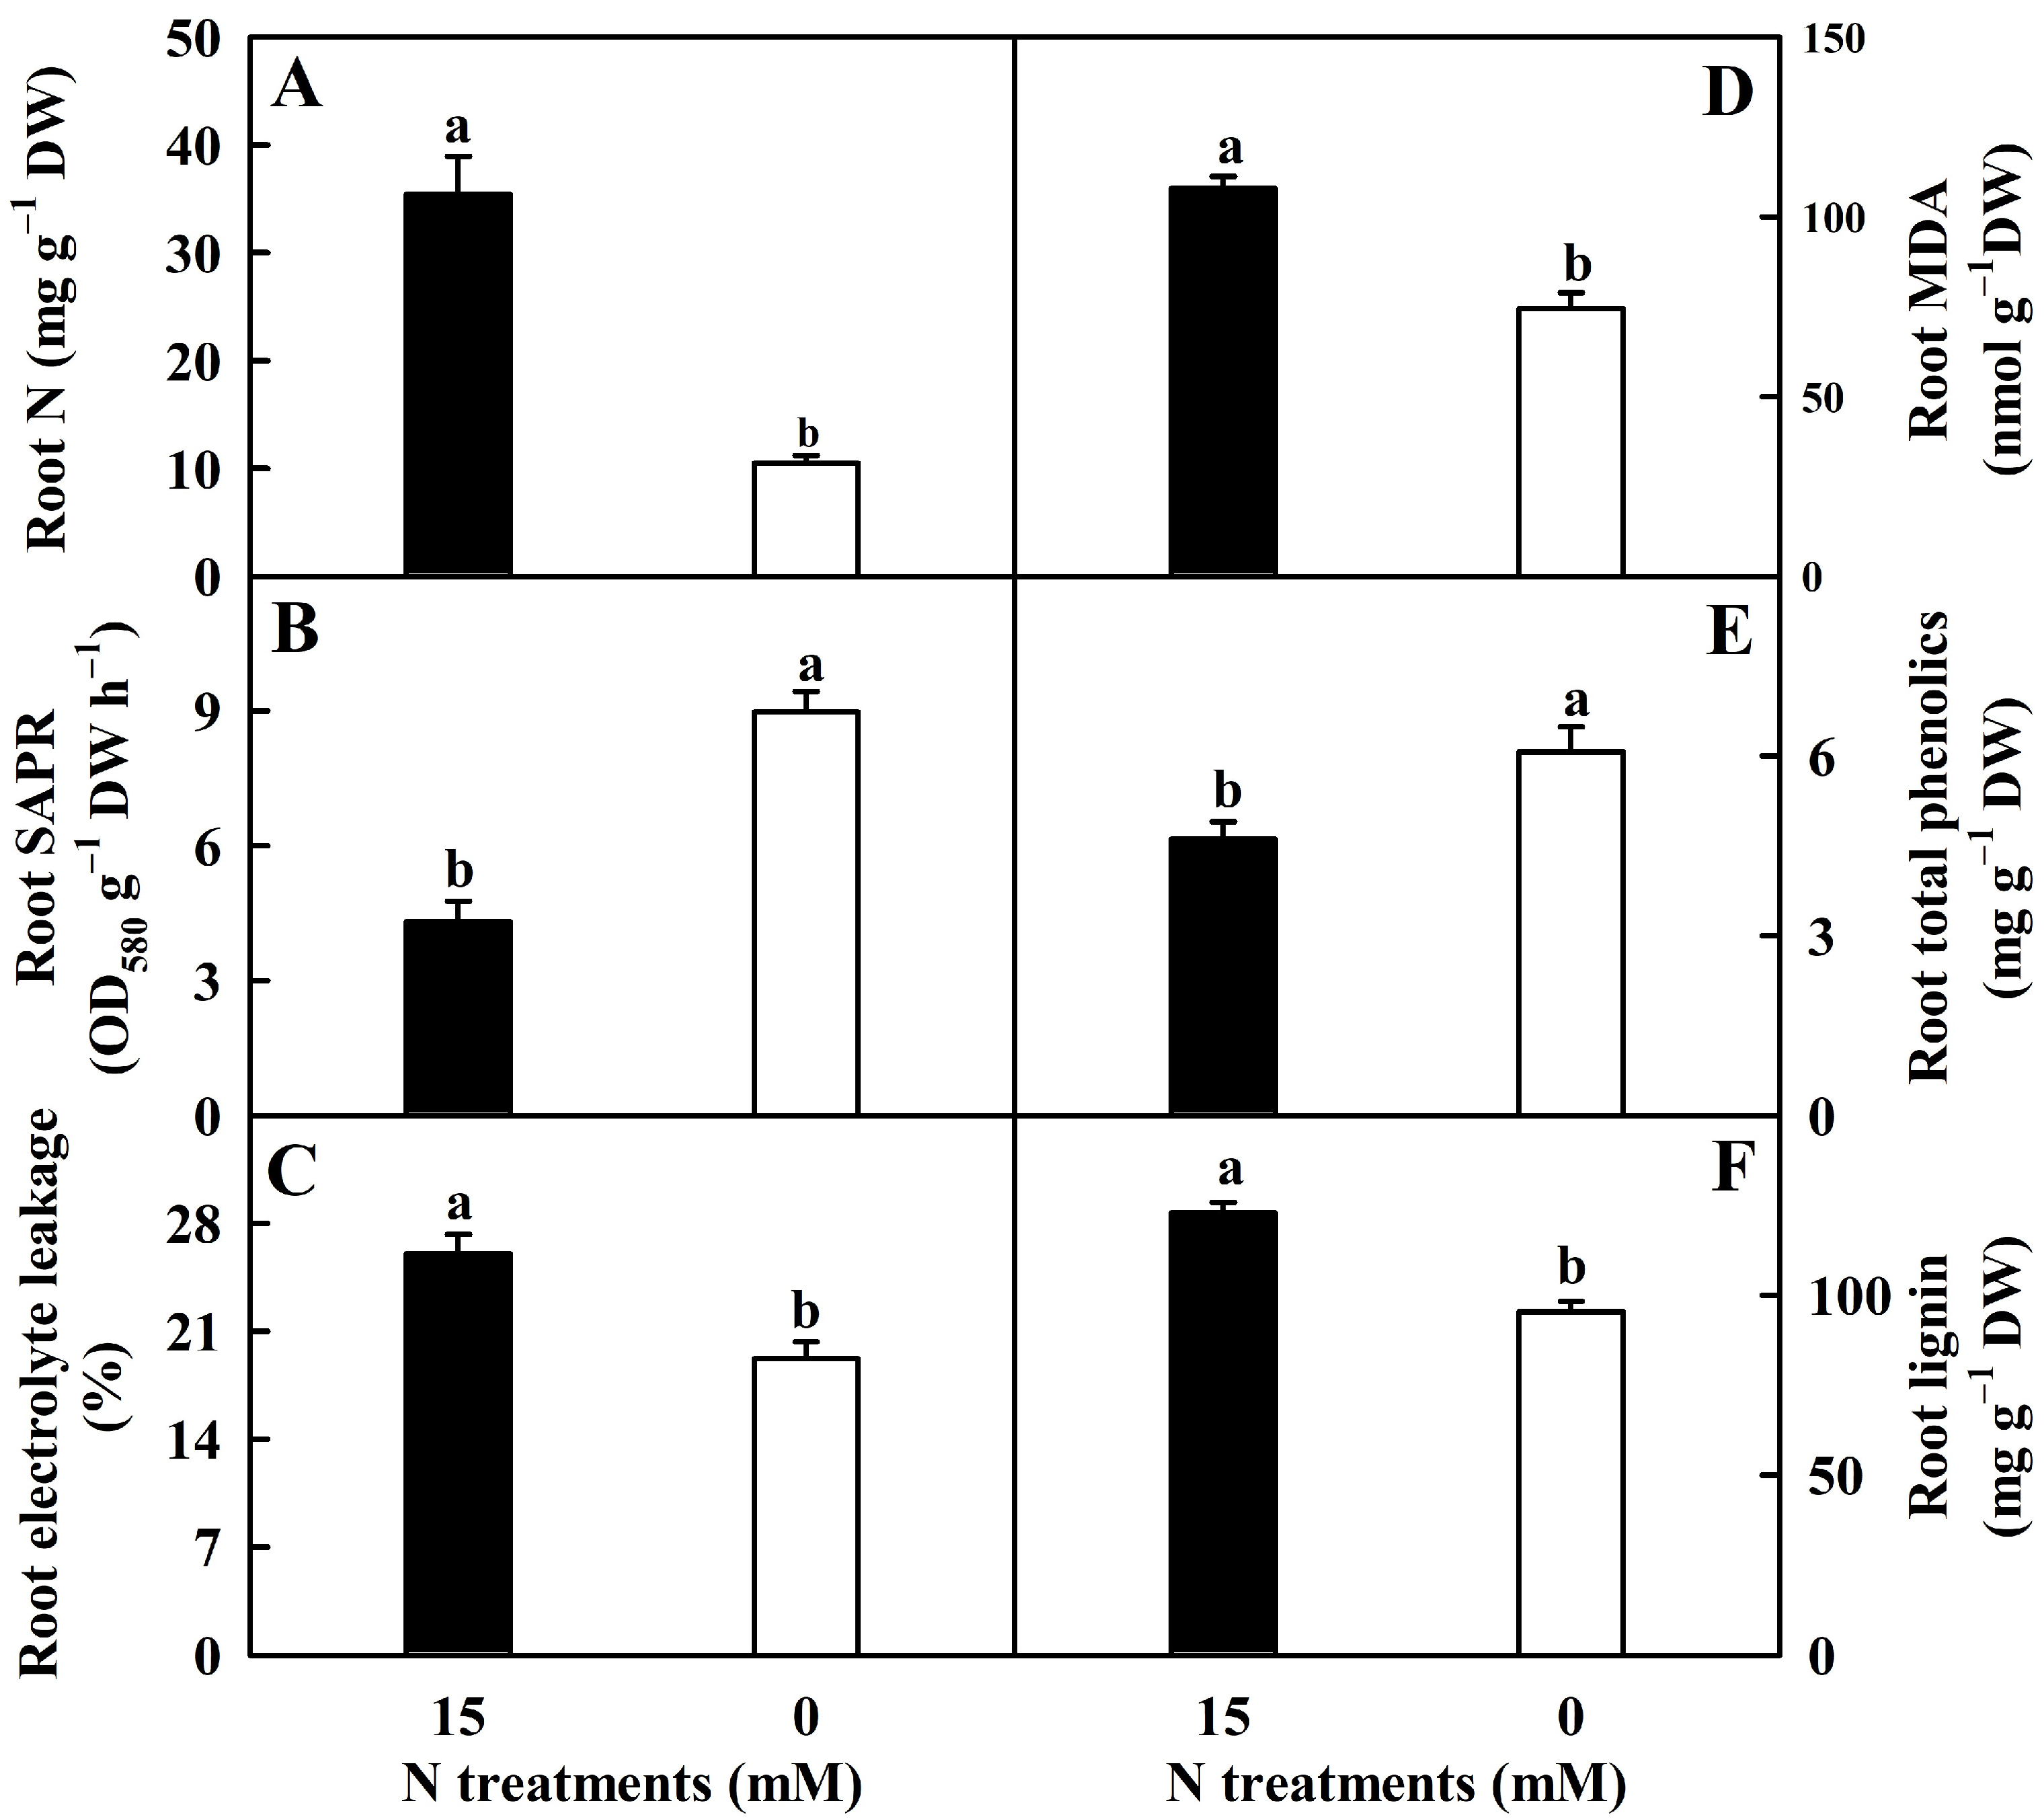
2.1. N-Deficient Impacts on Root N, SAPR, EL, MDA, Total Phenolics, and Lignin
2.2. Differentially Abundant Metabolites (DAMs) in Roots
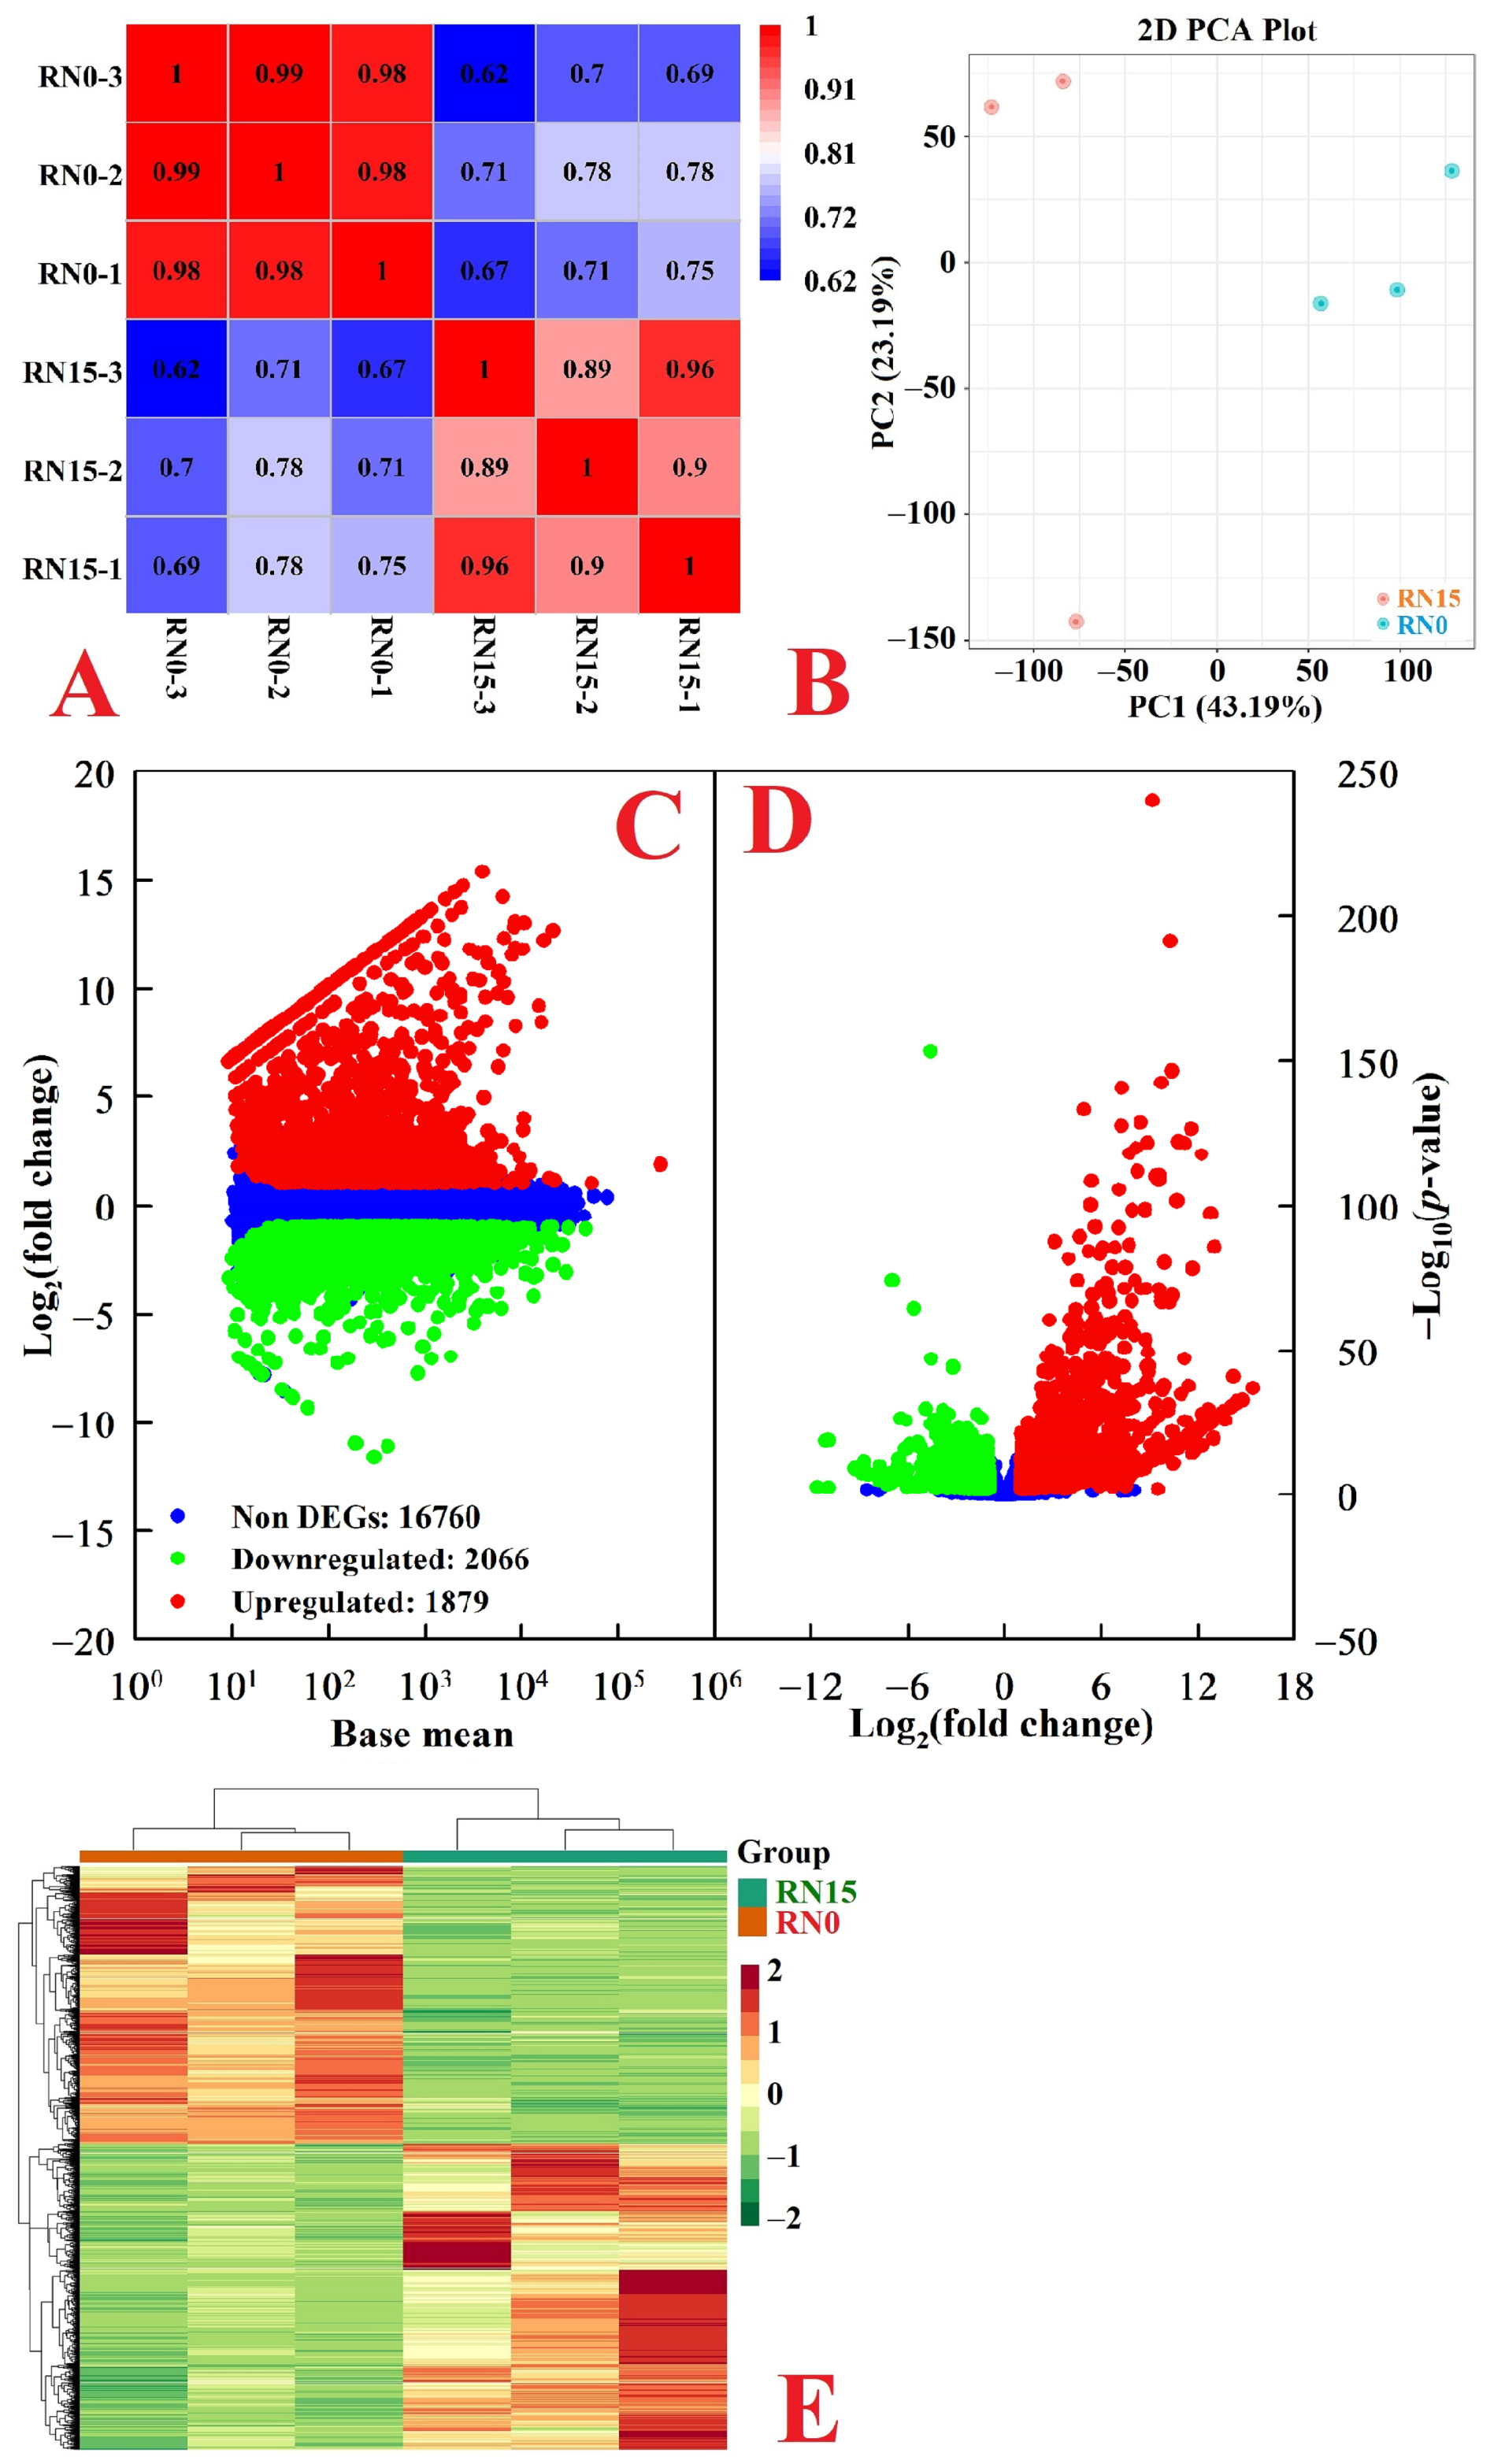
2.3. RNA-Seq, Mapping, and Assembly
2.4. Functional Annotation and DEGs in Roots
2.5. Validation of qRT-PCR
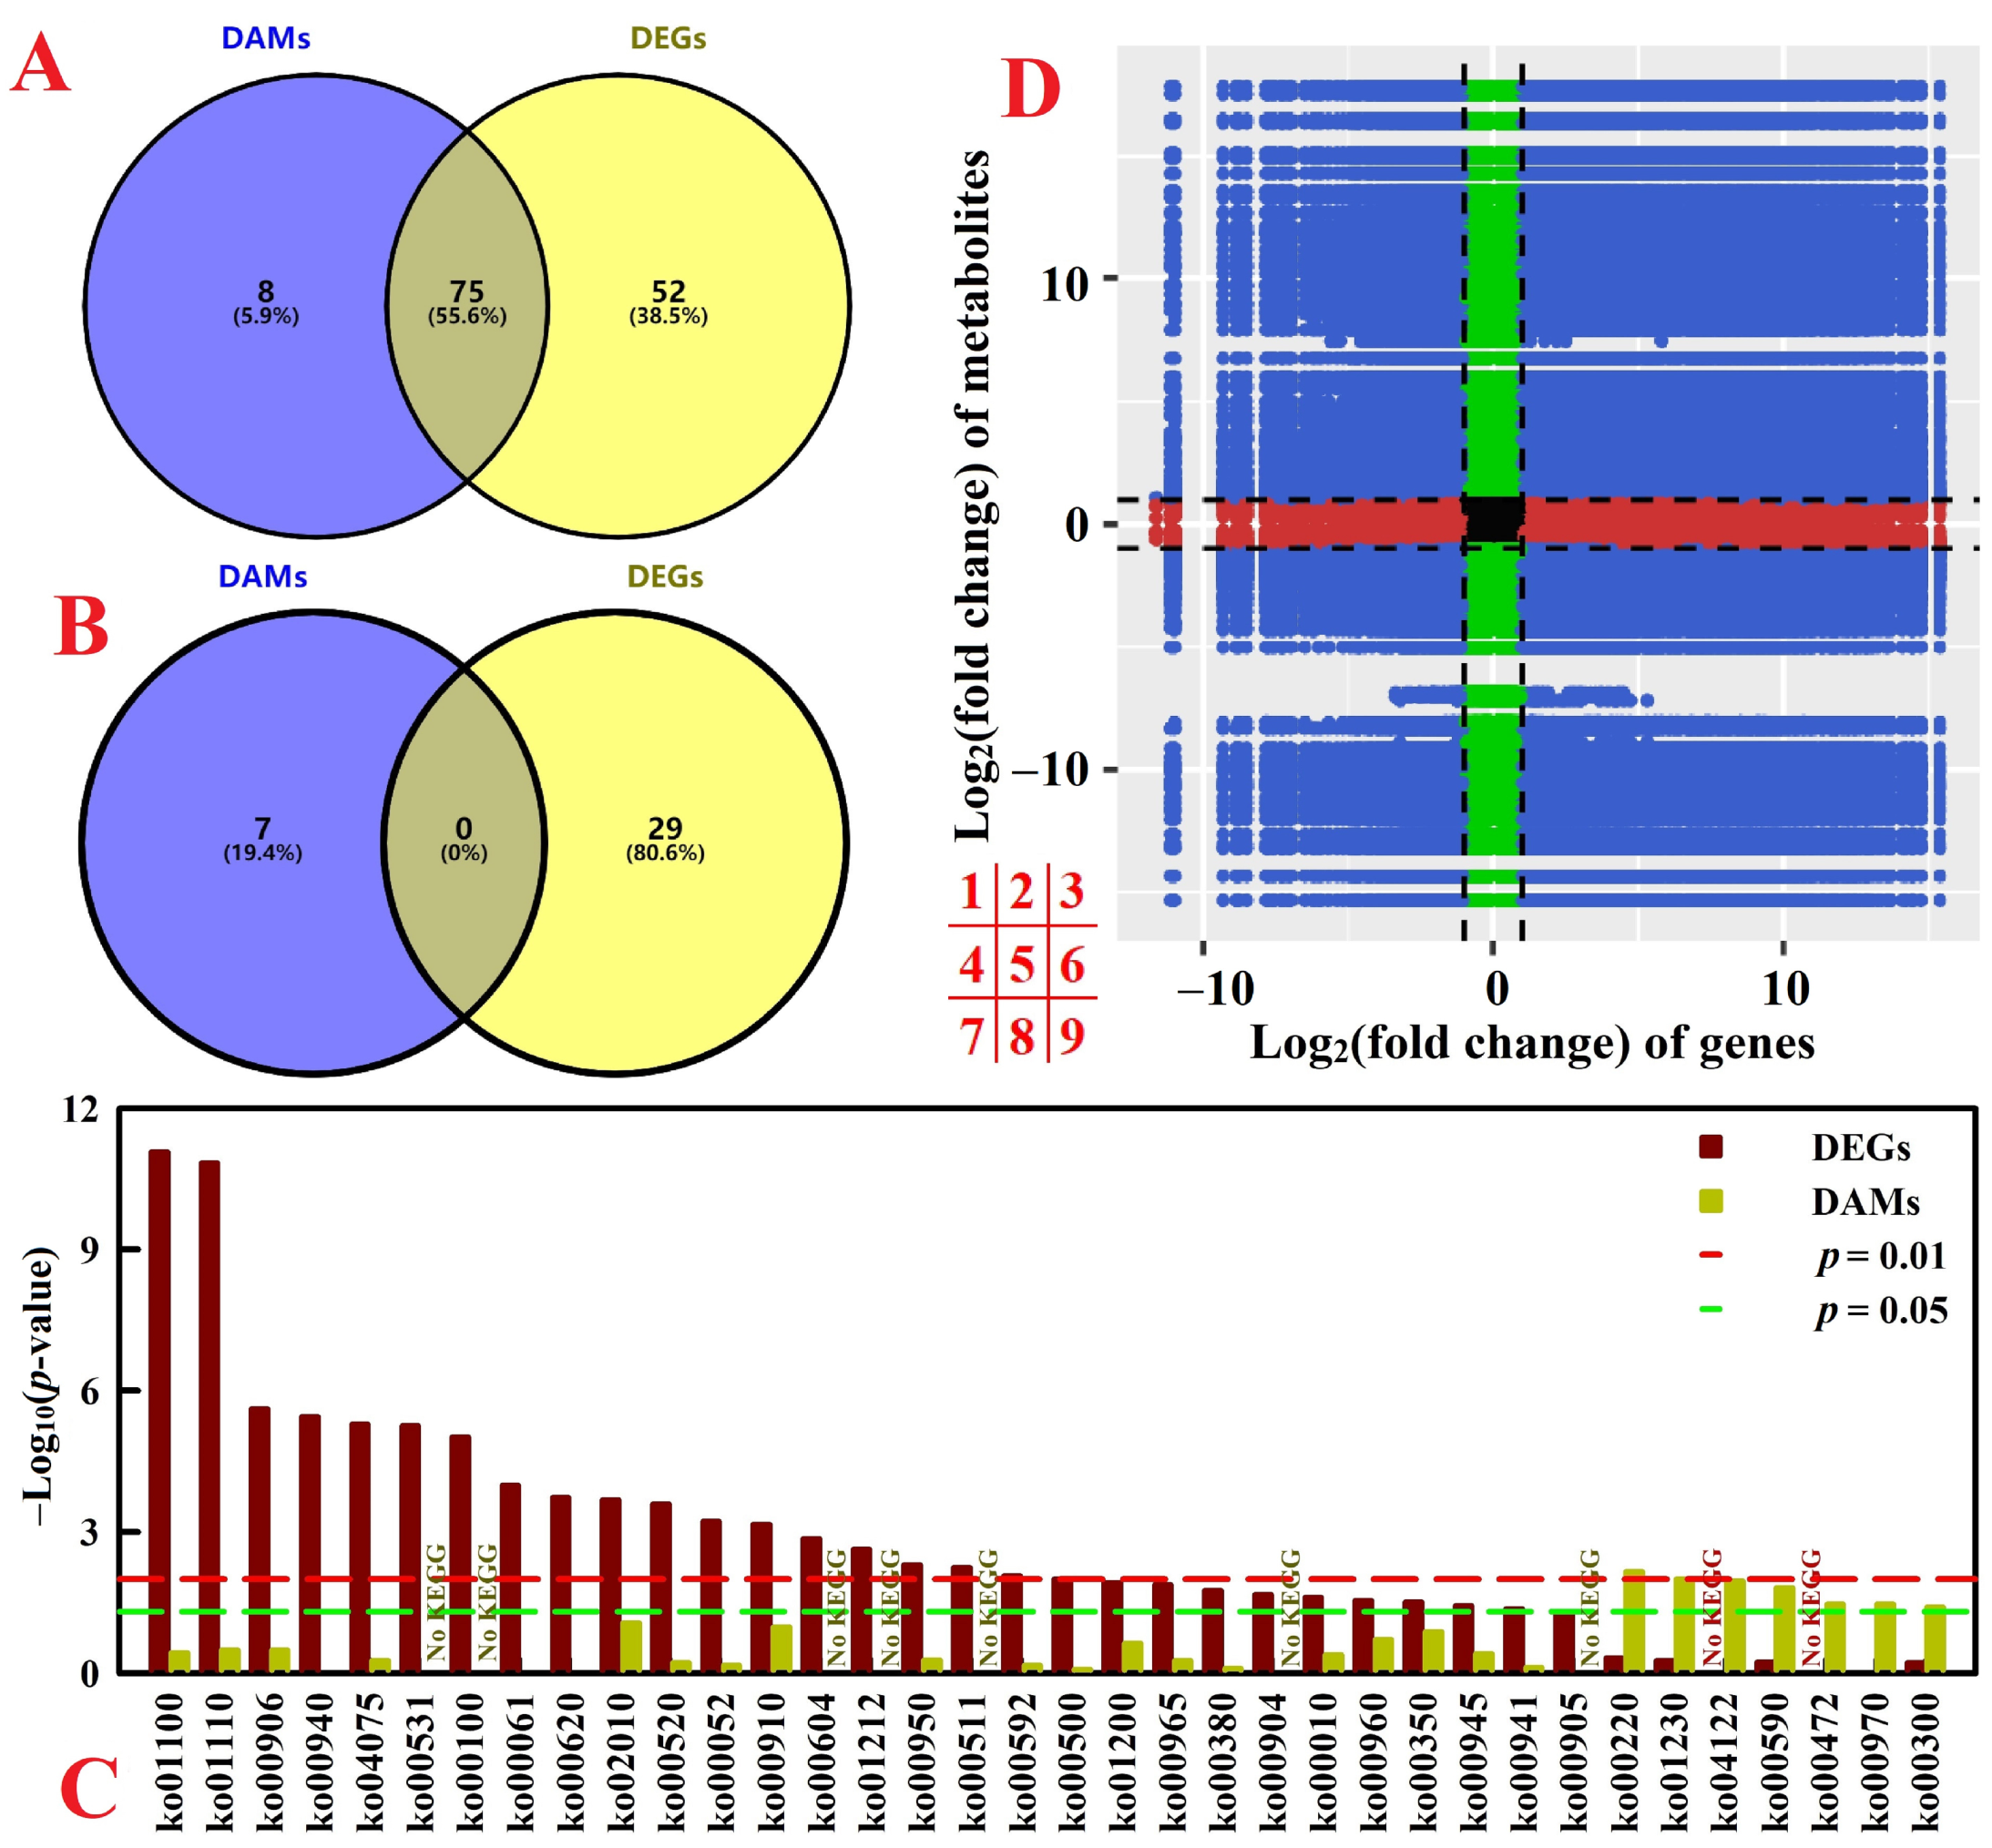
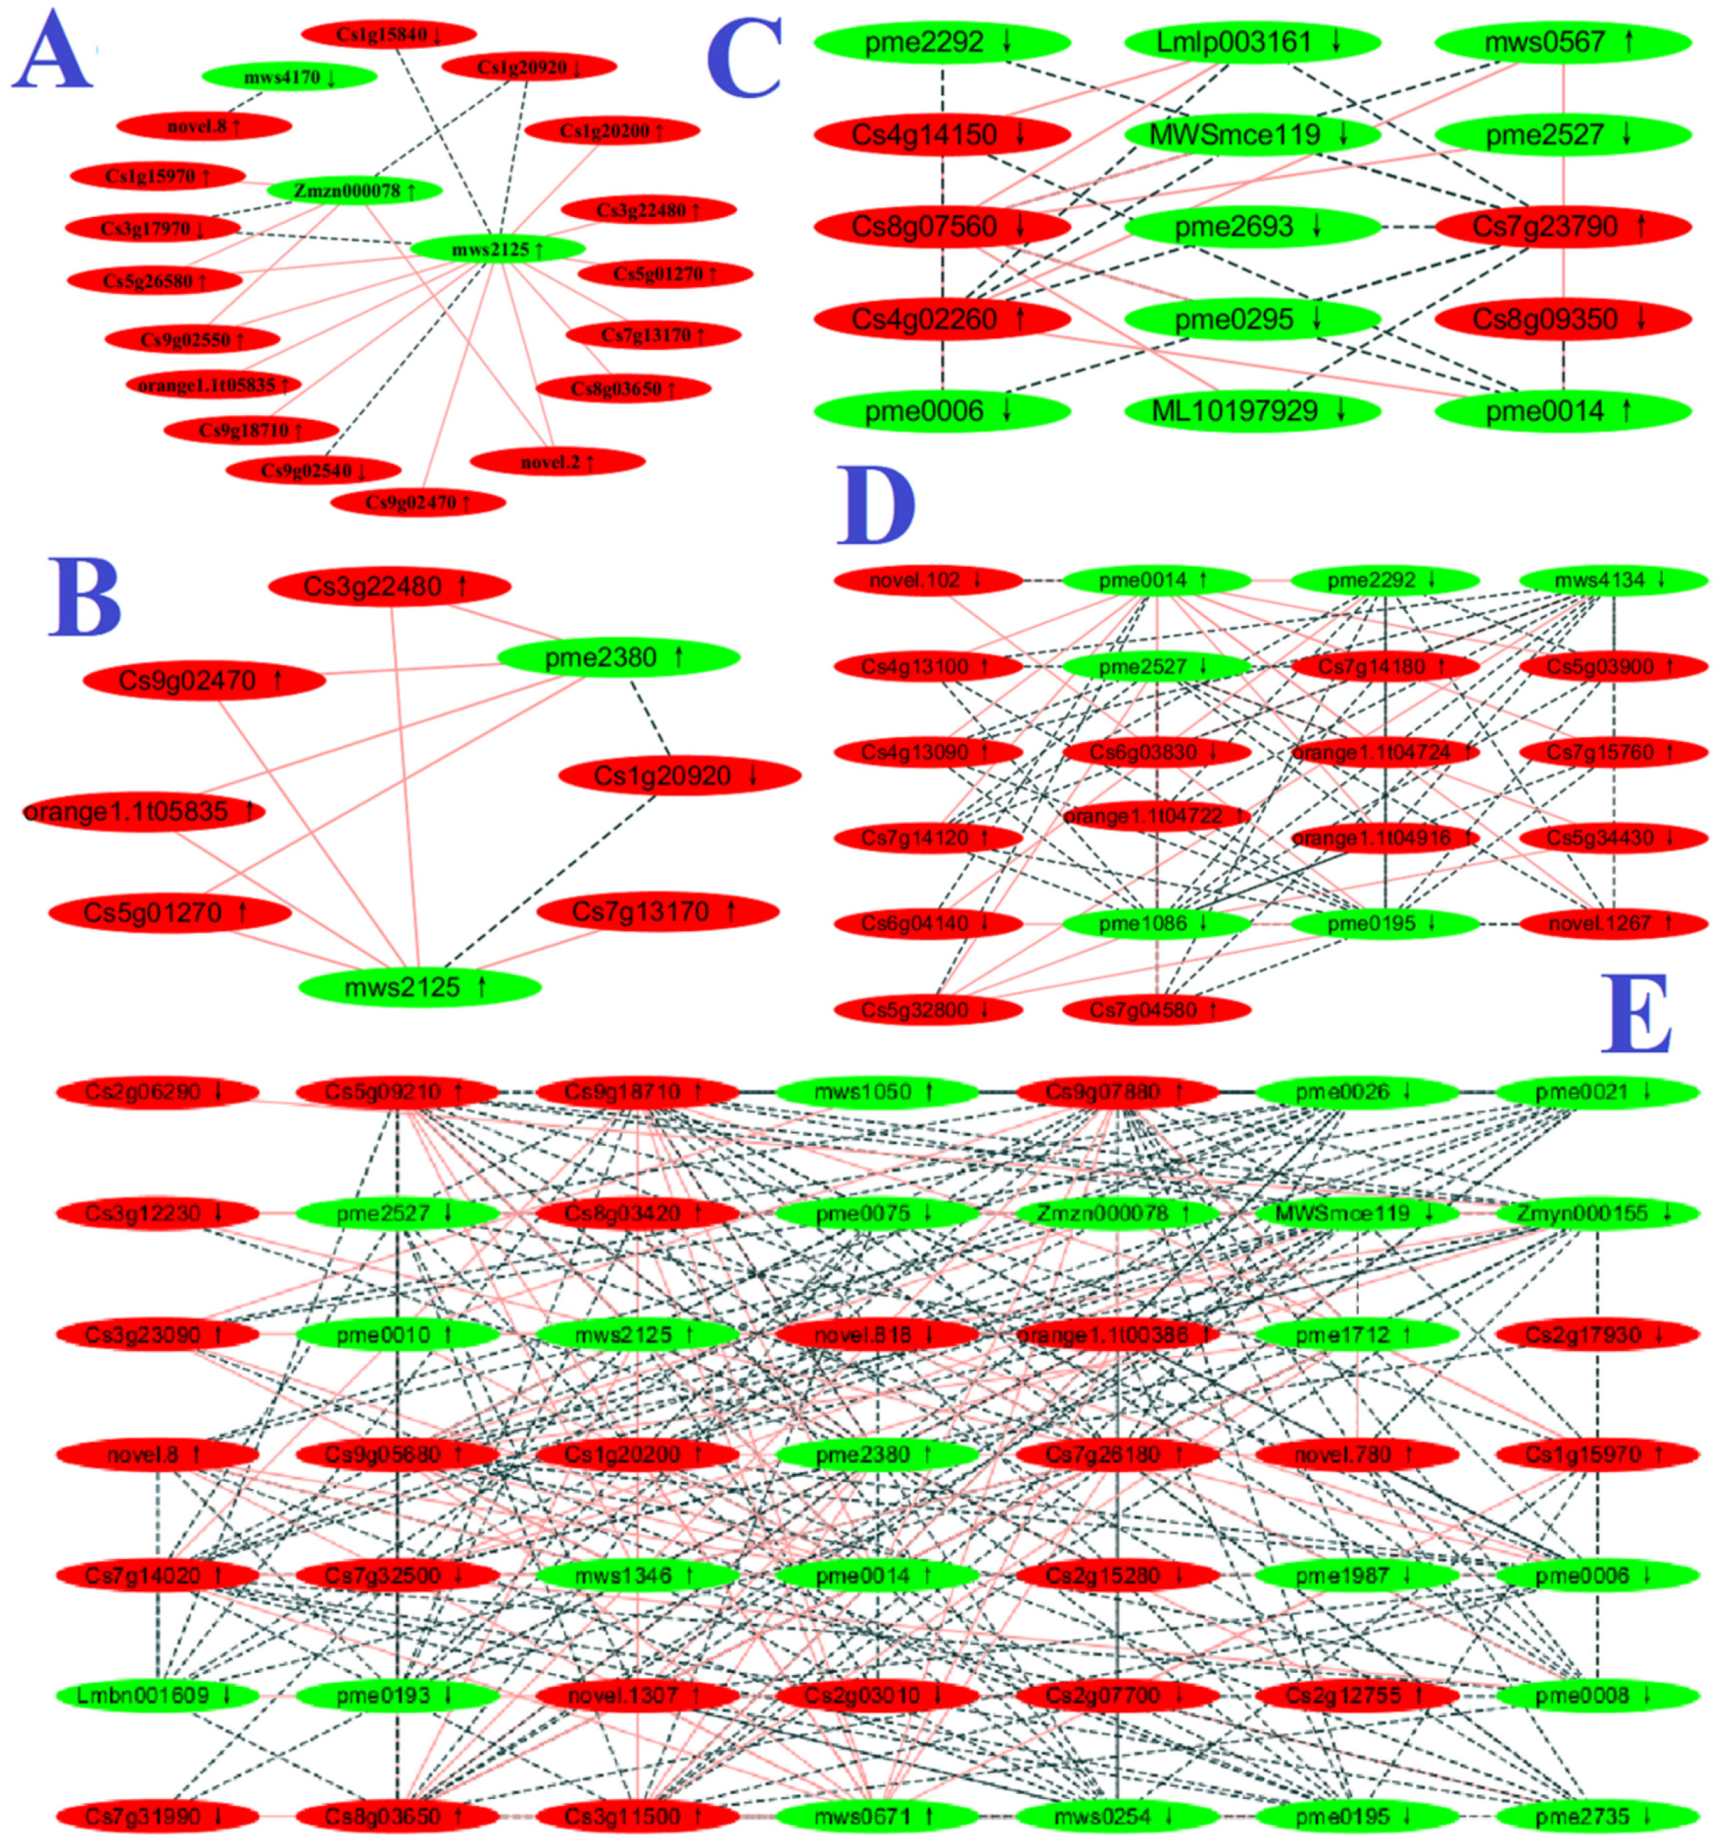
2.6. Integration of Transcriptome and Metabolome
3. Discussion
3.1. Adaptations of Primary Metabolism to N Deficiency in Roots
3.1.1. N Metabolism
3.1.2. Carbohydrate and Energy Metabolisms
3.1.3. Lipid Metabolisms
3.1.4. Pi Homeostasis
3.1.5. ND Metabolism
3.2. Adaptations of Secondary Metabolism to N Deficiency in Roots
3.3. Root MDA Level and EL Did Not Increase in Response to N Deficiency
3.4. Response of ABC Transporters to N Deficiency in Roots
3.5. Comparison of DEGs and DAMs between N-Deficient Leaves and Roots
4. Materials and Methods
4.1. Plant Materials
4.2. Measurements of N, MDA, EL, SAPR, Lignin, and Total Phenolics in Roots
4.3. Root Widely Targeted Metabolome
4.4. qRT-PCR Confirmation
4.5. Integration of Metabolome and Transcriptome
4.6. Data Analysis
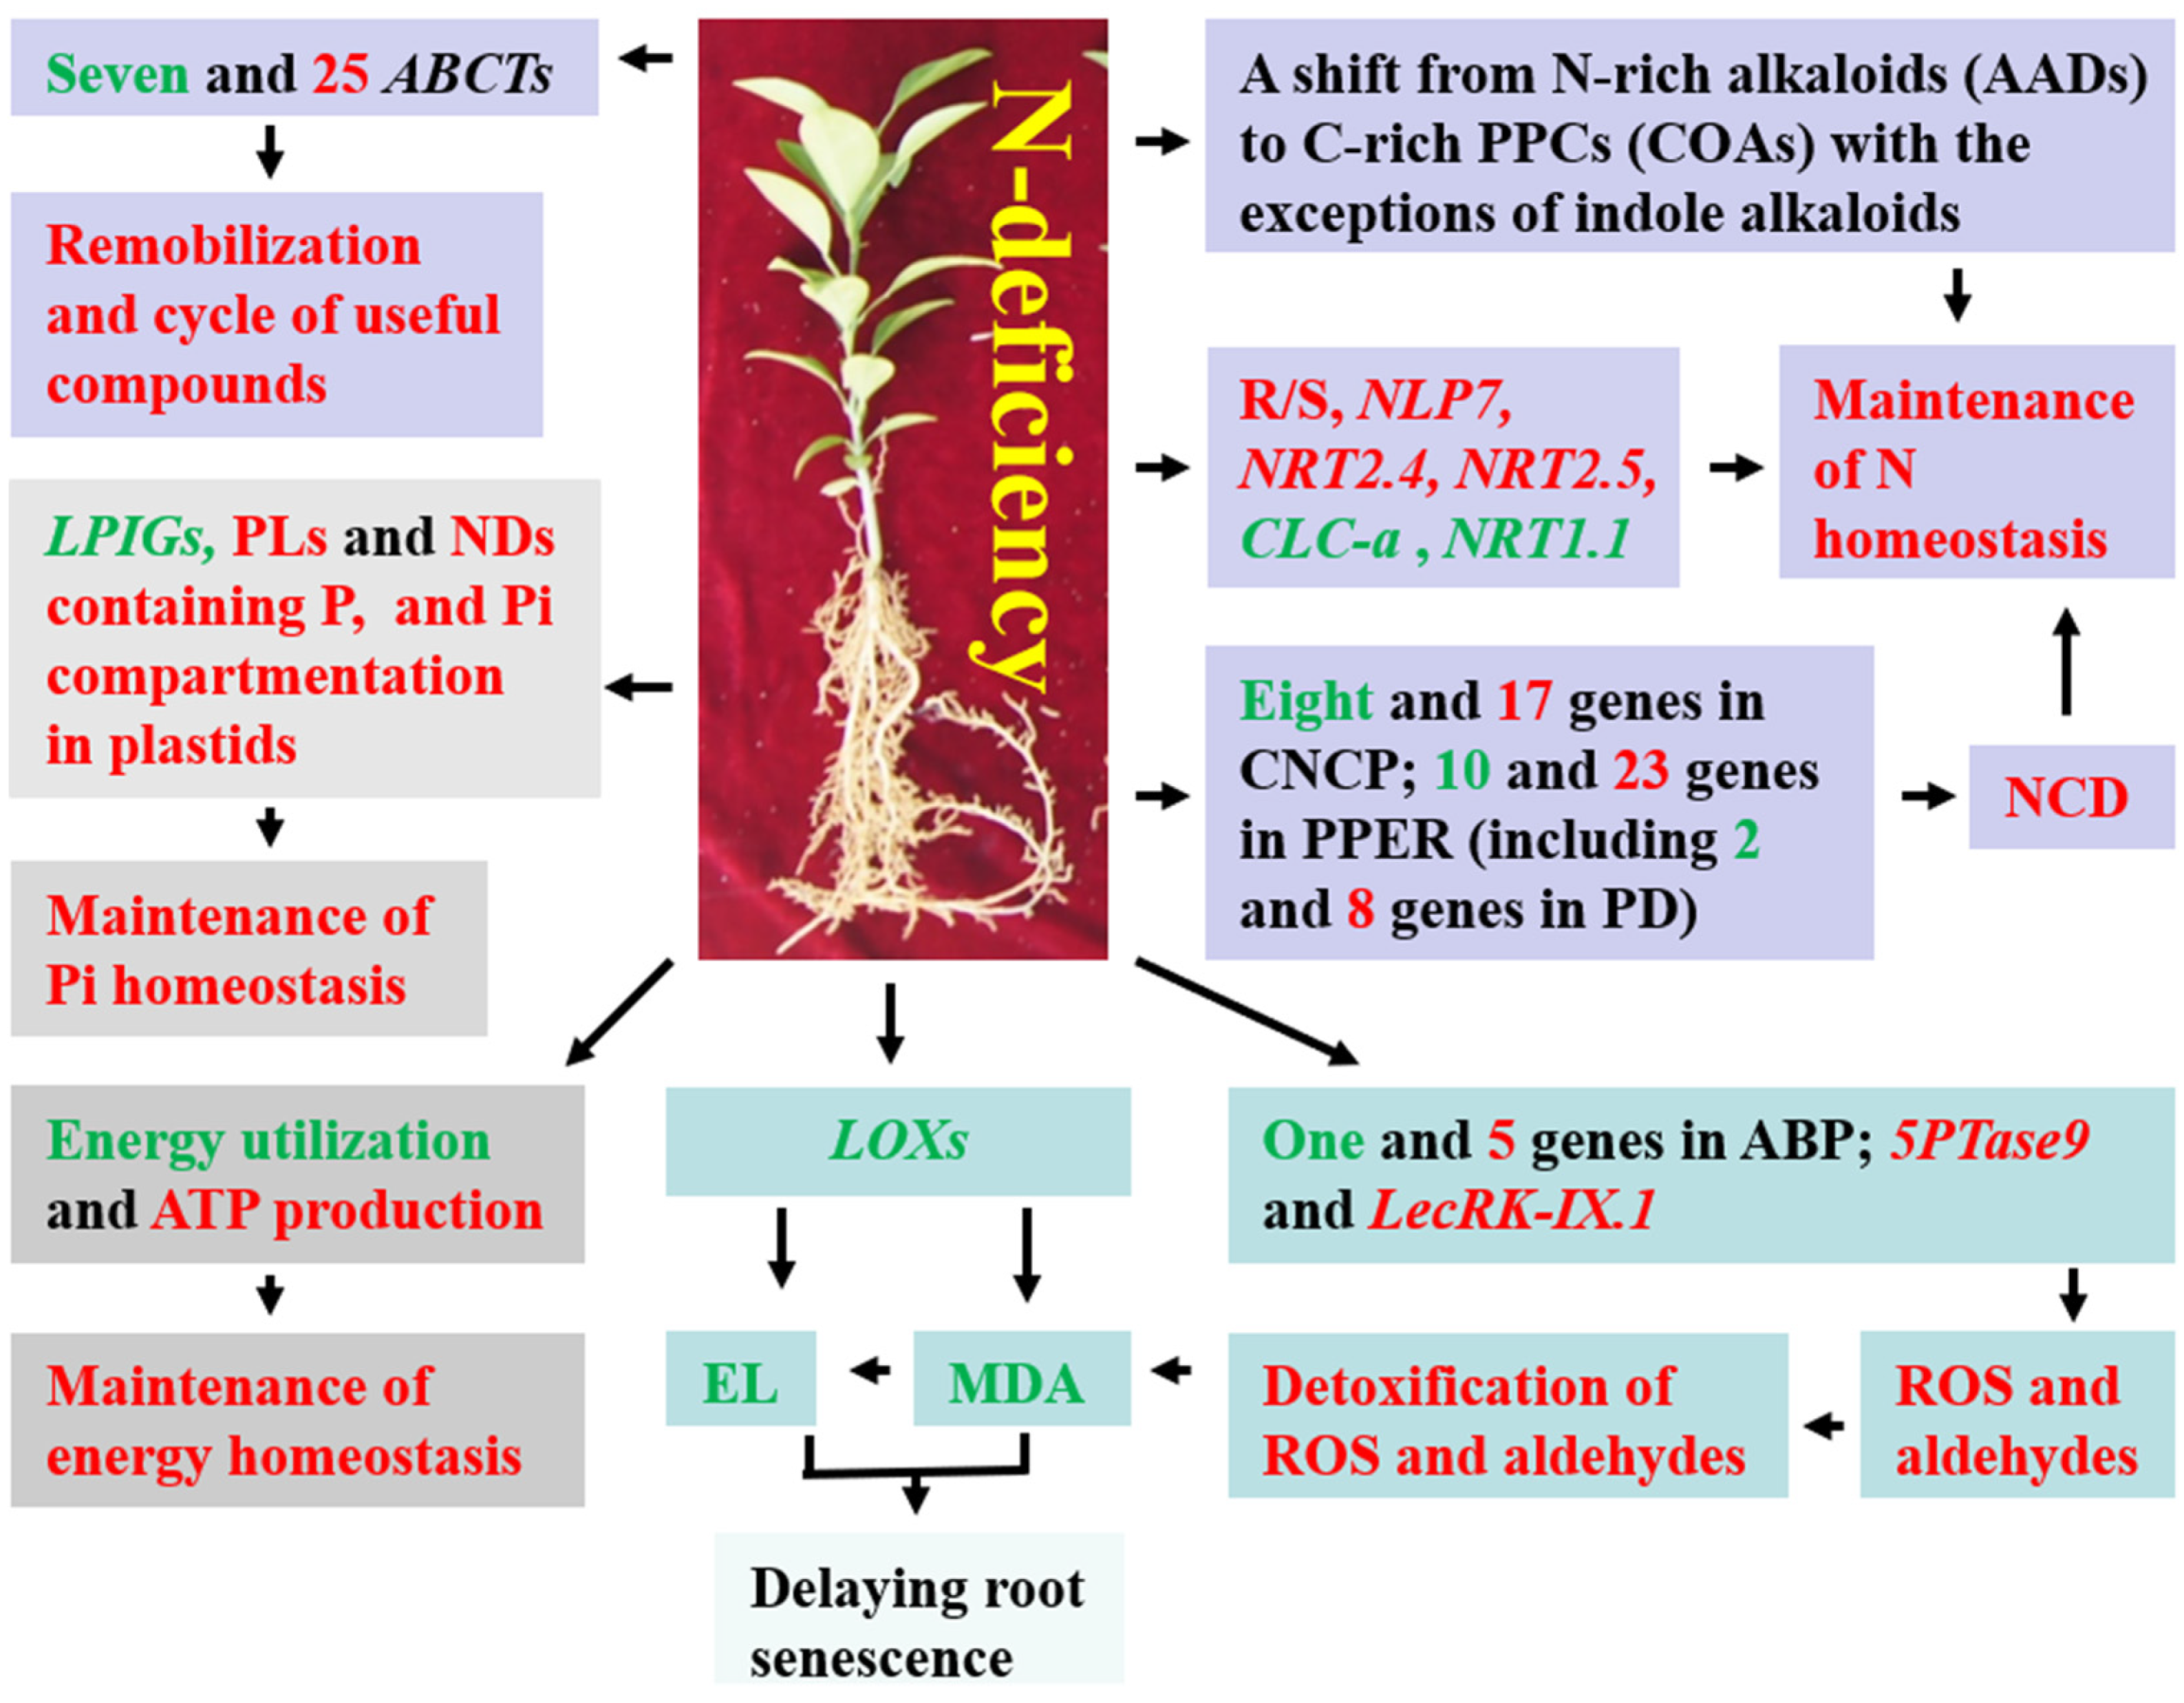
5. Conclusions
Supplementary Materials
Author Contributions
Funding
Data Availability Statement
Conflicts of Interest
References
- Heo, S.; Park, W.P. Effects of nitrogen deficiency and resupply on the absorption of mineral nutrients by Tangor cultivar ‘Shiranuhi’ (Citrus unshiu × C. sinensis) grown in a hydroponic system. Plants 2022, 11, 2351. [Google Scholar] [CrossRef] [PubMed]
- Xiong, H.; Ma, H.; Zhao, H.; Yang, L.; Hu, B.; Wang, J.; Shi, X.; Zhang, Y.; Rennenberg, H. Integrated physiological, proteome and gene expression analyses provide new insights into nitrogen remobilization in citrus trees. Tree Physiol. 2022, 42, 1628–1645. [Google Scholar] [CrossRef] [PubMed]
- Fan, Z.; Xiong, H.; Luo, Y.; Wang, Y.; Zhao, H.; Li, W.; He, X.; Wang, J.; Shi, X.; Zhang, Y. Fruit yields depend on biomass and nutrient accumulations in new shoots of citrus trees. Agronomy 2020, 10, 1988. [Google Scholar] [CrossRef]
- Wu, S.; Liang, S.; Hu, C.; Tan, Q.; Zhang, J.; Dong, Z. Ecological region division of soil based supplementary fertilization and decrement fertilization in China citrus orchards. J. Huazhong Agri. Univ. 2022, 41, 9–19. [Google Scholar]
- Li, Y.; Han, M.Q.; Lin, F.; Ten, Y.; Lin, J.; Zhu, D.H.; Guo, P.; Weng, Y.B.; Chen, L.S. Soil chemical properties, ‘Guanximiyou’ pummelo leaf mineral nutrient status and fruit quality in the southern region of Fujian province. China. J. Soil Sci. Plant Nutr. 2015, 15, 615–628. [Google Scholar] [CrossRef]
- Peng, M.Y.; Ren, Q.Q.; Lai, Y.H.; Zhang, J.; Chen, H.H.; Guo, J.; Yang, L.T.; Chen, L.S. Integration of physiology, metabolome and transcriptome for understanding of the adaptive strategies to long-term nitrogen deficiency in Citrus sinensis leaves. Sci. Hortic. 2023, 317, 112079. [Google Scholar] [CrossRef]
- Huang, W.T.; Xie, Y.Z.; Chen, X.F.; Zhang, J.; Chen, H.H.; Ye, X.; Guo, J.; Yang, L.T.; Chen, L.S. Growth, mineral nutrients, photosynthesis and related physiological parameters of citrus in response to nitrogen-deficiency. Agronomy 2021, 11, 1859. [Google Scholar] [CrossRef]
- Huang, W.T.; Zheng, Z.C.; Hua, D.; Chen, X.F.; Zhang, J.; Chen, H.H.; Ye, X.; Guo, J.X.; Yang, L.T.; Chen, L.S. Adaptive responses of carbon and nitrogen metabolisms to nitrogen-deficiency in Citrus sinensis seedlings. BMC Plant Biol. 2022, 22, 370. [Google Scholar] [CrossRef]
- Lin, Z.H.; Chen, C.S.; Zhong, Q.S.; Ruan, Q.C.; Chen, Z.H.; You, X.M.; Shan, R.Y.; Li, X.L. The GC-TOF/MS-based metabolomic analysis reveals altered metabolic profiles in nitrogen-deficient leaves and roots of tea plants (Camellia sinensis). BMC Plant Biol. 2021, 21, 506. [Google Scholar] [CrossRef]
- Qin, L.; Walk, T.C.; Han, P.; Chen, L.; Zhang, S.; Li, Y.; Hu, X.; Xie, L.; Yang, Y.; Liu, J.; et al. Adaption of roots to nitrogen deficiency revealed by 3D quantification and proteomic analysis. Plant Physiol. 2019, 179, 329–347. [Google Scholar] [CrossRef]
- Bondada, B.R.; Syvertsen, J.P. Leaf chlorophyll, net gas exchange and chloroplast ultrastructure in citrus leaves of different nitrogen status. Tree Physiol. 2003, 23, 539–553. [Google Scholar] [CrossRef]
- Lawlor, D.W. Carbon and nitrogen assimilation in relation to yield: Mechanisms are the key to understanding production systems. J. Exp. Bot. 2002, 53, 773–787. [Google Scholar] [CrossRef]
- Ghannoum, O.; Conroy, J.P. Nitrogen deficiency precludes a growth response to CO2 enrichment in C3 and C4 Panicum grasses. Aust. J. Plant Physiol. 1998, 25, 627–636. [Google Scholar] [CrossRef]
- Schlüter, U.; Mascher, M.; Colmsee, C.; Scholz, U.; Bräutigam, A.; Fahnenstich, H.; Sonnewald, U. Maize source leaf adaptation to nitrogen deficiency affects not only nitrogen and carbon metabolism but also control of phosphate homeostasis. Plant Physiol. 2012, 160, 1384–1406. [Google Scholar] [CrossRef] [PubMed]
- Zhang, J.; Wang, Y.; Zhao, Y.; Zhang, Y.; Zhang, J.; Ma, H.; Han, Y. Transcriptome analysis reveals nitrogen deficiency induced alterations in leaf and root of three cultivars of potato (Solanum tuberosum L.). PLoS ONE 2020, 15, e0240662. [Google Scholar] [CrossRef]
- Zhang, X.; Ma, Q.; Li, F.; Ding, Y.; Yi, Y.; Zhu, M.; Ding, J.; Li, C.; Guo, W.; Zhu, X. Transcriptome analysis reveals different responsive patterns to nitrogen deficiency in two wheat near-isogenic lines contrasting for nitrogen use efficiency. Biology 2021, 10, 1126. [Google Scholar] [CrossRef] [PubMed]
- Liu, C.; Yuan, Y.; Liu, J.; Wang, H.; Ma, Q.; Zhou, Y.; Liu, C.; Gong, X.; Feng, B. Comparative transcriptome and physiological analysis unravel proso millet (Panicum miliaceum L.) source leaf adaptation to nitrogen deficiency with high nitrogen use efficiency. Environ. Exp. Bot. 2022, 199, 104891. [Google Scholar] [CrossRef]
- Yang, S.Y.; Hao, D.L.; Song, Z.Z.; Yang, G.Z.; Wang, L.; Su, Y.H. RNA-Seq analysis of differentially expressed genes in rice under varied nitrogen supplies. Gene 2015, 555, 305–317. [Google Scholar] [CrossRef]
- Mu, X.; Chen, Q.; Chen, F.; Yuan, L.; Mi, G. A RNA-Seq analysis of the response of photosynthetic system to low nitrogen supply in maize leaf. Int. J. Mol. Sci. 2017, 18, 2624. [Google Scholar] [CrossRef]
- Yang, N.; Li, S.; Wang, S.; Li, Q.; Xu, F.; Shi, L.; Wang, C.; Ye, X.; Cai, H.; Ding, G. Dynamic transcriptome analysis indicates extensive and discrepant transcriptomic reprogramming of two rapeseed genotypes with contrasting NUE in response to nitrogen deficiency. Plant Soil 2020, 456, 369–390. [Google Scholar] [CrossRef]
- Cao, Y.W.; Qu, R.J.; Tang, X.Q.; Sun, L.Q.; Chen, Q.Q.; Miao, Y.J. UPLC-Triple TOF-MS/MS based metabolomics approach to reveal the influence of nitrogen levels on Isatis indigotica seedling leaf. Sci. Hortic. 2020, 266, 109280. [Google Scholar] [CrossRef]
- Zhao, M.; Guo, R.; Li, M.; Liu, Y.; Wang, X.; Fu, H.; Wang, S.; Liu, X.; Shi, L. Physiological characteristics and metabolomics reveal the tolerance mechanism to low nitrogen in Glycine soja leaves. Physiol. Plant. 2020, 168, 819–834. [Google Scholar] [CrossRef] [PubMed]
- Shen, X.; Yang, L.; Han, P.; Gu, C.; Li, Y.; Liao, X.; Qin, L. Metabolic profiles reveal changes in the leaves and roots of rapeseed (Brassica napus L.) seedlings under nitrogen deficiency. Int. J. Mol. Sci. 2022, 23, 5784. [Google Scholar] [CrossRef] [PubMed]
- Xin, W.; Zhang, L.; Zhang, W.; Gao, J.; Yi, J.; Zhen, X.; Du, M.; Zhao, Y.; Chen, L. An integrated analysis of the rice transcriptome and metabolome reveals root growth regulation mechanisms in response to nitrogen availability. Int. J. Mol. Sci. 2019, 20, 5893. [Google Scholar] [CrossRef]
- Liu, D.; Li, M.; Liu, Y.; Shi, L. Integration of the metabolome and transcriptome reveals the resistance mechanism to low nitrogen in wild soybean seedling roots. Environ. Exp. Bot. 2020, 175, 104043. [Google Scholar] [CrossRef]
- Song, H.; Cai, Z.; Liao, J.; Tang, D.; Zhang, S. Sexually differential gene expressions in poplar roots in response to nitrogen deficiency. Tree Physiol. 2019, 39, 1614–1629. [Google Scholar] [CrossRef]
- Comadira, G.; Rasool, B.; Karpinska, B.; Morris, J.; Verrall, S.R.; Hedley, P.E.; Foyer, C.H.; Hancock, R.D. Nitrogen deficiency in barley (Hordeum vulgare) seedlings induces molecular and metabolic adjustments that trigger aphid resistance. J. Exp. Bot. 2015, 66, 3639–3655. [Google Scholar] [CrossRef]
- Sun, T.; Zhang, J.; Zhang, Q.; Li, X.; Li, M.; Yang, Y.; Zhou, J.; Wei, Q.; Zhou, B. Integrative physiological, transcriptome, and metabolome analysis reveals the effects of nitrogen sufficiency and deficiency conditions in apple leaves and roots. Environ. Exp. Bot. 2021, 192, 104633. [Google Scholar] [CrossRef]
- Krapp, A.; Berthomé, R.; Orsel, M.; Mercey-Boutet, S.; Yu, A.; Castaings, L.; Elftieh, S.; Major, H.; Renou, J.P.; Daniel-Vedele, F. Arabidopsis roots and shoots show distinct temporal adaptation patterns toward nitrogen starvation. Plant Physiol. 2011, 157, 1255–1282. [Google Scholar] [CrossRef]
- Liu, X.; Liu, X.; Liu, W.; Tan, Q.; Hu, C.; Li, J. Nutritional status of different citrus trees and the recommended dosages of N, P and K for citrus production in China. J. Plant Nutr. Fert. 2021, 27, 565–574. [Google Scholar]
- Wu, B.S.; Lai, Y.H.; Peng, M.Y.; Ren, Q.Q.; Lai, N.W.; Wu, J.; Huang, Z.R.; Yang, L.T.; Chen, L.S. Elevated pH-mediated mitigation of aluminum-toxicity in sweet orange (Citrus sinensis) roots involved the regulation of energy-rich compounds and phytohormones. Environ. Pollut. 2022, 311, 119982. [Google Scholar] [CrossRef]
- Heinemann, B.; Hildebrandt, T.M. The role of amino acid metabolism in signaling and metabolic adaptation to stress-induced energy deficiency in plants. J. Exp. Bot. 2021, 72, 4634–4645. [Google Scholar] [CrossRef]
- Lezhneva, L.; Kiba, T.; Feria-Bourrellier, A.B.; Lafouge, F.; Boutet-Mercey, S.; Zoufan, P.; Sakakibara, H.; Daniel-Vedele, F.; Krapp, A. The Arabidopsis nitrate transporter NRT2.5 plays a role in nitrate acquisition and remobilization in nitrogen-starved plants. Plant J. 2014, 80, 230–241. [Google Scholar] [CrossRef] [PubMed]
- Hsu, P.K.; Tsay, Y.F. Two phloem nitrate transporters, NRT1.11 and NRT1.12, are important for redistributing xylem-borne nitrate to enhance plant growth. Plant Physiol. 2013, 163, 844–856. [Google Scholar] [CrossRef] [PubMed]
- Lin, S.H.; Kuo, H.F.; Canivenc, G.; Lin, C.S.; Lepetit, M.; Hsu, P.K.; Tillard, P.; Lin, H.L.; Wang, Y.Y.; Tsai, C.B.; et al. Mutation of the Arabidopsis NRT1.5 nitrate transporter causes defective root-to-shoot nitrate transport. Plant Cell 2008, 20, 2514–2528. [Google Scholar] [CrossRef]
- Meng, S.; Peng, J.S.; He, Y.N.; Zhang, G.B.; Yi, H.Y.; Fu, Y.L.; Gong, J.M. Arabidopsis NRT1.5 mediates the suppression of nitrate starvation-induced leaf senescence by modulating foliar potassium level. Mol. Plant 2016, 9, 461–470. [Google Scholar] [CrossRef]
- Léran, S.; Muños, S.; Brachet, C.; Tillard, P.; Gojon, A.; Lacombe, B. Arabidopsis NRT1.1 is a bidirectional transporter involved in root-to-shoot nitrate translocation. Mol. Plant 2013, 6, 1984–1987. [Google Scholar] [CrossRef]
- Xu, N.; Wang, R.; Zhao, L.; Zhang, C.; Li, Z.; Lei, Z.; Liu, F.; Guan, P.; Chu, Z.; Crawford, N.M.; et al. The Arabidopsis NRG2 protein mediates nitrate signaling and interacts with and regulates key nitrate regulators. Plant Cell 2016, 28, 485–504. [Google Scholar] [CrossRef]
- Geelen, D.; Lurin, C.; Bouchez, D.; Frachisse, J.M.; Lelièvre, F.; Courtial, B.; Barbier-Brygoo, H.; Maurel, C. Disruption of putative anion channel gene AtCLC-a in Arabidopsis suggests a role in the regulation of nitrate content. Plant J. 2000, 21, 259–267. [Google Scholar] [CrossRef]
- De Angeli, A.; Monachello, D.; Ephritikhine, G.; Frachisse, J.M.; Thomine, S.; Gambale, F.; Barbier-Brygoo, H. The nitrate/proton antiporter AtCLCa mediates nitrate accumulation in plant vacuoles. Nature 2006, 442, 939–942. [Google Scholar] [CrossRef] [PubMed]
- Alfatih, A.; Wu, J.; Zhang, Z.S.; Xia, J.Q.; Jan, S.U.; Yu, L.H.; Xiang, C.B. Rice NIN-LIKE PROTEIN 1 rapidly responds to nitrogen deficiency and improves yield and nitrogen use efficiency. J. Exp. Bot. 2020, 71, 6032–6042. [Google Scholar] [CrossRef]
- Lu, L.; Zhang, Y.; Li, L.; Yi, N.; Liu, Y.; Qaseem, M.F.; Li, H.; Wu, A.M. Physiological and transcriptomic responses to nitrogen deficiency in Neolamarckia cadamba. Front. Plant Sci. 2021, 12, 747121. [Google Scholar] [CrossRef]
- Feng, Z.Q.; Li, T.; Wang, X.; Sun, W.J.; Zhang, T.T.; You, C.X.; Wang, X.F. Identification and characterization of apple MdNLP7 transcription factor in the nitrate response. Plant Sci. 2022, 316, 111158. [Google Scholar] [CrossRef] [PubMed]
- Zhu, L.; Liu, L.; Sun, H.; Zhang, Y.; Zhu, J.; Zhang, K.; Li, A.; Bai, Z.; Wang, G.; Li, C. Physiological and comparative transcriptomic analysis provide insight into cotton (Gossypium hirsutum L.) root senescence in response. Front. Plant Sci. 2021, 12, 748715. [Google Scholar] [CrossRef]
- Zakari, S.A.; Asad, M.A.U.; Han, Z.; Zhao, Q.; Cheng, F. Relationship of nitrogen deficiency-induced leaf senescence with ROS generation and ABA concentration in rice flag leaves. J. Plant Growth Regul. 2020, 39, 1503–1517. [Google Scholar] [CrossRef]
- Mazzucotelli, E.; Mastrangelo, A.M.; Crosatti, C.; Guerra, D.; Stanca, A.M.; Cattivelli, L. Abiotic stress response in plants: When post-transcriptional and post-translational regulations control transcription. Plant Sci. 2008, 174, 420–431. [Google Scholar] [CrossRef]
- Liu, Y.; Li, J. Endoplasmic reticulum-mediated protein quality control in Arabidopsis. Front. Plant Sci. 2014, 5, 162. [Google Scholar] [CrossRef]
- Liu, J.X.; Howell, S.H. Endoplasmic reticulum protein quality control and its relationship to environmental stress responses in plants. Plant Cell 2010, 22, 2930–2942. [Google Scholar] [CrossRef]
- Kishor, P.B.K.; Sreenivasulu, N. Is proline accumulation per se correlated with stress tolerance or is proline homeostasis a more critical issue? Plant Cell Environ. 2014, 37, 300–311. [Google Scholar] [CrossRef] [PubMed]
- Sadiq, M.; Akram, N.A.; Ashraf, M.; Al-Qurainy, F.; Ahmad, P. Alpha-tocopherol-induced regulation of growth and metabolism in plants under non-stress and stress conditions. J. Plant Growth Regul. 2019, 38, 1325–1340. [Google Scholar] [CrossRef]
- Chowdhury, N.B.; Schroeder, W.L.; Sarkar, D.; Amiour, N.; Quilleré, I.; Hirel, B.; Maranas, C.D.; Saha, R. Dissecting the metabolic reprogramming of maize root under nitrogen-deficient stress conditions. J. Exp. Bot. 2022, 73, 275–291. [Google Scholar] [CrossRef]
- Tang, J.; Hu, K.D.; Hu, L.Y.; Li, Y.H.; Liu, Y.S.; Zhang, H. Hydrogen sulfide acts as a fungicide to alleviate senescence and decay in fresh-cut sweetpotato. HortScience 2014, 49, 938–943. [Google Scholar] [CrossRef]
- Hou, Y.; Meng, K.; Han, Y.; Ban, Q.; Wang, B.; Suo, J.; Lv, J.; Rao, J. The persimmon 9-lipoxygenase gene DkLOX3 plays positive roles in both promoting senescence and enhancing tolerance to abiotic stress. Front. Plant Sci. 2015, 6, 1073. [Google Scholar] [CrossRef] [PubMed]
- Carvajal, M.; Cooke, D.T.; Clarkson, D.T. 1996. Responses of wheat plants to nutrient deprivation may involve the regulation of water-channel function. Planta 1996, 199, 372–381. [Google Scholar] [CrossRef]
- Gaude, N.; Bréhélin, C.; Tischendorf, G.; Kessler, F.; Dörmann, P. Nitrogen deficiency in Arabidopsis affects galactolipid composition and gene expression and results in accumulation of fatty acid phytyl esters. Plant J. 2007, 49, 729–739. [Google Scholar] [CrossRef] [PubMed]
- Maharajan, T.; Ceasar, S.A.; Ajeesh Krishna, T.P. Finger millet (Eleusine coracana (L.) Gaertn): Nutritional importance and nutrient transporters. Crit. Rev. Plant Sci. 2022, 41, 1–31. [Google Scholar] [CrossRef]
- Chang, M.X.; Gu, M.; Xia, Y.W.; Dai, X.L.; Dai, C.R.; Zhang, J.; Wang, S.C.; Qu, H.Y.; Yamaji, N.; Ma, J.F.; et al. OsPHT1;3 mediates uptake, translocation, and remobilization of phosphate under extremely low phosphate regimes. Plant Physiol. 2019, 179, 656–670. [Google Scholar] [CrossRef]
- Huang, T.K.; Han, C.L.; Lin, S.I.; Chen, Y.J.; Tsai, Y.C.; Chen, Y.R.; Chen, J.W.; Lin, W.Y.; Chen, P.M.; Liu, T.Y.; et al. Identification of downstream components of ubiquitin-conjugating enzyme PHOSPHATE2 by quantitative membrane proteomics in Arabidopsis roots. Plant Cell 2013, 25, 4044–4060. [Google Scholar] [CrossRef]
- Roch, G.V.; Maharajan, T.; Ceasar, S.A.; Ignacimuthu, S. The role of PHT1 family transporters in the acquisition and redistribution of phosphorus in plants. Crit. Rev. Plant Sci. 2019, 38, 171–198. [Google Scholar] [CrossRef]
- Mukherjee, P.; Banerjee, S.; Wheeler, A.; Ratliff, L.A.; Irigoyen, S.; Garcia, L.R.; Lockless, S.W.; Versaw, W.K. Live imaging of inorganic phosphate in plants with cellular and subcellular resolution. Plant Physiol. 2015, 167, 628–638. [Google Scholar] [CrossRef]
- Ryan, M.H.; Kaur, P.; Nazeri, N.K.; Clode, P.L.; Keeble-Gagnère, G.; Doolette, A.L.; Smernik, R.J.; Van Aken, O.; Nicol, D.; Maruyama, H.; et al. Globular structures in roots accumulate phosphorus to extremely high concentrations following phosphorus addition. Plant Cell Environ. 2019, 42, 1987–2002. [Google Scholar] [CrossRef]
- Cheng, Y.; Zhou, W.; El Sheery, N.I.; Peters, C.; Li, M.; Wang, X.; Huang, J. Characterization of the Arabidopsis glycerophosphodiester phosphodiesterase (GDPD) family reveals a role of the plastid-localized AtGDPD1 in maintaining cellular phosphate homeostasis under phosphate starvation. Plant J. 2011, 66, 781–795. [Google Scholar] [CrossRef]
- Liu, T.Y.; Aung, K.; Tseng, C.Y.; Chang, T.Y.; Chen, Y.S.; Chiou, T.J. Vacuolar Ca2+/H+ transport activity is required for systemic phosphate homeostasis involving shoot-to-root signaling in Arabidopsis. Plant Physiol. 2011, 156, 1176–1189. [Google Scholar] [CrossRef] [PubMed]
- Cao, Y.W.; Qu, R.J.; Miao, Y.J.; Tang, X.Q.; Zhou, Y.; Wang, L.; Geng, L. Untargeted liquid chromatography coupled with mass spectrometry reveals metabolic changes in nitrogen-deficient Isatis indigotica Fortune. Phytochemistry 2019, 166, 112058. [Google Scholar] [CrossRef] [PubMed]
- Vogt, T. Phenylpropanoid biosynthesis. Mol. Plant 2010, 3, 2–20. [Google Scholar] [CrossRef]
- Van Dam, N.M.; De-Jong, T.J.; Iwasa, Y.; Kubo, T. Optimal distribution of defenses: Are plants smart investors? Funct. Ecol. 1996, 10, 128–136. [Google Scholar]
- Zhang, M.; Zhao, Y.; Yang, C.; Shi, H. The combination of transcriptome and metabolome reveals the molecular mechanism by which topping and salicylic acid treatment affect the synthesis of alkaloids in Nicotiana tabacum L. All Life 2022, 15, 147–159. [Google Scholar] [CrossRef]
- Mahood, H.E.; Alwash, B.M.; Ibrahim, K.M. Improvement of alkaloids yield using phenylalanine as a precursor supplemented to Morina oleifera L. callus cultures. Biochem. Cell Arch. 2018, 18, 913–919. [Google Scholar]
- Nowacki, E.; Jurzysta, M.; Gorski, P.; Nowacka, D.; Waller, G.R. Effect of nitrogen nutrition on alkaloid metabolism in plants. Biochem. Physiol. Pflanzen 1976, 169, 231–240. [Google Scholar] [CrossRef]
- Feduraev, P.; Skrypnik, L.; Riabova, A.; Pungin, A.; Tokupova, E.; Maslennikov, P.; Chupakhina, G. Phenylalanine and tyrosine as exogenous precursors of wheat (Triticum aestivum L.) secondary metabolism through PAL-associated pathways. Plants 2020, 9, 476. [Google Scholar] [CrossRef]
- Sun, Y.; Guo, J.; Li, Y.; Luo, G.; Li, L.; Yuan, H.; Mur, L.A.J.; Guo, S. Negative effects of the simulated nitrogen deposition on plant phenolic metabolism: A meta-analysis. Sci. Total Environ. 2020, 719, 137442. [Google Scholar] [CrossRef] [PubMed]
- Kováčik, J.; Bačkor, M. Changes of phenolic metabolism and oxidative status in nitrogen-deficient Matricaria chamomilla plants. Plant Soil 2007, 297, 255–265. [Google Scholar] [CrossRef]
- Giorgi, A.; Mingozzi, M.; Madeo, M.; Speranza, G.; Cocucci, M. Effect of nitrogen starvation on the phenolic metabolism and antioxidant properties of yarrow (Achillea collina Becker ex Rchb.). Food Chem. 2009, 114, 204–211. [Google Scholar] [CrossRef]
- Ye, X.; Chen, X.F.; Cai, L.Y.; Lai, N.W.; Deng, C.L.; Guo, J.X.; Yang, L.T.; Chen, L.S. Molecular and physiological mechanisms underlying magnesium-deficiency-induced enlargement, cracking and lignification of Citrus sinensis leaf veins. Tree Physiol. 2020, 40, 1277–1291. [Google Scholar] [CrossRef]
- Shin, R.; Berg, R.H.; Schachtman, D.P. Reactive oxygen species and root hairs in Arabidopsis root response to nitrogen, phosphorus and potassium deficiency. Plant Cell Physiol. 2005, 46, 1350–1357. [Google Scholar] [CrossRef]
- Wang, Y.; Cordewener, J.H.; America, A.H.; Shan, W.; Bouwmeester, K.; Govers, F. Arabidopsis lectin receptor kinases LecRK-IX.1 and LecRK-IX.2 are functional analogs in regulating Phytophthora resistance and plant cell death. Mol. Plant Microbe Interact. 2015, 8, 1032–1048. [Google Scholar] [CrossRef] [PubMed]
- Golani, Y.; Kaye, Y.; Gilhar, O.; Ercetin, M.; Gillaspy, G.; Levine, A. Inositol polyphosphate phosphatidylinositol 5-phosphatase9 (At5ptase9) controls plant salt tolerance by regulating endocytosis. Mol. Plant 2013, 6, 1781–1794. [Google Scholar] [CrossRef]
- Gorecka, K.M.; Konopka-Postupolska, D.; Hennig, J.; Buchet, R.; Pikula, S. Peroxidase activity of annexin 1 from Arabidopsis thaliana. Biochem. Biophys. Res. Commun. 2005, 336, 868–875. [Google Scholar] [CrossRef] [PubMed]
- Breitkreuz, K.E.; Allan, W.L.; Van Cauwenberghe, O.R.; Jakobs, C.; Talibi, D.; Andre, B.; Shelp, B.J. A novel γ-hydroxybutyrate dehydrogenase: Identification and expression of an Arabidopsis cDNA and potential role under oxygen deficiency. J. Biol. Chem. 2003, 278, 41552–41556. [Google Scholar] [CrossRef]
- Ogawa, T.; Ishikawa, K.; Harada, K.; Fukusaki, E.; Yoshimura, K.; Shigeoka, S. Overexpression of an ADP-ribose pyrophosphatase, AtNUDX2, confers enhanced tolerance to oxidative stress in Arabidopsis plants. Plant J. 2009, 57, 289–301. [Google Scholar] [CrossRef]
- Hazra, A.; Varshney, V.; Verma, P.; Kamble, N.U.; Ghosh, S.; Achary, R.K.; Gautam, S.; Majee, M. Methionine sulfoxide reductase B5 plays a key role in preserving seed vigor and longevity in rice (Oryza sativa). New Phytol. 2022, 236, 1042–1060. [Google Scholar] [CrossRef]
- Eckardt, N.A. Oxidation pathways and plant development: Crosstalk between thioredoxin and glutaredoxin pathways. Plant Cell 2007, 19, 1719–1721. [Google Scholar] [CrossRef]
- Noctor, G.; Mhamdi, A.; Chaouch, S.; Han, Y.; Neukermans, J.; Marquez-Garcia, B.; Queval, G.; Foyer, C.H. Glutathione in plants: An integrated overview. Plant Cell Environ. 2012, 35, 454–484. [Google Scholar] [CrossRef]
- Sharma, R.; Sahoo, A.; Devendran, R.; Jain, M. Over-expression of a rice Tau Class glutathione S-transferase gene improves tolerance to salinity and oxidative stresses in Arabidopsis. PLoS ONE 2014, 9, e92900. [Google Scholar] [CrossRef] [PubMed]
- Yu, T.; Li, Y.S.; Chen, X.F.; Hu, J.; Chang, X.; Zhu, Y.G. Transgenic tobacco plants overexpressing cotton glutathione S-transferase (GST) show enhanced resistance to methyl viologen. J. Plant Physiol. 2003, 160, 1305–1311. [Google Scholar] [CrossRef] [PubMed]
- Ohkama-Ohtsu, N.; Zhao, P.; Xiang, C.; Oliver, D.J. Glutathione conjugates in the vacuole are degraded by gamma-glutamyl transpeptidase GGT3 in Arabidopsis. Plant J. 2007, 49, 878–888. [Google Scholar] [CrossRef] [PubMed]
- Pignocchi, C.; Fletcher, J.M.; Wilkinson, J.E.; Barnes, J.D.; Foyer, C.H. The function of ascorbate oxidase in tobacco. Plant Physiol. 2003, 132, 1631–1641. [Google Scholar] [CrossRef]
- Yamamoto, A.; Bhuiyan, M.N.; Waditee, R.; Tanaka, Y.; Esaka, M.; Oba, K.; Jagendorf, A.T.; Takabe, T. Suppressed expression of the apoplastic ascorbate oxidase gene increases salt tolerance in tobacco and Arabidopsis plants. J. Exp. Bot. 2005, 56, 1785–1796. [Google Scholar] [CrossRef]
- Wang, L.; Wang, Y.; Meng, X.; Meng, Q. Overexpression of tomato GDP-L-galactose phosphorylase gene enhanced tolerance of transgenic tobacco to methyl viologen-mediated oxidative stress. Plant Physiol. Commun. 2012, 48, 689–698. [Google Scholar]
- Ma, L.; Wang, Y.; Liu, W.; Liu, Z. Overexpression of an alfalfa GDP-mannose 3,5-epimerase gene enhances acid, drought and salt tolerance in transgenic Arabidopsis by increasing ascorbate accumulation. Biotechnol. Lett. 2014, 36, 2331–2341. [Google Scholar] [CrossRef]
- Yalcinkaya, T.; Uzilday, B.; Ozgur, R.; Turkan, I.; Mano, J. Lipid peroxidation-derived reactive carbonyl species (RCS): Their interaction with ROS and cellular redox during environmental stresses. Environ. Exp. Bot. 2019, 165, 139–149. [Google Scholar] [CrossRef]
- Do, T.H.T.; Martinoia, E.; Lee, Y. Functions of ABC transporters in plant growth and development. Curr. Opin. Plant Biol. 2018, 41, 32–38. [Google Scholar] [CrossRef]
- Kang, J.; Park, J.; Choi, H.; Burla, B.; Kretzschmar, T.; Lee, Y.; Martinoia, E. Plant ABC transporters. Arab. Book 2011, 9, e0153. [Google Scholar] [CrossRef]
- Curci, P.L.; Aiese Cigliano, R.; Zuluaga, D.L.; Janni, M.; Sanseverino, W.; Sonnante, G. Transcriptomic response of durum wheat to nitrogen starvation. Sci. Rep. 2017, 7, 1176. [Google Scholar] [CrossRef]
- Li, Y.; Chang, D.; Zhang, X.; Shi, H.; Yang, H. RNA-Seq, physiological, and biochemical analysis of burley tobacco response to nitrogen deficiency. Sci. Rep. 2021, 11, 16802. [Google Scholar] [CrossRef]
- Shao, C.H.; Qiu, C.F.; Qian, Y.F.; Liu, G.R. Nitrate deficiency decreased photosynthesis and oxidation-reduction processes, but increased cellular transport, lignin biosynthesis and flavonoid metabolism revealed by RNA-Seq in Oryza sativa leaves. PLoS ONE 2020, 15, e0235975. [Google Scholar] [CrossRef]
- Koltunow, A.M.; Soltys, K.; Nito, N.; McClure, S. Anther, ovule, seed, and nucellar embryo development in Citrus sinensis cv. Valencia. Can. J. Bot. 1995, 73, 1567–1582. [Google Scholar] [CrossRef]
- Gao, K.; Chen, F.; Yuan, L.; Zhang, F.; Mi, G. A comprehensive analysis of root morphological changes and nitrogen allocation in maize in response to low nitrogen stress. Plant Cell Environ. 2015, 41, 740–750. [Google Scholar] [CrossRef] [PubMed]
- Hodges, D.M.; DeLong, J.M.; Forney, C.F.; Prange, R.K. Improving the thiobarbituric acid-reactive-substances assay for estimating lipid peroxidation in plant tissues containing anthocyanin and other interfering compounds. Planta 1999, 207, 604–611. [Google Scholar] [CrossRef]
- Long, A.; Zhang, J.; Yang, L.T.; Ye, X.; Lai, N.W.; Tan, L.L.; Lin, D.; Chen, L.S. Effects of low pH on photosynthesis, related physiological parameters, and nutrient profiles of citrus. Front. Plant Sci. 2017, 8, 185. [Google Scholar] [CrossRef] [PubMed]
- Doke, N. Involvement of superoxide anion generation in the hypersensitive response of potato tuber tissues to infection with an incompatible race of Phytophthora infestans and to the hyphal wall components. Physiol. Plant Pathol. 1983, 23, 345–357. [Google Scholar] [CrossRef]
- Li, C.P.; Qi, Y.P.; Zhang, J.; Yang, L.T.; Wang, D.H.; Ye, X.; Lai, N.W.; Tan, L.L.; Lin, D.; Chen, L.S. Magnesium-deficiency-induced alterations of gas exchange, major metabolites and key enzymes differ among roots, and lower and upper leaves of Citrus sinensis seedlings. Tree Physiol. 2017, 37, 1564–1581. [Google Scholar] [CrossRef] [PubMed]


| Class | Metabolites | Upregulation | Downregulation |
|---|---|---|---|
| PMs | Containing N and P | 30 | 4 |
| Containing N but not P | 20 | 52 | |
| Containing P but not N | 8 | 0 | |
| Without P and N | 26 | 25 | |
| Total PMs | 84 | 81 | |
| SMs | Containing N and P | 1 | 0 |
| Containing N but not P | 11 | 23 | |
| Containing P but not N | 0 | 0 | |
| Without P and N | 61 | 66 | |
| Total SMs | 73 | 89 | |
| Total PMs + SMs | 157 | 170 |
| N Levels (mM) | Macronutrients (mM) | |||||||
|---|---|---|---|---|---|---|---|---|
| K2SO4 | CaCl2 | MgSO4 | KH2PO4 | Ca(NO3)2 | KNO3 | NH4Cl | (NH4)2SO4 | |
| 0 | 2.5 | 5 | 2 | 1 | 0 | 0 | 0 | 0 |
| 15 | 1.25 | 2.5 | 2 | 1 | 2.5 | 2.5 | 5 | 1.25 |
Disclaimer/Publisher’s Note: The statements, opinions and data contained in all publications are solely those of the individual author(s) and contributor(s) and not of MDPI and/or the editor(s). MDPI and/or the editor(s) disclaim responsibility for any injury to people or property resulting from any ideas, methods, instructions or products referred to in the content. |
© 2023 by the authors. Licensee MDPI, Basel, Switzerland. This article is an open access article distributed under the terms and conditions of the Creative Commons Attribution (CC BY) license (https://creativecommons.org/licenses/by/4.0/).
Share and Cite
Lai, Y.-H.; Peng, M.-Y.; Rao, R.-Y.; Chen, W.-S.; Huang, W.-T.; Ye, X.; Yang, L.-T.; Chen, L.-S. An Integrated Analysis of Metabolome, Transcriptome, and Physiology Revealed the Molecular and Physiological Response of Citrus sinensis Roots to Prolonged Nitrogen Deficiency. Plants 2023, 12, 2680. https://doi.org/10.3390/plants12142680
Lai Y-H, Peng M-Y, Rao R-Y, Chen W-S, Huang W-T, Ye X, Yang L-T, Chen L-S. An Integrated Analysis of Metabolome, Transcriptome, and Physiology Revealed the Molecular and Physiological Response of Citrus sinensis Roots to Prolonged Nitrogen Deficiency. Plants. 2023; 12(14):2680. https://doi.org/10.3390/plants12142680
Chicago/Turabian StyleLai, Yin-Hua, Ming-Yi Peng, Rong-Yu Rao, Wen-Shu Chen, Wei-Tao Huang, Xin Ye, Lin-Tong Yang, and Li-Song Chen. 2023. "An Integrated Analysis of Metabolome, Transcriptome, and Physiology Revealed the Molecular and Physiological Response of Citrus sinensis Roots to Prolonged Nitrogen Deficiency" Plants 12, no. 14: 2680. https://doi.org/10.3390/plants12142680
APA StyleLai, Y.-H., Peng, M.-Y., Rao, R.-Y., Chen, W.-S., Huang, W.-T., Ye, X., Yang, L.-T., & Chen, L.-S. (2023). An Integrated Analysis of Metabolome, Transcriptome, and Physiology Revealed the Molecular and Physiological Response of Citrus sinensis Roots to Prolonged Nitrogen Deficiency. Plants, 12(14), 2680. https://doi.org/10.3390/plants12142680