Article

Diversity Temporal–Spatial Dynamics of Potato Rhizosphere Ciliates and Contribution to Nitrogen- and Carbon-Derived Nutrition in North-East China

1
Key Laboratory of Biodiversity of Aquatic Organisms, Harbin Normal University, Harbin 150025, China
2
State Key Laboratory of Urban Water Resource and Environment, School of Civil and Environmental Engineering, Harbin Institute of Technology (Shenzhen), Shenzhen 518055, China
3
Crop Academy, Heilongjiang University, Harbin 150080, China
*
Authors to whom correspondence should be addressed.
These authors contributed equally to this work.
Plants 2023, 12(12), 2260; https://doi.org/10.3390/plants12122260
Submission received: 7 May 2023 / Revised: 5 June 2023 / Accepted: 5 June 2023 / Published: 9 June 2023
(This article belongs to the Special Issue Water and Nitrogen Management in Soil-Crop System II)

Abstract

:
Ciliates are an important component of the rhizosphere microorganism community, but their nutritional contribution to plants has not been fully revealed. In this paper, we investigated the rhizosphere ciliate community of potatoes during six growth stages, illustrated the spatial–temporal dynamics of composition and diversity, and analyzed the correlation between soil physicochemical properties. The contributions of ciliates to the carbon- and nitrogen-derived nutrition of potatoes were calculated. Fifteen species of ciliates were identified, with higher diversity in the top soil, which increased as the potatoes grew, while they were more abundant in the deep soil, and the number decreased as the potatoes grew. The highest number of species of ciliates appeared in July (seedling stage). Among the five core species of ciliates, Colpoda sp. was the dominant species in all six growth stages. Multiple physicochemical properties affected the rhizosphere ciliate community, with ammonium nitrogen (NH4+-N) and the soil water content (SWC) greatly influencing ciliate abundance. The key correlation factors of ciliates diversity were NH4+-N, available phosphorus (AP), and soil organic matter (SOM). The annual average contribution rates of carbon and nitrogen by rhizosphere ciliates to potatoes were 30.57% and 23.31%, respectively, with the highest C/N contribution rates reaching 94.36% and 72.29% in the seedling stage. This study established a method for estimating the contributions of carbon and nitrogen by ciliates to crops and found that ciliates could be potential organic fertilizer organisms. These results might be used to improve water and nitrogen management in potato cultivation and promote ecological agriculture.

1. Introduction

The plant rhizosphere drives biological, chemical, and physical processes in soil to form an underground soil food web [1]. Plant and microorganisms constitute a relatively independent rhizosphere (a micro-ecological system) that impacts the decomposition and transformation of effective nutrients, the accumulation and stability of soil organic carbon, root morphology and physiology, nutrient absorption capacity, and multi-nutrient relationships in the aboveground parts of plants [2]. Meanwhile, plant growth and development affect the activity and community structure of the rhizosphere microbiota [3,4].
The protozoa are one of components of the rhizosphere micro-community, which can regulate microbial activity [5,6] and accelerate the circulation and transformation of organic matter as they have a higher evolutionary status in the food chain than bacteria and trophic-level microbiota [7]. The dynamics of protozoa are also correlated with plant growth and development [6,8,9]. Ciliates are considered to be the most complex and highly differentiated protozoa, characterized by a short generation time, rapid reproduction, and multiple nutritional types. They are widely distributed in soil and interact with bacteria, fungi, and other protists to form complex micro-food webs [10], playing a crucial role in the energy flow and material circulation in the soil ecosystem [10]. Recently, the importance of rhizosphere ciliates in soil carbon and nitrogen sources was explored in sugar beet [11], but more work needs to be carried out on other plants. The species, spatial and temporal distribution, ecological function, and mechanism of soil ciliates are key issues in the micro-ecological system. Potatoes (Solanum tuberosum L.) are the world’s fourth-largest food crop after rice, maize, and wheat, and it is a staple in the human diet in many places around the world. Some researchers have explored the key microorganisms of the potato rhizosphere, focusing on harmful pathogenic groups and the nutritional availability of inoculation groups [12]. In addition, the microbe–fertilizer–crop relationship was revealed by comparing the composition and structure of the potato rhizosphere microbial community and the potato growth state under different fertilization treatment conditions [13,14]. The authors of the studies suggested that bacteria can facilitate the conversion of organic matter into forms that are usable by plant roots, and fungi can break down complex organic compounds to release nitrogen and other essential nutrients [15,16,17,18]. However, the release of carbon and nitrogen via ciliate activity in potato production systems has not been well understood, and their interactions with other biotic and abiotic factors remain undisclosed.
In this paper, we studied the temporal–spatial features of potato rhizosphere ciliate communities across four soil layers and six growth stages in north-east China. The contribution of ciliates to the carbon- and nitrogen-derived nutrition of potatoes in every growth stage was estimated using a series of equations. The potential ability of ciliates in organic fertilizer and water and nitrogen management in potato cultivation were discussed.

2. Results

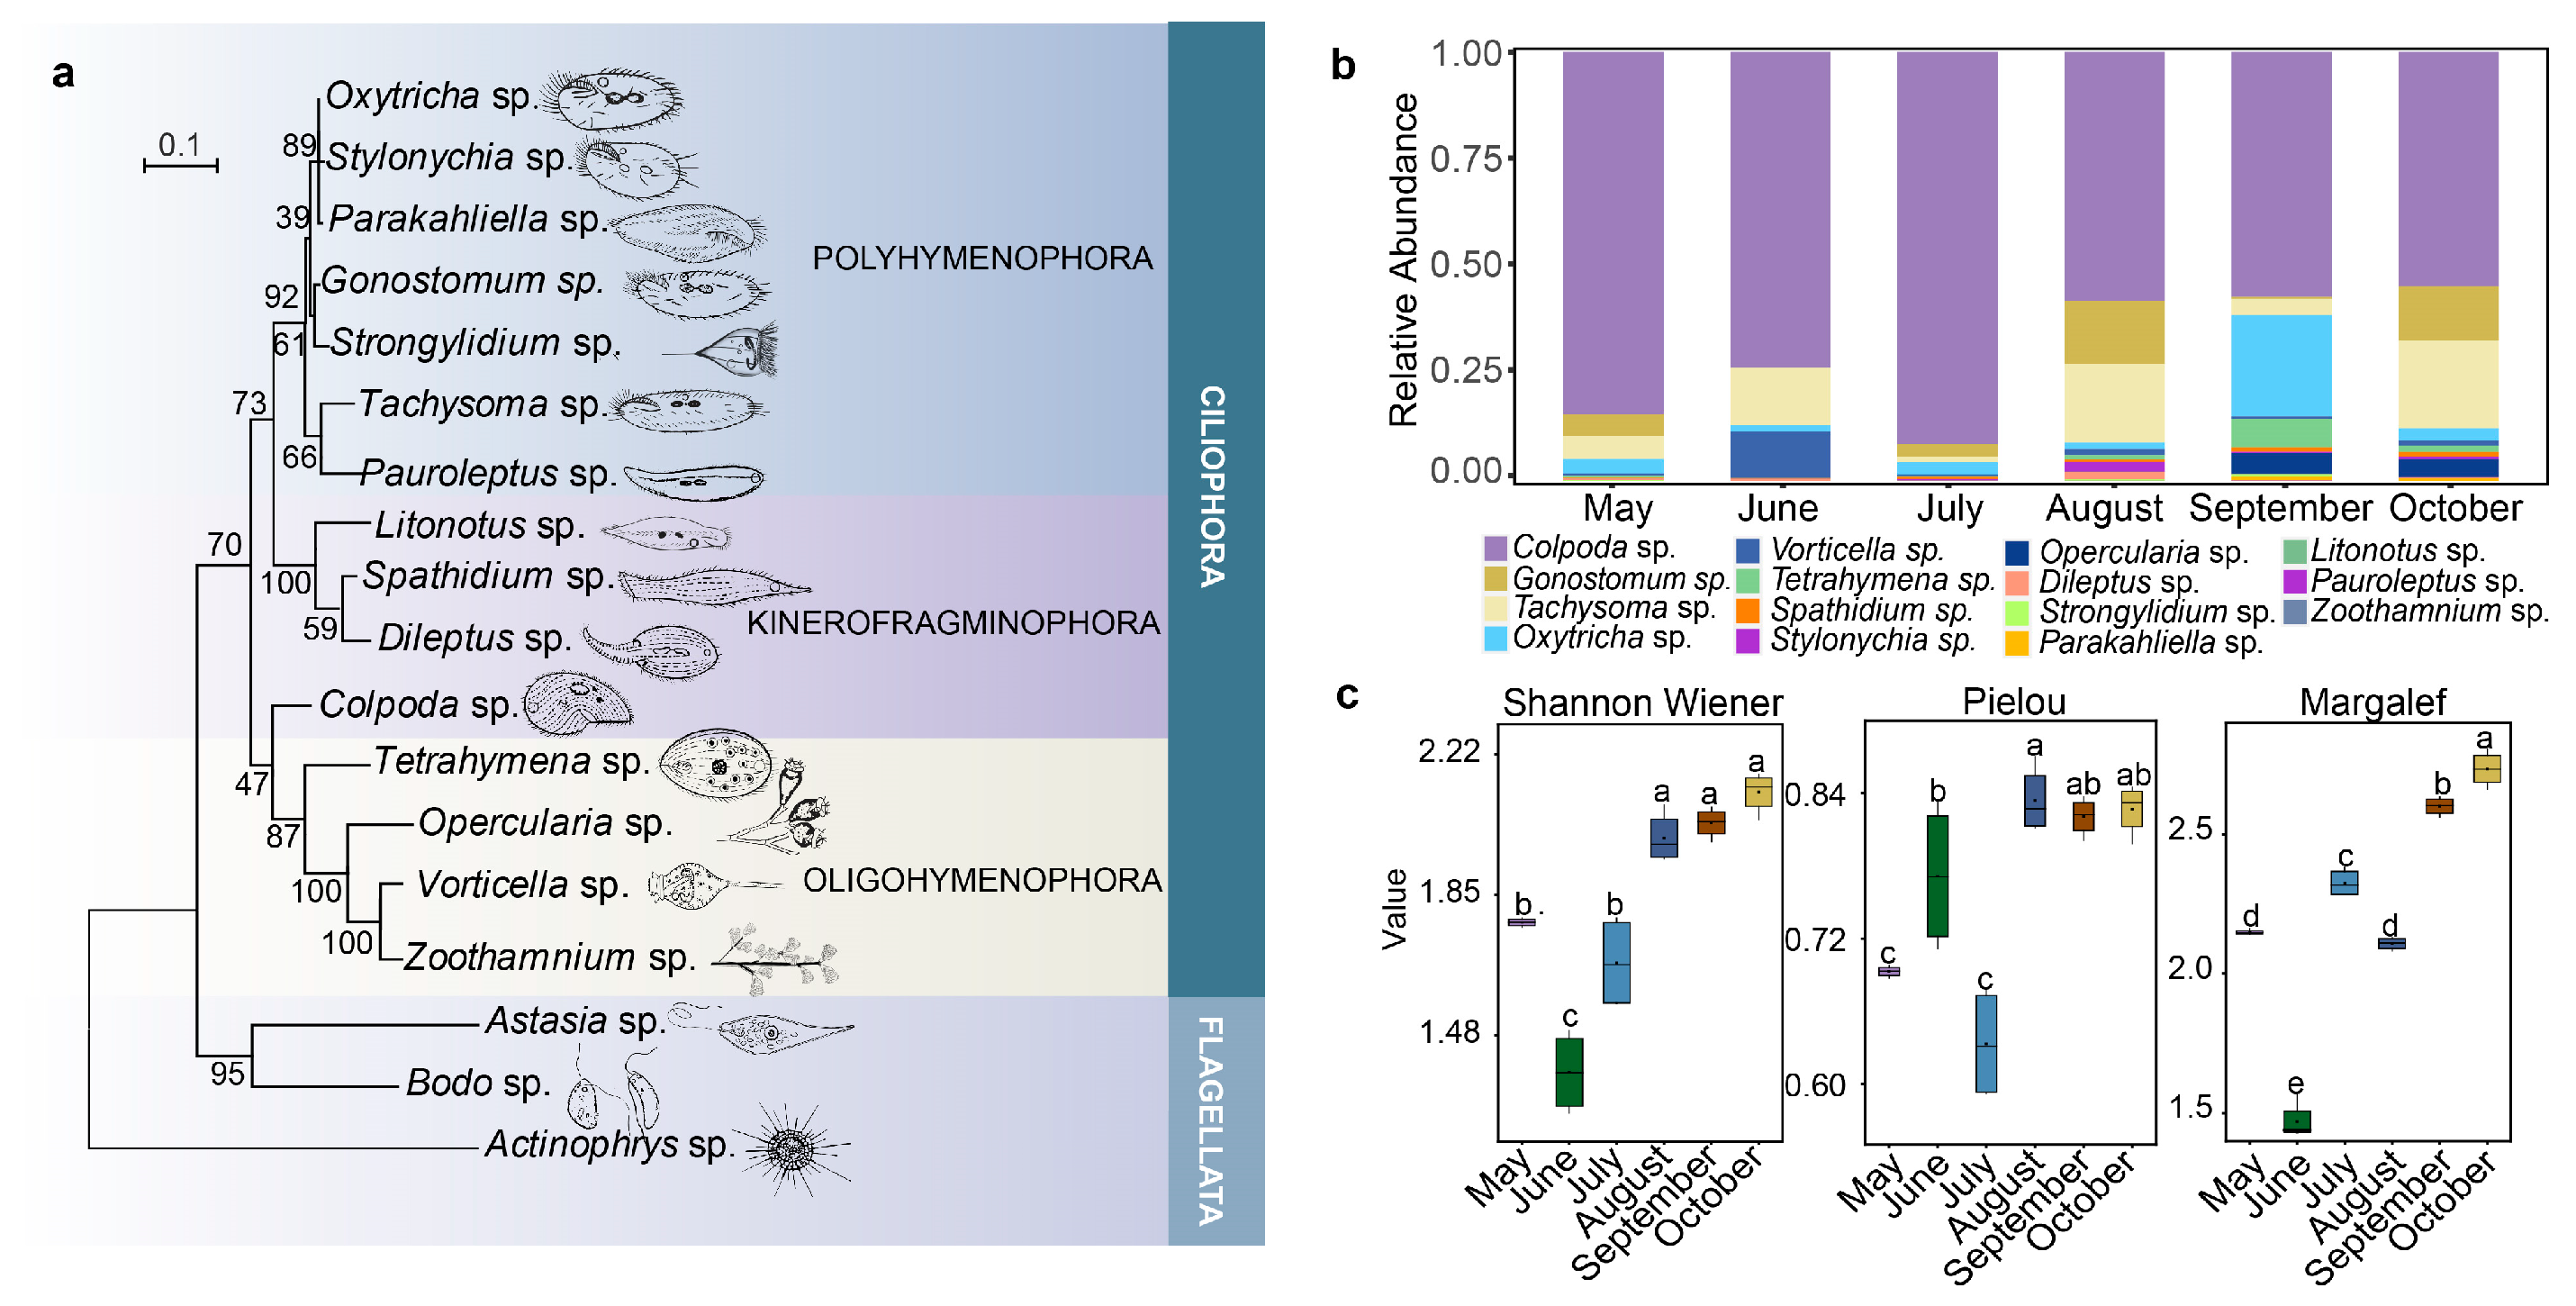
2.1. Composition and Diversity of Ciliates Community

The protozoa taxa of the potato rhizosphere were identified using the non-flooded Petri dish method and morphological identification (Figure A3). There were fifteen species of ciliates and three flagellate species (Figure 1a). The 15 ciliates species clustered into three branches with high confidence: Polyhymenophora (7 species), Kinerofragminophora (4 species), and Oligohymenophora (4 species). The abundance of ciliates showed a diminishing trend from May to October, but an exceptional increase appeared at the seedling stage (July) (Table A1). The relative abundance (Figure 1b) and cumulative contribution (Table A2) showed that Colpoda sp. was the most abundant species at every stage.
The temporal dynamics of three diversity indices showed that ciliates’ diversity generally increased as the potatoes grew (except in May, the pre-planting stage), while the Pielou evenness index in July (seedling stage) and the Margalef species richness index in August (rooting stage) fell abnormally (Figure 1c).

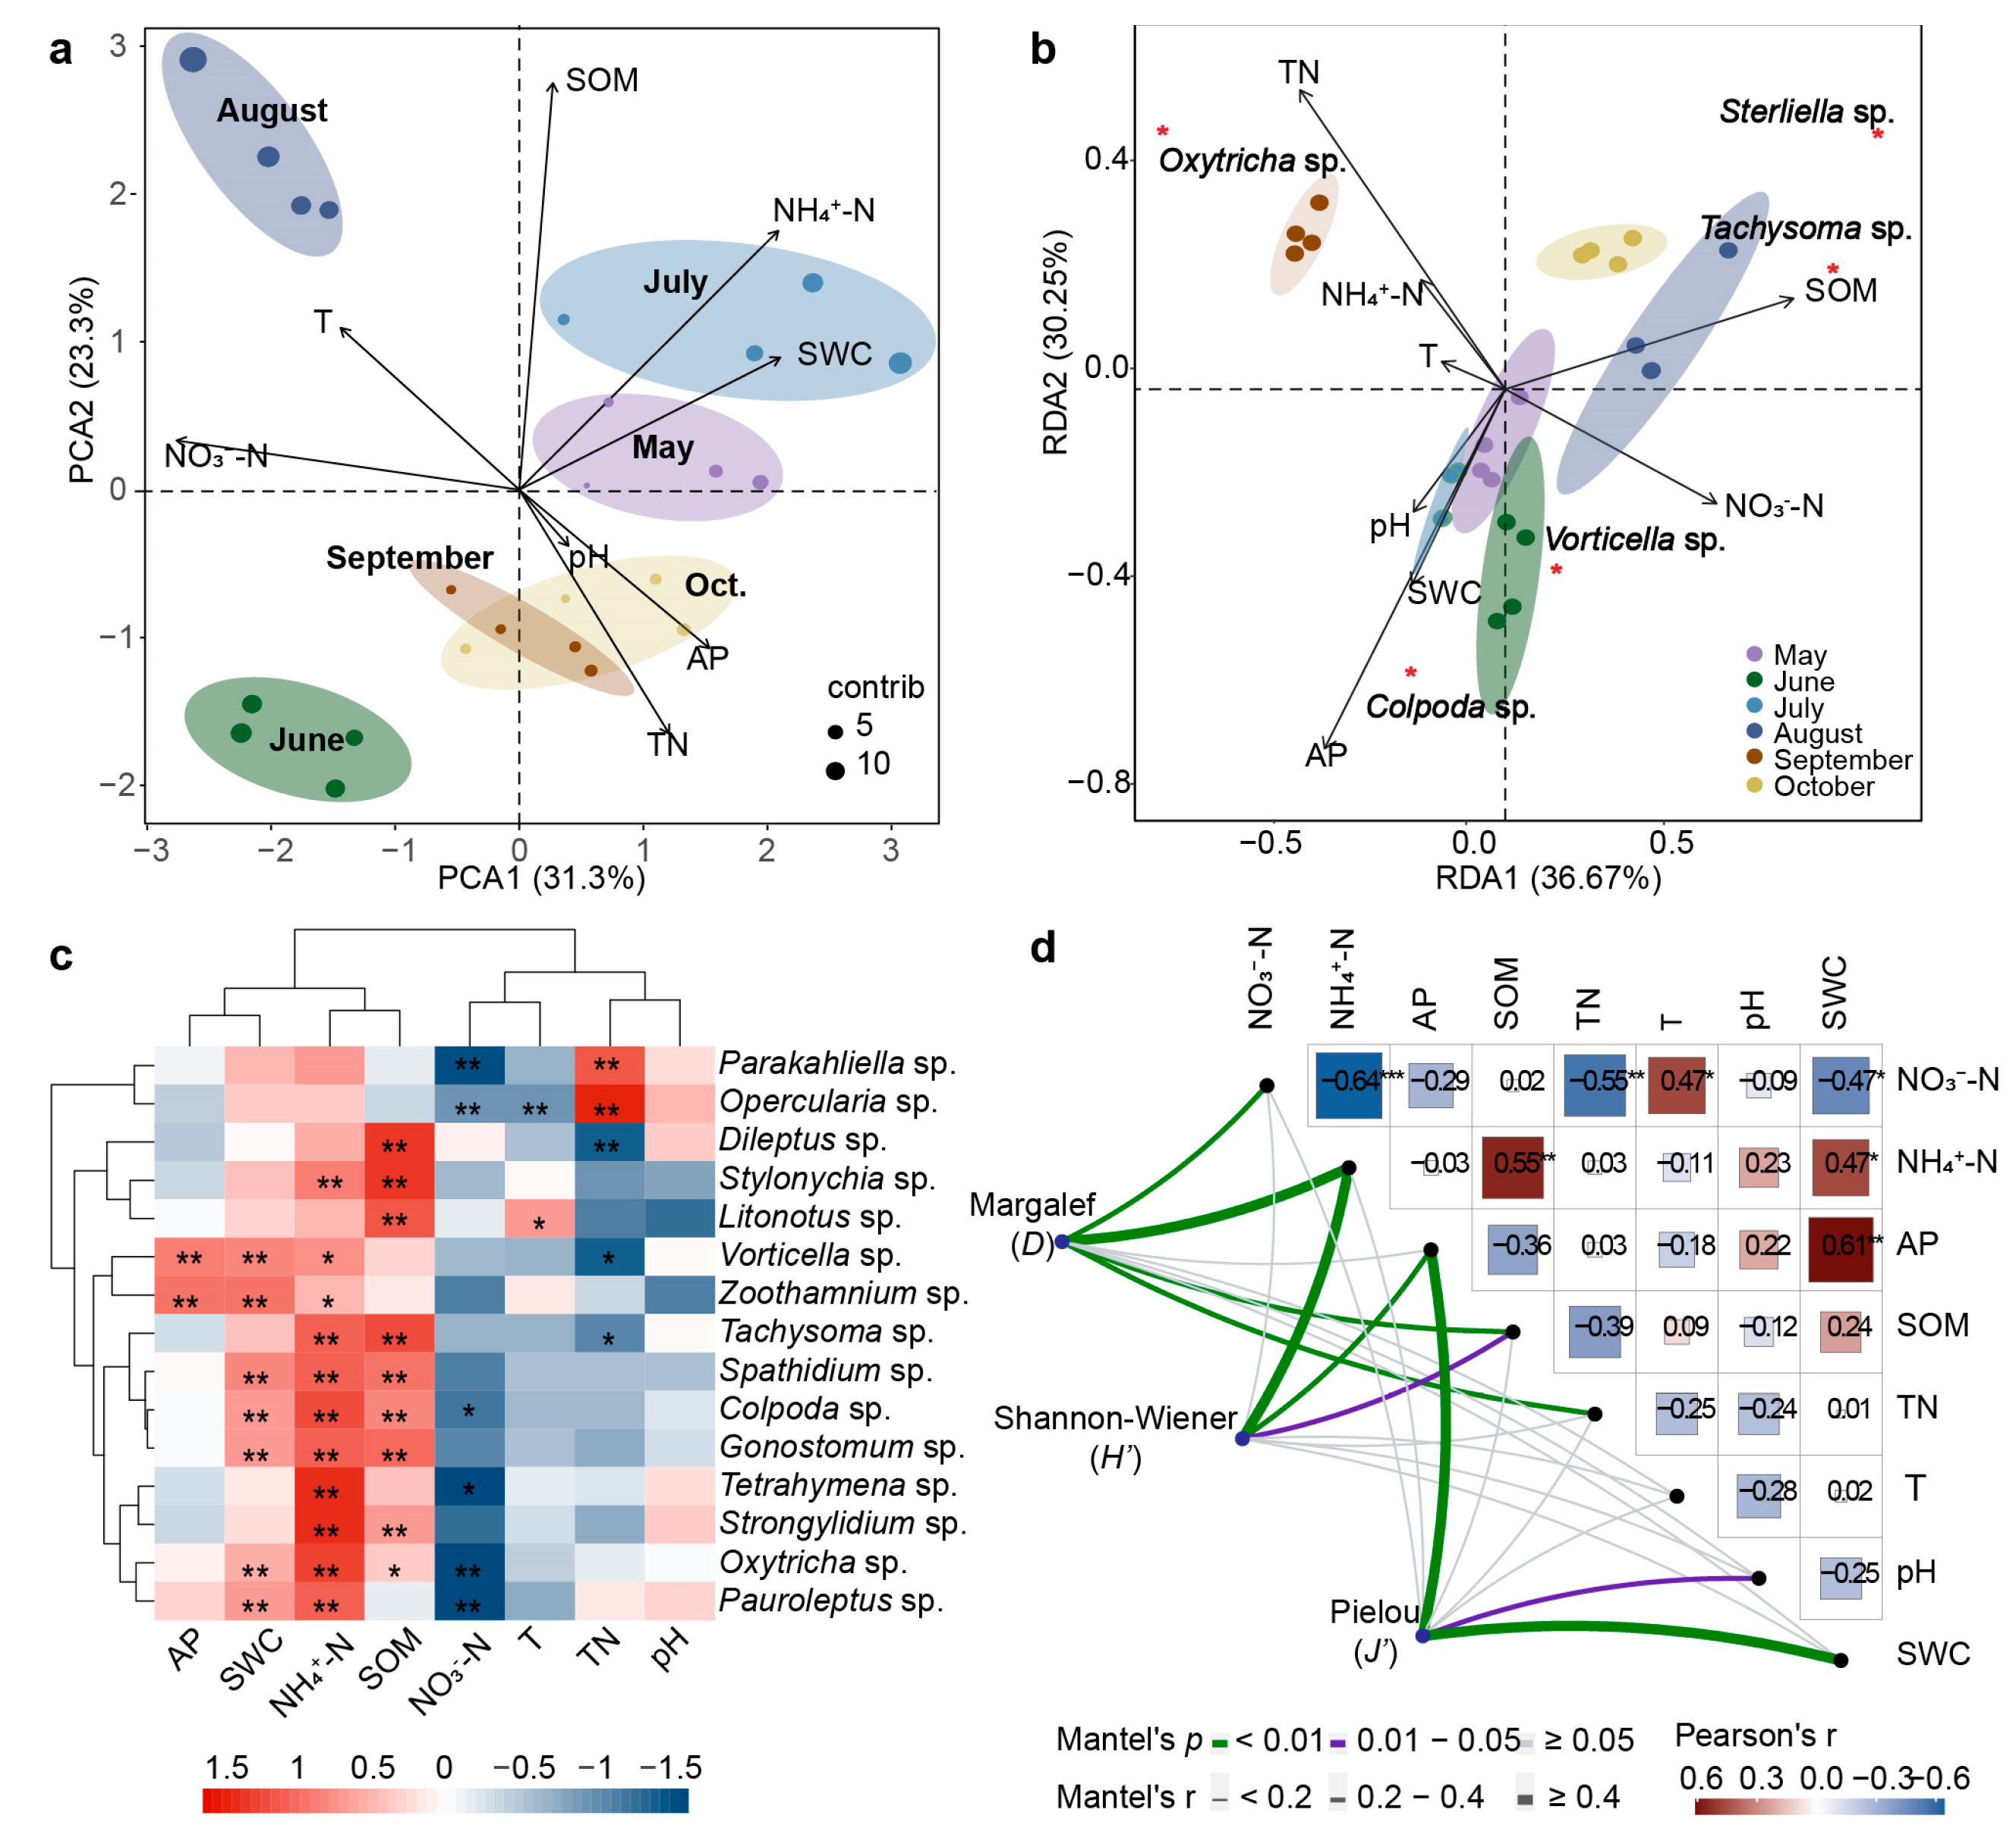
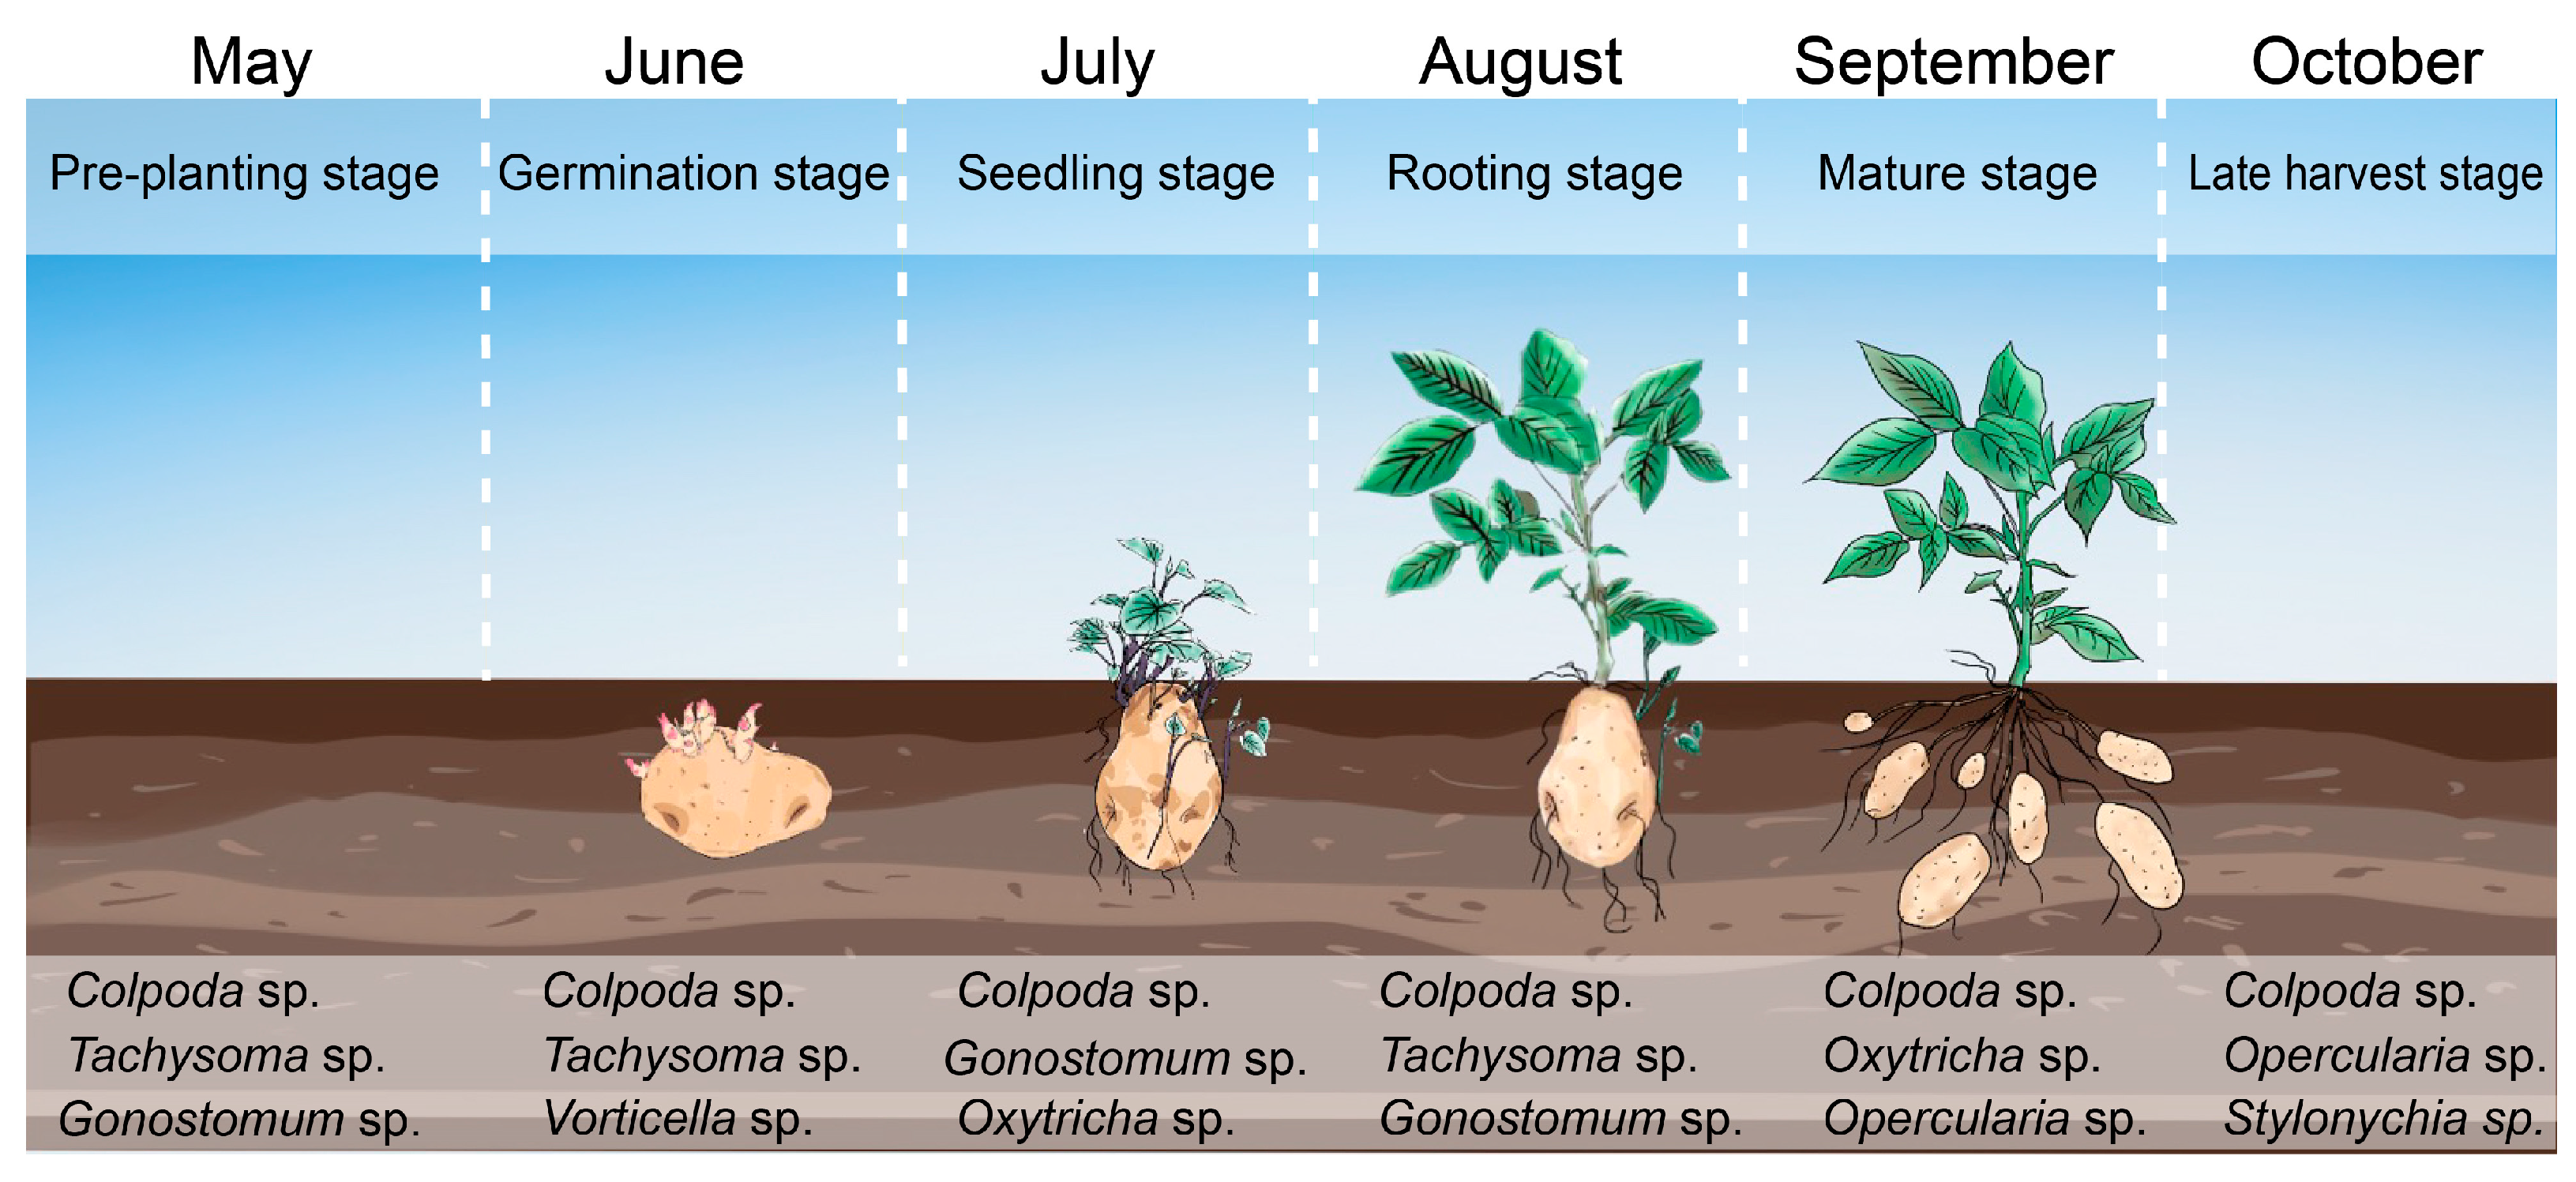
2.2. Spatial–Temporal Dynamics of Ciliates

The abundance and occurrence frequency of the 15 ciliates over six months were differentiated into four clusters (I–IV) (Figure 2a). Six species in cluster IV showed the highest abundance value in May and July and the lowest abundance value in June. Four species in cluster I had higher abundance and occurrence frequencies in July. Cluster III contained three ciliates with the highest abundance value in May and July. Cluster II contained only two species with the highest abundance value in May, September, and October. According to the temporal characteristics of species and abundance, May and July were similar, while June and August were similar, and September was similar to October (Figure 2a).
During the growth stage of the potatoes, the diversity of ciliates in different soil layers was not significantly different. On the whole, the ciliate diversity of the top layer (0–10 cm) was always higher than that of the deep layer (10–20 cm) (Table A3), while the abundance of ciliates showed a continuous increase with the soil layer depth (Figure 2a).
Differences in ciliate community composition in the six growth stages were analyzed via NMDS (stress = 0.0081) (Figure 2b). The results showed that the ciliate communities in May and July were more similar, while those of June, August, and October were also similar. September was very different from other months. The number of ciliate species in different month was significantly different, with 14 species in July, but only 6 species in June. The spatial heterogeneity of ciliates in the four soil layers was not significant every month. There were five core ciliates that appeared every month and in every layer, including Colpoda sp., Tachysoma sp., Oxytricha sp., Gonostomum sp., and Vorticella sp. (Figure 2c).

2.3. Correlation Analysis of Physicochemical Factors and Ciliate Community

Soil environmental factors have important effects on the rhizosphere microbial community. Eight soil physicochemical properties were analyzed to find out the key environmental factors for the potato rhizosphere ciliate community. The temperature decreased with the deepening of the layer soil and varied significantly during the seasons, with a range of 9–23 °C (Figure A2a). The variation in pH was insignificant, with a range of 6.08–7.55 (Figure A2c). The soil water content (SWC), except for the sudden increase due to rainfall in July, was relatively stable, ranging from 3.1 to 8.4%, and it gradually increased with increasing depth (Figure A2b). The concentrations of ammonium nitrogen (NH4+-N) and total nitrogen (TN) in September and October were higher than those in other months, but nitrate nitrogen (NO3-N) showed the opposite trend (Figure A2f–h). The content of the soil organic matter (SOM) at the pre-planting stage was significantly higher than those at the other stages, owing to the application of organic fertilizer, while it decreased suddenly in July, which was attributable to the increase in precipitation (Figure A2e). The content of available phosphorus (AP) was slightly higher in May–July than it was in August–October, without significant differences between the different layers (Figure A2d).
The first two axes of the PCA plot account for 54.6% of the total variance in the dataset (Figure 3a). SOM, NH4+-N, and SWC were the top environmental factors at the pre-planting stage (May) and seedling stage (July). T and NO3-N were the main environmental factors at the rooting stage (August), but pH, AP, and TN were key environmental factors at the mature stage (September) and late harvest stage (October). BIOENV analysis (Table A4) also indicated that multiple physicochemical properties can affect ciliate abundance via jointed interactions. According to the R value raking, the NH4+-N, SOM, TN, and pH combination had the highest correlation with the ciliate community. It was also notable that NH4+-N was the only variable included in all correlations.
The RDA plot (Figure 3b) shows the relationship between ciliate abundance and physicochemical factors in the six growth stages of potatoes. The model accounts for 66.92% of the total variation. The first ordination RDA axis explains 36.67% of the total variability in ciliate abundance, while the second ordination RDA axis explains 30.25%. The RDA plot also shows that the ciliate abundances at the same stage are clustered together, indicating a strong correlation between the potato growth stage and ciliate abundance. It should be noted that five core species were correlated with different environmental factors. Colpoda sp. and Vorticella sp. are correlated with pH, SWC, NO3-N, and AP in May, June, and July, while Terahymena sp. and Gonostomum sp. are related to the variables SOM in September. Oxytricha sp. is related to T, NH4+-N, and TN in September. The Spearman correlation analysis also (Figure 3c) showed that NH4+-N and SWC greatly influenced the abundance of ciliates, followed by SOM, NO3-N and TN, while AP had the smallest influence. Colpoda sp. and Oxytricha sp. are significantly positively correlated with NH4+-N, SWC, and SOM and are mainly negatively regulated by NO3-N. Tachysoma sp. is positively correlated with SOM and NH4+-N, while it is negatively correlated with TN. Gonostomum sp. is significantly positively correlated with SWC, SOM, and NH4+-N. Vorticella sp. negatively regulates the soil TN, but positively regulates AP, SWC, and NH4+-N. Among the physicochemical properties affecting the abundance of non-dominant ciliate, soil SOM and NH4+-N are still the most influential properties, followed by NO3-N, TN, and SWC. Mantel’s tests indicated that NH4+-N, AP, and SOM are the factors that are most strongly correlated with three diversity indices, and NO3-N, TN, pH, and SWC are the factors that moderately affect the three diversity indices. Temperature is not a key factor affecting the three biodiversity indices (Figure 3d).

3. Discussion

3.1. Contribution of Rhizosphere Ciliates on Potato Growth

Carbon- and nitrogen-derived nutrition plays a crucial role in both vegetative and reproductive growth [19,20,21]. The contribution of rhizosphere microbial communities, especially bacteria and fungi, to carbon- and nitrogen-derived nutrition has been disclosed in many plants [17,22,23]. Researchers should be pay more attention to ciliate contributions to the carbon and nitrogen cycles, as they are essential components of the soil micro-food web and regulators of functional microorganisms that enhance C and N uptake and promote plant growth and soil structure formation [5]. Ciliate grazing can improve the carbon utilization efficiency of bacteria from 0.51 to 0.62 [24], and the rate of soil N mineralization (×1.8 in absence of plants) is doubled due to the activity of ciliates [25]. However, before now, an effective method to directly estimate the carbon and nitrogen contribution of ciliates was lacking. The authors of this study established a method for estimating the contribution of carbon and nitrogen by ciliates to crops based on the mechanism of grazing bacteria [25,26]. The results proved the great contribution of ciliates in competing for carbon and nitrogen sources during potato growth. Especially, the seedling stage (July) is a key stage, with the highest C/N contribution rates of 94.36% and 72.29% (Table 1). The corresponding estimated mean value for N released due to bacteria grazing activity was 10.07 g. The approximated quantity of N released due to ciliates activities was 0.1 g per potato (Table 1). This quantity is about 30.30% of the amount of nitrogen that is artificially applied (0.33 g). Ciliates not only contain amounts of carbon and nitrogen, but also phosphorus and other essential elements [27]. They are abundant, cost-efficient, environmentally friendly, and sustainable [28]. These findings prove that ciliates are good candidates for green organic fertilizers. In practice, we need to consider ciliate diversity, special plant–soil conditions, and the interaction between microorganisms. An effective direct estimation method for determining the precise carbon and nitrogen contributions of ciliates still requires further elucidation.

3.2. Driving Factors of Potato Rhizosphere Ciliate Community

The composition and structure of ciliate communities are crucial for their ecological functions [29], which are influenced by various factors, including plants [28], soil properties [30], climate factors [31], and microorganism interactions [32]. In this study, the dominant species of ciliate community showed a succession process driven by potato growth (Figure A1). This may be related to changes in the root exudate, which attract different beneficial ciliates to colonize the rhizosphere to enhance nutrient cycling and soil structure formation [32]. Among these dominant ciliates, Colpoda sp. remained continuously dominant at all growth stages. It suggests that Colpoda sp. might be a core ciliate for the potato rhizosphere microorganism community.
On the other hand, physicochemical factors clearly have an influence on the ciliate community. The authors of studies have found that ciliate communities are more sensitive to nitrogen than other microorganisms in diverse agricultural soils are [4,30]. Our results proved that Colpoda sp. and most ciliates are significantly and positively correlated with NH4+-N, SOM, and SWC. Colpoda sp. and Oxytricha sp. are negatively correlated with changes in NO3-N. The species and number of ciliates were highest at the seedling stage (July), which is attributed to the highest SWC (Figure A2b). This suggested that SWC and nitrogen should be the environmental drivers of the ciliate community. They should be considered in farm management and potato cultivation.
Accurate identification and classification are pivotal to studying the diversity of ciliates [33]. Molecular techniques, such as PCR amplification and the sequencing of specific genetic markers, such as the 18S rRNA gene, have been employed to achieve the more precise and reliable identification of ciliate species. Based on high-throughput sequencing and the 18S rRNA gene, it has been revealed that the quantity and role of ciliates in promoting material circulation in soil were underestimated, and many more potential ciliate species remained uncultured or unidentified [1,34]. The more accurate and efficient identification of ciliate species would lead to a deeper and fuller understanding of the nutritional contributions of ciliates [35].

4. Materials and Methods

4.1. Sample Collection and Species Identification

All samples were obtained from a monoculture field of potatoes located in Heilongjiang Province (China N 45°59′38″, E 126°37′57″). The annual amount of precipitation in this area is 400–800 mm, and the annual average temperature is 0–10 °C. One month before sowing (May), the amount of fertilizer used was about 40–50 kg per acre. The ratio of diamine, potassium sulfate, and urea was 2:2:1, and the nitrogen contents of diamine and urea were 18% and 46%.
Soil samples were collected based on the farming stages of the potatoes: the pre-planting stage (May), germination stage (June), seedling stage (July), rooting stage (August), mature stage (September), and late harvest stage (October) [36]. At each sampling stage, 2 kg of rhizosphere soil was sampled from area 3 cm away from the plants at one of the four depths from top (0–5 cm, 5–10 cm, 10–15 cm, and 15–20 cm) using the five-point sampling method [37].
The non-flooded Petri dish method [38] was performed in Petri dishes at room temperature. The suspension was observed under a microscope from the 1st to the 15th days of culturing, and the observed protozoa were identified via in vivo observation. The protargol method was used to identify the group of protozoa [39]. Silver carbonate [40,41] and Chatton–Lwoff silver nitrate stains [42] were also used to classify and identify certain kinds of protozoa, respectively.

4.2. Physicochemical Soil Analyses

Bulk soil was obtained at the same sampling location at four soil layers, which correspond to the protozoa samples. The physicochemical properties included the soil water content (SWC), concentrations of soil organic matters (SOM), total nitrogen (TN), available phosphorus (A-P), ammonium nitrogen (NH4+-N), nitrate nitrogen (NO3-N), soil pH, and temperature (T). All these parameters were detected according to the Chinese National Standard (GB 15618-1995).

4.3. Estimation of Carbon and Nitrogen Contribution Rates

We used the following parameters for calculations: soil density—1.3 g/cm3; bacteria biovolume—0.65 μm3 [43]; each cm3 of bacterial biovolume had 0.22 g C [44]; bacterial grazing rate by ciliates was 523 ind./h respectively [45]; the rhizosphere for potatoes covered a 30 × 60 cm2 projection area. According to the abundance and cell size of ciliates, over six months (Table A1), the carbon and nitrogen flows per planted potato had a 30 × 60 × 15 cm3 projection area. We also used C/N ratios for typical bacteria and ciliate of 5.2:1 and 6.8:1, respectively [45], and assuming 100% carbon catabolism, the fixation of 1 g of C to protozoa cells released 0.045 g N to the soil. The weight increases between the germination stage, seedling stage, rooting stage, and mature stage were 40 g, 480 g, 550 g, and 200 g, respectively. The carbon contents used in the planted potatoes were 40% of the weight, and the nitrogen contents used were 10% of those of carbon contents.
We calculated the carbon and nitrogen flows of ciliates according to Equation (1).
C a r b o n o r   N i t r o g e n f l o w = I n g e s t i o n E g e s t i o n R e s p i r a t i o n
where ingestion is the total amount of carbon (or nitrogen) that ciliates feed on bacteria from outside; egestion is the amount of unassimilated carbon (or nitrogen) by ciliates; respiration is the amount of carbon (or nitrogen) metabolized by ciliates during respiration.
The calculated the ciliate biomass using Equation (2).
B i o m a s s = 444.5 p g   C + ( V μ m 3 × 0.053 p g   C )
Ciliate body volume (V) was computed via measuring the linear dimensions of body parts under a microscope, followed by best geometric approximation [46]. These V data were converted into carbon (C) or nitrogen (N) using conversion factors: 1 μm3 V = 0.071 pg C = 0.0185 pg N for respiration data and 1 pg WM = 0.20 pg DM for egestion data [47].
The contribution rate was calculated using Equation (3).
C o n t r i b u t i o n   r a t e = F c F p × 100 %
where Fc is the carbon (or nitrogen) flow of ciliates, and Fp is the carbon (or nitrogen) flow of potatoes.

4.4. Statistics Analysis

In this study, excel was used to sort out and summarize the original data. The contributions of ciliates to three biodiversity indices and BIO-ENV analysis were calculated using PRIMER 7.0 multivariate analysis software. Origin 2021 was used to draw the variation pattern of environmental factors, the accumulation histogram of ciliate abundance, and the box plot of the ciliate diversity index. The community diversity indices included the Shannon–Wiener index (H′), Pielou evenness index (J), and Margalef species richness index (d) [48].
The correlation heat map between ciliate abundance and physicochemical properties was drawn using R language’s (version 3.3.1) built-in ‘pheatmap’ package. Pairwise comparisons of physicochemical properties are shown with a color gradient denoting Spearman’s correlation coefficients. Community diversity was related to each environmental factor identified using Mantel tests. Edge width corresponds to Mantel’s r statistic for the corresponding distance correlations, and edge color denotes the statistical significance based on 9999 permutations [43]. Mantel test, Principal Component Analysis (PCA), Non-metric Multidimensional Scaling (NMDS), and Redundancy analysis (RDA) were performed using Tutools platform (https://www.cloudtutu.com) (accessed on 3 March 2023).

5. Conclusions

The authors of the current study, for the first time, revealed the spatial–temporal distributions of ciliates in the potato rhizosphere. The diversity of ciliates was higher in the top soil and increased as the potatoes grew, but they were more abundant in the deep soil, and the number decreased as the potatoes grew. The highest species numbers and the most abundant rhizosphere ciliates appeared in July (seedling stage). According to the abundance during the six growth stages, five species were selected as core species, and Colpoda sp. was the dominant species at all growth stages. NH4+-N, NO3N, and SWC greatly influenced the abundance of ciliates. This study established a method for estimating the contribution of carbon and nitrogen by ciliates to crops. The average contribution rates were 30.57% for carbon and 23.31% for nitrogen. The highest C/N contribution rates reached 94.36% and 72.29%, respectively, at the seedling stage. These results suggest that ciliates should be good candidates organisms for organic fertilizers. These new discoveries should be considered in farm management and potato cultivation.

Author Contributions

Conceptualization, Y.C., W.Z. and N.R.; methodology, Y.C., W.Z., C.G., Q.W., Y.W. and S.L.; software, W.Z., C.G. and X.Z.; validation, W.Z., X.Z., Y.W., S.L. and X.W.; formal analysis, W.Z., X.Z., Y.C., Y.W. and S.L.; investigation, W.Z., X.W., Y.W., S.L. and J.C.; resources, Y.C., N.R., Q.W. and W.Z.; data curation, W.Z., X.Z. and C.G.; writing—original draft preparation, W.Z., X.Z. and Y.C.; writing—review and editing, Y.C., W.Z., X.Z. and C.G.; visualization, W.Z., X.Z. and C.G.; supervision, Y.C. and N.R.; project administration, Y.C., N.R. and W.Z.; funding acquisition, Y.C., N.R. and W.Z. All authors have read and agreed to the published version of the manuscript.

Funding

This study was funded by the project of NSFC (52230004), the Shenzhen Science and Technology Program (Grant No. KQTD20190929172630447), Harbin Normal University doctor innovation (HSDBSCX2022-05) and the open Project of State Key Laboratory of Urban Water Resource and Environment, Harbin Institute of Technology (No. ES201801).

Data Availability Statement

All data are presented in the article.

Acknowledgments

Our gratitude is dedicated to Associate Xu-Ming Pan and Li Wang (Key Laboratory of Biodiversity of Aquatic Organisms, Harbin Normal University, China) for supporting in ciliates species identification experiments. Ming-lei Du (Key Laboratory of Biodiversity of Aquatic Organisms, Harbin Normal University, China) are acknowledged for sampling and pre-treatment.

Conflicts of Interest

The authors declare no conflict of interest.

Appendix A

Figure A1. The dominant ciliate species at different stages.
Plants 12 02260 g0a1
Figure A2. Physiochemical properties of soil from May to October: (a) temperature (T), (b) soil water content (SWC), (c) pH, (d) available phosphorus (AP), (e) soil organic matte (SOM), (f) ammonium nitrogen (NH4+-N), (g) nitrate nitrogen (NO3-N), and (h) total nitrogen (TN).
Plants 12 02260 g0a2
Figure A3. Photomicrographs of some rhizosphere protozoa. (A) Colpoda sp., (B) Vorticella sp., (C) Pauroleptus sp., (D) Stylonychia sp., (E) Litonotus sp., (F) Gonostomum sp., (G,N) Oxytricha sp., (H) Parakahliella sp., (I) Strongylidium sp., (J) Zoothamnium sp., (K) Actinophrys sp., (L) Tachysoma sp., (M) Astasia sp., and (O) Opercularia sp. Scale bars = 20 μm.
Plants 12 02260 g0a3
Table A1. Ciliates abundance, biomass, and body size during six growth stages of potatoes.
SpeciesCiliate Abundance (ind./g)Body Length
(μm)
Body Width
(μm)
Volume
(×104 μm3)
Biomass
(×10−9 g/ind.)
MayJuneJulyAugustSeptemberOctober
Colpoda sp.66,000.00891.0090,500.005600.001925.002340.0081.4661.316.403.84
Tachysoma sp.4200.00160.001250.001760.00127.00880.00120.0048.468.925.17
Oxytricha sp.2600.0017.902860.00150.00800.00120.0089.0838.855.143.17
Gonostomum sp.4000.000.002940.001410.0011.90540.0085.1541.545.043.12
Vorticella sp.422.60131.00272.00127.0018.0050.0072.4626.003.052.06
Spathidium sp.75.002.90520.0055.0033.5047.0079.9230.003.802.46
Dileptus sp.194.005.9011.90180.000.009.2082.1532.154.102.62
Stylonychia sp.47.000.00281.00216.908.3024.00112.7751.158.444.92
Pauroleptus sp.25.000.0016.000.006.402.5068.9233.313.282.18
Parakahliella sp.25.000.0013.500.0027.0021.0078.0033.383.902.51
Tetrahymena sp.370.000.00242.0098.00224.0064.0046.0017.621.271.12
Strongylidium sp.157.000.0032.5020.0018.004.90142.8559.7712.907.28
Opercularia sp.101.000.000.000.00170.00182.0051.6223.621.781.39
Litonotus sp.0.000.0053.5018.000.000.0080.0033.384.042.59
Zoothamnium sp.0.000.0021.700.000.000.00110.5439.697.094.20
Total biomass
(×10−4 g/plant)
9.070.473.530.610.120.16
Table A2. Cumulative contribution of potato rhizosphere ciliates over six months.
SpeciesMayJuneJulyAugustSeptemberOctober
N%RankN%RankN%RankN%RankN%RankN%Rank
Colpoda sp.*128.3850.2114.6848.681148.352.84136.8830.82121.8633.41123.9829.851
Tachysoma sp.*32.3812.6926.2621.69217.616.69420.9218.8525.598.37614.7618.936
Gonostomum sp.*30.469.92300-27.110.83218.7417.0631.72.44911.514.199
Oxytricha sp.*25.249.0642.026.26426.710.4536.095.33614.121.6625.265.688
Tetrahymena sp.9.593.62500-7.742.9484.86486.937.8583.975.0114
Vorticella sp.*9.682.9165.5116.738.243.2475.574.772.072.84143.494.3110
Dileptus sp.6.952.6571.214.4451.650.53146.686.01500-1.511.984
Strongylidium sp.6.242.32800--2.811102.221.94102.082.86101.091.3312
Opercularia sp.*5.021.95900-00-00-6.328.4336.67.792
Spathidium sp.4.311.61100.82.24611.374.3753.693.2192.894.6173.434.6913
Stylonychia sp.*3.421.311100-8.383.3567.326.4241.432.1142.392.783
Pauroleptus sp.2.480.911200-1.990.761200-1.261.89120.780.955
Parakahliella sp.2.460.851300-1.830.691300-2.543.5152.222.517
Litonotus sp.00-00-3.661.4592.071.651100-00-
Zoothamnium sp.00-00-2.310.861100-00-00-
Note: N indicates average abundance; % indicates cumulative contribution rate. * Top three important contributors at each stage.
Table A3. Ciliate diversity indexes in four layers of soil during six growth stages of potatoes.
H’J’D
May 11.780.702.14
May 21.760.692.16
May 31.770.692.15
May 41.790.702.15
June 11.450.811.44
June 21.490.831.57
June 31.310.731.43
June 41.280.711.43
July 11.790.682.38
July 21.760.672.35
July 31.570.592.28
July 41.560.592.29
August 12.090.872.13
August 22.010.842.12
August 31.950.812.10
August 41.960.822.08
September 12.080.842.64
September 22.030.822.56
September 32.060.832.59
September 41.990.802.62
October 12.150.842.76
October 22.170.852.81
October 32.120.832.71
October 42.050.802.66
Note: The Shannon-Wiener index (H’), Pielou evenness index (J’), and Margalef species richness index (D). The numbers in the figure represent different layers of soil 1: 0–5 cm; 2: 5–10 cm; 3: 10–15 cm; 4: 15–20 cm.
Table A4. Biota–environment (BIOENV) analysis of soil physicochemical properties.
RankREnvironmental Variablesp
10.677NH4+-N, SOM, TN, pH0.01
20.677NH4+-N, SOM, TN0.01
30.673NH4+-N, AP, SOM, pH0.01
40.672NO3-N, NH4+-N, SOM, TN0.01
50.672NO3, NH4+-N, SOM, TN, pH0.01
60.671NH4+-N, AP, SOM, TN, pH0.01
70.671NO3-N, NH4+-N, AP, SOM, TN, pH0.01
80.670NH4+-N, AP, SOM, TN0.01
90.669NO3-N, NH4+-N, AP, SOM, TN0.01
100.668NH4+-N, AP, pH0.01
R indicates spearman correlation coefficient.

References

  1. Laforest-Lapointe, I.; Arrieta, M.-C. Microbial Eukaryotes: A Missing Link in Gut Microbiome Studies. Msystems 2018, 3, e00201-17. [Google Scholar] [CrossRef] [Green Version]
  2. Kou, X.; Ma, N.; Zhang, X.; Xie, H.; Zhang, X.; Wu, Z.; Liang, W.; Li, Q.; Ferris, H. Frequency of stover mulching but not amount regulates the decomposition pathways of soil micro-foodwebs in a no-tillage system. Soil Biol. Biochem. 2020, 144, 107789. [Google Scholar] [CrossRef]
  3. Manirakiza, N.; Şeker, C. Effects of compost and biochar amendments on soil fertility and crop growth in a calcareous soil. J. Plant Nutr. 2020, 43, 3002–3019. [Google Scholar] [CrossRef]
  4. Zhao, Z.-B.; He, J.-Z.; Geisen, S.; Han, L.-L.; Wang, J.-T.; Shen, J.-P.; Wei, W.-X.; Fang, Y.-T.; Li, P.-P.; Zhang, L.-M. Protist communities are more sensitive to nitrogen fertilization than other microorganisms in diverse agricultural soils. Microbiome 2019, 7, 33. [Google Scholar] [CrossRef] [PubMed]
  5. Gao, Z.; Karlsson, I.; Geisen, S.; Kowalchuk, G.; Jousset, A. Protists: Puppet Masters of the Rhizosphere Microbiome. Trends Plant Sci. 2019, 24, 165–176. [Google Scholar] [CrossRef]
  6. Kou, X.; Su, T.; Ma, N.; Li, Q.; Wang, P.; Wu, Z.; Liang, W.; Cheng, W. Soil micro-food web interactions and rhizosphere priming effect. Plant Soil 2018, 432, 129–142. [Google Scholar] [CrossRef]
  7. Singh, R.; Parihar, P.; Prasad, S.M. Sulfur and Calcium Simultaneously Regulate Photosynthetic Performance and Nitrogen Metabolism Status in As-Challenged Brassica juncea L. Seedlings. Front. Plant Sci. 2018, 9, 772. [Google Scholar] [CrossRef] [Green Version]
  8. Asiloglu, R.; Shiroishi, K.; Suzuki, K.; Turgay, O.C.; Murase, J.; Harada, N. Protist-enhanced survival of a plant growth promoting rhizobacteria, Azospirillum sp. B510, and the growth of rice (Oryza sativa L.) plants. Appl. Soil Ecol. 2020, 154, 103599. [Google Scholar] [CrossRef]
  9. Shaw, E.A.; Adams, B.J.; Barrett, J.E.; Lyons, W.B.; Virginia, R.A.; Wall, D.H. Stable C and N isotope ratios reveal soil food web structure and identify the nematode Eudorylaimus antarcticus as an omnivore–predator in Taylor Valley, Antarctica. Polar. Biol. 2018, 41, 1013–1018. [Google Scholar] [CrossRef]
  10. Oshima, T.; Shinohara, Y.; Asakawa, S.; Murase, J. Susceptibility and resilience of the soil ciliate community to high temperatures. Soil Sci. Plant Nutr. 2020, 66, 870–877. [Google Scholar] [CrossRef]
  11. Zheng, W.-B.; Wang, L.; Wang, X.; Du, M.-L.; Ge, C.; Wang, Q.-H.; Zhang, M.-Y.; Yang, M.-L.; Zheng, X.-D.; Chen, Y.; et al. Dominant protozoan species in rhizosphere soil over growth of Beta vulgaris L. in Northeast China. Bioengineered 2020, 11, 229–240. [Google Scholar] [CrossRef] [Green Version]
  12. Custer, G.F.; van Diepen, L.T.A.; Stump, W. An Examination of Fungal and Bacterial Assemblages in Bulk and Rhizosphere Soils under Solanum tuberosum in Southeastern Wyoming, USA. Appl. Microbiol. 2021, 1, 162–176. [Google Scholar] [CrossRef]
  13. Kracmarova, M.; Karpiskova, J.; Uhlik, O.; Strejcek, M.; Szakova, J.; Balik, J.; Demnerova, K.; Stiborova, H. Microbial Communities in Soils and Endosphere of Solanum tuberosum L. and their Response to Long-Term Fertilization. Microorganisms 2020, 8, 1377. [Google Scholar] [CrossRef]
  14. Pantigoso, H.A.; Manter, D.K.; Vivanco, J.M. Differential Effects of Phosphorus Fertilization on Plant Uptake and Rhizosphere Microbiome of Cultivated and Non-cultivated Potatoes. Microb. Ecol. 2020, 80, 169–180. [Google Scholar] [CrossRef]
  15. Nisa, R.U.; Tantray, A.Y.; Kouser, N.; Allie, K.A.; Wani, S.M.; Alamri, S.A.; Alyemeni, M.N.; Wijaya, L.; Shah, A.A. Influence of ecological and edaphic factors on biodiversity of soil nematodes. Saudi J. Biol. Sci. 2021, 28, 3049–3059. [Google Scholar] [CrossRef] [PubMed]
  16. Tang, H.; Xiao, X.; Li, C.; Shi, L.; Cheng, K.; Li, W.; Wen, L.; Xu, Y.; Wang, K. Microbial carbon source utilization in rice rhizosphere soil with different tillage practice in a double cropping rice field. Sci. Rep. 2021, 11, 5048. [Google Scholar] [CrossRef] [PubMed]
  17. Tang, M.; Li, L.; Wang, X.; You, J.; Li, J.; Chen, X. Elevational is the main factor controlling the soil microbial community structure in alpine tundra of the Changbai Mountain. Sci. Rep. 2020, 10, 12442. [Google Scholar] [CrossRef]
  18. Kunhikannan, S.; Thomas, C.J.; Franks, A.E.; Mahadevaiah, S.; Kumar, S.; Petrovski, S. Environmental hotspots for antibiotic resistance genes. Microbiologyopen 2021, 10, e1197. [Google Scholar] [CrossRef] [PubMed]
  19. Horiguchi, G.; Matsumoto, K.; Nemoto, K.; Inokuchi, M.; Hirotsu, N. Transition from Proto-Kranz-Type Photosynthesis to HCO3 Use Photosynthesis in the Amphibious Plant Hygrophila polysperma. Front. Plant Sci. 2021, 12, 675507. [Google Scholar] [CrossRef]
  20. Li, W.; Xiong, B.; Wang, S.; Deng, X.; Yin, L.; Li, H. Regulation Effects of Water and Nitrogen on the Source-Sink Relationship in Potato during the Tuber Bulking Stage. PLoS ONE 2016, 11, e0146877. [Google Scholar] [CrossRef] [Green Version]
  21. Liu, K.; Du, J.; Zhong, Y.; Shen, Z.; Yu, X. The response of potato tuber yield, nitrogen uptake, soil nitrate nitrogen to different nitrogen rates in red soil. Sci. Rep. 2021, 11, 22506. [Google Scholar] [CrossRef] [PubMed]
  22. Chaparro, J.M.; Badri, D.V.; Vivanco, J.M. Rhizosphere microbiome assemblage is affected by plant development. ISME J. 2014, 8, 790–803. [Google Scholar] [CrossRef] [PubMed] [Green Version]
  23. Wang, Z.; Li, Y.; Zhuang, L.; Yu, Y.; Liu, J.; Zhang, L.; Gao, Z.; Wu, Y.; Gao, W.; Ding, G.-C.; et al. A Rhizosphere-Derived Consortium of Bacillus subtilis and Trichoderma harzianum Suppresses Common Scab of Potato and Increases Yield. Comput. Struct. Biotechnol. J. 2019, 17, 645–653. [Google Scholar] [CrossRef]
  24. Frey, S.D.; Gupta, V.V.S.R.; Elliott, E.T.; Paustian, K. Protozoan grazing affects estimates if carbon utilization efficiency of the soil microbial community. Soil Biol. Biochem. 2001, 33, 1759–1768. [Google Scholar] [CrossRef]
  25. Trap, J.; Bonkowski, M.; Plassard, C.; Villenave, C.; Blanchart, E. Ecological importance of soil bacterivores for ecosystem functions. Plant Soil 2015, 398, 1–24. [Google Scholar] [CrossRef] [Green Version]
  26. Pernthaler, J. Predation on prokaryotes in the water column and its ecological implications. Nat. Rev. Microbiol. 2005, 3, 537–546. [Google Scholar] [CrossRef]
  27. Gruber, D.F.; Tuorto, S.; Taghon, G.L. Growth Phase and Elemental Stoichiometry of Bacterial Prey Influences Ciliate Grazing Selectivity. J. Eukaryot. Microbiol. 2009, 56, 466–471. [Google Scholar] [CrossRef]
  28. Chandarana, K.A.; Amaresan, N. Soil protists: An untapped microbial resource of agriculture and environmental importance. Pedosphere 2022, 32, 184–197. [Google Scholar] [CrossRef]
  29. Durán-Ramírez, C.A.; Mayén-Estrada, R. Ecological Study of the Active Ciliate Community from Bromeliads during the Humid Season in Different Types of Forests of the Mexican Neotropics. Diversity 2022, 14, 122. [Google Scholar] [CrossRef]
  30. Abraham, J.S.; Sripoorna, S.; Dagar, J.; Jangra, S.; Kumar, A.; Yadav, K.; Singh, S.; Goyal, A.; Maurya, S.; Gambhir, G.; et al. Soil ciliates of the Indian Delhi Region: Their community characteristics with emphasis on their ecological implications as sensitive bio-indicators for soil quality. Saudi J. Biol. Sci. 2019, 26, 1305–1313. [Google Scholar] [CrossRef]
  31. Islam, W.; Noman, A.; Naveed, H.; Huang, Z.; Chen, H.Y.H. Role of environmental factors in shaping the soil microbiome. Environ. Sci. Pollut. Res. Int. 2020, 27, 41225–41247. [Google Scholar] [CrossRef]
  32. Chandarana, K.A.; Pramanik, R.S.; Amaresan, N. Interaction between ciliate and plant growth promoting bacteria influences the root structure of rice plants, soil PLFAs and respiration properties. Rhizosphere 2022, 21, 100466. [Google Scholar] [CrossRef]
  33. Warren, A.; Patterson, D.J.; Dunthorn, M.; Clamp, J.C.; Achilles-Day, U.E.; Aescht, E.; Al-Farraj, S.A.; Al-Quraishy, S.; Al-Rasheid, K.; Carr, M.; et al. Beyond the “Code”: A Guide to the Description and Documentation of Biodiversity in Ciliated Protists (Alveolata, Ciliophora). J. Eukaryot. Microbiol. 2016, 64, 539–554. [Google Scholar] [CrossRef] [PubMed] [Green Version]
  34. Ren, K.; Xue, Y.; Rønn, R.; Liu, L.; Chen, H.; Rensing, C.; Yang, J. Dynamics and determinants of amoeba community, occurrence and abundance in subtropical reservoirs and rivers. Water Res. 2018, 146, 177–186. [Google Scholar] [CrossRef] [PubMed]
  35. Moreno, Y.; Moreno-Mesonero, L.; Amorós, I.; Perez, J.A.M.; Morillo, J.; Alonso, J. Multiple identification of most important waterborne protozoa in surface water used for irrigation purposes by 18S rRNA amplicon-based metagenomics. Int. J. Hyg. Environ. Health 2018, 221, 102–111. [Google Scholar] [CrossRef] [PubMed]
  36. Zhang, H.; Zhao, Z.; Zhang, X.; Zhang, W.; Huang, L.; Zhang, Z.; Yuan, L.; Liu, X. Effects of foliar application of selenate and selenite at different growth stages on Selenium accumulation and speciation in potato (Solanum tuberosum L.). Food Chem. 2013, 14, 299–320. [Google Scholar] [CrossRef] [PubMed]
  37. MacEachren, A.M.; Davidson, J.V. Sampling and Isometric Mapping of Continuous Geographic Surfaces. Am. Cartogr. 1987, 14, 299–320. [Google Scholar] [CrossRef]
  38. Foissner, W.; Khaled, A.R. Notes on Soil Ciliates (Protozoa, Ciliophora) from TheNetherlands, with Description of Keronopsis schminkei nov. spec. and Apobryophyllum schmidingeri nov. spec. Acta Protozool. 2007, 46, 201. [Google Scholar]
  39. Foissner, W. An updated compilation of world soil ciliates (Protozoa, Ciliophora), with ecological notes, new records, and descriptions of new species. Eur. J. Protistol. 1998, 34, 195–235. [Google Scholar] [CrossRef]
  40. Foissner, W. An update of ‘basic light and scanning electron microscopic methods for taxonomic studies of ciliated protozoa’. Int. J. Syst. Evol. Microbiol. 2014, 64, 271–292. [Google Scholar] [CrossRef] [Green Version]
  41. Ma, H.; Choi, J.K.; Song, W. An Improved Silver Carbonate Impregnation for Marine Ciliated Protozoa. Acta Protozool. 2003, 42, 161–164. [Google Scholar]
  42. Wilbert, N.; Song, W. A further study on littoral ciliates (Protozoa, Ciliophora) near King George Island, Antarctica, with description of a new genus and seven new species. J. Nat. Hist. 2008, 42, 979–1012. [Google Scholar] [CrossRef]
  43. Lee, S.Y.; Lee, Y.; Wang, F. Chiral compounds from bacterial polyesters: Sugars to plastics to fine chemicals. Biotechnol. Bioeng. 1999, 65, 363–368. [Google Scholar] [CrossRef]
  44. Vaidya, S.; Srivastava, R.; Gupta, M.N. Immobilization of acid phosphatase from arachis hypogaea on CM-cellulose. Biotechnol. Bioeng. 1987, 29, 1040–1043. [Google Scholar] [CrossRef]
  45. Šimek, K.; Grujčić, V.; Nedoma, J.; Jezberová, J.; Šorf, M.; Matoušů, A.; Pechar, L.; Posch, T.; Bruni, E.P.; Vrba, J. Microbial food webs in hypertrophic fishponds: Omnivorous ciliate taxa are major protistan bacterivores. Limnol. Oceanogr. 2019, 64, 2295–2309. [Google Scholar] [CrossRef] [Green Version]
  46. Ikeda, T. An analysis of metabolic characteristics of planktonic heterotrophic protozoans. J. Plankton Res. 2017, 39, 479–490. [Google Scholar] [CrossRef] [Green Version]
  47. Šolić, M.; Šantić, D.; Šestanović, S.; Bojanić, N.; Jozić, S.; Ordulj, M.; Tomaš, A.V.; Kušpilić, G. Changes in the Trophic Pathways within the Microbial Food Web in the Global Warming Scenario: An Experimental Study in the Adriatic Sea. Microorganisms 2020, 8, 510. [Google Scholar] [CrossRef] [PubMed] [Green Version]
  48. Erős, T.; Kuehne, L.; Dolezsai, A.; Sommerwerk, N.; Wolter, C. A systematic review of assessment and conservation management in large floodplain rivers—Actions postponed. Ecol. Indic. 2019, 98, 453–461. [Google Scholar] [CrossRef] [Green Version]
Figure 1. Ciliates community composition and diversity from May to October (a). Taxa and phylogeny of protozoa. (b) Relative abundance of culturable ciliates in six growth stages. (c) Diversity index of ciliates during six growth stages of potatoes. Box plots labelled with different letters represent statistically significant differences (p < 0.05).
Plants 12 02260 g001
Figure 2. Spatial–temporal characteristics of potato rhizosphere ciliate communities: (a) the abundance and occurrence frequency of ciliates in four soil layers over six months; (b) NMDS analysis based on ciliate abundance; (c) spatial and temporal distribution of ciliate structure at different growth stages.
Plants 12 02260 g002
Figure 3. Correlation analysis between ciliates and physiochemical properties: (a) PCA plot based on log-transformed physicochemical data. Axes 1 and 2, respectively, account for 31.3% and 23.3% of the total variation; (b) RDA of principal coordinates on Bray–Curtis similarities from log-transformed species abundance data, and correlation between five highest contribution and community assembly dominant species with two RDA axes; (c) correlations (Spearman analysis) between abundance of 15 ciliates and soil properties; (d) Spearman analysis on soil properties and diversity indices of ciliates. *** Significant correlation at p < 0.001 level; ** Significant correlation at p < 0.01 level; * Significant correlation at p < 0.05 level.
Plants 12 02260 g003
Table 1. Estimating contribution rates of rhizosphere soil ciliates on carbon and nitrogen flows for potatoes.
Nutrient ElementParameters (g/Plant)MayJuneJulyAugustSeptemberOctoberAvg.
CarbonIngestion144.732.24183.2217.836.237.9360.36
Egestion3.010.161.170.200.040.050.77
Respiration2.260.120.880.150.030.040.58
Carbon flow139.461.96181.1717.476.167.8359.01
Carbon contribution rate (%) -12.2694.367.947.71-30.57
NitrogenIngestion27.830.4335.233.431.21.5211.61
Egestion0.780.040.300.050.010.010.20
Respiration0.590.030.230.040.010.010.15
Nitrogen flow26.460.3634.73.341.181.5011.26
Nitrogen contribution rate (%) -8.9672.296.075.90-23.31
Disclaimer/Publisher’s Note: The statements, opinions and data contained in all publications are solely those of the individual author(s) and contributor(s) and not of MDPI and/or the editor(s). MDPI and/or the editor(s) disclaim responsibility for any injury to people or property resulting from any ideas, methods, instructions or products referred to in the content.

