

The Metabolic Profile of Young, Watered Chickpea Plants Can Be Used as a Biomarker to Predict Seed Number under Terminal Drought

 , and
, and 
Abstract
1. Introduction
2. Results
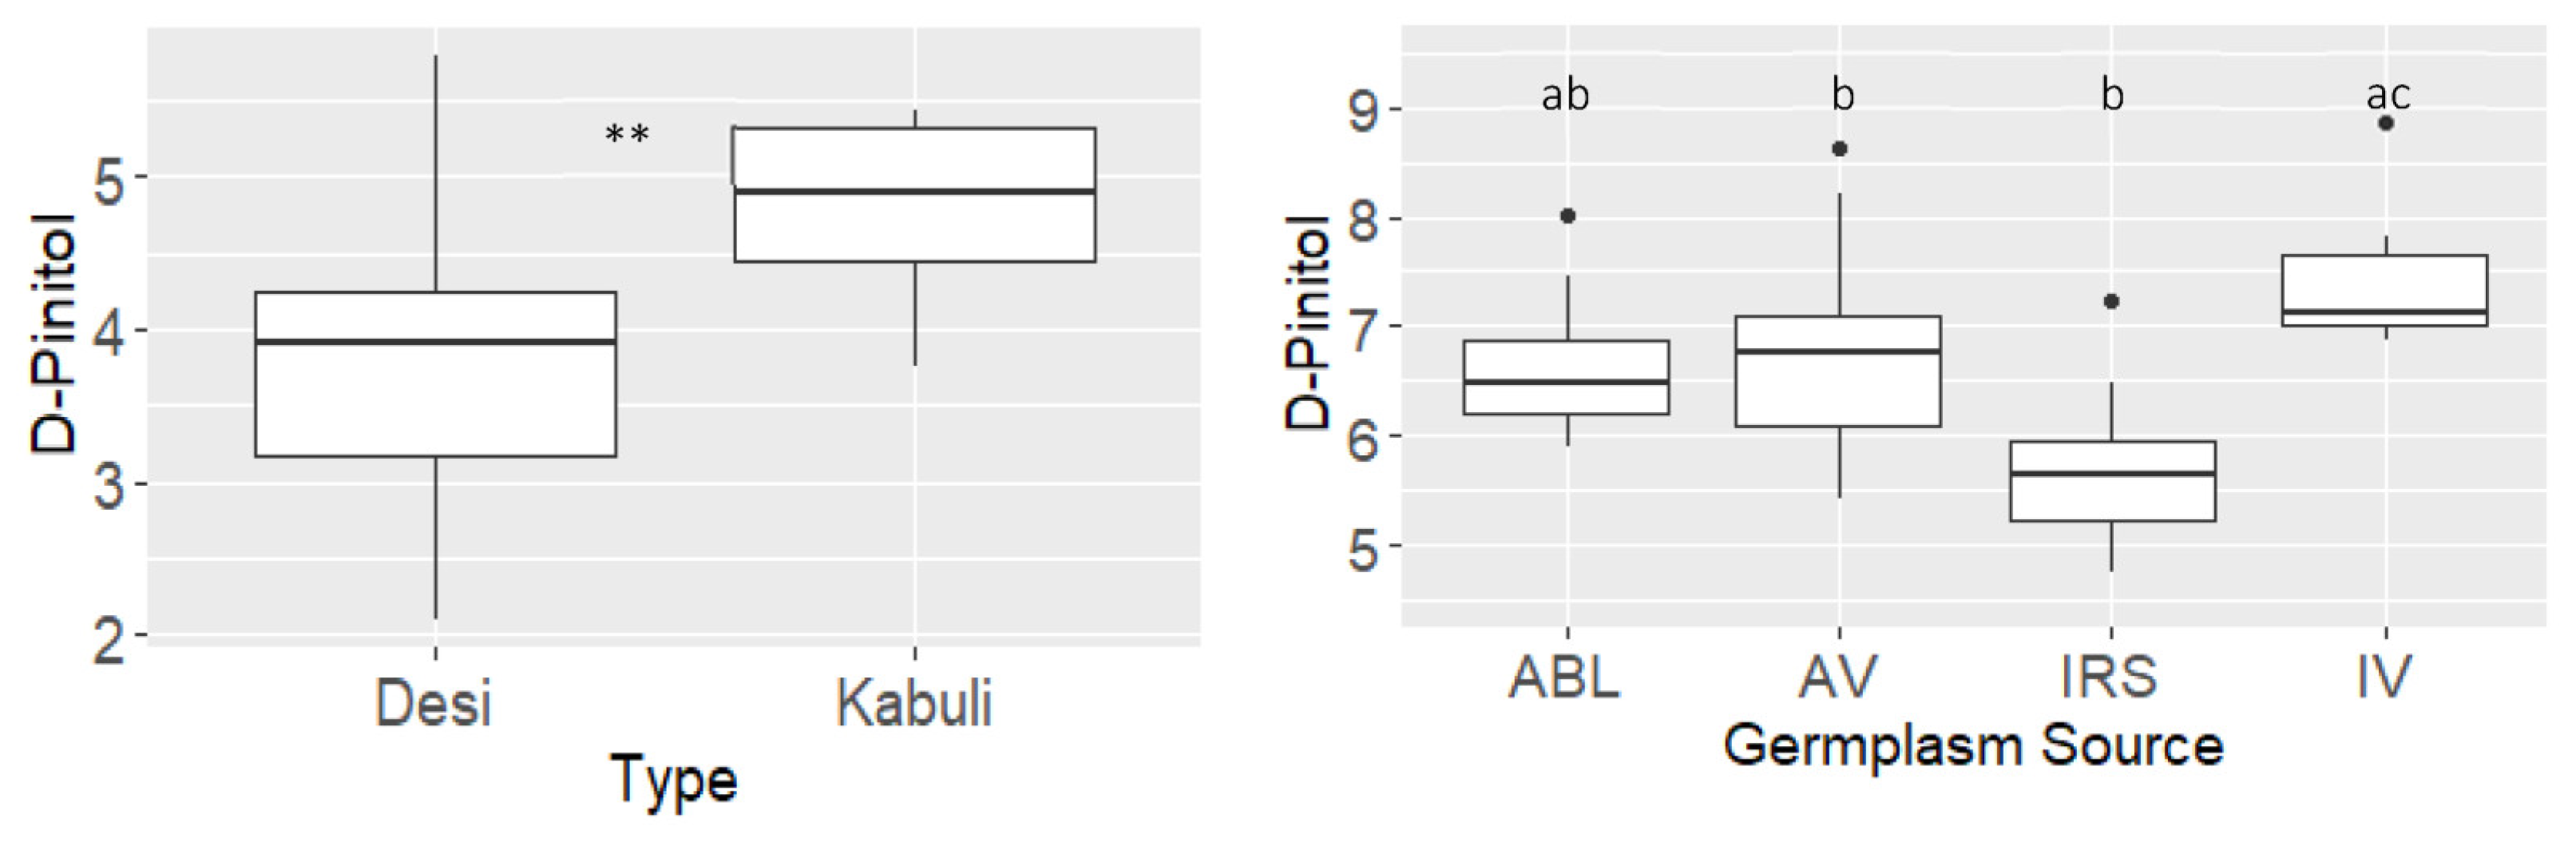
2.1. Phenotype
2.2. Metabolomic Profiling
2.3. Pearson’s Correlations
D-Pinitol
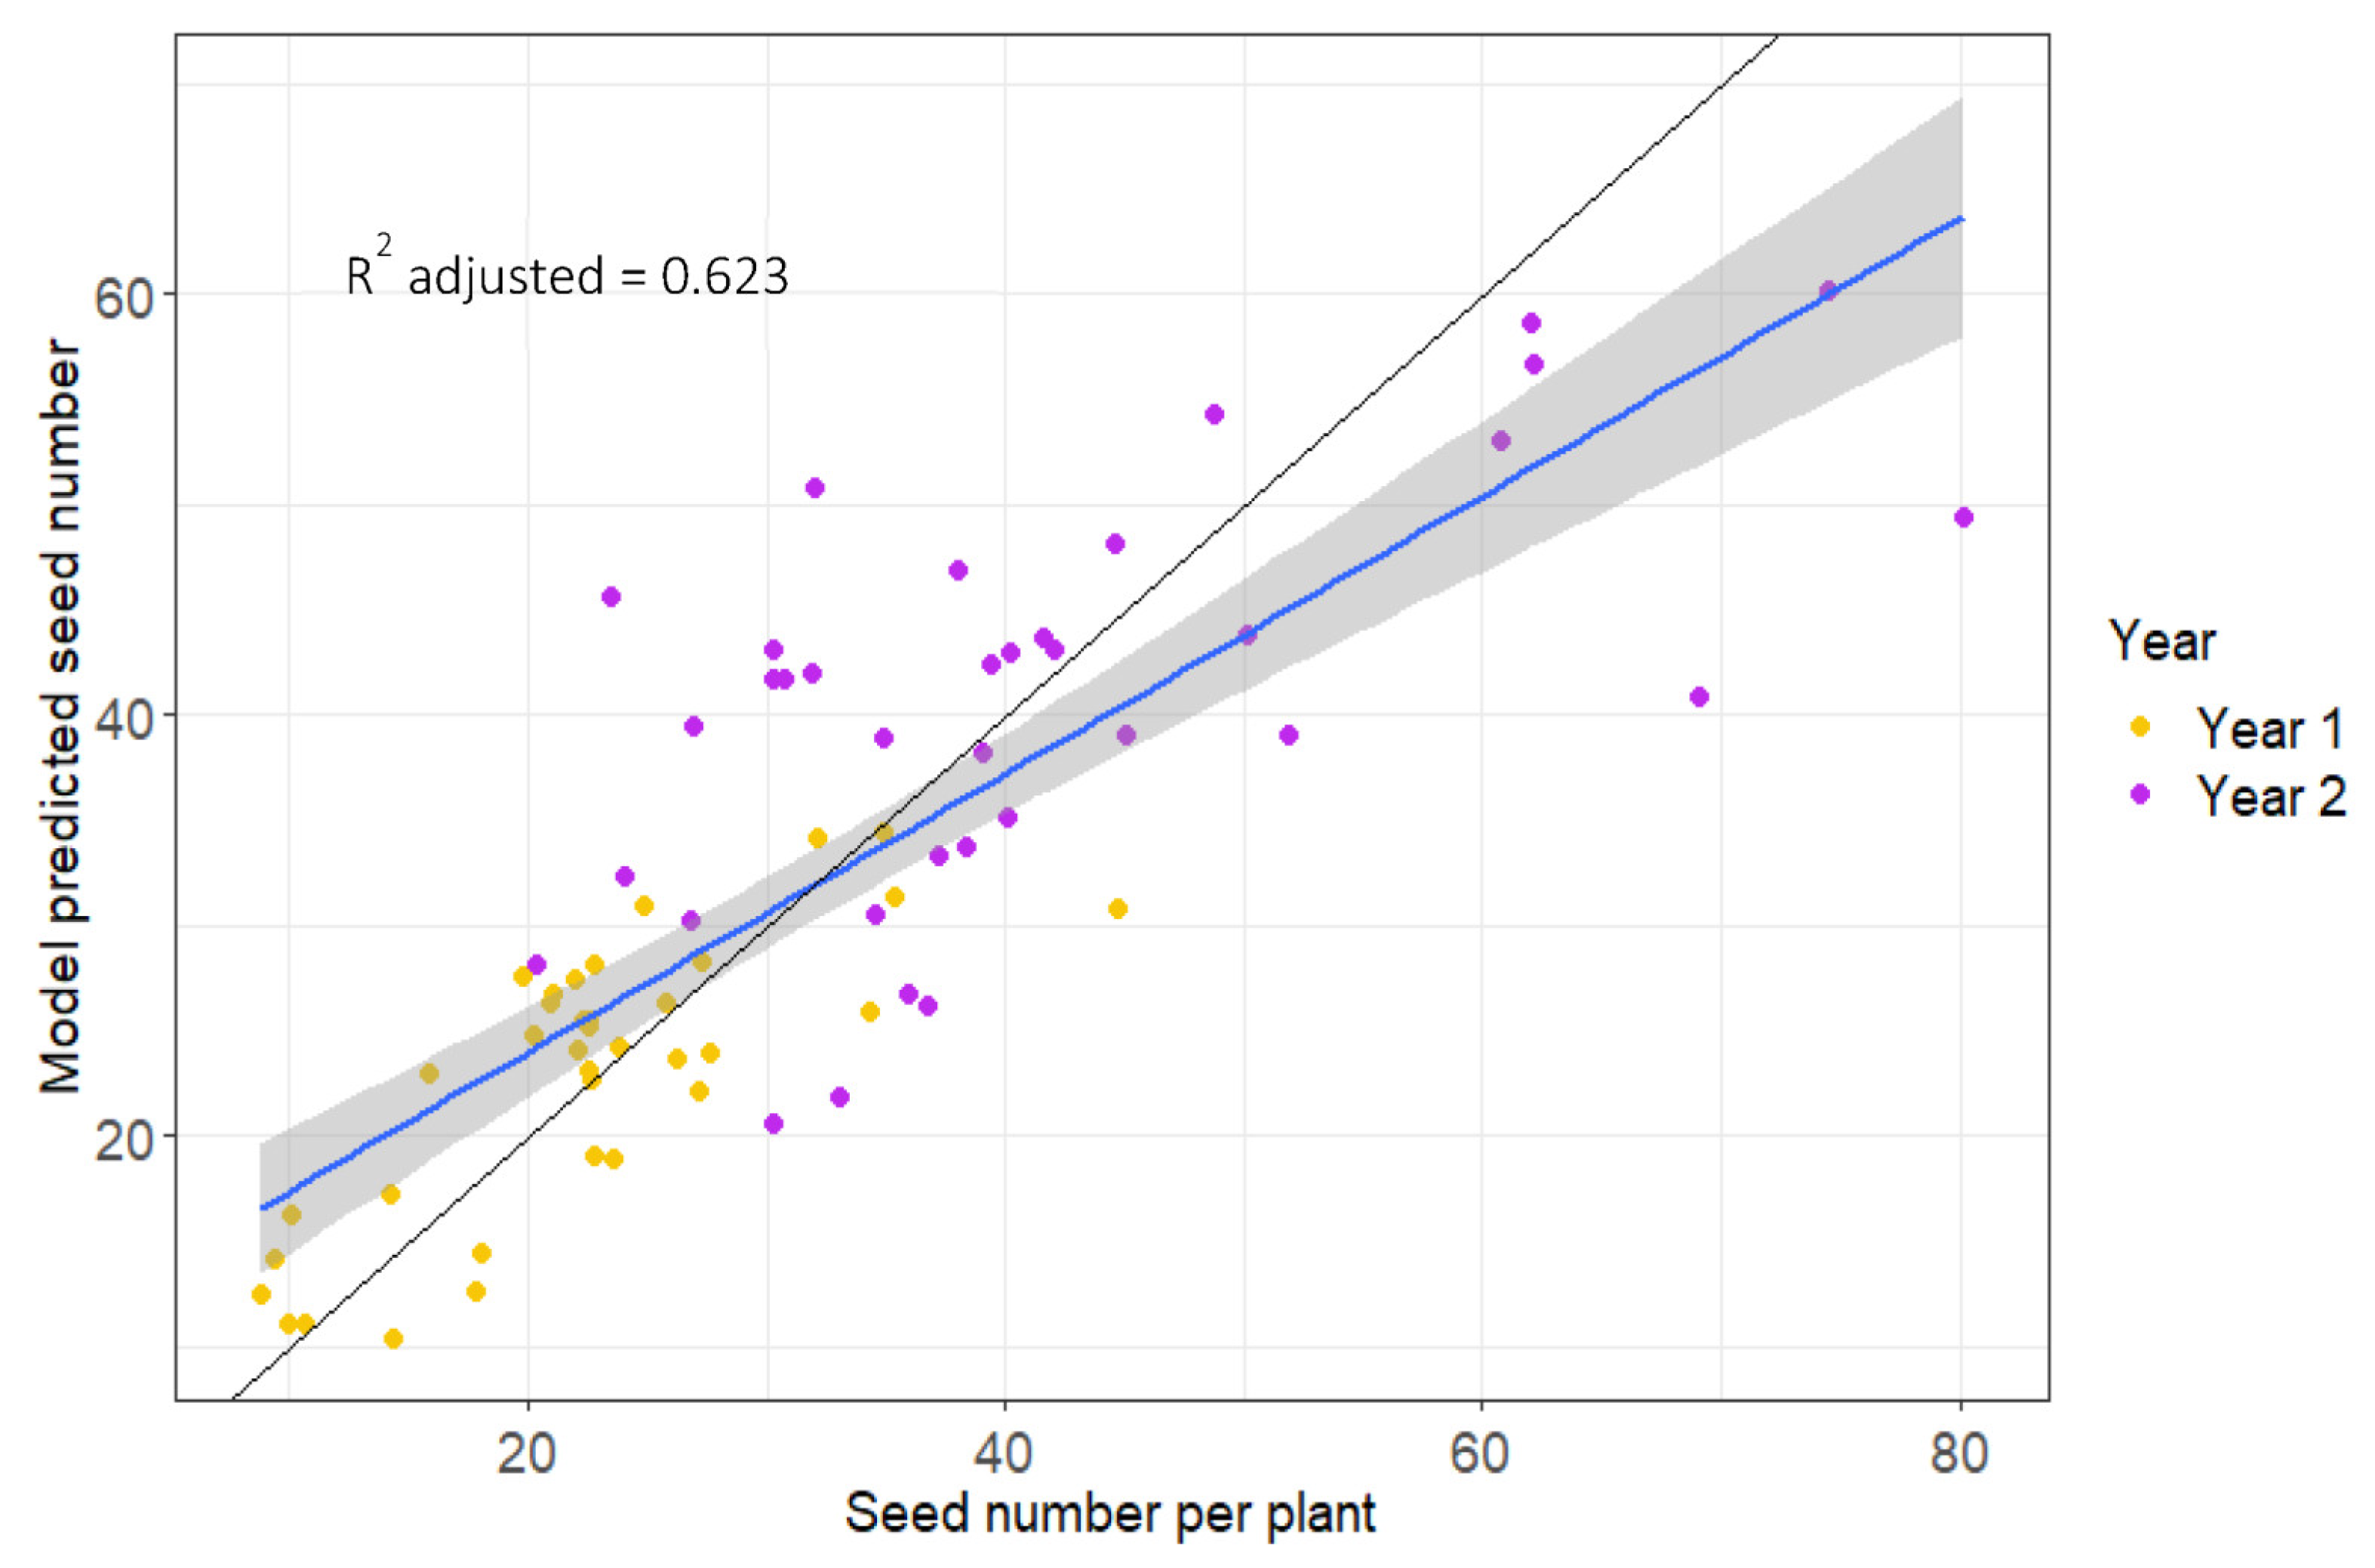
2.4. Predictive Modelling
3. Discussion
4. Materials and Methods
4.1. Field Trial
4.2. Plant Material
4.3. Yield Harvest
4.4. Biomarker Harvest Protocol
4.5. Metabolite Extraction
4.6. Soluble Sugar Analysis
4.7. Starch Quantification
4.8. Gas Chromatography Mass Spectrometry
4.9. Statistics and Modelling: Linear Modelling and Feature Selection
4.10. Model Evaluation and Trait Prediction
Supplementary Materials
Author Contributions
Funding
Data Availability Statement
Acknowledgments
Conflicts of Interest
References
- Bidin, M.Z.; Shah, A.M.; Stanslas, J.; Seong, C.L.T. Blood and urine biomarkers in chronic kidney disease: An update. Clin. Chim. Acta 2019, 495, 239–250. [Google Scholar] [CrossRef] [PubMed]
- Collins, G.S.; Altman, D.G. Predicting the 10 year risk of cardiovascular disease in the United Kingdom: Independent and external validation of an updated version of QRISK2. BMJ 2012, 344, e4181. [Google Scholar] [CrossRef] [PubMed]
- Hippisley-Cox, J.; Coupland, C.; Vinogradova, Y.; Robson, J.; Minhas, R.; Sheikh, A.; Brindle, P. Predicting cardiovascular risk in England and Wales: Prospective derivation and validation of QRISK2. BMJ 2008, 336, 1475–1482. [Google Scholar] [CrossRef]
- Wanner, L.A.; Junttila, O. Cold-induced freezing tolerance in Arabidopsis. Plant Physiol. 1999, 120, 391–399. [Google Scholar] [CrossRef] [PubMed]
- Wang, L.; Wu, J.Q. The Essential Role of Jasmonic Acid in Plant-Herbivore Interactions—Using the Wild Tobacco Nicotiana attenuata as a Model. J. Genet. Genom. 2013, 40, 597–606. [Google Scholar] [CrossRef] [PubMed]
- Sequera-Mutiozabal, M.I.; Erban, A.; Kopka, J.; Atanasov, K.E.; Bastida, J.; Fotopoulos, V.; Alcazar, R.; Tiburcio, A.F. Global Metabolic Profiling of Arabidopsis Polyamine Oxidase 4 (AtPAO4) Loss-of-Function Mutants Exhibiting Delayed Dark-Induced Senescence. Front. Plant Sci. 2016, 7, 173. [Google Scholar] [CrossRef]
- Hannah, M.A.; Wiese, D.; Freund, S.; Fiehn, O.; Heyer, A.G.; Hincha, D.K. Natural genetic variation of freezing tolerance in arabidopsis. Plant Physiol. 2006, 142, 98–112. [Google Scholar] [CrossRef]
- Nam, K.H.; Kim, D.Y.; Kim, H.J.; Pack, I.S.; Kim, H.J.; Chung, Y.S.; Kim, S.Y.; Kim, C.G. Global metabolite profiling based on GC-MS and LC-MS/MS analyses in ABF3-overexpressing soybean with enhanced drought tolerance. Appl. Biol. Chem. 2019, 62, 15. [Google Scholar] [CrossRef]
- Hoffman, D.E.; Jonsson, P.; Bylesjo, M.; Trygg, J.; Antti, H.; Eriksson, M.E.; Moritz, T. Changes in diurnal patterns within the Populus transcriptome and metabolome in response to photoperiod variation. Plant. Cell. Environ. 2010, 33, 1298–1313. [Google Scholar] [CrossRef]
- Janska, A.; Marsik, P.; Zelenkova, S.; Ovesna, J. Cold stress and acclimation—What is important for metabolic adjustment? Plant. Biol. 2010, 12, 395–405. [Google Scholar] [CrossRef]
- Guy, C.; Kaplan, F.; Kopka, J.; Selbig, J.; Hincha, D.K. Metabolomics of temperature stress. Physiol. Plant. 2008, 132, 220–235. [Google Scholar] [CrossRef]
- Riedelsheimer, C.; Lisec, J.; Czedik-Eysenberg, A.; Sulpice, R.; Flis, A.; Grieder, C.; Altmann, T.; Stitt, M.; Willmitzer, L.; Melchinger, A.E. Genome-wide association mapping of leaf metabolic profiles for dissecting complex traits in maize. Proc. Natl. Acad. Sci. USA 2012, 109, 8872–8877. [Google Scholar] [CrossRef] [PubMed]
- Keurentjes, J.J.; Fu, J.; de Vos, C.H.; Lommen, A.; Hall, R.D.; Bino, R.J.; van der Plas, L.H.; Jansen, R.C.; Vreugdenhil, D.; Koornneef, M. The genetics of plant metabolism. Nat. Genet. 2006, 38, 842–849. [Google Scholar] [CrossRef] [PubMed]
- Meyer, R.C.; Steinfath, M.; Lisec, J.; Becher, M.; Witucka-Wall, H.; Torjek, O.; Fiehn, O.; Eckardt, A.; Willmitzer, L.; Selbig, J.; et al. The metabolic signature related to high plant growth rate in Arabidopsis thaliana. Proc. Natl. Acad. Sci. USA 2007, 104, 4759–4764. [Google Scholar] [CrossRef] [PubMed]
- Steinfath, M.; Gartner, T.; Lisec, J.; Meyer, R.C.; Altmann, T.; Willmitzer, L.; Selbig, J. Prediction of hybrid biomass in Arabidopsis thaliana by selected parental SNP and metabolic markers. Theor. Appl. Genet. 2010, 120, 239–247. [Google Scholar] [CrossRef]
- Sulpice, R.; Trenkamp, S.; Steinfath, M.; Usadel, B.; Gibon, Y.; Witucka-Wall, H.; Pyl, E.T.; Tschoep, H.; Steinhauser, M.C.; Guenther, M.; et al. Network Analysis of Enzyme Activities and Metabolite Levels and Their Relationship to Biomass in a Large Panel of Arabidopsis Accessions. Plant Cell. 2010, 22, 2872–2893. [Google Scholar] [CrossRef]
- Sulpice, R.; Nikoloski, Z.; Tschoep, H.; Antonio, C.; Kleessen, S.; Larhlimi, A.; Selbig, J.; Ishihara, H.; Gibon, Y.; Fernie, A.R.; et al. Impact of the Carbon and Nitrogen Supply on Relationships and Connectivity between Metabolism and Biomass in a Broad Panel of Arabidopsis Accessions(1[W][OA]). Plant. Physiol. 2013, 162, 347–363. [Google Scholar] [CrossRef]
- Sulpice, R.; Pyl, E.T.; Ishihara, H.; Trenkamp, S.; Steinfath, M.; Witucka-Wall, H.; Gibon, Y.; Usadel, B.; Poree, F.; Piques, M.C.; et al. Starch as a major integrator in the regulation of plant growth. Proc. Natl. Acad. Sci. USA 2009, 106, 10348–10353. [Google Scholar] [CrossRef]
- Degenkolbe, T.; Do, P.T.; Kopka, J.; Zuther, E.; Hincha, D.K.; Kohl, K.I. Identification of drought tolerance markers in a diverse population of rice cultivars by expression and metabolite profiling. PLoS ONE 2013, 8, e63637. [Google Scholar] [CrossRef]
- Obata, T.; Witt, S.; Lisec, J.; Palacios-Rojas, N.; Florez-Sarasa, I.; Yousfi, S.; Araus, J.L.; Cairns, J.E.; Fernie, A.R. Metabolite Profiles of Maize Leaves in Drought, Heat, and Combined Stress Field Trials Reveal the Relationship between Metabolism and Grain Yield. Plant. Physiol. 2015, 169, 2665–2683. [Google Scholar] [CrossRef] [PubMed]
- Steinfath, M.; Strehmel, N.; Peters, R.; Schauer, N.; Groth, D.; Hummel, J.; Steup, M.; Selbig, J.; Kopka, J.; Geigenberger, P.; et al. Discovering plant metabolic biomarkers for phenotype prediction using an untargeted approach. Plant. Biotechnol. J. 2010, 8, 900–911. [Google Scholar] [CrossRef] [PubMed]
- Maddison, A.L.; Camargo-Rodriguez, A.; Scott, I.M.; Jones, C.M.; Elias, D.M.O.; Hawkins, S.; Massey, A.; Clifton-Brown, J.; McNamara, N.P.; Donnison, I.S.; et al. Predicting future biomass yield in Miscanthus using the carbohydrate metabolic profile as a biomarker. Glob. Change Biol. Bioenergy 2017, 9, 1264–1278. [Google Scholar] [CrossRef] [PubMed]
- Riedelsheimer, C.; Czedik-Eysenberg, A.; Grieder, C.; Lisec, J.; Technow, F.; Sulpice, R.; Altmann, T.; Stitt, M.; Willmitzer, L.; Melchinger, A.E. Genomic and metabolic prediction of complex heterotic traits in hybrid maize. Nat. Genet. 2012, 44, 217–220. [Google Scholar] [CrossRef]
- Berger, J.D.; Turner, N.C.; Siddique, K.H.M.; Knights, E.J.; Brinsmead, R.B.; Mock, I.; Edmondson, C.; Khan, T.N. Genotype by environment studies across Australia reveal the importance of phenology for chickpea (Cicer arietinum L.) improvement. Aust. J. Agric. Res. 2004, 55, 1071–1084. [Google Scholar] [CrossRef]
- FAO. FAOSTAT: Crops. Available online: http://www.fao.org/faostat/en/#data/QC (accessed on 15 May 2023).
- Ambika; Hegde, V.; Nimmy, M.S.; Bharadwaj, C.; Tripathi, S.; Singh, R.K.; Kumar, R. Unraveling genetics of semi-determinacy and identification of markers for indeterminate stem growth habit in chickpea (Cicer arietinum L.). Sci. Rep. 2021, 11, 21837. [Google Scholar] [CrossRef]
- Pang, J.Y.; Turner, N.C.; Du, Y.L.; Colmer, T.D.; Siddique, K.H.M. Pattern of Water Use and Seed Yield under Terminal Drought in Chickpea Genotypes. Front. Plant Sci. 2017, 8, 1375. [Google Scholar] [CrossRef]
- Leport, L.; Turner, N.C.; French, R.J.; Barr, M.D.; Duda, R.; Davies, S.L.; Tennant, D.; Siddique, K.H.M. Physiological responses of chickpea genotypes to terminal drought in a Mediterranean-type environment. Eur. J. Agron. 1999, 11, 279–291. [Google Scholar] [CrossRef]
- Sabaghpour, S.H.; Malhotra, R.S.; Sarparast, R.; Safikhani, M.; Alizadeh, S.H.; Jahangeri, A.; Khalaf, G. Registration of ‘Arman’—A Kabuli chickpea cultivar. Crop. Sci. 2006, 46, 2704–2705. [Google Scholar] [CrossRef]
- Pushpavalli, R.; Zaman-Allah, M.; Turner, N.C.; Baddam, R.; Rao, M.V.; Vadez, V. Higher flower and seed number leads to higher yield under water stress conditions imposed during reproduction in chickpea. Funct. Plant Biol. 2015, 42, 162–174. [Google Scholar] [CrossRef]
- Tuba Bicer, B.T.; Sakar, D. Heritability and gene effects for yield and yield components in chickpea. Hereditas 2008, 145, 220–224. [Google Scholar] [CrossRef] [PubMed]
- Toker, C. Estimates of broad-sense heritability for seed yield and yield criteria in faba bean (Vicia faba L.). Hereditas 2004, 140, 222–225. [Google Scholar] [CrossRef] [PubMed]
- Fàbregas, N.; Fernie, A.R. The metabolic response to drought. J. Exp. Bot. 2019, 70, 1077–1085. [Google Scholar] [CrossRef] [PubMed]
- Lozano-Elena, F.; Fabregas, N.; Coleto-Alcudia, V.; Cano-Delgado, A.I. Analysis of metabolic dynamics during drought stress in Arabidopsis plants. Sci. Data 2022, 9, 90. [Google Scholar] [CrossRef] [PubMed]
- Mathan, J.; Singh, A.; Ranjan, A. Sucrose transport and metabolism control carbon partitioning between stem and grain in rice. J. Exp. Bot. 2021, 72, 4355–4372. [Google Scholar] [CrossRef] [PubMed]
- You, J.; Zhang, Y.; Liu, A.; Li, D.; Wang, X.; Dossa, K.; Zhou, R.; Yu, J.; Zhang, Y.; Wang, L.; et al. Transcriptomic and metabolomic profiling of drought-tolerant and susceptible sesame genotypes in response to drought stress. BMC Plant. Biol. 2019, 19, 267. [Google Scholar] [CrossRef]
- Ford, C.W. Accumulation of Low-Molecular Weight Solutes in Water-Stressed Tropical Legumes. Phytochemistry 1984, 23, 1007–1015. [Google Scholar] [CrossRef]
- Wanek, W.; Richter, A. Biosynthesis and accumulation of D-ononitol in Vigna umbellata in response to drought stress. Physiol. Plant 1997, 101, 416–424. [Google Scholar] [CrossRef]
- Dumschott, K.; Dechorgnat, J.; Merchant, A. Water Deficit Elicits a Transcriptional Response of Genes Governing d-pinitol Biosynthesis in Soybean (Glycine max). Int. J. Mol. Sci. 2019, 20, 2411. [Google Scholar] [CrossRef]
- Wang, X.X.; Guo, R.; Li, M.X.; Liu, Y.; Zhao, M.L.; Fu, H.; Liu, X.Y.; Wang, S.Y.; Shi, L.X. Metabolomics reveals the drought-tolerance mechanism in wild soybean (Glycine soja). Acta Physiol. Plant 2019, 41, 161. [Google Scholar] [CrossRef]
- Kumar, M.; Kumar Patel, M.; Kumar, N.; Bajpai, A.B.; Siddique, K.H.M. Metabolomics and Molecular Approaches Reveal Drought Stress Tolerance in Plants. Int. J. Mol. Sci. 2021, 22, 9108. [Google Scholar] [CrossRef]
- Gowda, C.L.L.; Upadhyaya, H.D.; Dronavalli, N.; Singh, S. Identification of Large-Seeded High-Yielding Stable Kabuli Chickpea Germplasm Lines for Use in Crop Improvement. Crop. Sci. 2011, 51, 198–209. [Google Scholar] [CrossRef]
- Gao, Y.F.; Zhang, M.N.; Wu, T.C.; Xu, M.Y.; Cai, H.N.; Zhang, Z.S. Effects of D-Pinitol on Insulin Resistance through the PI3K/Akt Signaling Pathway in Type 2 Diabetes Mellitus Rats. J. Agric. Food Chem. 2015, 63, 6019–6026. [Google Scholar] [CrossRef] [PubMed]
- Kim, M.J.; Yoo, K.H.; Kim, J.H.; Seo, Y.T.; Ha, B.W.; Kho, J.H.; Shin, Y.G.; Chung, C.H. Effect of pinitol on glucose metabolism and adipocytokines in uncontrolled type 2 diabetes. Diabetes Res. Clin. Pract. 2007, 77, S247–S251. [Google Scholar] [CrossRef]
- Vernon, D.M.; Bohnert, H.J. A Novel Methyl Transferase Induced by Osmotic-Stress in the Facultative Halophyte Mesembryanthemum-Crystallinum. Embo J. 1992, 11, 2077–2085. [Google Scholar] [CrossRef] [PubMed]
- Sheveleva, E.; Chmara, W.; Bohnert, H.J.; Jensen, R.G. Increased salt and drought tolerance by D-ononitol production in transgenic Nicotiana tabacum L. Plant Physiol. 1997, 115, 1211–1219. [Google Scholar] [CrossRef]
- Sengupta, S.; Patra, B.; Ray, S.; Majumder, A.L. Inositol methyl tranferase from a halophytic wild rice, Porteresia coarctata Roxb. (Tateoka): Regulation of pinitol synthesis under abiotic stress. Plant Cell. Environ. 2008, 31, 1442–1459. [Google Scholar] [CrossRef] [PubMed]
- Ahn, C.H.; Hossain, M.A.; Lee, E.; Kanth, B.K.; Park, P.B. Increased salt and drought tolerance by D-pinitol production in transgenic Arabidopsis thaliana. Biochem. Biophys. Res. Commun. 2018, 504, 315–320. [Google Scholar] [CrossRef]
- Streeter, J.G.; Lohnes, D.G.; Fioritto, R.J. Patterns of pinitol accumulation in soybean plants and relationships to drought tolerance. Plant Cell. Environ. 2001, 24, 429–438. [Google Scholar] [CrossRef]
- Sánchez-Mata, M.C.; Peñuela-Teruel, M.J.; Cámara-Hurtado, M.; Díez-Marqués, C.; Torija-Isasa, M.E. Determination of Mono-, Di-, and Oligosaccharides in Legumes by High-Performance Liquid Chromatography Using an Amino-Bonded Silica Column. J. Agric. Food Chem. 1998, 46, 3648–3652. [Google Scholar] [CrossRef]
- Aguilera, Y.; Martin-Cabrejas, M.A.; Benitez, V.; Molla, E.; Lopez-Andreu, F.J.; Esteban, R.M. Changes in carbohydrate fraction during dehydration process of common legumes. J. Food Compos. Anal. 2009, 22, 678–683. [Google Scholar] [CrossRef]
- Wittwer, G.; Waschik, R. Estimating the economic impacts of the 2017–2019 drought and 2019–2020 bushfires on regional NSW and the rest of Australia. Aust. J. Agric. Resour. Econ. 2021, 65, 918–936. [Google Scholar] [CrossRef]
- Huang, J.; Purushothaman, R.; McBratney, A.; Bramley, H. Soil Water Extraction Monitored Per Plot Across a Field Experiment Using Repeated Electromagnetic Induction Surveys. Soil. Syst. 2018, 2, 11. [Google Scholar] [CrossRef]
- Meena, H.P.; Kumar, J.; Upadhyaya, H.D.; Bharadwaj, C.; Chauhan, S.K.; Verma, A.K.; Rizvi, A.H. Chickpea mini core germplasm collection as rich sources of diversity for crop improvement. J. SAT Agric. Res. 2010, 8, 1–5. [Google Scholar]
- Ramamoorthy, P.; Lakshmanan, K.; Upadhyaya, H.D.; Vadez, V.; Varshney, R.K. Root traits confer grain yield advantages under terminal drought in chickpea (Cicer arietinum L.). Field Crops Res. 2017, 201, 146–161. [Google Scholar] [CrossRef]
- Purdy, S.; Cunniff, J.; Maddison, A.; Jones, L.; Barraclough, T.; Castle, M.; Davey, C.; Jones, C.; Shield, I.; Gallagher, J.; et al. Seasonal Carbohydrate Dynamics and Climatic Regulation of Senescence in the Perennial Grass, Miscanthus. Bioenergy Res. 2014, 8, 28–41. [Google Scholar] [CrossRef]
- Purdy, S.J.; Maddison, A.L.; Cunniff, J.; Donnison, I.; Clifton-Brown, J. Non-structural carbohydrate profiles and ratios between soluble sugars and starch serve as indicators of productivity for a bioenergy grass. AoB Plants 2015, 7, plv032. [Google Scholar] [CrossRef]
- Merchant, A.; Richter, A.; Popp, M.; Adams, M. Targeted metabolite profiling provides a functional link among eucalypt taxonomy, physiology and evolution. Phytochemistry 2006, 67, 402–408. [Google Scholar] [CrossRef]
- Conselvan, G.B.; Fuentes, D.; Merchant, A.; Peggion, C.; Francioso, O.; Carletti, P. Effects of humic substances and indole-3-acetic acid on Arabidopsis sugar and amino acid metabolic profile. Plant Soil. 2018, 426, 17–32. [Google Scholar] [CrossRef]
- Jones, M.G.; Outlaw, W.H.; Lowry, O.H. Enzymic assay of 10 to 10 moles of sucrose in plant tissues. Plant Physiol. 1977, 60, 379–383. [Google Scholar] [CrossRef]
- R Core Team. R: A Language and Environment for Statistical Computing; R Team: Austria, Vienna, 2021. [Google Scholar]
- Kuhn, M. Building Predictive Models in R Using the caret Package. J. Stat. Softw. 2008, 28, 1–26. [Google Scholar] [CrossRef]
- Akaike, H. A new look at the statistical model identification. IEEE Trans. Autom. Control. 1974, 19, 716–723. [Google Scholar] [CrossRef]
- Aho, K.; Derryberry, D.; Peterson, T. Model selection for ecologists: The worldviews of AIC and BIC. Ecology 2014, 95, 631–636. [Google Scholar] [CrossRef] [PubMed]
- Hastie, T.; Tibshiranix, R.; Friedman, J. The Elements of Statistical Learning, Data Mining, Inference, and Prediction, 2nd ed.; Springer Series in Statistics; Springer Nature: Cham, Switzerand, 2009. [Google Scholar]
- Tripathi, A. Feature Selection Techniques in Regression Model. Available online: https://towardsdatascience.com/feature-selection-techniques-in-regression-model-26878fe0e24e (accessed on 30 November 2022).
- Heinze, G.; Wallisch, C.; Dunkler, D. Variable selection—A review and recommendations for the practicing statistician. Biom. J. 2018, 60, 431–449. [Google Scholar] [CrossRef] [PubMed]
- Ceusters, N.; Luca, S.; Feil, R.; Claes, J.E.; Lunn, J.E.; Van den Ende, W.; Ceusters, J. Hierarchical clustering reveals unique features in the diel dynamics of metabolites in the CAM orchid Phalaenopsis. J. Exp. Bot. 2019, 70, 3269–3281. [Google Scholar] [CrossRef]


| Seed Weight (g Plant−1) | HKW (g) | Seed Number (Plant−1) | ||||||
|---|---|---|---|---|---|---|---|---|
| Rainfed | Irrigated | Rainfed | Irrigated | Rainfed | Irrigated | |||
| Year 1 replicated genotypes | 4.85 | 8.26 | ** | 21.42 | 21.41 | 23.20 | 38.18 | ** |
| Year 2 replicated genotypes | 7.16 | 12.74 | ** | 21.11 | 22.4 | 34.68 | 58.36 | ** |
| Significantly different between years: | ** | ** | ** | ** | ||||
| Year 1 non-replicated genotypes | 5.15 | 8.49 | ** | 31.59 | 32.27 | 20.55 | 30.37 | ** |
| Year 2 non-replicated genotypes | 7.63 | 12.73 | ** | 15.48 | 17.18 | 53.04 | 77.10 | ** |
| Lactic Acid | Malonic Acid | Succinate | Malic Acid | GABA | Citric Acid | D-Pinitol | Chiro-Inositol | Myo-Inositol | |
|---|---|---|---|---|---|---|---|---|---|
| Year 1 replicated averages | 0.52 | 0.88 | 0.25 | 8.53 | 0.51 | 3.05 | 3.85 | 0.57 | 0.91 |
| Year 2 replicated averages | 0.32 | 0.70 | 0.97 | 6.43 | 1.00 | 1.50 | 6.97 | 0.72 | 1.12 |
| Significantly different between years: | ** | ** | ** | ** | ** | ** | ** | ** | ** |
| Year 1 non-replicated averages | 0.54 | 0.88 | 0.25 | 8.40 | 0.54 | 2.93 | 4.17 | 0.57 | 0.89 |
| Year 2 non-replicated averages | 0.30 | 0.69 | 0.96 | 6.51 | 1.04 | 1.51 | 5.87 | 0.75 | 1.07 |
| D-Glucose | D-Fructose | Sucrose | Starch | NSC | |
|---|---|---|---|---|---|
| Year 1 replicated averages | 8.06 | 8.84 | 21.97 | 76.32 | 115.2 |
| Year 2 replicated averages | 11.22 | 7.84 | 66.93 | 72.87 | 158.9 |
| Significantly different between years: | ** | ** | ** | ||
| Year 1 non-replicated averages | 9.45 | 8.71 | 21.59 | 66.46 | 106.2 |
| Year 2 non-replicated averages | 10.79 | 7.60 | 60.51 | 72.42 | 151.3 |
| Seed Number Plant−1 | Hundred-Kernel Weight | |||||||
|---|---|---|---|---|---|---|---|---|
| Year 1 | Year 2 | Year 1 | Year 2 | |||||
| Rs | Rs | Rs | Rs | |||||
| Lactose | 0.08 | 0.12 | −0.08 | 0.07 | ||||
| Malonic acid | 0.02 | 0.01 | −0.04 | 0.21 | ||||
| Succinate | 0.16 | 0.03 | −0.02 | 0.02 | ||||
| Malic acid | 0.48 | *** | −0.10 | −0.28 | −0.09 | |||
| GABA | 0.31 | 0.34 | * | −0.1 | −0.16 | |||
| Citrate | 0.09 | −0.17 | −0.2 | −0.11 | ||||
| D_pinitol | −0.58 | *** | −0.52 | *** | 0.62 | *** | 0.55 | *** |
| Chiro_inositol | −0.04 | 0.08 | 0.11 | −0.15 | ||||
| Myo_inositol | −0.07 | −0.09 | −0.06 | 0.17 | ||||
| D-glucose | −0.53 | *** | −0.11 | 0.6 | *** | 0.18 | ||
| D-fructose | −0.04 | 0.04 | 0.18 | −0.02 | ||||
| Sucrose | −0.39 | * | −0.43 | ** | 0.29 | 0.32 | * | |
| Starch | 0.31 | −0.15 | −0.53 | 0.11 | ||||
| Coefficients | |||||
|---|---|---|---|---|---|
| Estimate | Std. Error | t Value | Pr | ||
| (Intercept) | −4.81 | 13.75 | −0.35 | 0.73 | |
| GABA | 46.27 | 8.13 | 5.69 | 0.00 | *** |
| D-pinitol | −4.64 | 1.35 | −3.44 | 0.00 | ** |
| Chiro-inositol | 44.03 | 18.26 | 2.41 | 0.02 | * |
| D-fructose | 1.74 | 0.61 | 2.85 | 0.01 | ** |
| Sucrose | 1.37 | 0.38 | 3.57 | 0.00 | *** |
| Starch | 1.32 | 0.37 | 3.60 | 0.00 | *** |
| NSC | −1.29 | 0.35 | −3.71 | 0.00 | *** |
Disclaimer/Publisher’s Note: The statements, opinions and data contained in all publications are solely those of the individual author(s) and contributor(s) and not of MDPI and/or the editor(s). MDPI and/or the editor(s) disclaim responsibility for any injury to people or property resulting from any ideas, methods, instructions or products referred to in the content. |
© 2023 by the authors. Licensee MDPI, Basel, Switzerland. This article is an open access article distributed under the terms and conditions of the Creative Commons Attribution (CC BY) license (https://creativecommons.org/licenses/by/4.0/).
Share and Cite
Purdy, S.J.; Fuentes, D.; Ramamoorthy, P.; Nunn, C.; Kaiser, B.N.; Merchant, A. The Metabolic Profile of Young, Watered Chickpea Plants Can Be Used as a Biomarker to Predict Seed Number under Terminal Drought. Plants 2023, 12, 2172. https://doi.org/10.3390/plants12112172
Purdy SJ, Fuentes D, Ramamoorthy P, Nunn C, Kaiser BN, Merchant A. The Metabolic Profile of Young, Watered Chickpea Plants Can Be Used as a Biomarker to Predict Seed Number under Terminal Drought. Plants. 2023; 12(11):2172. https://doi.org/10.3390/plants12112172
Chicago/Turabian StylePurdy, Sarah J., David Fuentes, Purushothaman Ramamoorthy, Christopher Nunn, Brent N. Kaiser, and Andrew Merchant. 2023. "The Metabolic Profile of Young, Watered Chickpea Plants Can Be Used as a Biomarker to Predict Seed Number under Terminal Drought" Plants 12, no. 11: 2172. https://doi.org/10.3390/plants12112172
APA StylePurdy, S. J., Fuentes, D., Ramamoorthy, P., Nunn, C., Kaiser, B. N., & Merchant, A. (2023). The Metabolic Profile of Young, Watered Chickpea Plants Can Be Used as a Biomarker to Predict Seed Number under Terminal Drought. Plants, 12(11), 2172. https://doi.org/10.3390/plants12112172