Abstract
Habitat loss is a potential long-term effect of projected climate change for Mediterranean forest ecosystems. Here, we investigated the effectiveness of a close-to-nature silvicultural practice to conserve an old-growth white oak forest patch in Sicily (Italy) and promote regeneration dynamics. The study area, although small, is distinctive for its isolation, position and environmental characteristics. We conducted a Before–After Control–Impact (BACI) study to analyse the responses of different taxonomic groups (vascular plants and birds) to silvicultural treatments (selection thinning, no thinning), and to determine whether close-to-nature silviculture practices may cause significant shifts in the investigated communities. Specifically, we assessed the responses of (1) vascular plants by means of species diversity and taxonomic distinctness indices and (2) birds in terms of diversity, abundance and forest specialisation. Preliminary results suggest that cautious close-to-nature silviculture practice could—by mimicking natural gap dynamics—contribute to maintaining old-growth forest patches and promote oak seedling emergence without short-term detrimental impacts on biodiversity. Although the monitoring has to be repeated over the long-term, the multi-taxon approach and indices incorporating information on taxonomic relationships into diversity measures were demonstrated to be valuable tools for interpreting biotic community structure and dynamics.
1. Introduction
Mount Etna (3324 m above sea level), on the eastern coast of Sicily (Italy), is one of the most active volcanoes in the world, and the highest in continental Europe. Etnean forests have been shaped in their extent, composition and structure by more than two millennia of interactions among geological history, climate, natural disturbances and anthropogenic pressures. The almost continuous eruptive activity and anthropogenic activities (forest harvesting, wildfires, grazing, land-use changes) have been key drivers influencing forest dynamics [1] and habitat fragmentation [2] on the Etnean territory.
The importance of biodiversity conservation has led to the establishment of a network of protected areas (a regional park and some Nature Reserves, in addition to Natura 2000 sites) with different levels of protection in the Etnean territory. Protected areas now play a crucial role in proactive adaptive management for tackling climate change [3,4,5], posing new challenges for managers and decision makers of the 21st century [6]. The effects of impact caused by climate change affect forest resilience by altering the frequency and intensity of drought, wildfires, heat waves, insect and pathogen outbreaks, flash floods, wind and snowstorms. In Mediterranean ecosystems, habitat loss is one of the long-term consequences of predicted climate change.
Despite the long history of natural and anthropogenic pressures, it is still possible to find patches of old-growth forests in small and remote areas of Mount Etna. Old-growth forests are late-successional forests with high levels of structural complexity compared with early-successional forests [7,8]. They play an important role in biodiversity conservation [9] and offer a wide spectrum of ecosystem services, including carbon and water flux regulation [10,11,12,13]; moreover, they represent a reference point for improving current sustainable forest management practices [14]. Thus, the use of management practices emulating natural disturbances and dynamics has been explored in several studies aimed at maintaining, promoting and restoring old-growth attributes at the stand scale [15,16] in order to improve carbon storage [17], soil physical traits [18], tree growth [19] and the biological diversity of different taxonomic groups, such as invertebrates [20], vascular plants [21,22,23] and birds [24,25,26,27].
In this study, we focused on a relict population patch of white oak (Quercus congesta C. Presl) close to old-growth conditions within an even-aged Calabrian black pine (Pinus nigra subsp. calabrica (Delam. ex Loudon) A.E. Murray) plantation in a protected area of Etna Regional Nature Park. Pines were planted in the late 1970s as preparatory species for fostering the maintenance and regeneration of the old oak trees. The pines were not tended thereafter, resulting through time in forest canopy closure. Therefore, the forest currently consists of a two-layered stand: the upper layer is dominated by Calabrian black pines, while old white oaks occur as single isolated individuals or in small patches in the bottom layer. The interspecific competition between the tree species tends to be high, producing an all-sided suppressive effect of the top-layer pines on the lower-layer oaks. Considering that gaps in the forest canopy can play an important role in affecting the structure of forest stands and plant succession [15,28], as well as soil microclimate and nutrient cycling [17,29], in this work, the preliminary effects of a prudent thinning intervention on the pine layer carried out in 2015 were evaluated through various indicators, with respect to a control (unthinned) part of the stand.
The dispersal performance of white oak and the response of seedlings, in terms of establishment and growth, in addition to changes in understorey diversity [22,30] and cover [25,31,32,33,34] were studied; moreover, the potential distribution and composition of the ornithological community were also taken into account, as these are considered good indicators of biodiversity [35,36]. The main aim was to evaluate the possible recovery of old-growth forest patches over a long time scale and the effectiveness of regeneration of white oak, which is the basic prerequisite to maintain the local population and preserve its genetic variability.
2. Materials and Methods
2.1. Study Area
The study was carried out on Mount Egitto, a forested tephra cone located on the western flank of Etna volcano (Lat. 37°45′57″ N, Long. 14°55′40″ E). The origin of this cone has been related to the flank eruptions that occurred between Ellittico caldera (about 15 ka) and Il Piano caldera (122 BC, Plinian eruption) [37]. Mount Egitto has a surface of 8 ha and is located at altitudes ranging from 1529 to 1612 m a.s.l., surrounded by poorly vegetated lava flows produced during the 1651, 1832 and 1843 AD eruptions [38] (Figure 1). Mount Egitto is subject to a temperate oceanic bioclimate, supra-Mediterranean thermotype and hyperhumid ombrotype [39]. The soils are classified as Leptosols [40]. The forest is dominated by Calabrian black pine (Pinus nigra subsp. Calabrica) of both natural and artificial origin. The local population of black pine is referred to as a subspecies endemic to southern Italy, with a natural range extending from Calabria (Sila and Aspromonte massifs) to Sicily (Etna volcano). Calabrian black pine forests are a priority habitat (cod 9530* (Sub-)Mediterranean pine forests with endemic black pines) according to the ‘Habitats’ 92/43/EEC Directive [41]. Old white oak trees grow as single isolated individuals or form small patches within the Calabrian black pine plantation matrix. Quercus congesta is an acidophilous and orophilous deciduous oak and is endemic to Sicily, Calabria and Sardinia [42], belonging to the Quercus pubescens cycle, although recent studies have questioned the taxonomic autonomy of this species [43,44,45]. White oak forests are also a priority habitat (cod. 91AA* Eastern white oak woods) according to the above-mentioned Directive. This species is recorded as ‘least concern’ in the International Union for Conservation of Nature’s (IUCN) Red List of Threatened Species [46]. Historically, white oak forests covered vast areas in south and southeastern Europe, but their extent has undergone intense shrinkage and fragmentation due to anthropogenic and natural disturbances, such as wildfires, grazing, logging and land-use changes [47]. Today, Quercus congesta grows in mixed acidophilic stands in fragmented areas on the main mountain ranges of Sicily [48]. Among the numerous vascular plants occurring in the study area, Genista aetnensis (Raf. ex Biv.) DC.—a giant broom endemic to Corsica, Sardinia and Mount Etna—is one of the most widespread, and covers the entire southern sector of the cone. Finally, it is worth noting that Mount Egitto represents the only known Italian locality for the mushroom Sporidesmium bacidiicola Alstrup and the lichen Waynea giraltiae van den Boom [49]. Maetzke et al. [50,51] provided the following preliminary characterisation of the structural attributes of the investigated old-growth forest patch: (1) 70 old oaks with diameter at breast height (DBH) greater than 40 cm, (2) a total amount of deadwood of 30 m3 ha−1, (3) more than 60% of deadwood occurring in the latest decay classes. The occurrence of old-growth features has been linked to the combined effect of local factors, such as climate, altitude, soil, periodic volcanic ash falls and lava flows, distance to rural areas and low levels of anthropogenic pressure [50].
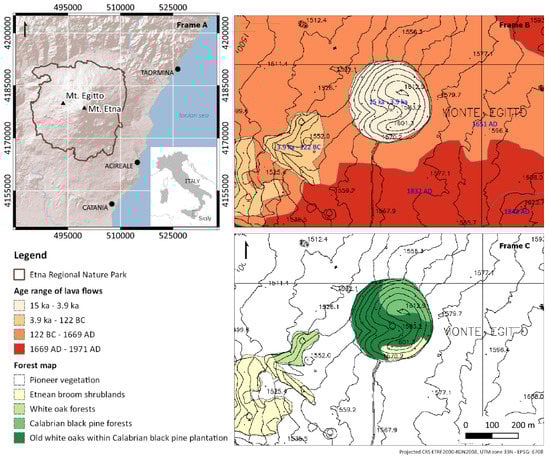
Figure 1.
(Frame A) Location of Mount Egitto on the western flank of Mount Etna volcano in Sicily (Italy), with the Etna Regional Nature Park superimposed on the shaded relief in brown; (Frame B) Historical lava flows and their ages (blue label) for Mount Egitto and its surroundings according to a geological map of Etna volcano (adapted from Branca et al. [38]); (Frame C) Forest map of the study area and its surroundings.
2.2. Survey Design
We carried out a Before–After Control–Impact (BACI) study to assess changes in the vascular plant and bird communities in response to close-to-nature silviculture practice. The monitoring activity started in May 2015 (before treatment) and ended in May 2018 (3 years after treatment). In such surveys, a BACI study is appropriate because it allows for referring changes in community diversity to an impact, rather than to natural variability [52]. Concerning the treatment, a selection thinning (T)—namely, a close-to-nature silviculture practice that favours the old white oaks (target trees) by removing their crown competitors (Calabrian black pines)—was applied in late summer/early autumn 2015. The control—i.e., no thinning (C)—sites received no intervention/practice, which represents the current management approach in the regional park.
We adopted the principle of ‘free choice of felling’ [53]: the thinning was carried out tree-by-tree on a case-by-case basis, aimed at creating a gap of 500–2000 m2 in relation to the size of oaks trees, with the goal to rid the oaks’ canopy of intersecting pine trees. A total of 10 gaps of different sizes were created, including 4 gaps of 500 m2, 3 of 1000 m2, 2 of 1500 m2 and 1 of 2000 m2. The low number of gaps was used for two reasons: firstly, the focus was only the relict population of white oak occurring as single isolated individuals or as trees grouped in small patches, and secondly, removal of canopy trees in a protected area is highly regulated by the Etna Regional Nature Park’s policy.
Based on a preliminary field survey, we first defined the thinning sites and nearby control sites (generally within a 50–100 m distance) that were the same oak–pine habitat type and had similar canopy and understorey cover patterns. The sample size was established by applying a sampling design proportional to treatment sites and forest size. Vascular plants were sampled along 11 linear, georeferenced permanent transects according to the methodological protocol of Annex I Habitat monitoring [54]. The taxonomic nomenclature followed Pignatti [55,56,57]. We conducted an inventory in May 2015 and in May 2018, reducing any possible temporal bias in data collection. Each transect consisted of adjacent 1 m2 (1 m × 1 m) plots in a repeating pattern; the total transect length varied from 26 to 52 m and was determined according to old-growth oak density, with the aim of including 1–5 old oaks per transect. In total, 7 and 4 transects were established in the thinning (~5 ha) and control (~3 ha) sites, respectively. All vascular plants (including trees, shrubs and herbaceous species) <2 m in height occurring within the transects were recorded. We made a distinction between seedlings (young plants raised from seed not yet 1 m high), saplings (young trees about 1–2 m high and 2–4 cm in dbh) and tree individuals (dbh ≥ 4 cm) [58]. Canopy coverage of each vascular plant species was also estimated by assigning one of the following twelve coverage ranges: 0–1%, 1–5%, 5–10%, 10–20%, 20–30%, 30–40%, 40–50%, 50–60%, 60–70%, 70–80%, 80–90% and 90–100%. The species observed along the transect were distinguished into nemoral and non-nemoral in accordance with their membership in the phytosociological classes Querco roboris–Fagetea sylvaticae Br.-Bl. & Vlieger in Vlieger 1937 or Quercetea ilicis Br.-Bl. in Br.-Bl., Roussine & Nègre 1952 [59,60,61].
Birds were surveyed using a point counts method [62]. Censuses were conducted during the breeding season in May 2015 and May 2018. We selected 21-point counts spaced over 50 m apart, non-randomly located across the whole study area (8 ha). Each of the 21 sampling points was surveyed 3 times in each study year. Within this period, sampling was replicated at intervals of 8 days. Each point count was characterised by the following variables: applied management (10 points were in thinning sites—with at least 25% of the area within a 25 m radius of the point having been thinned—and 11 points were in control sites), vegetation structure and composition (pine plantation coverage and number of old oaks within a 25 m radius of the point). All birds seen and/or heard were recorded over a 5 min period, and their distances were noted according to 3 bands (0–25 m, 25–50 m, >50 m). Point counts were conducted within 5 h of sunrise and in a random order across the study area, reducing any possible temporal bias in data collection. Observations of over-flying birds, i.e., those that did not land in trees or on the ground, were excluded. Additionally, migrant birds that were apparently flying high over the study area without stopping to use it stably were not counted. For the analyses, given the small size of the study area and the proximity of sampling points, we only considered birds detected within the first distance band (0–25 m) to avoid double counting among contiguous points.
2.3. Data Processing and Analysis
2.3.1. Vascular Plants
We used species and taxonomic diversity indices to analyse the short-term effects of silvicultural treatment on the vascular plant community. Five species diversity indices were calculated for each survey time (before and after treatment) at each treatment (thinning and control): the species richness, Shannon–Wiener, Pielou’s evenness, complement of the Simpson and nemoral species indices. Species richness (S) was computed by counting the number of species occurring in each sample; it is often used as a biodiversity indicator for assessing management effects [63,64]. Shannon–Wiener’s index (H′) [65] is one of the best known and most widely used of all diversity indices [66], combining species richness (the number of species present) and species abundance (the number of individuals per species). It was calculated as Equation (1):
To assess the homogeneity of each sample, Pielou’s evenness index (J′) [67] was computed as Equation (2):
where S is the total number of species recorded in each sample. The complement of the Simpson index (1 − D) [68] estimates the probability that two randomly chosen individuals from a sample belong to different species. It was computed as Equation (3):
For both H′ and 1 − D indices, pi is the relative coverage of the ith species (pi = ni/N), ni is the coverage of the ith species, and N is the total coverage. The nemoral species index (N) was computed as Equation (4):
where pi was calculated as the ratio between the coverage of the ith nemoral species (ni) and the total coverage (N). The occurrence of species strictly associated with a nemoral context on Mount Egitto may help us to understand the habitat structure and its dynamics. Conventional species diversity indices summarise the information about the relative abundances of species within a community or sample without regard to the differences between species or their degree of taxonomic relatedness [69,70]. If two communities have identical numbers of species and equivalent patterns of species abundance, but differ in terms of taxonomic diversity, it seems intuitively appropriate that the most taxonomically varied community is the more diverse [66]. Furthermore, the taxonomic diversity can reveal the effects of different forest management techniques on diversity that are not measurable by conventional indices that do not incorporate species relatedness [71]. The hierarchical Linnaean classification was used as a proxy for cladograms representing the relatedness of individual species to compute taxonomic diversity indices. For each survey time at each treatment, a composite taxonomy was compiled, and six taxonomic levels were considered (species, genus, family, order, sub-class and class). Two taxonomic diversity indices designed by Clark and Warwick [72,73] were computed from species abundances using coverage data:
where ωij is the distinctness weight given to the path length linking species i and j in the taxonomy, and s is the species observed. Average taxonomic distinctness (Δ+, Equation (5)) is defined as the average taxonomic path length between any two randomly chosen species, and is independent of species richness [72,73]. Average taxonomic distinctness (Δ+) is multiplied by species richness (S) to give the total taxonomic distinctness (sΔ+, Equation (6)). It is a useful measure of the total taxonomic breadth of a community—as a modification of species richness—that allows for species inter-relatedness [72].
We then tested the effect of the treatment (thinning, control) and time (before and after) on five species diversity indices and five taxonomic diversity indices of the vascular plants. First, we performed a normality test, checking for the normality assumption for ten indices per dataset. An unpaired two-sample t-test was performed to test the effect of the treatment (thinning vs. control) at fixed survey times. The homogeneity of variances was first checked using a F-test. Pairwise comparisons were applied to test the effect of the time (before vs. after) per fixed treatment: we performed paired-sample t-tests and—when the datasets were non-normally distributed—the Wilcoxon signed-rank test. The relationships between the ten diversity indices were examined by correlation analysis based on Pearson’s product–moment correlation coefficient (r). The analyses were carried out using the software program R, version 3.6.3, packages: car, Hmisc, nortest, pastecs, psych and vegan [74]. For all statistical analyses, the significance level was at p < 0.05.
2.3.2. Birds
The bird community was described by the species frequency and abundance of individuals at each survey time. A non-parametric Wilcoxon signed-rank test was used to test the effect of time (before vs. after) on total species richness and total abundances, as these data did not meet the assumptions of parametric statistics. We described the degree of forest specialisation of bird communities. Specifically, we narrowed down the full list of birds to forest specialists—that is, species linked to forest habitats, excluding species that also use other, non-forested habitats—thus calculating three indices: species richness, abundance and Woodiness Bird Community Index (WBCI). The last derives directly from scores that describe the response of common species to local wood-cover, at the Italian scale [75]. WBCI was calculated as the sum of the scores of all forest specialists in each point count: the higher the WBCI, the more specialised the forest bird community. We also used the scores of the species defined in Londi et al. [75] to objectively select forest specialists, that is, the species whose score exceeded 0.5. We performed paired-sample t-tests to test the effect of time on the forest specialisation community indices, as these data met the assumptions of parametric statistics. Finally, we performed general linear models (GLMs) [76] to test for effects of the environmental variables, namely, treatment, vegetation structure and composition (pine plantation coverage, number of old-growth oaks), on the bird community. We ran models for all possible combinations of the variables (including survey time) and selected the best model according to Akaike’s information criterion corrected for small samples (AICc); we also examined models where ΔAICc < 2 [77]. GLMs were calculated for the total species richness, total abundance and the three forest specialisation indices. We also calculated GLMs for a total of 16 individual bird species (abundance data for all those averaged more than for individuals per survey time, presence/absence data for those averaged 2–4 individuals per survey time). We used Gaussian distribution (link function = identity) in WBCI models, negative binomial distribution (link function = logit) in models for species with presence/absence data, and Poisson distribution (link function = log) in all other models [78]. All statistical analyses were performed with R version 3.6.3 software, using the package AICcmodavg [74]; the significance level was set at p < 0.05.
3. Results
3.1. Vascular Plants
During the study period, a total of 45 vascular plant taxa, belonging to 40 genera and 22 families, were recorded (Table S1 in the Supplementary Material). Poaceae, Fabaceae, Rosaceae and Asteraceae were the families with the largest number of species (10, 6, 5 and 3, respectively), together accounting for 53% of all recorded species; the remaining 18 families contained only 1 or 2 species. Before treatment, we recorded a total of 31 vascular plant species, belonging to 28 genera and 14 families. After treatment, the checklist included 40 vascular plant taxa, belonging to 37 genera and 20 families. Overall, we recorded 14 new occurrences of vascular plant taxa, accounting for 35% of the checklist after treatment (Table S1): 10 species were found in thinning sites (Allium longispathum, Galanthus nivalis, Muscari commutatum, Crepis leontodontoides, Doronicum orientale, Linaria purpurea, Erysimum aetnense, Ranunculus neapolitanus, Fragaria vesca subsp. vesca, Vicia cracca), 1 in controls (Myosotis sylvatica subsp. sylvatica) and 3 in both sites (Anthoxanthum odoratum, Galium aparine and Vicia disperma); in contrast, 5 species disappeared from the sites following treatment (Festuca circummediterranea, Phleum hirsutum subsp. ambiguum, Monotropa hypopitys, Quercus ilex and Potentilla calabra). Moreover, 43% of the new occurrences established during the period 2015–2018 were nemoral species strictly associated with the local species pool (Table S1).
After treatment, white oak seedlings increased their relative coverage by 22–335% in thinning sites and 35–120% in control sites, while white oak saplings increased their relative coverage by 25–155% in thinning sites and 44–330% in control sites.
None of the 7 diversity indices showed significant differences (p > 0.05) between the treatment (thinning) and the control per survey time. Results from the pairwise comparison indicated a significant effect of time (p < 0.05) following thinning treatment in only 3 indices: species richness (S), Pielou’s evenness (J′) and total taxonomic distinctness (sΔ+) (Table 1). After the treatment, S and sΔ+ were on average 28% and 30% higher in thinning and in control sites, respectively. J′ decreased ca. 10%, while nemoral species (N) increased ca. 15% in both sites during the 3 years of monitoring. Average taxonomic distinctness slightly increased after treatment (Table 1), and Δ+ values were within the 95% confidence funnel (p > 0.05) in all sites (Figure 2), suggesting a good degree of taxonomic stability. Following treatment, values of Δ+ for all control sites fell below the theoretical mean, indicating that the control sites had lower average taxonomic range than most of the thinning sites and the entire study area.

Table 1.
Descriptive statistics of the diversity indices computed before and after the application of silvicultural treatment. Results of paired t-tests under normal distribution and Wilcoxon signed-rank tests under non-normal distribution.
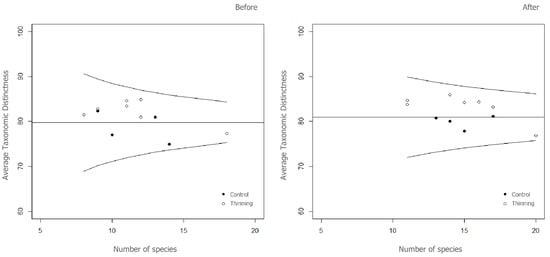
Figure 2.
Funnel plots showing average taxonomic distinctness (Δ+) versus number of species before and after treatment for vascular plants. The 95% probability funnel is shown as curved lines, while the theoretical mean is shown as a horizontal line. Filled and empty points represent the control and treatment (Thinning), respectively.
The correlations among diversity indices computed for different datasets are shown in Tables S2–S4 in the Supplementary Material. No general patterns were detected when species diversity and taxonomic distinctness indices were correlated in each dataset.
3.2. Birds
Overall, 29 bird species were recorded (Table 2). A total of 25 species were recorded before treatment, 26 after treatment, and 22 were present at both survey times. For the 0–25 m band, a total of 21 species were detected (Table 2); 19 and 18 species were recorded before and after treatment, respectively, while 16 species were present at both survey times. Upupa epops, Lullula arborea, Phoenicurus ochruros, Sylvia cantillans, Pica pica, Corvus cornix, Linaria cannabina and Emberiza cirlus that occurred along the forest’s edge are typical of open or shrubby habitats. Other bird species were associated with wooded areas. Before treatment, Periparus ater, Cyanistes caeruleus and Phylloscopus collybita were the most common species, with frequencies of occurrence higher than 0.50; Sylvia atricapilla was also rather common, with a frequency of 0.48, followed by Troglodytes troglodytes, Sitta europaea and Certhia brachydactyla, with frequencies close to 0.30. After treatment, C. caeruleus, P. collybita, P. ater and C. brachydactyla were the most common species, with a frequency higher than 0.50, followed by T. troglodytes, S. atricapilla, S. europaea and Fringilla coelebs, with frequencies between 0.30 and 0.50. P. ater and C. caeruleus were the most abundant species in both survey times; P. collybita was also abundant across time, followed by S. atricapilla, C. brachydactyla, S. europaea and T. troglodytes. Selection thinning had a significant positive effect on C. brachydactyla and F. coelebs. The pine plantation had a significant positive effect on Erithacus rubecula and S. atricapilla, and a significant negative effect on C. brachydactyla, F. coelebs and S. europaea. Following treatment, we observed a marked increase (ca. four times) of Garrulus glandarius in terms of frequency and abundance (Table 2). The species richness and abundance of the bird community observed before the treatment were not significantly different compared to those observed after the treatment; furthermore, we found no significant effect of environmental variables on these community indices (Table 3). Finally, no significant effect of the time and environmental variables was detected on the forest specialisation community indices (Table 4). Our results show that the list of the most common and abundant species—as well as forest specialisation community indices—seemed to remain relatively unchanged despite the treatment, suggesting that the bird community remained stable over time.
Table 2.
Bird community and forest specialist species recorded on Mount Egitto. Frequency (number of points with presence/total number of points) and abundance (number of individuals per species per point) of birds detected in the first distance band (0–25 m) before and after treatment. Results of GLMs are also shown.
Table 3.
Results of a Wilcoxon signed-rank test under non-normal distribution to check for differences in community indices between the two survey times per count station. Results of GLMs are also shown.
Table 4.
Results of a paired t-test under normal distribution to check for differences in forest specialisation community indices between the two survey times per count station. Results of GLMs are also shown.
4. Discussion
Given that the objective of the ongoing work is to evaluate the effectiveness of natural forestry in maintaining the relict population of white oak, the results will be analysed in relation to the preliminary effects that the first interventions have had, albeit in a short time. The close-to-nature forestry approach was chosen in the belief that the relict stand of old oak should be freed from competition in a very prudent and progressive way. Therefore, the first thinning intervention was very cautious and limited in space, with the awareness that we will have to proceed carefully also in future interventions. As discussed below, our considerations are still very limited, given the short period of observations. On the other hand, it was necessary to evaluate the situation before and shortly after thinning so as to have a basis for future decision making, using a trial-and-error method. For the purposes of the ongoing evaluation, we also checked which indicators were the most suitable to evaluate possible changes.
4.1. Vascular Plants
The results showed that the increased light availability resulting from thinning and soil surface disturbance by silvicultural operations could have a slightly positive effect on the emergence of both nemoral and non-nemoral seedlings in the treated areas. In particular, we observed an increase in the coverage of white oak seedlings after thinning that was more than double than in control plots. Considering these data, it seems that at least the initial phases of white oak recruitment are rather effective in gaps, as well as under a closed canopy, with a notable numerical increase of both seedlings and saplings, though the rate of the latter is significantly higher in the control. As a matter of fact, however, it must be distinguished between regeneration and effective recruitment. Tree regeneration can be decomposed into several subprocesses, starting with seed production, followed by seed dispersal, seed storage, germination, establishment of seedlings, growth of seedlings and saplings, and finally, the recruitment of small trees that exceed a certain measurement threshold (see, e.g., Price et al. [79]). In our study, despite the numerical abundance of saplings in control plots, no young tree was actually recorded, suggesting that the regeneration processes stop anyway at this stage. Most likely, due to unsuitable light conditions caused by the excessively closed canopy, saplings progressively decline to death, without ever managing to develop into adults. On the contrary, it is expected that thanks to the clearings created in the thinned plots, at least a rate of the established saplings can grow up and move to the successive development classes, therefore contributing to replace the senescent oak trees. According to that, in order to validate our assumptions and eventually adopt the necessary adjustments, it is of basic importance to go on with regular and continued monitoring in the next years.
Vascular plants showed a slight increase in species richness values only in thinned sites, probably due to a more heterogeneous environment—new species enter, others disappear and some slightly change their density. Higher plant species’ richness in managed rather than in unmanaged forests has been reported in several small-scale forestry studies from temperate and boreal regions [23,63,64,80]. Several factors—and combinations of them—may explain the positive impact of selection thinning on species richness. In fact, vascular plants might benefit from (1) higher availability and heterogeneity of resources (such as light and nutrients) because of canopy openings [63,64,81,82,83,84,85], (2) litter removal and soil disturbance [23,82,83], (3) seed bank activation following soil disturbance [86,87] and (4) lower amounts of pine litter inhibiting seed germination and seedling performance [88,89]. Three years after selection thinning, evenness was significantly lower; this result could be explained by the increase in plant species richness. White oak was the most common species to emerge after thinning. Furthermore, nemoral species showed slightly higher, though not significant, values in thinning sites. This result disagrees with the findings of some studies that indicated that specialist species are expected to be negatively influenced by small patch size compared to generalist species with a wider tolerance [90,91]. Mount Egitto is like a wooded island that has risen within recent lava fields, by far colonised by sparse light-demanding herbaceous and subshrub vegetation. The lack of forests in the surrounding areas can, therefore, explain the non-statistically-significant increase in nemoral species.
Although several studies have shown that average taxonomic distinctness is suitable to monitor the effects of natural and anthropogenic disturbances on biotic communities [70,73,92,93], in our study, only total taxonomic distinctness was able to discern significant changes in the vascular plant community at least three years after selection thinning. The slight but significant increase in species richness and total taxonomic distinctness may be mainly due to an increase in non-nemoral species from the adjacent areas towards the cone, given the non-significant increase in the nemoral species index. This evidence suggests that the increment or decrement in the number of species is one of the best disturbance indices and is, therefore, essential when differentiating an ecosystem’s ecological status [94]. These results can be considered a starting point to address forest management towards the maintenance or improvement of plant community biodiversity.
4.2. Birds
Despite its small forest patch size, Mount Egitto hosts a rich and heterogeneous bird community. Total bird species richness was higher compared to those recorded in similar forest habitats (e.g., mature oak wood, pine wood, pine wood mixed with broadleaved trees) on Mount Etna [95,96] and close to the highest richness values reported in the woods of the whole of Sicily [32]. The impact of the treatment on the bird community showed no significant variation based on the set of diversity indices used, although the total richness appeared to increase in species linked to pine cover and those typical of open habitats and forest edges. We also recorded an increase in frequency and abundance of some forest specialists in thinned sites, such as C. brachydactyla (associated with old trees and mature forest stands) and F. coelebs. On the other hand, while G. glandarius increased over time, there was no significant evidence for the role of thinning in this process. Our findings partially contrast with those obtained in other studies of bird responses to thinning in different regions [24,97,98,99]. We should also take into account that due to the small size of the study area, some changes could remain undetected in statistical analyses: S. europaea, a species associated with mature stands, showed a quasi-significant (p < 0.1) positive effect from selection thinning, and Sylvia cantillans seemed to have increased after thinning (the species was recorded in four points in 2018, vs. only two points in 2015), though analyses did not show significant effects. However, it is important to note that our forest patch is close to old-growth conditions with respect to previously cited studies, and that the oaks stands positively affect specialist species’ richness and abundance [100]. Moreover, large old trees play a fundamental role in driving small-scale environmental heterogeneity and generating the sets of characteristics suitable for cavity nesters or bark-feeding species [101]. As a result, invertebrates and arthropods could proliferate because of a higher abundance of suitable microhabitats, enhancing the food availability for various bird guilds. Our findings are consistent with previous studies [100,101,102,103] showing that forest heterogeneity in both age and structure has important positive effects on overall richness and specialist species’ richness. The lack of major significant differences resulting from silvicultural treatment in the computed indices—as well as for bird species themselves—suggests that selection thinning as practiced on our study area did not change the quality of the habitat for breeding bird populations or communities. However, the increase of Garrulus glandarius—which is a very efficient acorn disperser that hides seeds underground, especially in areas where seed predation risk is low—might have influenced the emergence of white oak seedlings [104,105].
5. Conclusions
The results presented in this paper, though preliminary, show that close-to-nature silviculture intervention—by mimicking natural small-scale gap dynamics—may be safely applied without detrimental impacts on biodiversity in the short-term. The taxonomic distinctness and species diversity indices provide helpful information about biodiversity assessment, and their combined use for monitoring plant community changes and management techniques’ effects on forest ecosystems should be promoted.
The intervention has not appeared to be significantly effective in increasing ornithological biodiversity. However, it appears that changes in the structure of vegetation through silvicultural interventions may have promoted changes at the level of a single bird species. Although our observations were restricted to the first three years following treatment, current dynamics lead us to justify further monitoring activity over time.
The initial response of understorey vegetation is assumed to be a combination of the response to the disturbance of silvicultural operations and changes in the availability of resources, such as light and water [16]. However, it seems that the interventions carried out, and above all the short time lapse of monitoring, were insufficient for more in-depth evaluations of shifts in the vascular plant and bird communities. Nevertheless, our data seem to confirm that governance and management for preserving and favouring ecosystem integrity of old-growth forest patches should focus on dedicated silvicultural treatments aimed at increasing the diversity of plant and bird communities, and hopefully improve their resilience to climate change [4,11,50,106].
We believe that this work can contribute to responding to the request of deepening guidelines and techniques aimed at preserving populations of high compositional and structural value, which both human disturbances and the ongoing climatic change can put at risk of conservation. Although there are numerous references in the scientific literature, this case study concerns a forest community that is peculiar for several reasons, such as the importance of this endemic oak for biodiversity, the geographical position at the southernmost edge of the distribution range of the species, and finally, the application of a long-term forestry project, of which we presented the first steps and outcomes. Moreover, the results obtained contribute to the understanding of Mediterranean old-growth forests, the management of which should be geared towards maintaining biodiversity. Local decision makers and managers of protected areas can benefit from these results to address an adequate management of old-growth forests, also in light of evidence that climate change may interact with forest resilience and management in multifaceted ways.
Supplementary Materials
The following supporting information can be downloaded at: https://www.mdpi.com/article/10.3390/plants12102053/s1, Table S1: Taxonomy dataset of the vascular plant community recorded in Mount Egitto before and after treatment. We also indicated nemoral species having their optima in the forest environment of the study area; Table S2: Pearson’s correlations between the diversity indices computed before treatment; Table S3: Pearson’s correlations between the diversity indices computed after treatment in the thinning sites; Table S4: Pearson’s correlations between the diversity indices computed in the control sites.
Author Contributions
Conceptualisation, F.G.M. and G.S.; methodology, S.S., F.G.M. and G.S.; collection, analysis and interpretation of vascular plant data, G.S. and S.V.; collection, analysis and interpretation of bird data, G.L.; data processing, analysis and leading the manuscript writing, S.S.; review and editing, S.S., G.L., D.S.L.M.V., F.G.M., S.V. and G.S.; supervision, F.G.M., G.S. and D.S.L.M.V. All authors have read and agreed to the published version of the manuscript.
Funding
The design of the study and data collection were supported by the Etna Regional Nature Park Authority through a dedicated internal fund for environmental protection.
Institutional Review Board Statement
Not applicable.
Informed Consent Statement
Not applicable.
Data Availability Statement
The data presented in this study are available in the article and Supplementary Materials.
Acknowledgments
Thanks are due to the Italian Academy of Forest Sciences for its scientific support and cooperation in carrying out this study. The authors sincerely thank the Etna Regional Nature Park Authority and the Territorial Service of Catania of the Regional Department for Rural and Territorial Development of the Sicilian Region Authority for their active support.
Conflicts of Interest
The authors declare no conflict of interest. The funders had no role in the design of the study; in the collection, analyses or interpretation of data; in the writing of the manuscript; or in the decision to publish the results.
References
- Poli Marchese, E.; Distefano, C. Forests in a changing environment on the Etna volcano. In Responses of Forest Ecosystems to Environmental Changes; Teller, A., Mathy, P., Jeffers, J.N.R., Eds.; Springer: Dordrecht, The Netherlands, 1992; pp. 576–577. [Google Scholar] [CrossRef]
- Wade, T.G.; Riitters, K.H.; Wickham, J.D.; Jones, K.B. Distribution and causes of global forest fragmentation. Conserv. Ecol. 2003, 7, 2. Available online: http://www.jstor.org/stable/26271943 (accessed on 14 February 2020). [CrossRef]
- Sferlazza, S.; Maetzke, F.G.; Miozzo, M.; La Mela Veca, D.S. Resilience of Mediterranean forests to climate change. In Mediterranean Identities—Environment, Society, Culture; Fuerst-Bjeliš, B., Ed.; IntechOpen: Rijeka, Croatia, 2017; pp. 263–282. [Google Scholar] [CrossRef]
- Barredo, J.I.; Caudullo, G.; Dosio, A. Mediterranean habitat loss under future climate conditions: Assessing impacts on the Natura 2000 protected area network. Appl. Geogr. 2016, 75, 83–92. [Google Scholar] [CrossRef]
- Klausmeyer, K.R.; Shaw, M.R. Climate change, habitat loss, protected areas and the climate adaptation potential of species in Mediterranean ecosystems worldwide. PLoS ONE 2009, 4, e6392. [Google Scholar] [CrossRef] [PubMed]
- Sferlazza, S.; Maltese, A.; Ciraolo, G.; Dardanelli, G.; Maetzke, F.G.; La Mela Veca, D.S. Forest accessibility, Madonie mountains (northern Sicily, Italy): Implementing a GIS decision support system. J. Maps 2021, 17, 464–473. [Google Scholar] [CrossRef]
- Franklin, J.F.; van Pelt, R. Spatial aspects of structural complexity in old-growth forests. J. For. 2004, 102, 22–28. [Google Scholar]
- Peterken, G.F. Natural Woodland: Ecology and Conservation in Northern Temperate Regions; Cambridge University Press: Cambridge, UK, 1996. [Google Scholar]
- Lindenmayer, D.B.; Franklin, J.F. Conserving Forest Biodiversity. A Comprehensive Multiscaled Approach; Island Press: Washington, DC, USA, 2002. [Google Scholar]
- Burrascano, S.; Keeton, W.S.; Sabatini, F.M.; Blasi, C. Commonality and variability in the structural attributes of moist temperate old-growth forests: A global review. For. Ecol. Manag. 2013, 291, 458–479. [Google Scholar] [CrossRef]
- Keeton, W.S. Source or sink? Carbon dynamics in eastern oldgrowth forests and their role in climate change mitigation. In Ecology and Recovery of Eastern Oldgrowth Forests; Barton, M.A., Keeton, W.S., Eds.; Island Press: Washington, DC, USA, 2019; pp. 267–288. [Google Scholar] [CrossRef]
- Liu, X.; Chen, X.; Li, R.; Long, F.; Zhang, L.; Zhang, Q.; Li, J. Water-use efficiency of an old-growth forest in lower subtropical China. Sci. Rep. 2017, 7, 42761. [Google Scholar] [CrossRef]
- Marchetti, M.; Tognetti, R.; Lombardi, F.; Chiavetta, U.; Palumbo, G.; Sellitto, M.; Colombo, C.; Iovieno, P.; Alfani, A.; Baldantoni, D.; et al. Ecological portrayal of old-growth forests and persistent woodlands in the Cilento and Vallo di Diano National Park (southern Italy). Plant Biosyst. 2010, 144, 130–147. [Google Scholar] [CrossRef]
- Sabatini, F.M.; Burrascano, S.; Tuomisto, H.; Blasi, C. Ground Layer Plant Species Turnover and Beta Diversity in Southern-European Old-Growth Forests. PLoS ONE 2014, 9, e95244. [Google Scholar] [CrossRef]
- Franklin, J.F.; Spies, T.; van Pelt, R.; Carey, A.B.; Thornburgh, D.A.; Berg, D.R.; Lindenmayer, D.B.; Harmon, M.E.; Keeton, W.S.; Shaw, D.C.; et al. Disturbances and structural development of natural forest ecosystems with silvicultural implications, using Douglas-fir forests as an example. For. Ecol. Manag. 2002, 155, 399–423. [Google Scholar] [CrossRef]
- Bauhus, J.; Puettmann, K.; Messier, C. Silviculture for old-growth attributes. For. Ecol. Manag. 2009, 258, 525–537. [Google Scholar] [CrossRef]
- Sferlazza, S.; Maetzke, F.G.; Iovino, M.; Baiamonte, G.; Palmeri, V.; La Mela Veca, D.S. Effects of traditional forest management on carbon storage in a Mediterranean holm oak (Quercus ilex L.) coppice. iForest 2018, 11, 344–351. [Google Scholar] [CrossRef]
- Cullotta, S.; Bagarello, V.; Baiamonte, G.; Gugliuzza, G.; Iovino, M.; La Mela Veca, D.S.; Maetzke, F.G.; Palmeri, V.; Sferlazza, S. Comparing different methods to determine soil physical quality in a Mediterranean forest and pasture land. Soil Sci. Soc. Am. J. 2016, 80, 1038–1056. [Google Scholar] [CrossRef]
- Cabon, A.; Mouillot, F.; Lempereur, M.; Ourcival, J.; Simioni, G.; Limousin, J. Thinning increases tree growth by delaying drought-induced growth cessation in a Mediterranean evergreen oak coppice. For. Ecol. Manag. 2018, 409, 333–342. [Google Scholar] [CrossRef]
- Franklin, C.M.A.; Macdonald, S.E.; Nielsen, S.E. Can retention harvests help conserve wildlife? Evidence for vertebrates in the boreal forest. Ecosphere 2019, 10, e02632. [Google Scholar] [CrossRef]
- Burrascano, S.; Ripullone, F.; Bernardo, L.; Borghetti, M.; Carli, E.; Colangelo, M.; Gangale, C.; Gargano, D.; Gentilesca, T.; Luzzi, G.; et al. It’s a long way to the top: Plant species diversity in the transition from managed to old-growth forests. J. Veg. Sci. 2017, 29, 98–109. [Google Scholar] [CrossRef]
- Liira, J.; Sepp, T.; Parrest, O. The forest structure and ecosystem quality in conditions of anthropogenic disturbance along productivity gradient. For. Ecol. Manag. 2007, 250, 34–46. [Google Scholar] [CrossRef]
- Paillet, Y.; Berges, L.; Hjältén, J.; Ódor, P.; Avon, C.; Bernhardt-Römermann, M.; Bijlsma, R.; De Bruyn, L.; Fuhr, M.; Grandin, U.; et al. Biodiversity differences between managed and unmanaged forests: Meta-analysis of species richness in Europe. Conserv. Biol. 2010, 24, 101–112. [Google Scholar] [CrossRef]
- Camprodon, J.; Brotons, L. Effects of undergrowth clearing on the bird communities of the northwestern Mediterranean coppice holm oak forests. For. Ecol. Manag. 2006, 221, 72–82. [Google Scholar] [CrossRef]
- Gil-Tena, A.; Brotons, L.; Saura, S. Effects of forest landscape change and management on the range expansion of forest bird species in the Mediterranean region. For. Ecol. Manag. 2010, 259, 1338–1346. [Google Scholar] [CrossRef]
- Quine, C.P.; Fuller, R.J.; Smith, K.W.; Grice, P.V. Stand management: A threat or opportunity for birds in British woodland? Ibis 2007, 149, 161–174. [Google Scholar] [CrossRef]
- Thompson, I.D.; Hogan, H.A.; Montevecchi, W.A. Avian communities of mature balsam fir forests in Newfoundland: Age-dependence and implications for timber harvesting. Condor 1999, 101, 311–323. [Google Scholar] [CrossRef]
- Gray, N.A.; Spies, T.A.; Pabs, R.J. Canopy gaps affect long-term patterns of tree growth and mortality in mature and old-growth forests in the Pacific Northwest. For. Ecol. Manag. 2012, 281, 111–120. [Google Scholar] [CrossRef]
- Muscolo, A.; Sidari, M.; Mercurio, R. Influence of gap size on organic matter decomposition, microbial biomass and nutrient cycle in Calabrian pine (Pinus laricio, Poiret) stands. For. Ecol. Manag. 2007, 242, 412–418. [Google Scholar] [CrossRef]
- Schumann, M.E.; White, A.S.; Witham, J.W. The effects of the harvest-created gaps on plant species diversity, composition, and abundance in a Maine oak-pine forest. For. Ecol. Manag. 2003, 176, 543–561. [Google Scholar] [CrossRef]
- Dagan, U.; Izhaki, I. Understory vegetation in planted pine forests governs bird community composition and diversity in the eastern Mediterranean region. For. Ecosyst. 2019, 6, 29. [Google Scholar] [CrossRef]
- La Mantia, T.; Lo Duca, R.; Massa, B.; Nocentini, S.; Rühl, J. La biodiversità dei boschi siciliani. Parte I: L’avifauna. Ital. J. For. Mt. Environ. 2014, 69, 173–193. [Google Scholar]
- Sweeney, O.F.M.D.; Wilson, M.W.; Irwin, S.; Kelly, T.C.; O’Halloran, J. Breeding bird communities of second-rotation plantations at different stages of the forest cycle. Bird Stud. 2010, 57, 301–314. [Google Scholar] [CrossRef]
- Tellini Florenzano, G.; Campedelli, T.; Cutini, S.; Londi, G. Diversità ornitica nei cedui di cerro utilizzati e in conversione: Un confronto nell’Appennino settentrionale. Forest@ 2012, 9, 185–197. [Google Scholar] [CrossRef]
- Gregory, R. Birds as biodiversity indicators for Europe. Significance 2006, 3, 106–110. [Google Scholar] [CrossRef]
- Sekercioglu, C.H. Increasing awareness of avian ecological function. Trends Ecol. Evol. 2006, 21, 464–471. [Google Scholar] [CrossRef] [PubMed]
- Favalli, M.; Karátson, D.; Mazzarini, F.; Pareschi, M.T.; Boschi, E. Morphometry of scoria cones located on a volcano flank: A case study from Mt. Etna (Italy), based on high-resolution LiDAR data. J. Volcanol. Geotherm. Res. 2009, 186, 320–330. [Google Scholar] [CrossRef]
- Branca, S.; Coltelli, M.; Groppelli, G.; Lentini, F. Geological map of Etna volcano, 1:50,000 scale. Ital. J. Geosci. 2011, 130, 265–291. [Google Scholar] [CrossRef]
- Rivas-Martinez, S.; Rivas-Saenz, S.; Penas, A. Worldwide bioclimatic classification system. Glob. Geobot. 2011, 1, 1–634. [Google Scholar]
- IUSS Working Group WRB. World Reference Base for Soil Resources 2014, Update 2015. International Soil Classification System for Naming Soils and Creating Legends for Soil Maps; World Soil Resources Reports No. 106; FAO: Rome, Italy, 2015. [Google Scholar]
- Biondi, E.; Blasi, C.; Burrascano, S.; Casavecchia, S.; Copiz, R.; Del Vico, E.; Galdenzi, D.; Gigante, D.; Lasen, C.; Spampinato, G.; et al. Italian Interpretation Manual of the 92/43/EEC Directive Habitats; Ministero dell’Ambiente e della Tutela del Territorio e del Mare: Rome, Italy, 2010. [Google Scholar]
- Brullo, S.; Guarino, R.; Siracusa, S. Revisione tassonomica delle querce caducifoglie della Sicilia. Webbia 1999, 54, 1–72. [Google Scholar] [CrossRef]
- Musarella, C.M.; Cano-Ortiz, A.; Pinar Fuentes, J.C.; Navas-Urena, J.; Pinto Gomes, C.J.; Quinto-Canas, R.; Cano, E.; Spampinato, G. Similarity analysis between species of the genus Quercus L. (Fagaceae) in southern Italy based on the fractal dimension. PhytoKeys 2018, 113, 79–95. [Google Scholar] [CrossRef]
- Di Pietro, R.; Conte, A.L.; Di Marzio, P.; Gianguzzi, L.; Spampinato, G.; Caldarella, O.; Fortini, P. A multivariate morphometric analysis of diagnostic traits in southern Italy and Sicily pubescent oaks. Folia Geobot. 2020, 55, 163–183. [Google Scholar] [CrossRef]
- Di Pietro, R.; Conte, A.L.; Di Marzio, P.; Fortini, P.; Farris, E.; Gianguzzi, L.; Müller, M.; Rosati, L.; Spampinato, G.; Gailing, O. Does the genetic diversity among pubescent white oaks in southern Italy, Sicily and Sardinia islands support the current taxonomic classification? Eur. J. For. Res. 2020, 140, 355–371. [Google Scholar] [CrossRef]
- The IUCN Red List of Threatened Species. Available online: https://www.iucnredlist.org/ (accessed on 11 May 2020).
- Facioni, L.; Burrascano, S.; Del Vico, E.; Rosati, L.; Tilia, A.; Blasi, C. Phytosociological analysis of white oak (Quercus pubescens s.l.) woodlands and related successional stages: Spatial patterns and their drivers. Phytocoenologia 2015, 45, 325–364. [Google Scholar] [CrossRef]
- Camerano, P.; Cullotta, S.; Varese, P. Strumenti Conoscitivi per la Gestione delle Risorse Forestali della Sicilia. Tipi Forestali; Litograf Editor: Città di Castello, Italy, 2011; ISBN 978-88-905700-2-5. [Google Scholar]
- Ravera, S.; Vizzini, A.; Cogoni, A.; Aleffi, M.; Benesperi, R.; Bianchi, E.; von Brackel, W.; Cataldo, D.; D’Antonio, C.; Di Nuzzo, L.; et al. Notulae to the Italian flora of algae, bryophytes, fungi and lichens: 5. Ital. Bot. 2018, 5, 31–43. [Google Scholar] [CrossRef]
- Maetzke, F.G.; Spampinato, G.; Londi, G.; Vinciguerra, S. Approccio alla caratterizzazione di un lembo di bosco vetusto: Il caso di Monte Egitto (Monte Etna). Ital. J. For. Mt. Environ. 2017, 72, 169–194. [Google Scholar] [CrossRef]
- Maetzke, F.G.; Spampinato, G.; Londi, G.; Vinciguerra, S.; Sferlazza, S. Programmare la selvicoltura in un bosco vetusto all’interno di un cratere secondario del Monte Etna: Primi risultati. In La Foresta che Cambia: Ricerca, Qualità della Vita e Opportunità, Proceedings of the XI SISEF National Congress, Rome, Italy, 10–13 October 2017; Fares, S., Alivernini, A., Chianucci, F., Ferrara, C., Marchi, M., Sallustio, L., Bucci, G., Eds.; The Italian Society of Silviculture and Forest Ecology: Rome, Italy, 2017; Available online: http://www.sisef.it/sisef/xi-congresso (accessed on 9 March 2020).
- Stewart-Oaten, A.; Murdoch, W.W.; Parker, K.R. Environmental impact assessment: Pseudoreplication in time? Ecology 1986, 67, 929–940. [Google Scholar] [CrossRef]
- Schutz, J. Close-to-nature silviculture: Is this concept compatible with species diversity? Forestry 1999, 72, 359–366. [Google Scholar] [CrossRef]
- Gigante, D.; Attorre, F.; Venanzoni, R.; Acosta, A.T.R.; Agrillo, E.; Aleffi, M.; Alessi, N.; Allegrezza, M.; Angelini, P.; Angiolini, C.; et al. A methodological protocol for Annex I Habitats monitoring: The contribution of Vegetation science. Plant Sociol. 2016, 53, 77–87. [Google Scholar] [CrossRef]
- Pignatti, S. Flora d’Italia, 2nd ed.; Edagricole-Edizioni Agricole di New Business Media srl: Milano, Italy, 2017; Volume 1, ISBN 978-88-506-5242-6. [Google Scholar]
- Pignatti, S. Flora d’Italia, 2nd ed.; Edagricole-Edizioni Agricole di New Business Media srl: Milano, Italy, 2017; Volume 2, ISBN 978-88-506-5243-3. [Google Scholar]
- Pignatti, S. Flora d’Italia, 2nd ed.; Edagricole-Edizioni Agricole di New Business Media srl: Milano, Italy, 2018; Volume 3, ISBN 978-88-506-5244-0. [Google Scholar]
- Forestry Glossary. Available online: https://cfs.nrcan.gc.ca/terms#wb-auto-4 (accessed on 2 May 2020).
- Brullo, S.; Guarino, R.; Minissale, P.; Siracusa, G.; Spampinato, G. Syntaxonomical analysis of the beech forests from Sicily. Ann. Bot. 1999, 57, 121–132. [Google Scholar]
- Brullo, S.; Giusso Del Galdo, G.; Minissale, P.; Siracusa, G.; Spampinato, G. Considerazioni sintassonomiche e fitogeografiche sulla vegetazione della Sicilia. Boll. Accad. Gioenia Sci. Nat. 2002, 35, 325–359. [Google Scholar]
- Prodromo della Vegetazione d’Italia. Available online: https://www.prodromo-vegetazione-italia.org/ (accessed on 20 April 2020).
- Bibby, C.J.; Burgess, N.D.; Hill, D.A.; Mustoe, S.H. Bird Census Techniques, 2nd ed.; Academic Press: London, UK, 2000. [Google Scholar]
- Boch, S.; Prati, D.; Müller, J.; Socher, S.; Baumbach, H.; Buscot, F.; Gockel, S.; Hemp, A.; Hessenmöller, D.; Kalko, E.K.V.; et al. High plant species richness indicates management-related disturbances rather than the conservation status of forests. Basic Appl. Ecol. 2013, 14, 496–505. [Google Scholar] [CrossRef]
- Lelli, C.; Bruun, H.H.; Chiarucci, A.; Donati, D.; Frascaroli, F.; Fritz, Ö.; Goldberg, I.; Nascimbene, J.; Tøttrup, A.P.; Rahbek, C.; et al. Biodiversity response to forest structure and management: Comparing species richness, conservation relevant species and functional diversity as metrics in forest conservation. For. Ecol. Manag. 2019, 432, 707–717. [Google Scholar] [CrossRef]
- Shannon, C.E.; Weaver, W. The Mathematical Theory of Communication; University of Illinois Press: Urbana, IL, USA, 1949. [Google Scholar]
- Magurran, A.E. Ecological Diversity and Its Measurement; Princeton University Press: Princeton, NJ, USA, 1988. [Google Scholar]
- Pielou, E.C. An Introduction to Mathematical Ecology; Wiley: New York, NY, USA, 1969. [Google Scholar]
- Simpson, E.H. Measurement of diversity. Nature 1949, 163, 688. [Google Scholar] [CrossRef]
- Ricotta, C. A parametric diversity measure combining the relative abundances and taxonomic distinctiveness of species. Divers. Distrib. 2004, 10, 143–146. [Google Scholar] [CrossRef]
- Rogers, S.I.; Clark, K.R.; Reynolds, J.D. The taxonomic distinctness of coastal bottom-dwelling fish communities of the North-east Atlantic. J. Anim. Ecol. 1999, 68, 769–782. [Google Scholar] [CrossRef]
- Shimatani, K. On the measurement of species diversity incorporating species differences. Oikos 2001, 93, 135–147. [Google Scholar] [CrossRef]
- Clarke, K.R.; Warwick, R.M. A taxonomic distinctness index and its statistical properties. J. Appl. Ecol. 1998, 35, 523–531. [Google Scholar] [CrossRef]
- Clarke, K.R.; Warwick, R.M. The taxonomic distinctness measure of biodiversity: Weighting of step lengths between hierarchical levels. Mar. Ecol. Prog. Ser. 1999, 184, 21–29. [Google Scholar] [CrossRef]
- R Development Core Team. R: A Language and Environment for Statistical Computing; R Foundation for Statistical Computing: Vienna, Austria, 2020; Available online: http://www.R-project.org/ (accessed on 19 March 2020).
- Londi, G.; Tellini Florenzano, G.; Mini, L.; Caliendo, M.F.; Campedelli, T.; De Carli, E. Assessing woodland ecological characters through a new objective bird community index, the WBCI. Avocetta 2009, 33, 107–114. [Google Scholar]
- Rushton, S.P.; Omerod, S.J.; Kerby, G. New paradigms for modelling species distributions? J. Appl. Ecol. 2004, 41, 193–200. [Google Scholar] [CrossRef]
- Burnham, K.K.P.; Anderson, D.D.R. Model Selection and Multimodel Inference: A Practical Information-Theoretic Approach, 2nd ed.; Springer: New York, NY, USA, 2002. [Google Scholar]
- Potts, J.M.; Elith, J. Comparing species abundance models. Ecol. Model. 2006, 199, 153–163. [Google Scholar] [CrossRef]
- Price, D.T.; Zimmermann, N.E.; van der Meer, P.J.; Lexer, M.J.; Leadley, P.; Jorritsma, I.T.M.; Schaber, J.; Clark, D.F.; Lasch, P.; Mcnulty, S.; et al. Regeneration in Gap Models: Priority Issues for Studying Forest Responses to Climate Change. Clim. Chang. 2001, 51, 475–508. [Google Scholar] [CrossRef]
- Sferlazza, S.; Maltese, A.; Dardanelli, G.; La Mela Veca, D.S. Optimizing the Sampling Area across an Old-Growth Forest via UAV-Borne Laser Scanning, GNSS, and Radial Surveying. ISPRS Int. J. Geo-Inf. 2022, 11, 168. [Google Scholar] [CrossRef]
- Christensen, M.; Heilmann-Clausen, J. Forest biodiversity gradients and the human impact in Annapurna Conservation Area, Nepal. Biodivers. Conserv. 2009, 18, 2205–2221. [Google Scholar] [CrossRef]
- Kobayashi, M.; Kamitani, T. Effects of surface disturbance and light level on seedling emergence in a Japanese secondary deciduous forest. J. Veg. Sci. 2000, 11, 93–100. [Google Scholar] [CrossRef]
- Bagarello, V.; Giordano, G.; Sferlazza, S.; Sgroi, A. Effects of laboratory procedures on the integrity of a sandy-loam soil sample for bi-directional measurement of saturated hydraulic conductivity. Appl. Eng. Agric. 2011, 27, 351–358. [Google Scholar] [CrossRef]
- Sebastià, M.T.; Casals, P.; Vojniković, S.; Bogunić, F.; Beus, V. Plant diversity and soil properties in pristine and managed stands from Bosnian mixed forests. Forestry 2005, 78, 297–303. [Google Scholar] [CrossRef]
- Smith, G.F.; Gittings, T.; Wilson, M.; French, L.; Oxbrough, A.; O’Donoghue, S.; O’Halloran, J.; Kelly, D.L.; Mitchell, F.J.G.; Kelly, T.; et al. Identifying practical indicators of biodiversity for stand-level management of plantation forests. Biodivers. Conserv. 2008, 17, 991–1015. [Google Scholar] [CrossRef]
- Mayer, P.; Abs, C.; Fischer, A. Colonisation by vascular plants after soil disturbance in the Bavarian Forest-key factors and relevance for forest dynamics. For. Ecol. Manag. 2004, 188, 279–289. [Google Scholar] [CrossRef]
- Van Calster, H.; Chevalier, R.; van Wyngene, B.; Archaux, F.; Verheyen, K.; Hermy, M. Long-term seed bank dynamics in a temperate forest under conversion from coppice-with-standards to high forest management. Appl. Veg. Sci. 2008, 11, 252–260. [Google Scholar] [CrossRef]
- Roig, S.; del Río, M.; Cañellas, I.; Montero, G. Litter fall in Mediterranean Pinus pinaster Ait. stands under different thinning regimes. For. Ecol. Manag. 2005, 206, 179–190. [Google Scholar] [CrossRef]
- Valera-Burgos, J.; Díaz-Barradas, M.C.; Zunzunegui, M. Effects of Pinus pinea litter on seed germination and seedling performance of three Mediterranean shrub species. Plant Growth Regul. 2012, 66, 285–292. [Google Scholar] [CrossRef]
- Dupré, C.; Ehrlén, J. Habitat configuration, species traits and plant distributions. J. Ecol. 2002, 90, 796–805. Available online: http://www.jstor.org/stable/3072249 (accessed on 25 May 2020). [CrossRef]
- Kolb, A.; Dieckmann, M. Effects of environment, habitat configuration and forest continuity on the distribution of forest plant species. J. Veg. Sci. 2004, 15, 199–208. [Google Scholar] [CrossRef]
- Da Silva, I.A.; Batalha, M.A. Taxonomic distinctness and diversity of a hyperseasonal savanna in central Brazil. Divers Distrib. 2006, 12, 725–730. [Google Scholar] [CrossRef]
- Heino, J.; Soininen, J.; Lappalainen, J.; Virtanen, R. The relationship between species richness and taxonomic distinctness in freshwater organisms. Limnol. Oceanogr. 2005, 50, 978–986. [Google Scholar] [CrossRef]
- Salas, F.; Patrício, J.; Marcos, C.; Pardal, M.A.; Pérez-Ruzafa, A.; Marques, J.C. Are taxonomic distinctness measures compliant to other ecological indicators in assessing ecological status? Mar. Pollut. Bull. 2006, 52, 162–174. [Google Scholar] [CrossRef] [PubMed]
- Barreca, L.; Marziliano, P.A.; Menguzzato, G.; Scuderi, A. Avifauna e struttura nella pineta Ragabo (Linguaglossa, CT). Forest@ 2010, 7, 223–233. [Google Scholar] [CrossRef]
- Massa, B.; Lo Valvo, M.; Catalisano, A. Bird communities on Mount Etna (Sicily, Italy). Ital. J. Zool. 1989, 56, 349–356. [Google Scholar] [CrossRef]
- De la Montaña, E.; Rey-Benayas, J.M.; Carrascal, L.M. Response of bird communities to silvicultural thinning of Mediterranean maquis. J. Appl. Ecol. 2006, 43, 651–659. [Google Scholar] [CrossRef]
- Hagar, J.; Howlin, S.; Ganio, L. Short-term response of songbirds to experimental thinning of young Douglas-fir forests in the Oregon Cascades. For. Ecol. Manag. 2004, 199, 333–347. [Google Scholar] [CrossRef]
- Siegel, R.B.; DeSante, D.F. Bird communities in thinned versus unthinned Sierran mixed conifer stands. Wilson Bull. 2003, 115, 155–165. [Google Scholar] [CrossRef]
- Gil-Tena, A.; Saura, S.; Brotons, L. Effects of forest composition and structure on bird species richness in a Mediterranean context: Implications for forest ecosystem management. For. Ecol. Manag. 2007, 242, 470–476. [Google Scholar] [CrossRef]
- Bergner, A.; Avci, M.; Eryiğit, H.; Jansson, N.; Niklasson, M.; Westerberg, L.; Milberg, P. Influences of forest type and habitat structure on bird assemblages of oak (Quercus spp.) and pine (Pinus spp.) stands in southwestern Turkey. For. Ecol. Manag. 2015, 336, 137–147. [Google Scholar] [CrossRef]
- Mitchell, M.S.; Rutzmoser, S.H.; Wigley, T.B.; Loehle, C.; Gerwin, G.A.; Keyser, P.D.; Lancia, R.A.; Perry, R.W.; Reynolds, C.J.; Thill, R.E.; et al. Relationships between avian richness and landscape structure at multiple scales using multiple landscapes. For. Ecol. Manag. 2006, 221, 155–169. [Google Scholar] [CrossRef]
- Nikolov, S.C. Effect of stand age on bird communities in late-successional Macedonian pine forests in Bulgaria. For. Ecol. Manag. 2009, 257, 580–587. [Google Scholar] [CrossRef]
- Bossema, I. Jays and oaks: An eco-ethological study of a symbiosis. Behaviour 1979, 70, 1–117. [Google Scholar] [CrossRef]
- Pons, I.; Pausas, J.G. Not only size matters: Acorn selection by the European jay (Garrulus glandarius). Acta Oecol. 2007, 31, 353–360. [Google Scholar] [CrossRef]
- Badalamenti, E.; Pasta, S.; La Mantia, T.; La Mela Veca, D.S. Criteria to identify old-growth forests in the Mediterranean: A case study from Sicily based on literature review and some management proposals. Feddes Rep. 2018, 129, 25–37. [Google Scholar] [CrossRef]
Disclaimer/Publisher’s Note: The statements, opinions and data contained in all publications are solely those of the individual author(s) and contributor(s) and not of MDPI and/or the editor(s). MDPI and/or the editor(s) disclaim responsibility for any injury to people or property resulting from any ideas, methods, instructions or products referred to in the content. |
© 2023 by the authors. Licensee MDPI, Basel, Switzerland. This article is an open access article distributed under the terms and conditions of the Creative Commons Attribution (CC BY) license (https://creativecommons.org/licenses/by/4.0/).