
Impact of Climate Change on Phenology of Two Heat-Resistant Wheat Varieties and Future Adaptations

 ,
, 
Abstract
:1. Introduction
2. Results
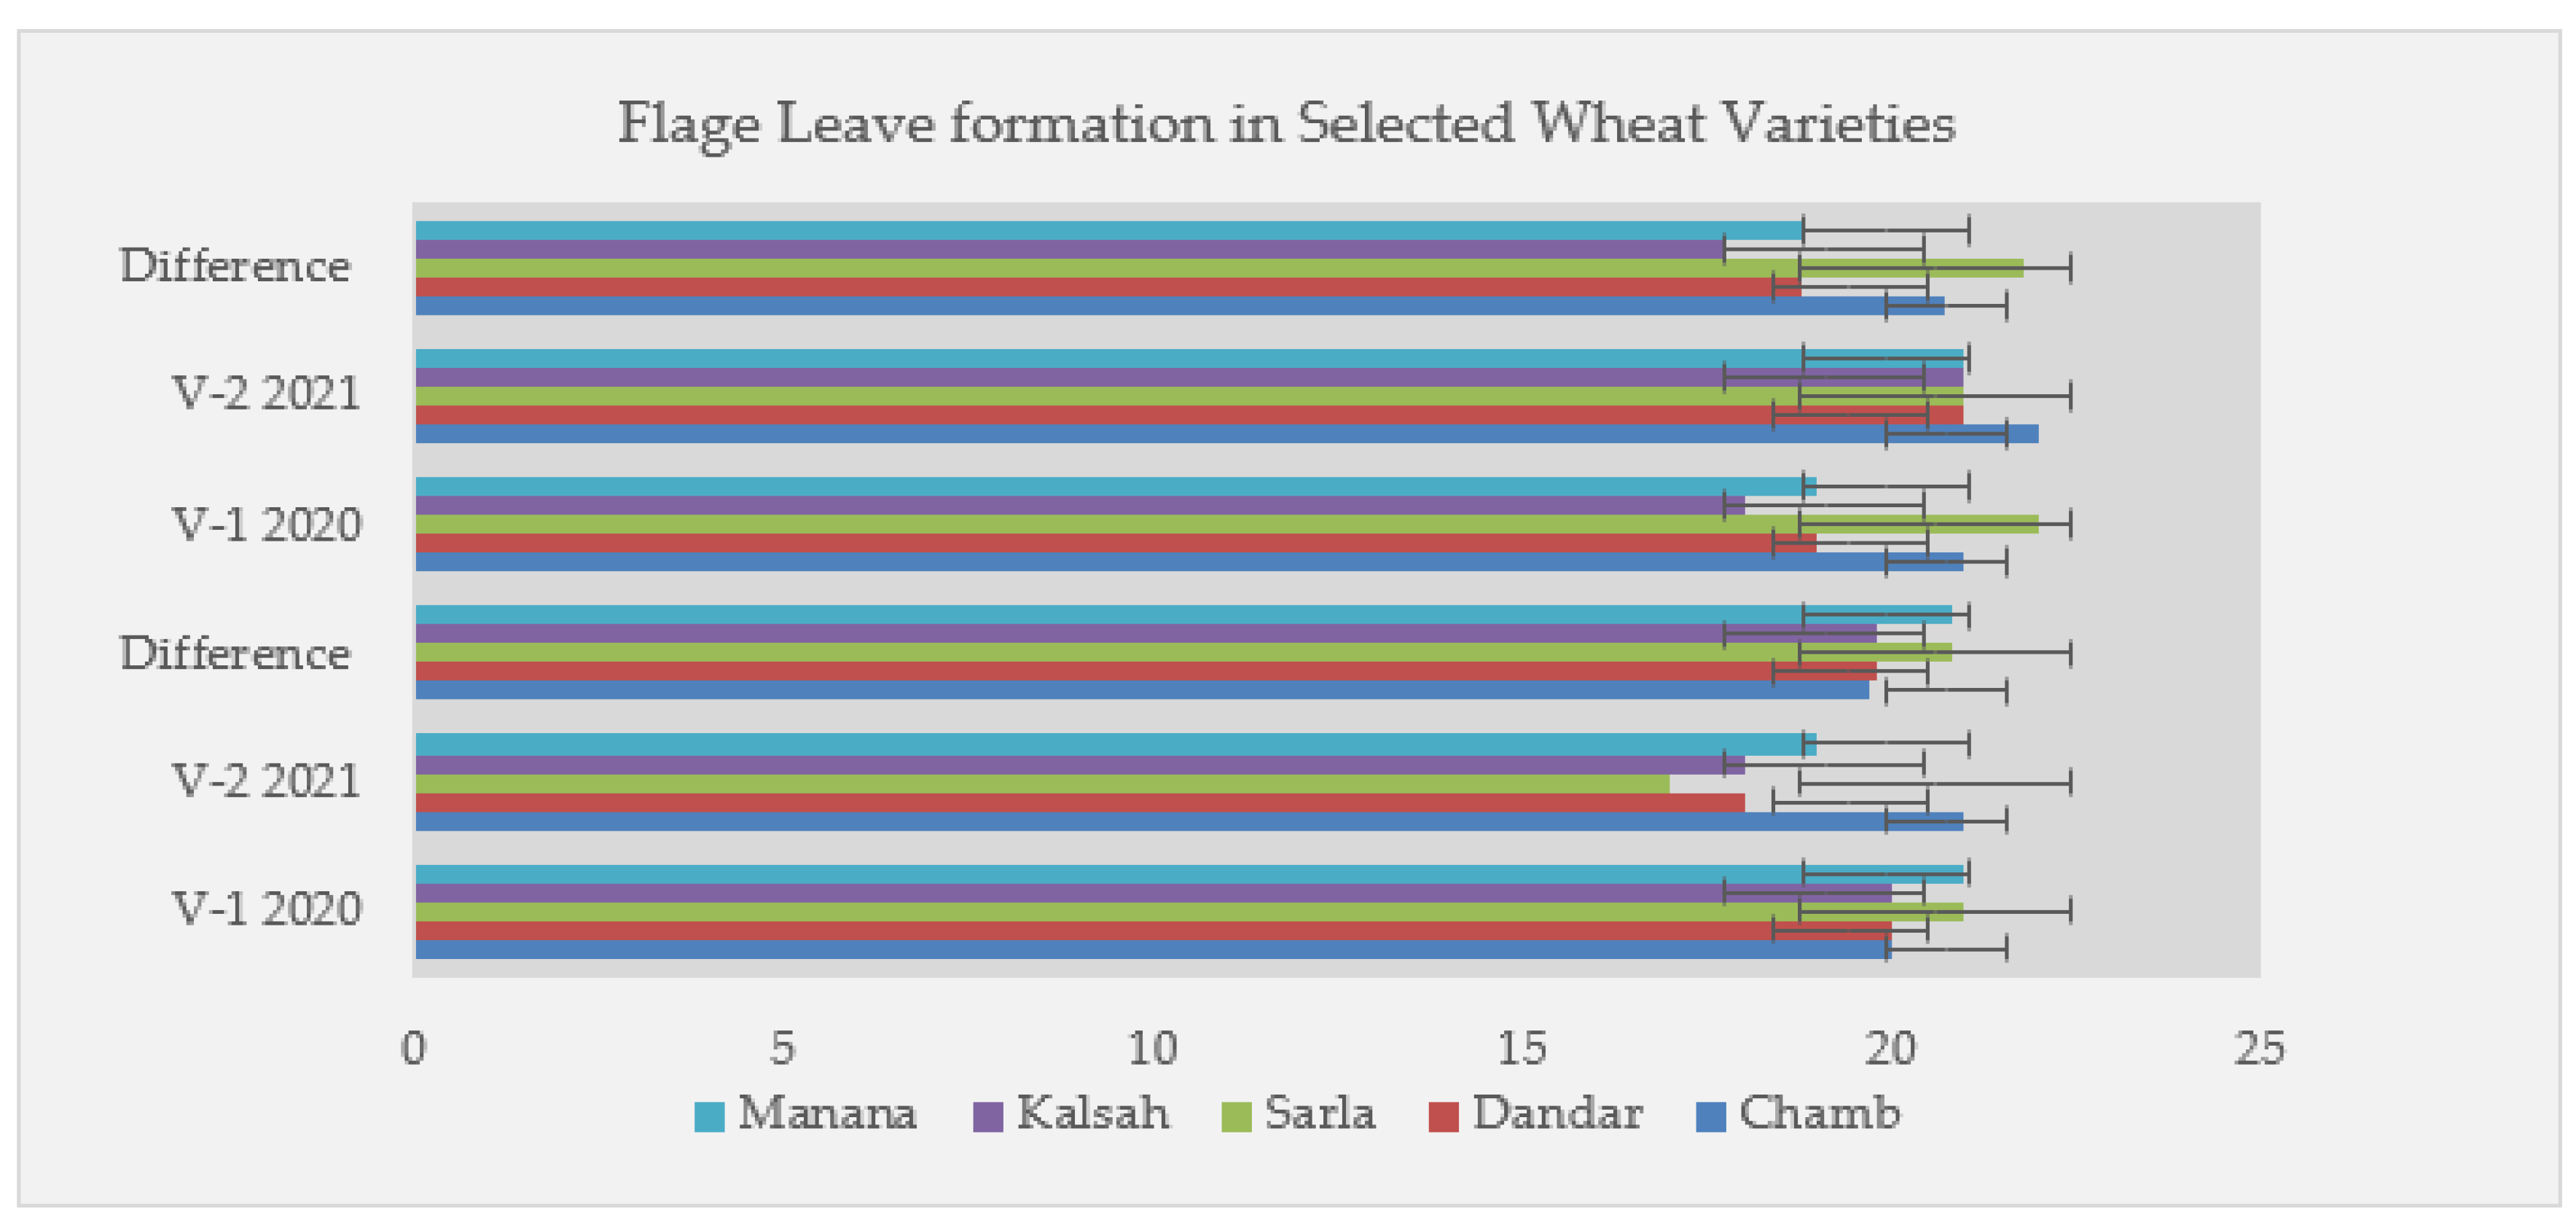
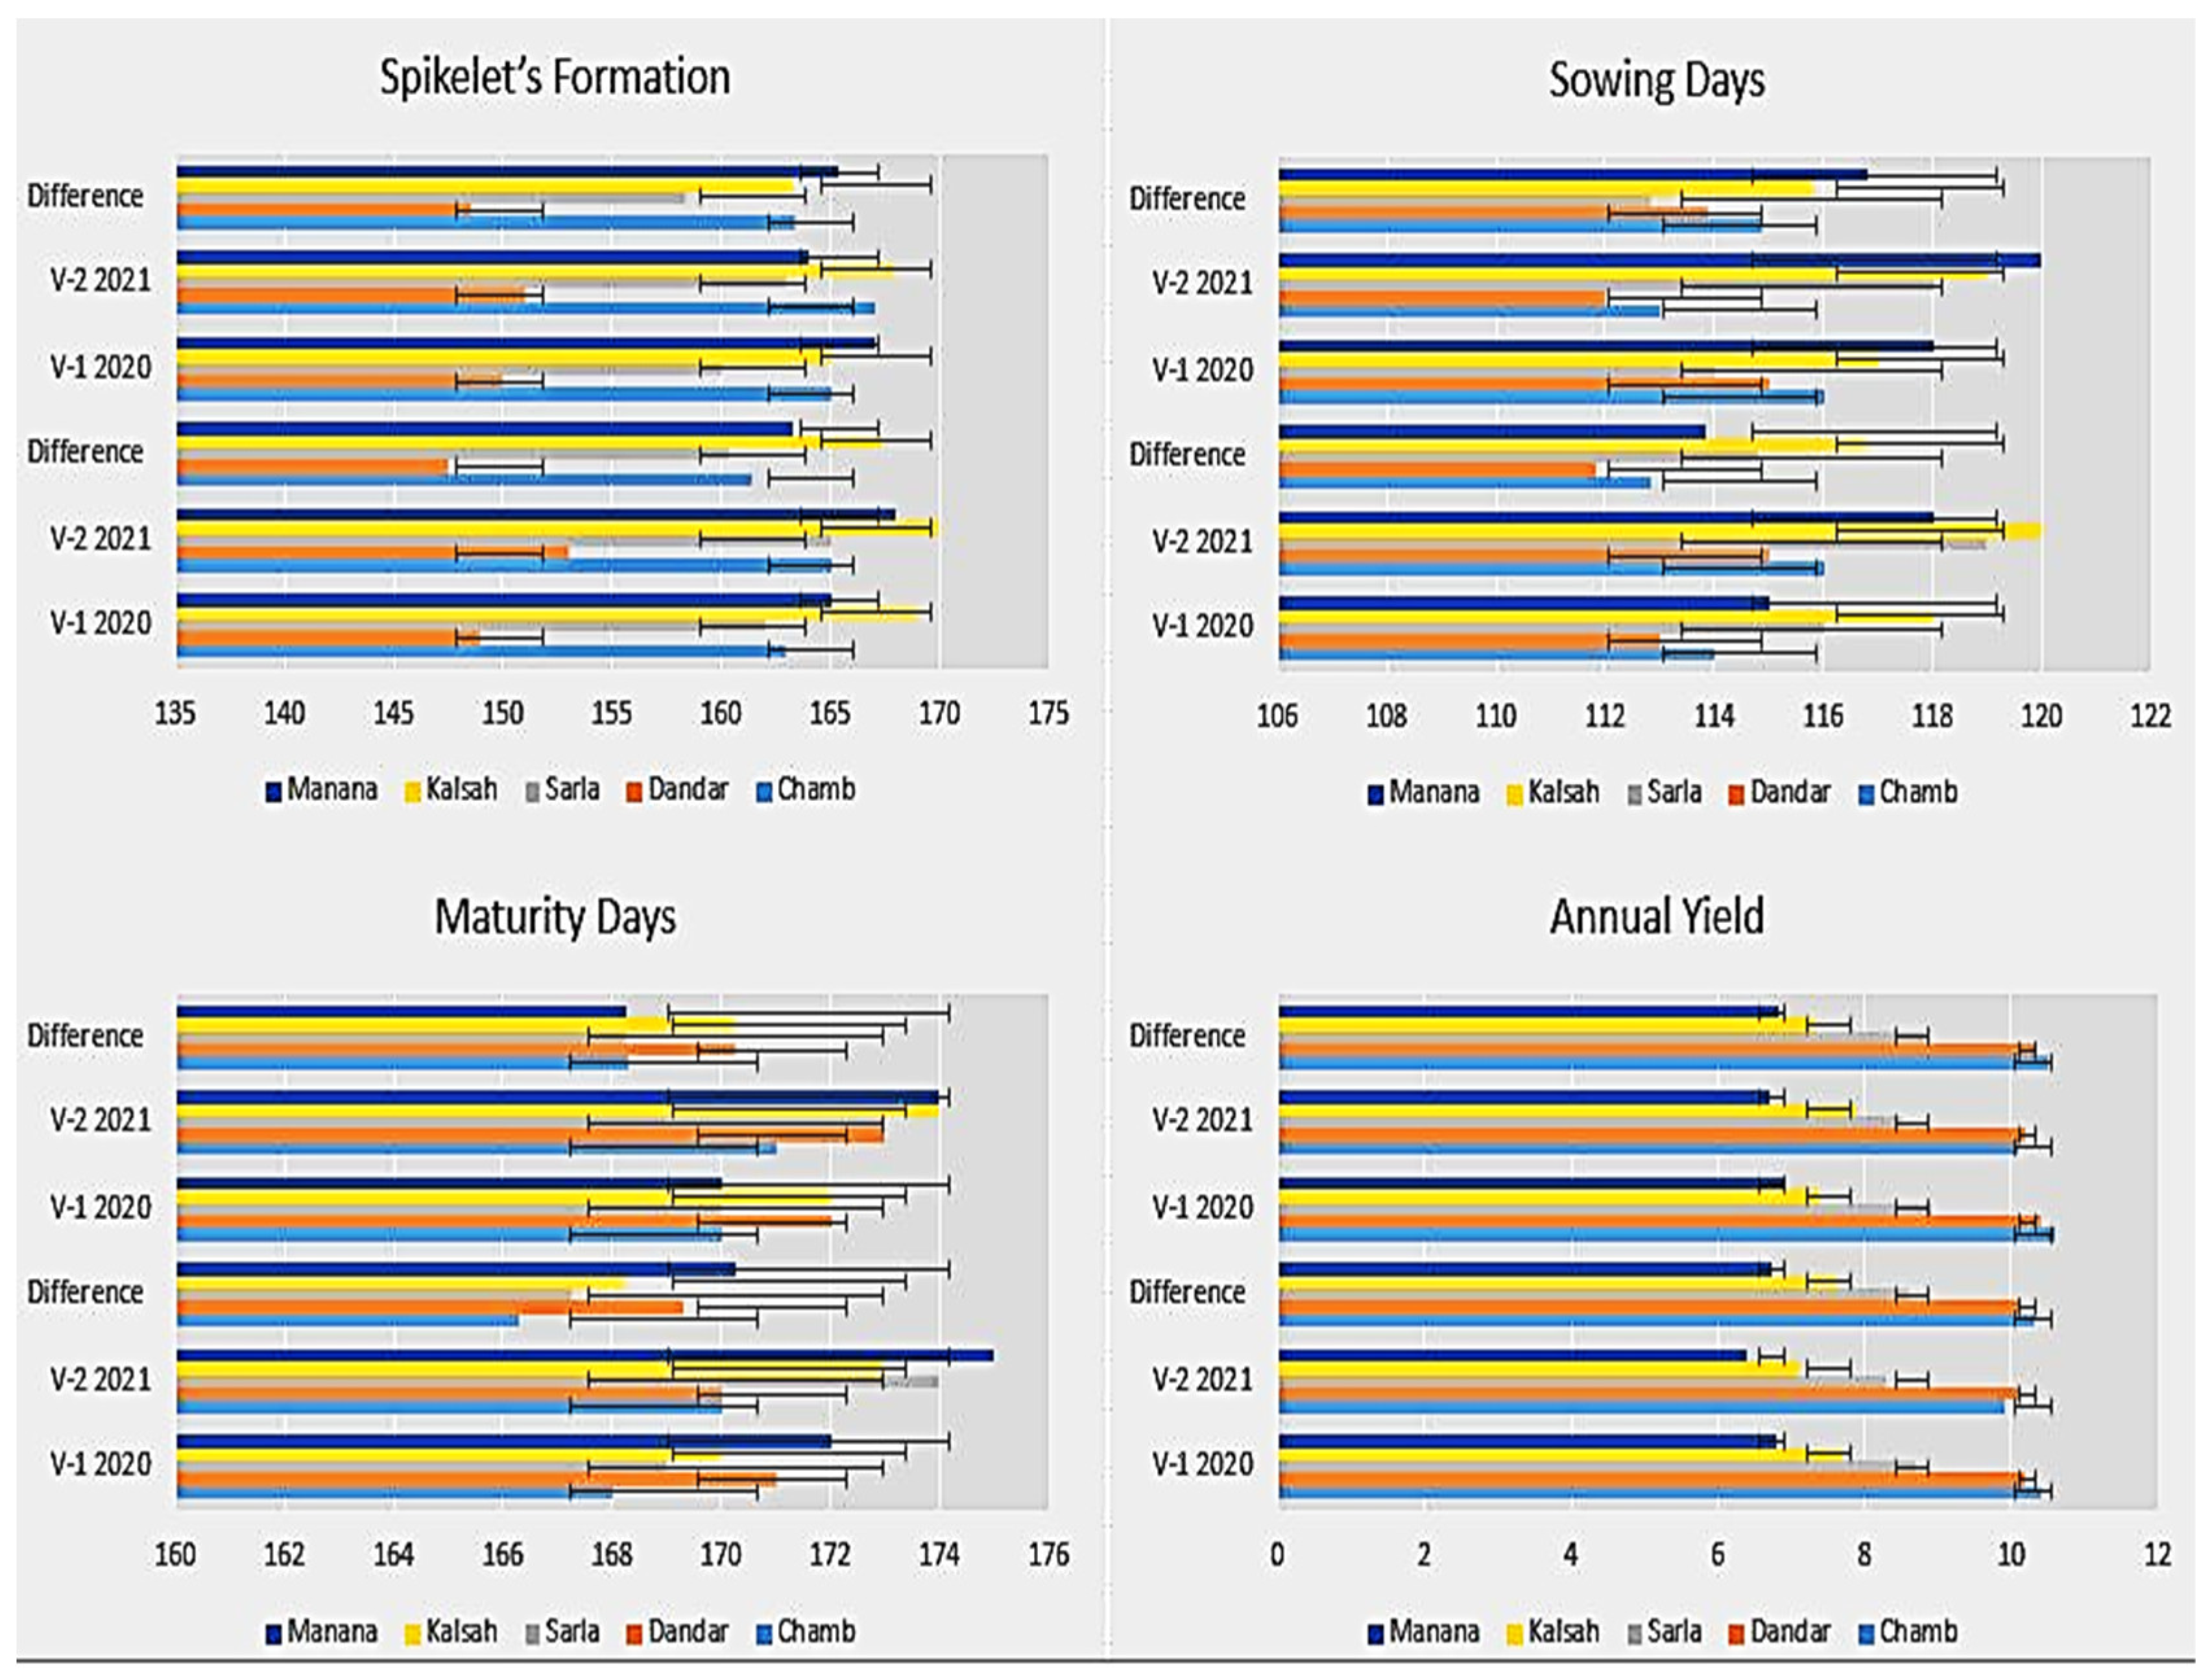
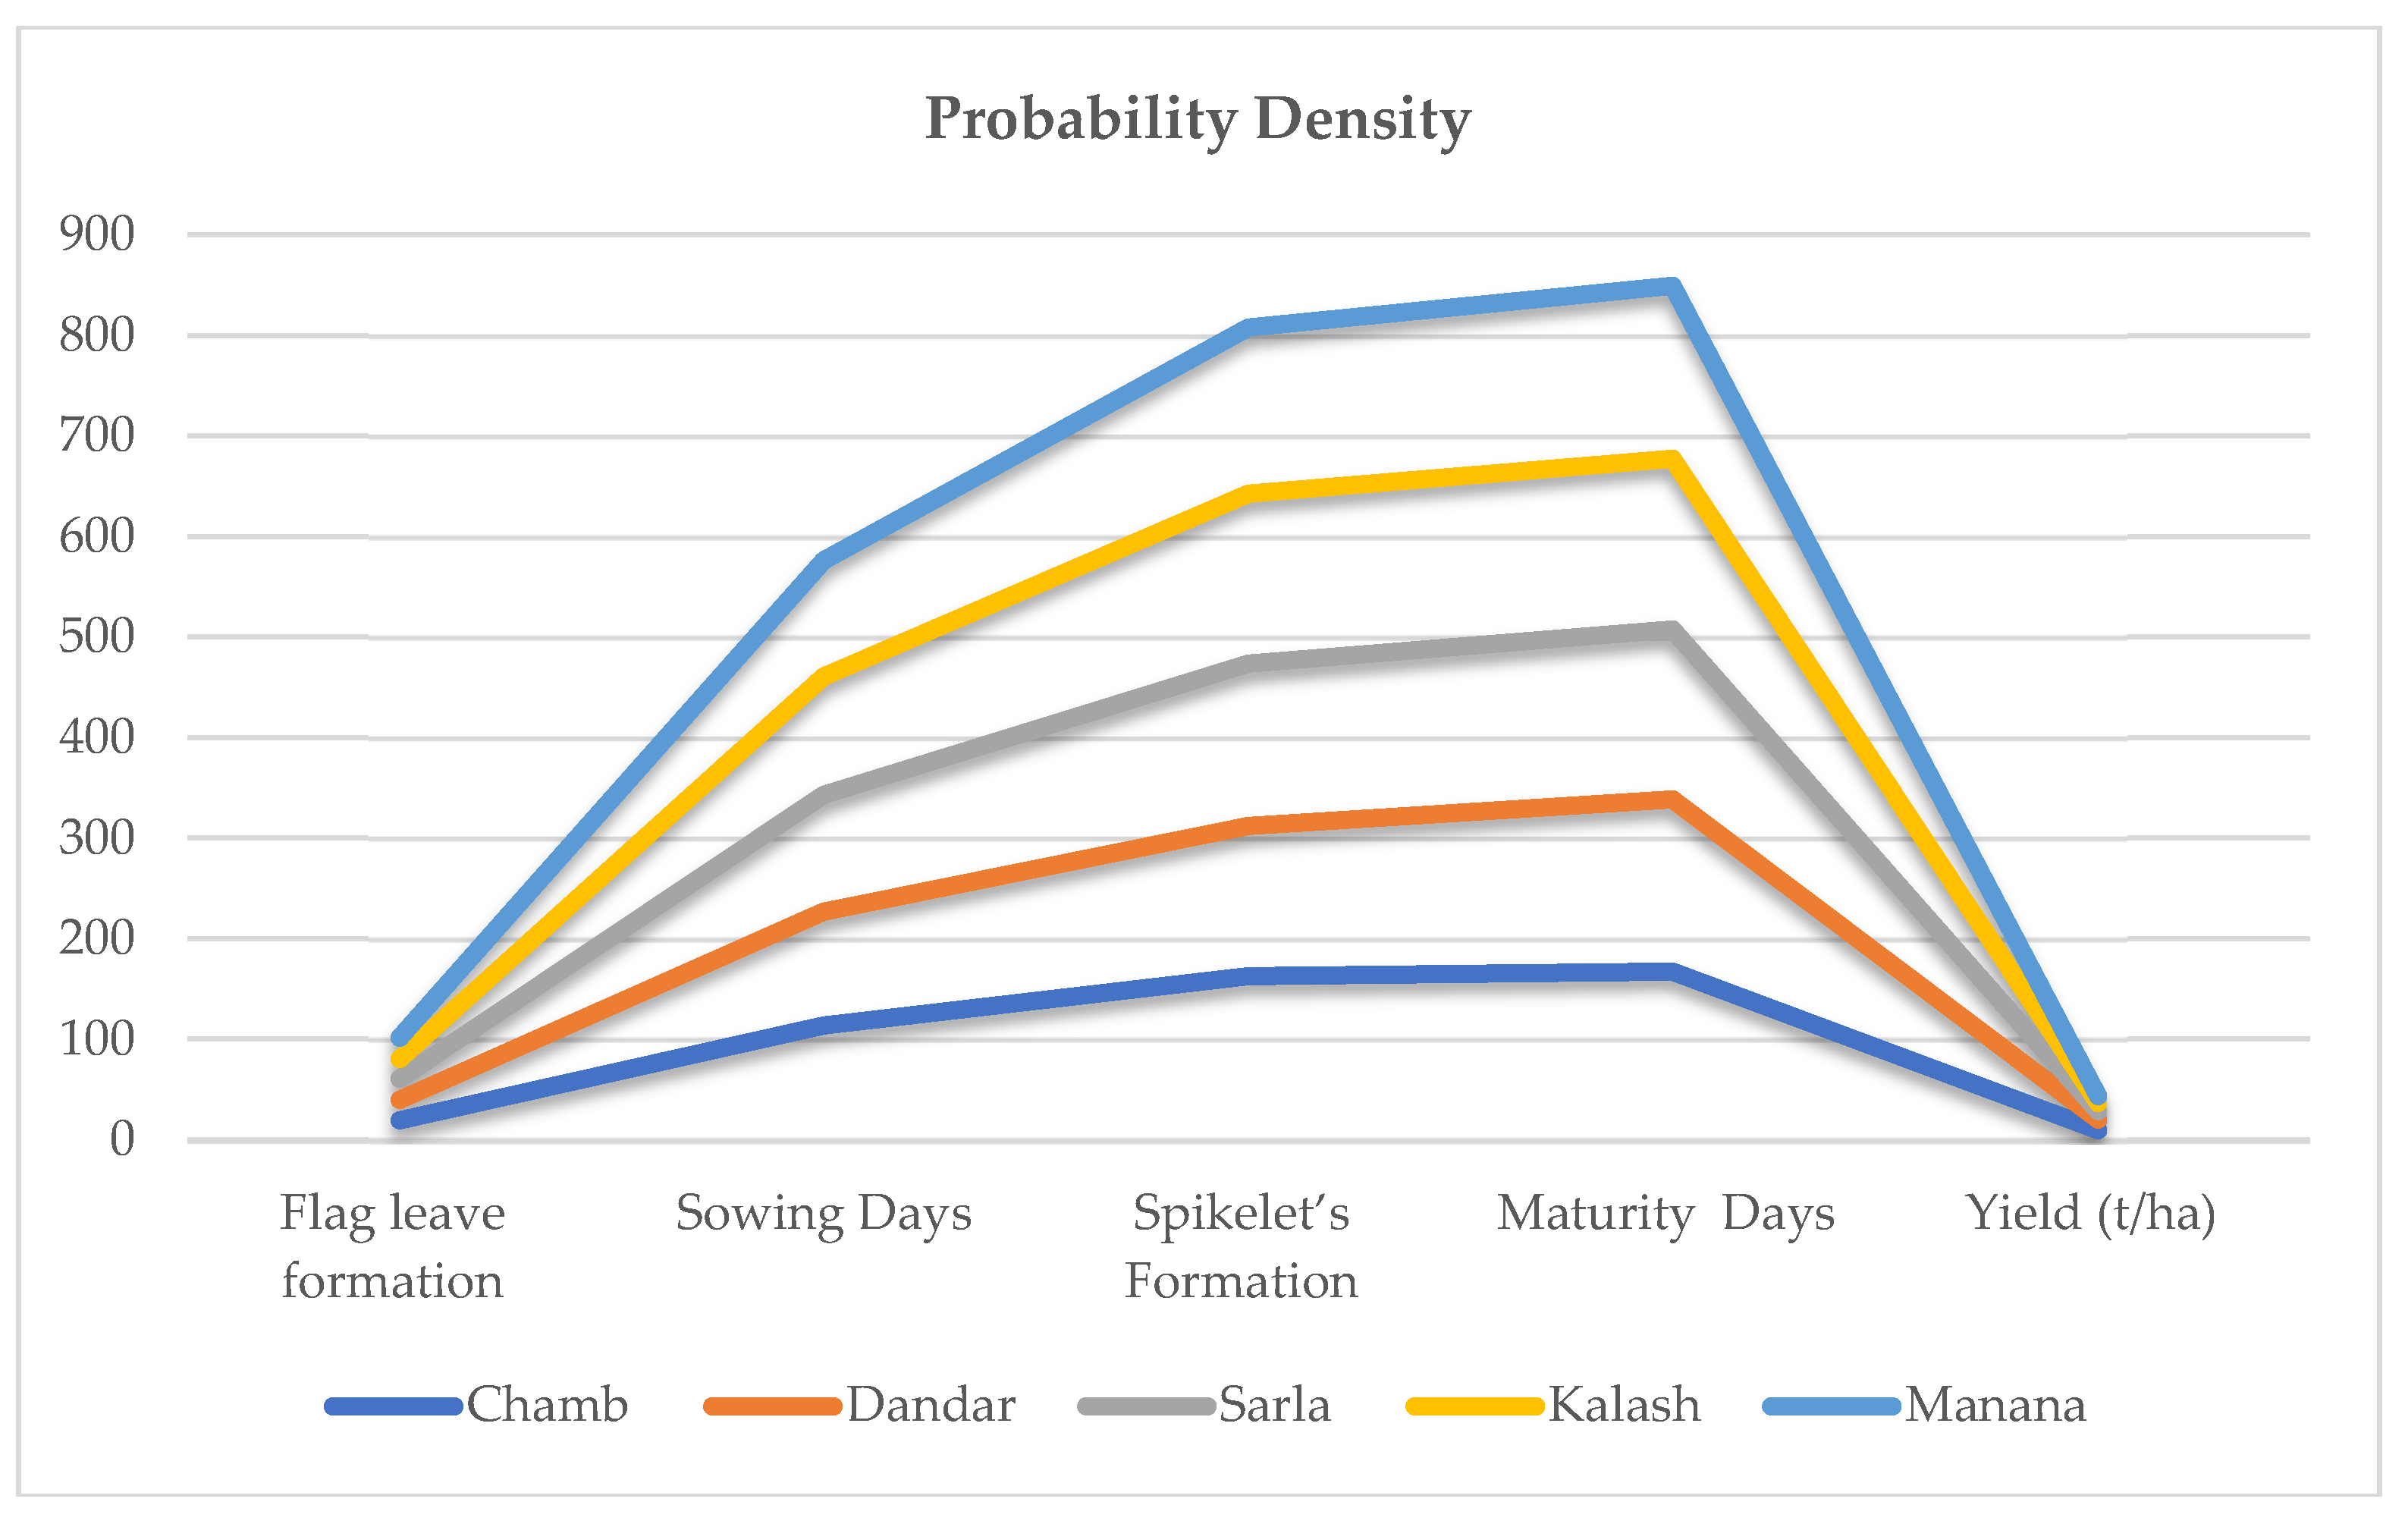
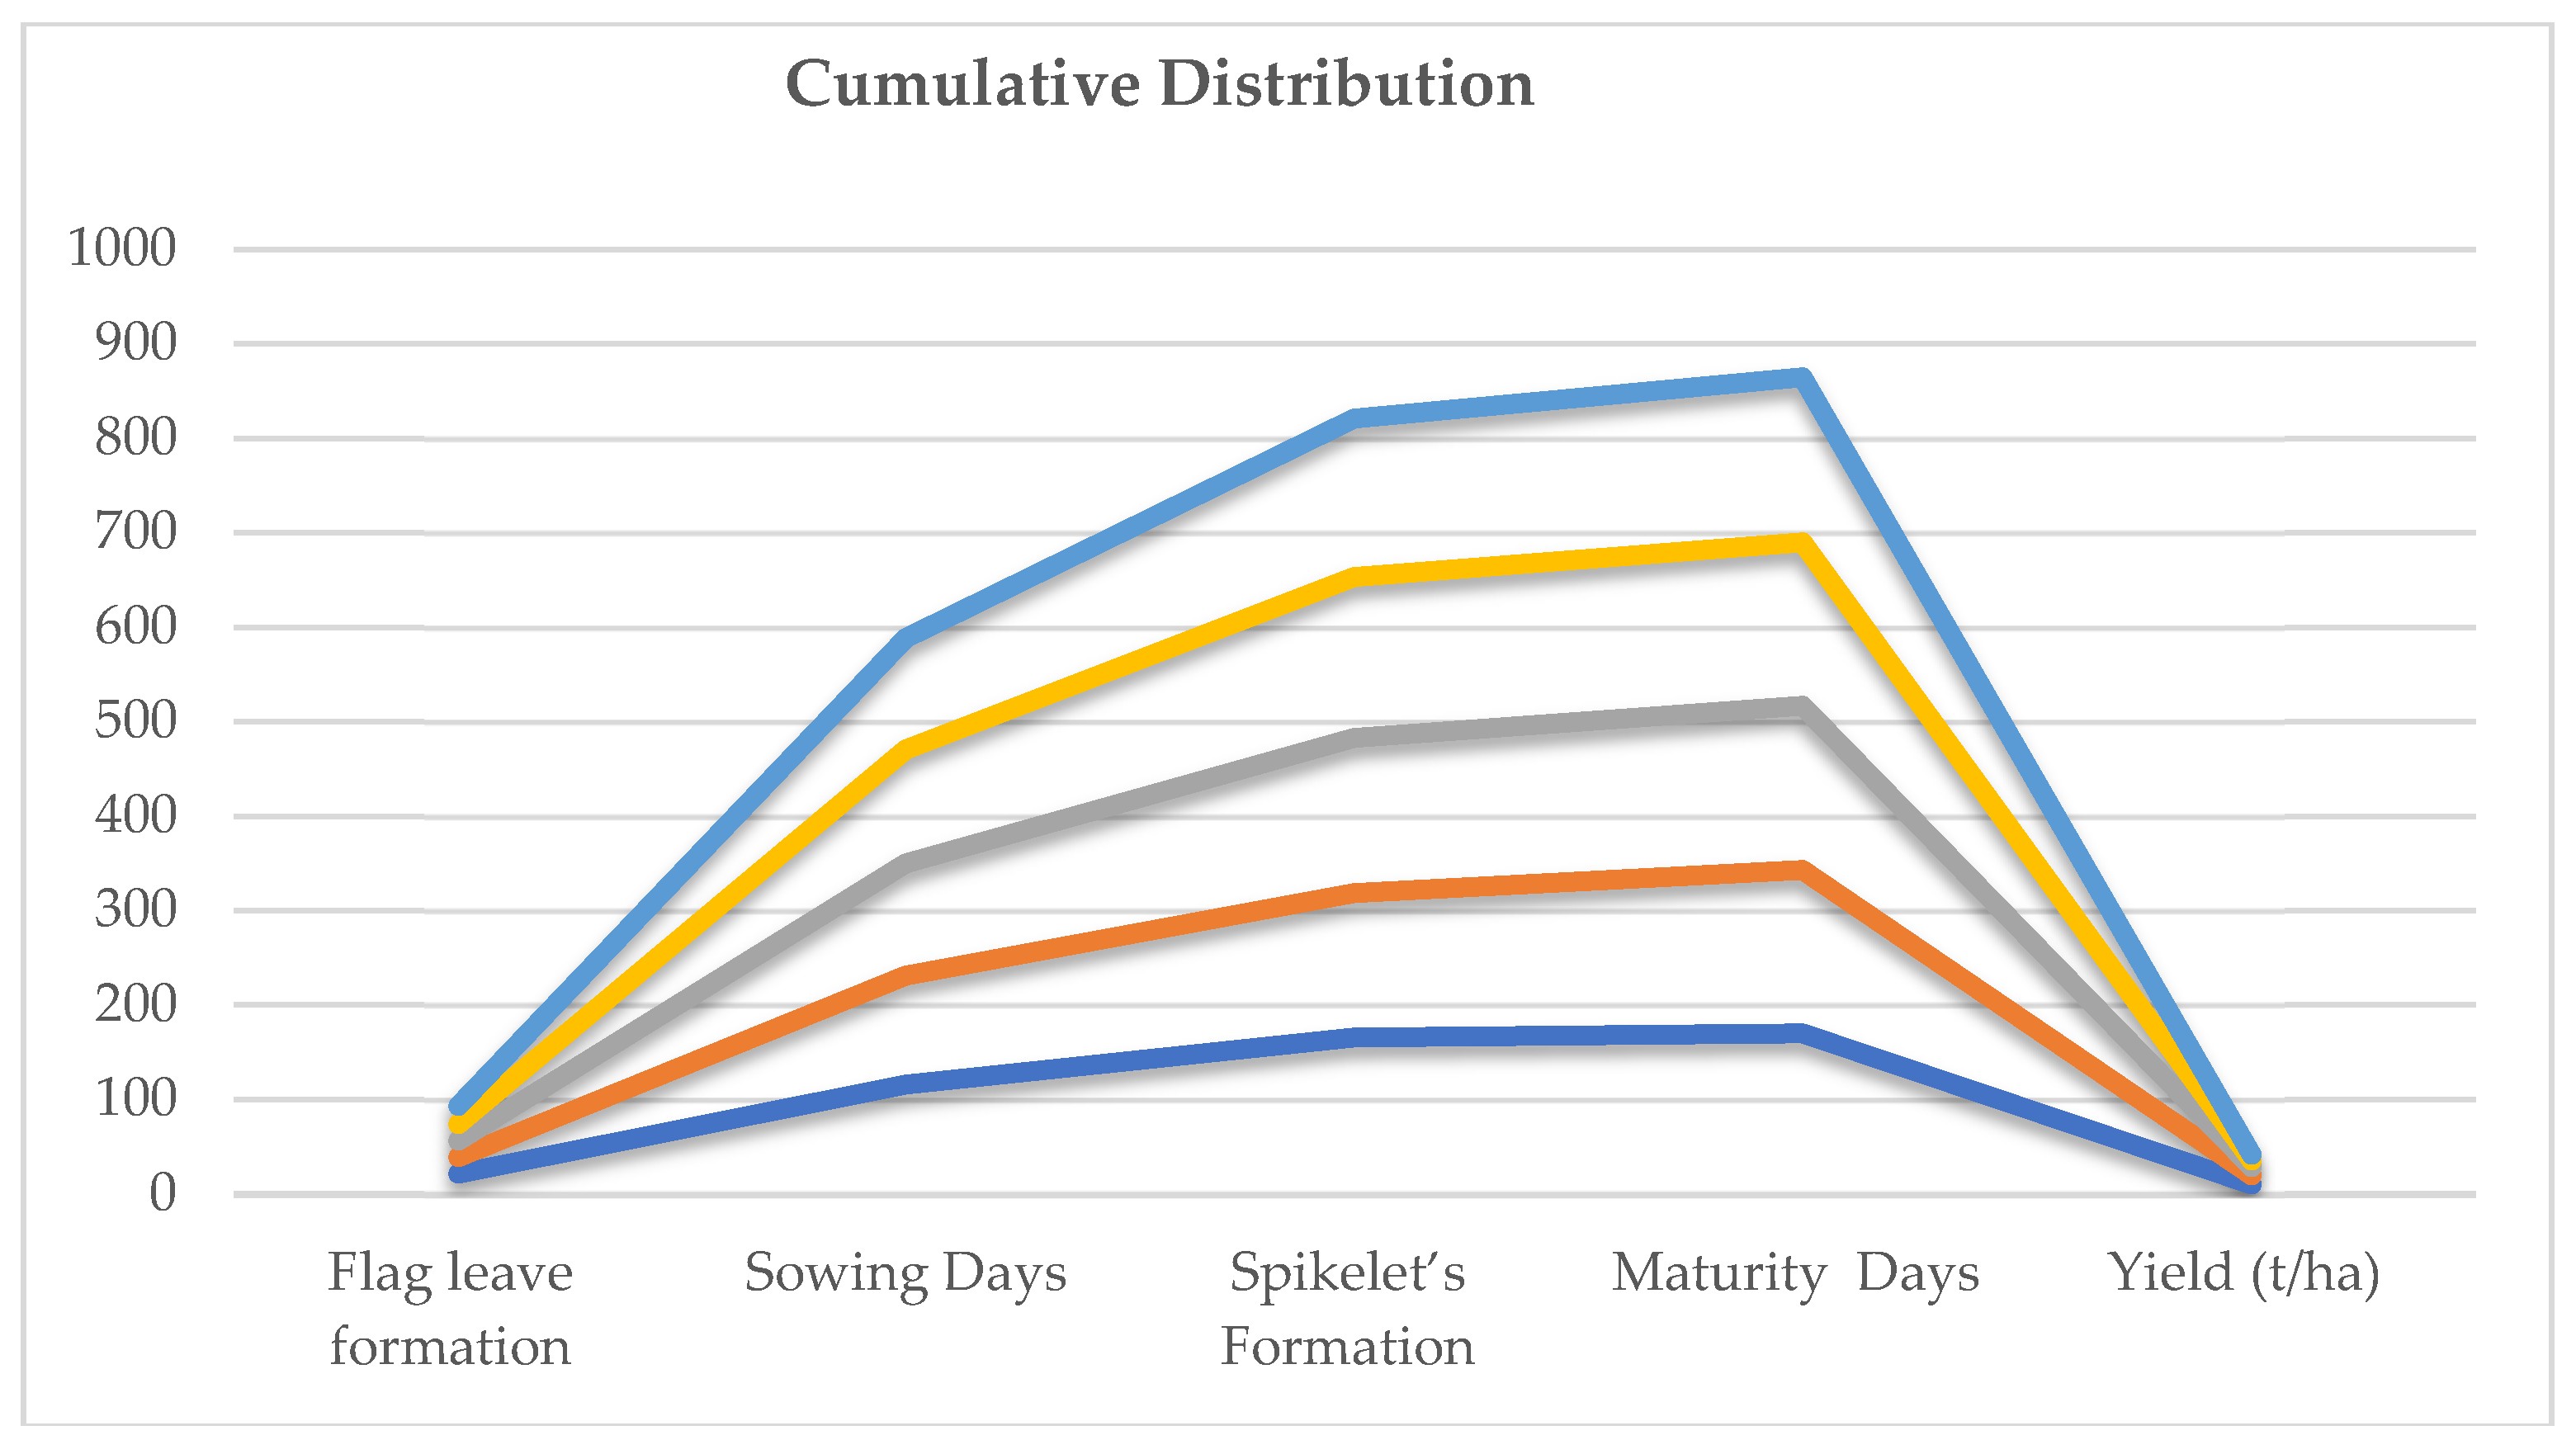
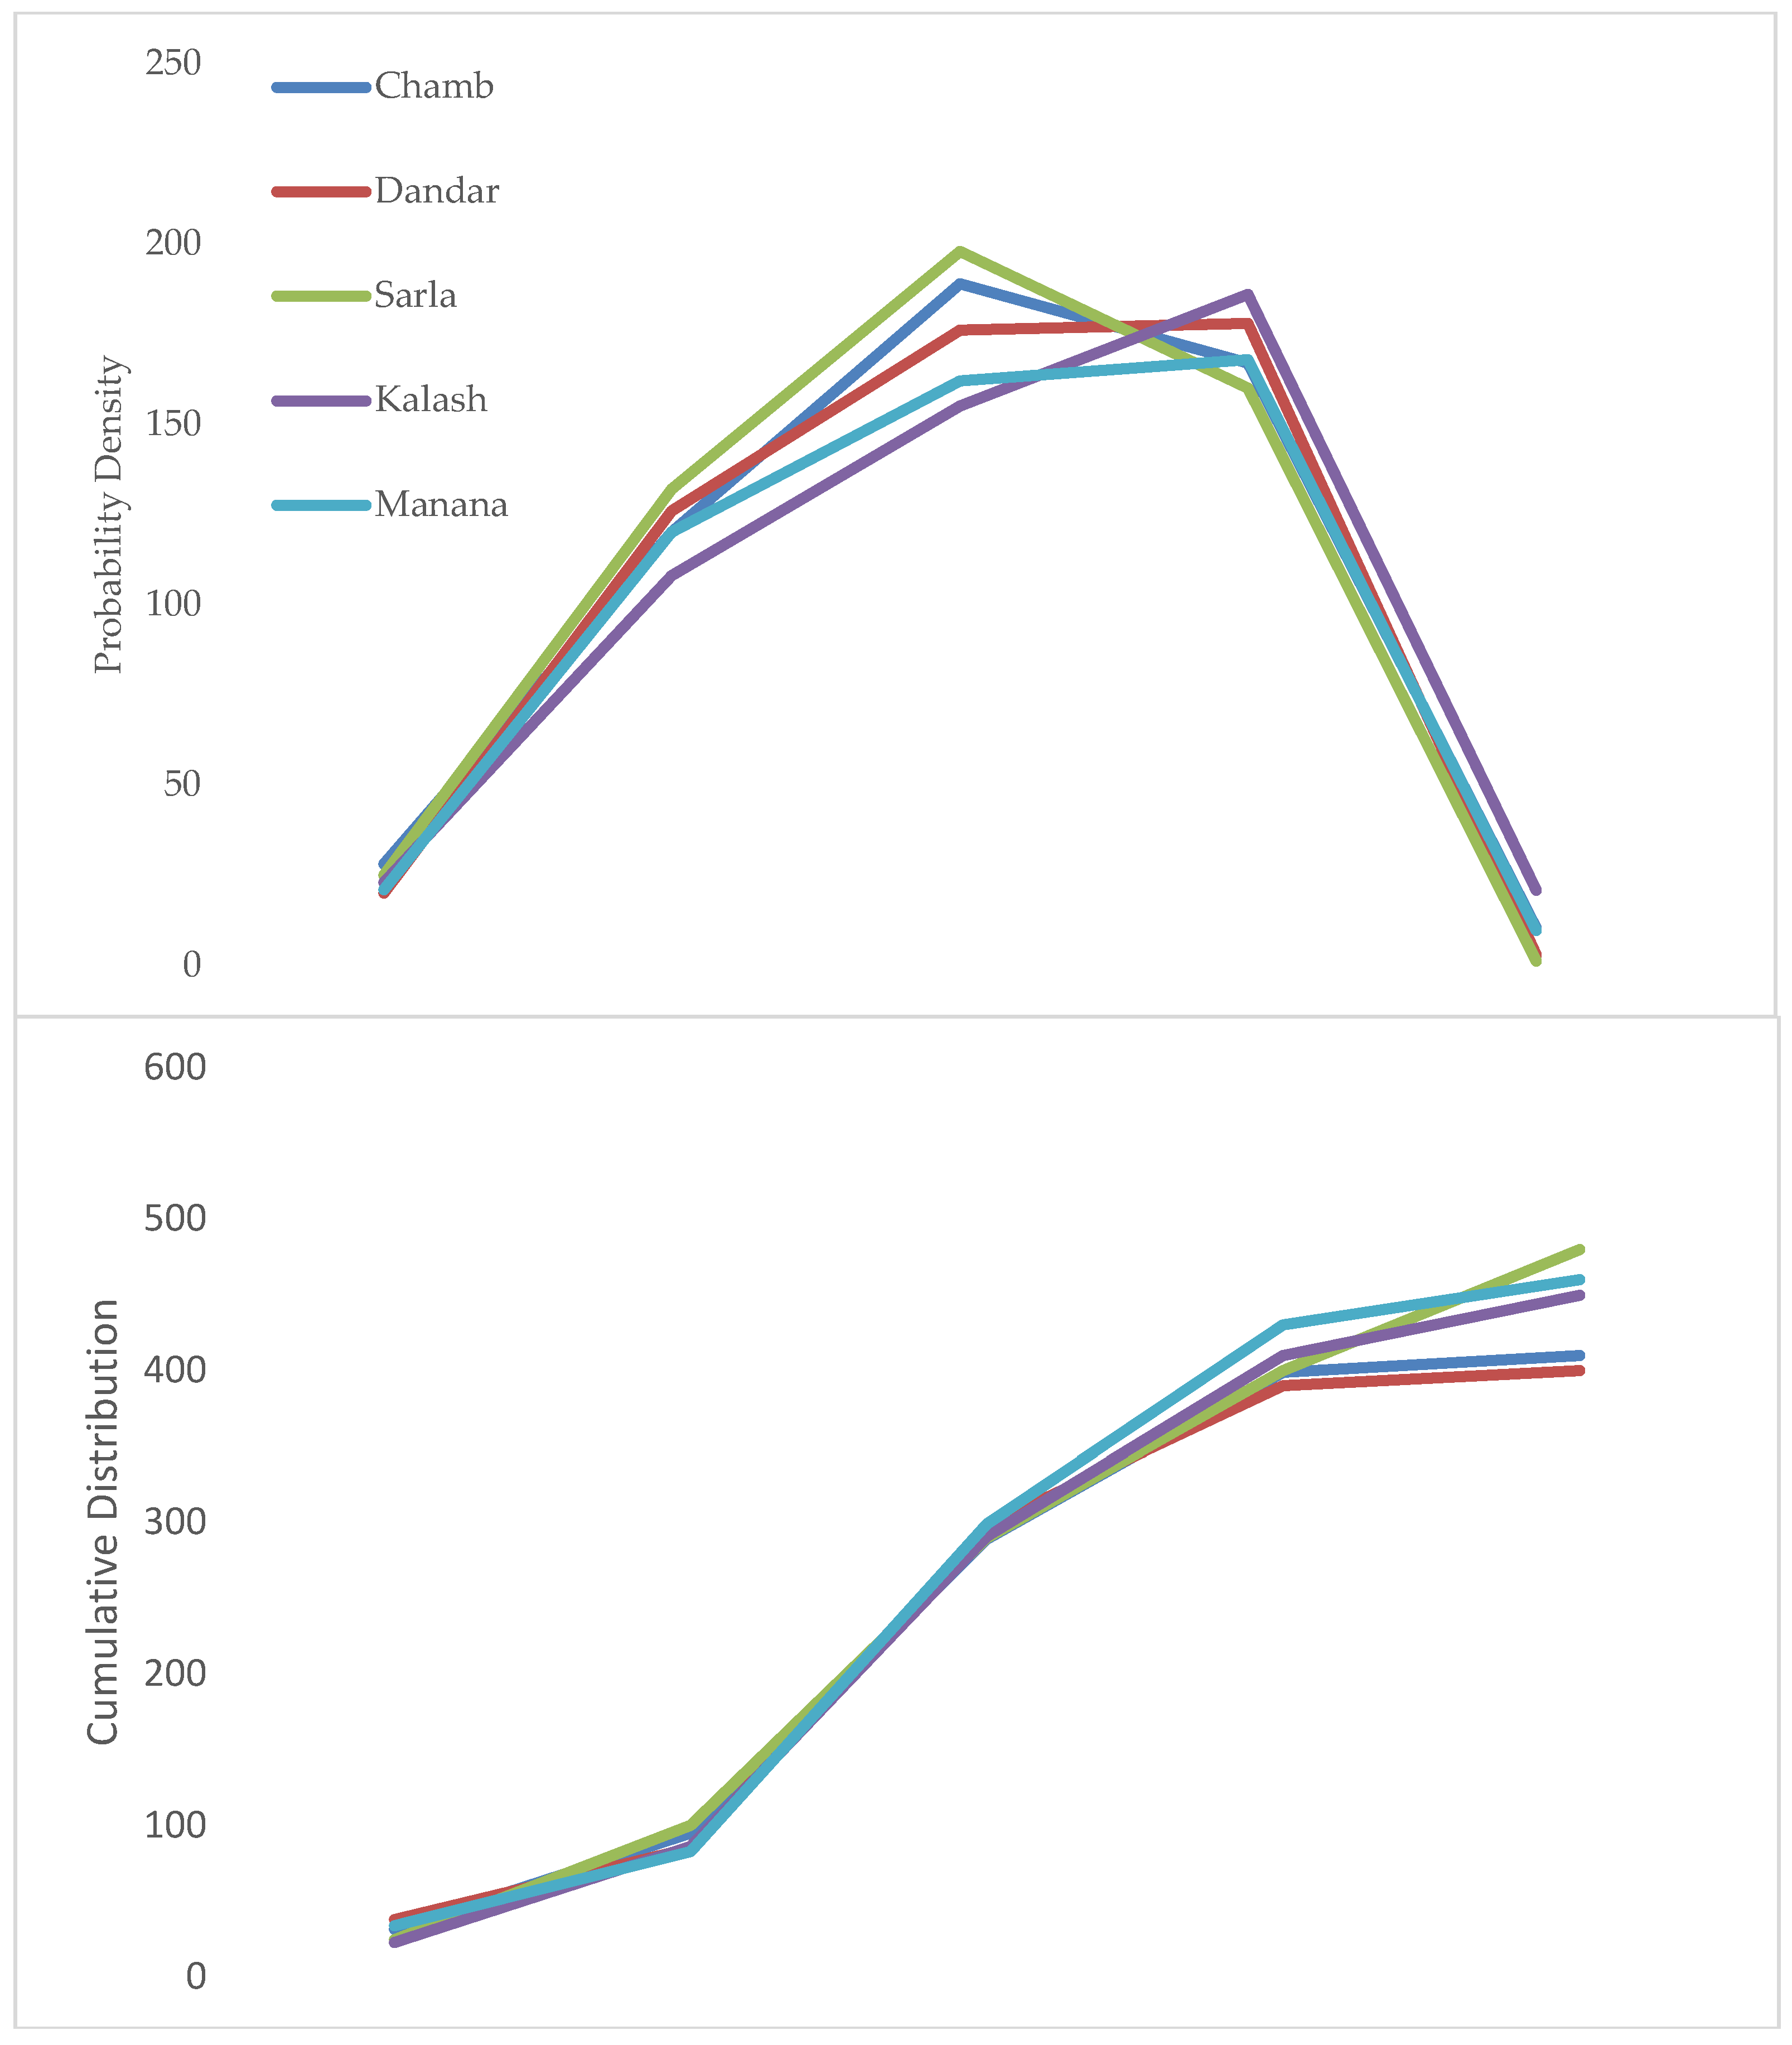
2.1. Field Analysis
2.2. Impact of Changing Climatic Parameters on Wheat Phenology
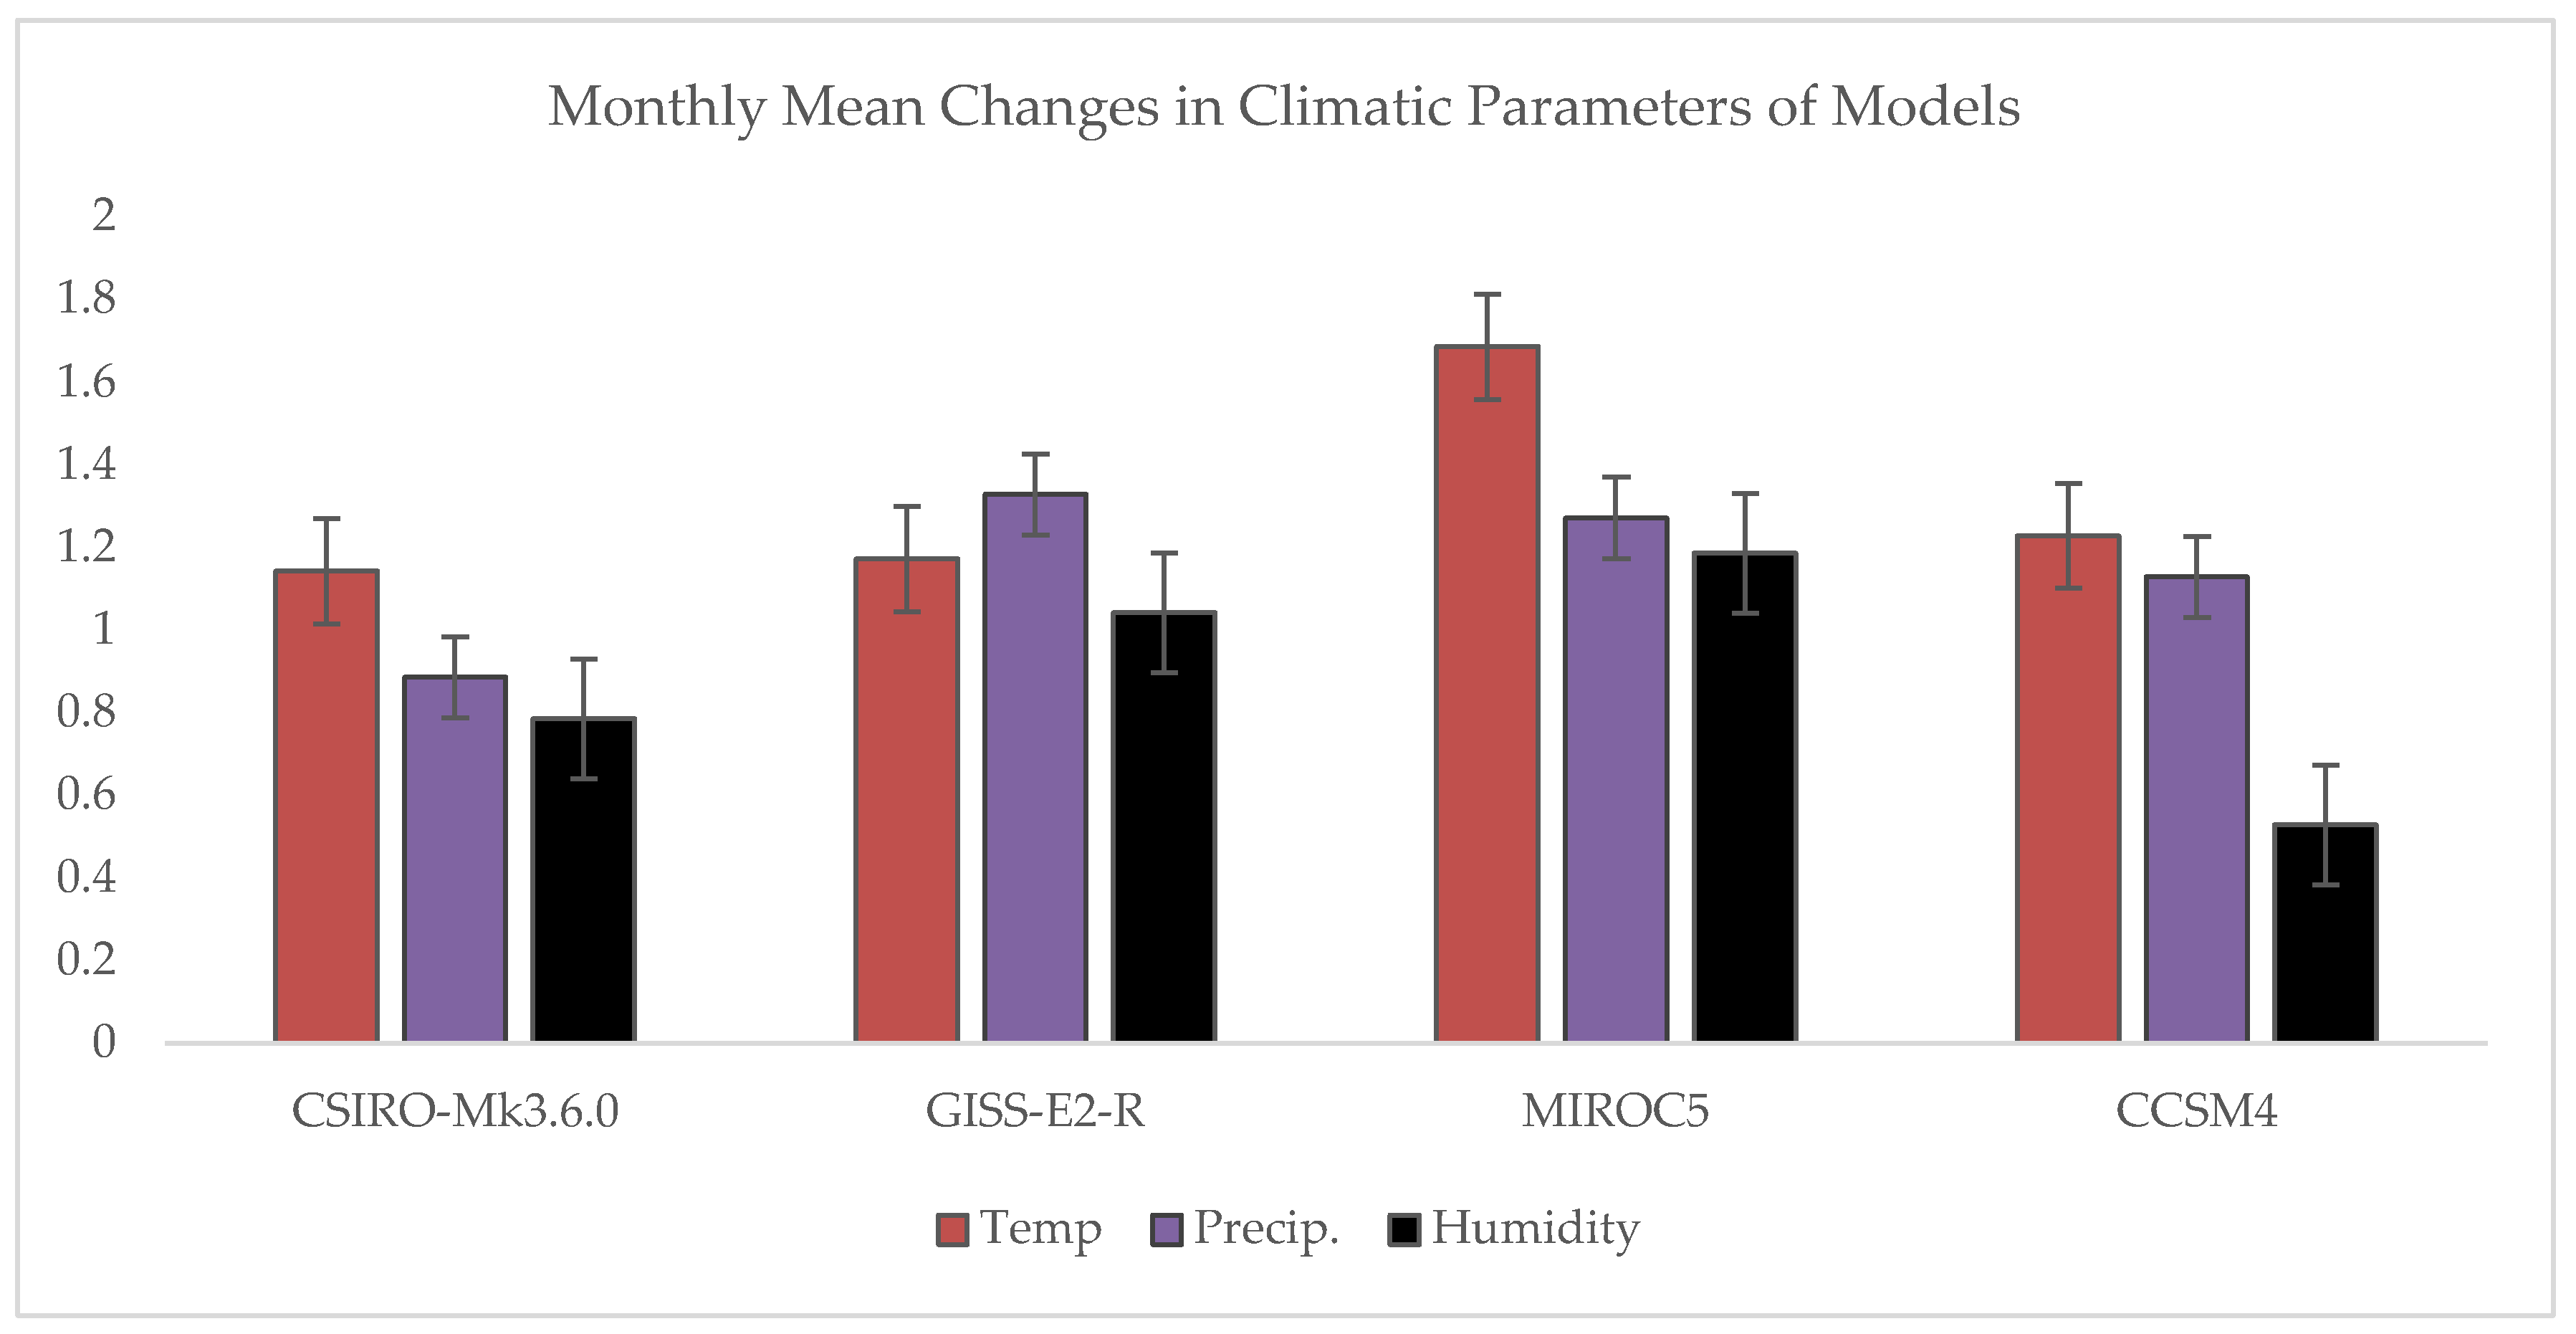
2.3. Data of GCM Simulations
2.4. DSSAT Model Description
2.5. Simulations and Analysis
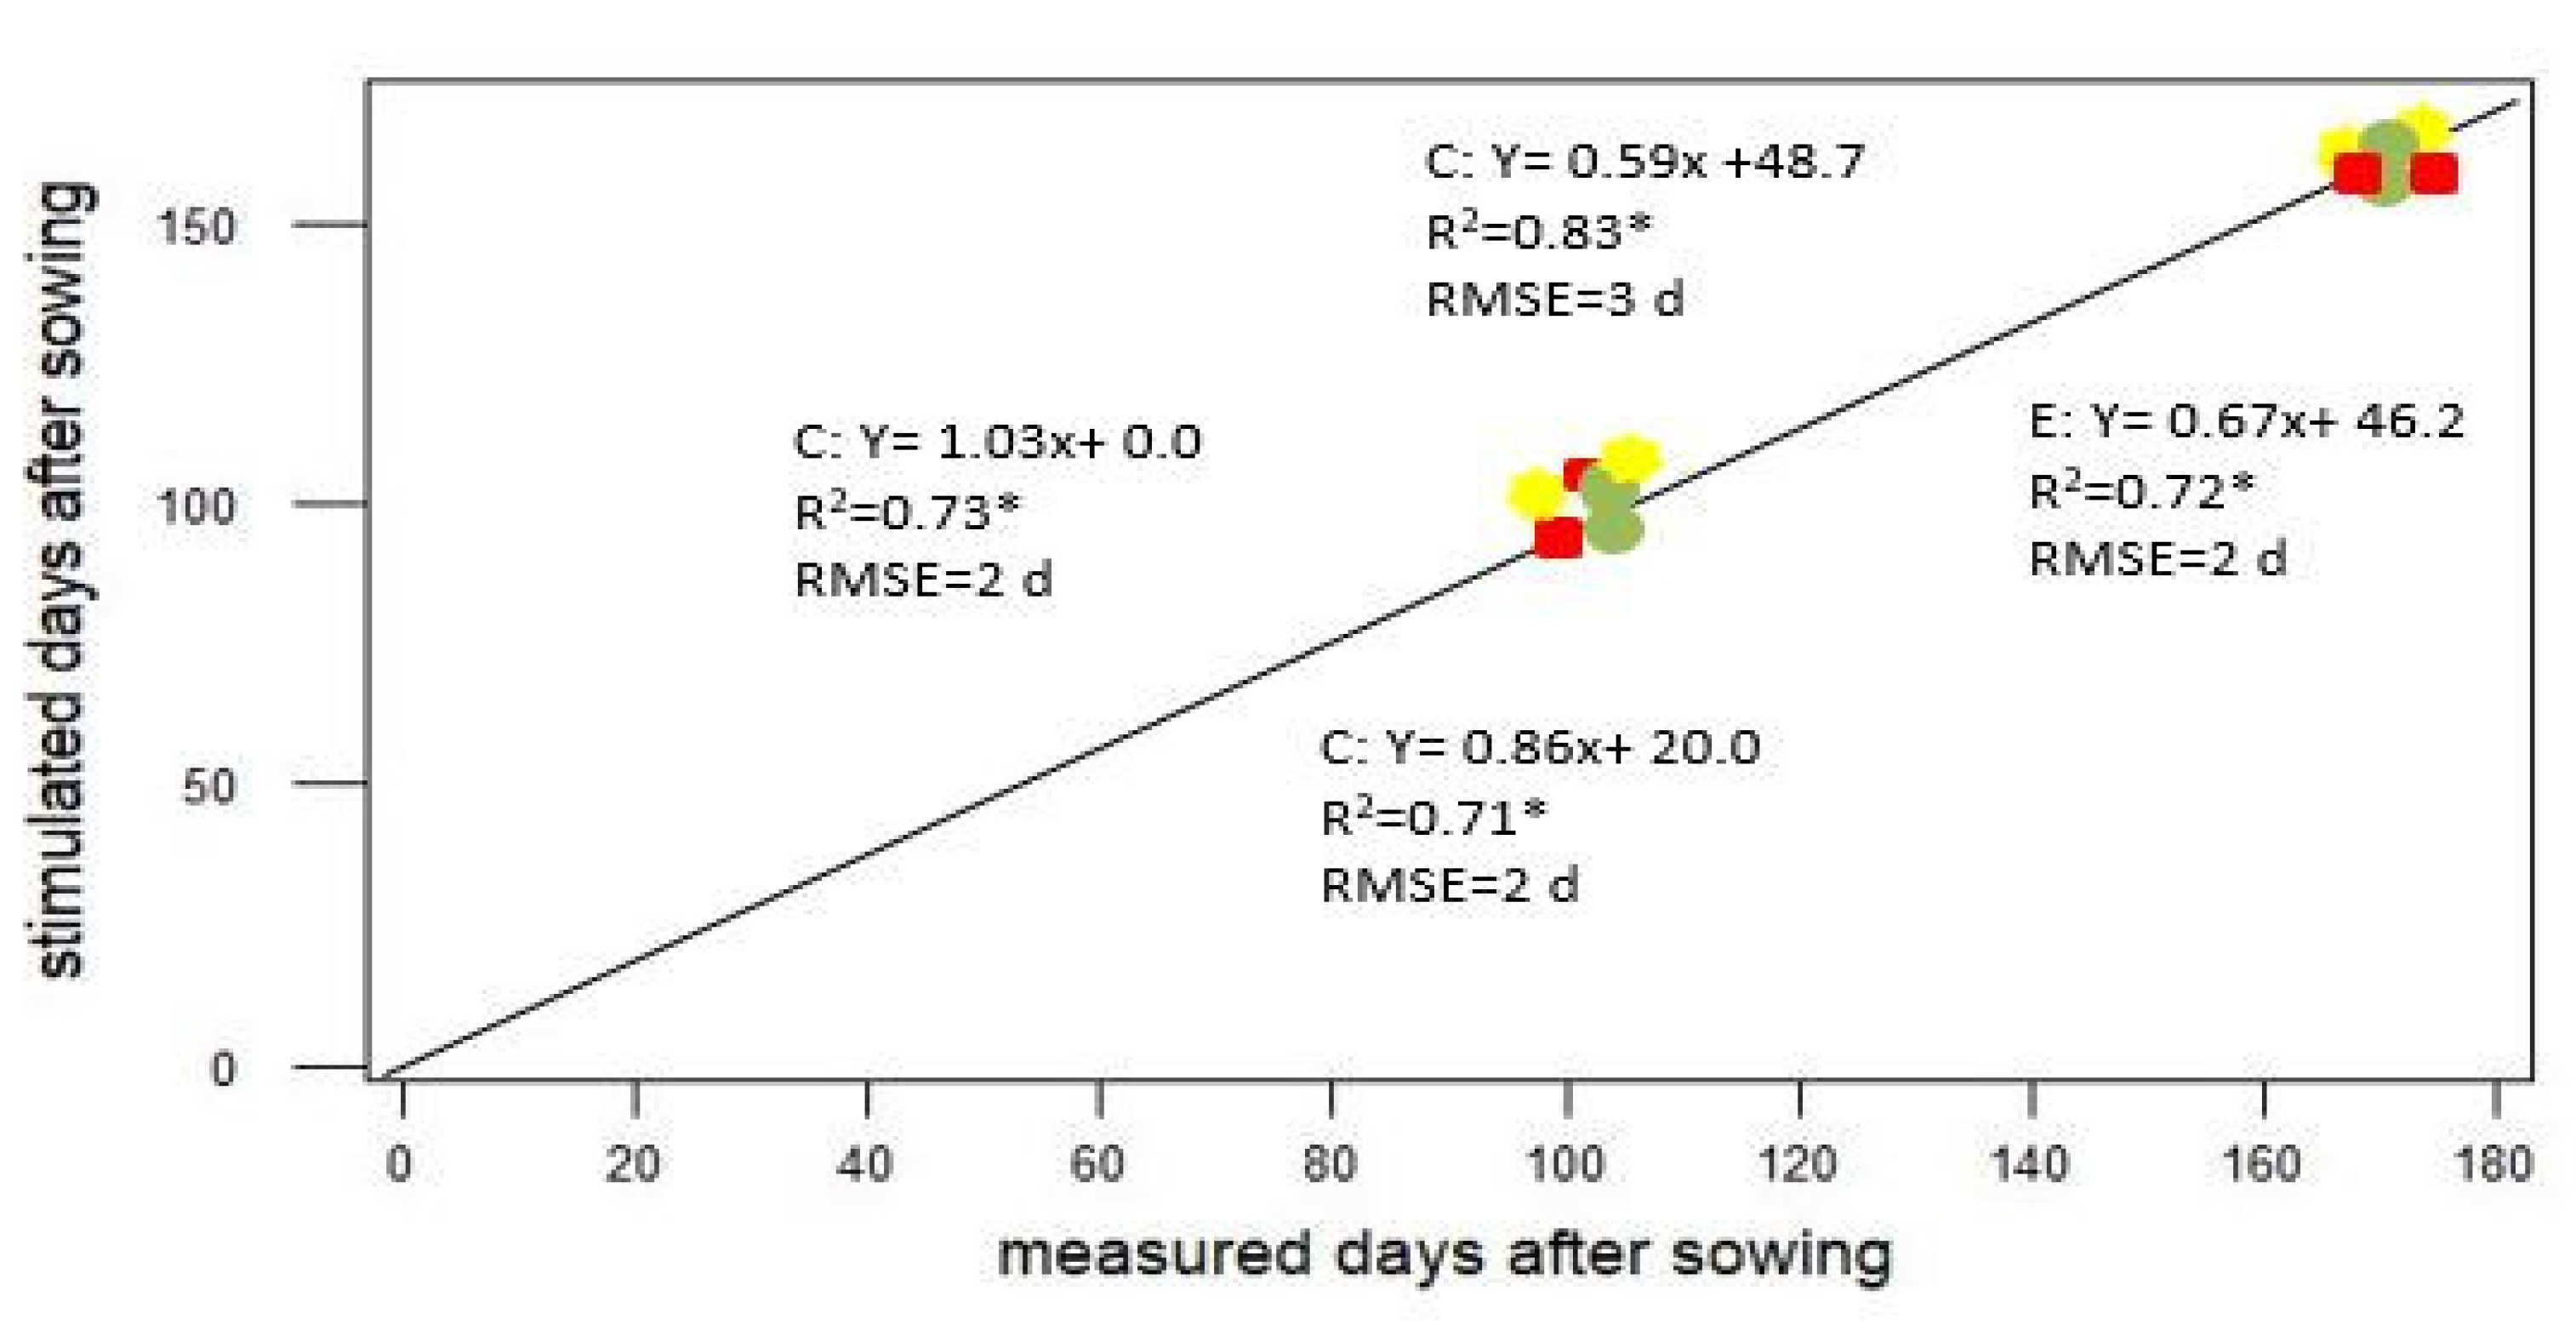
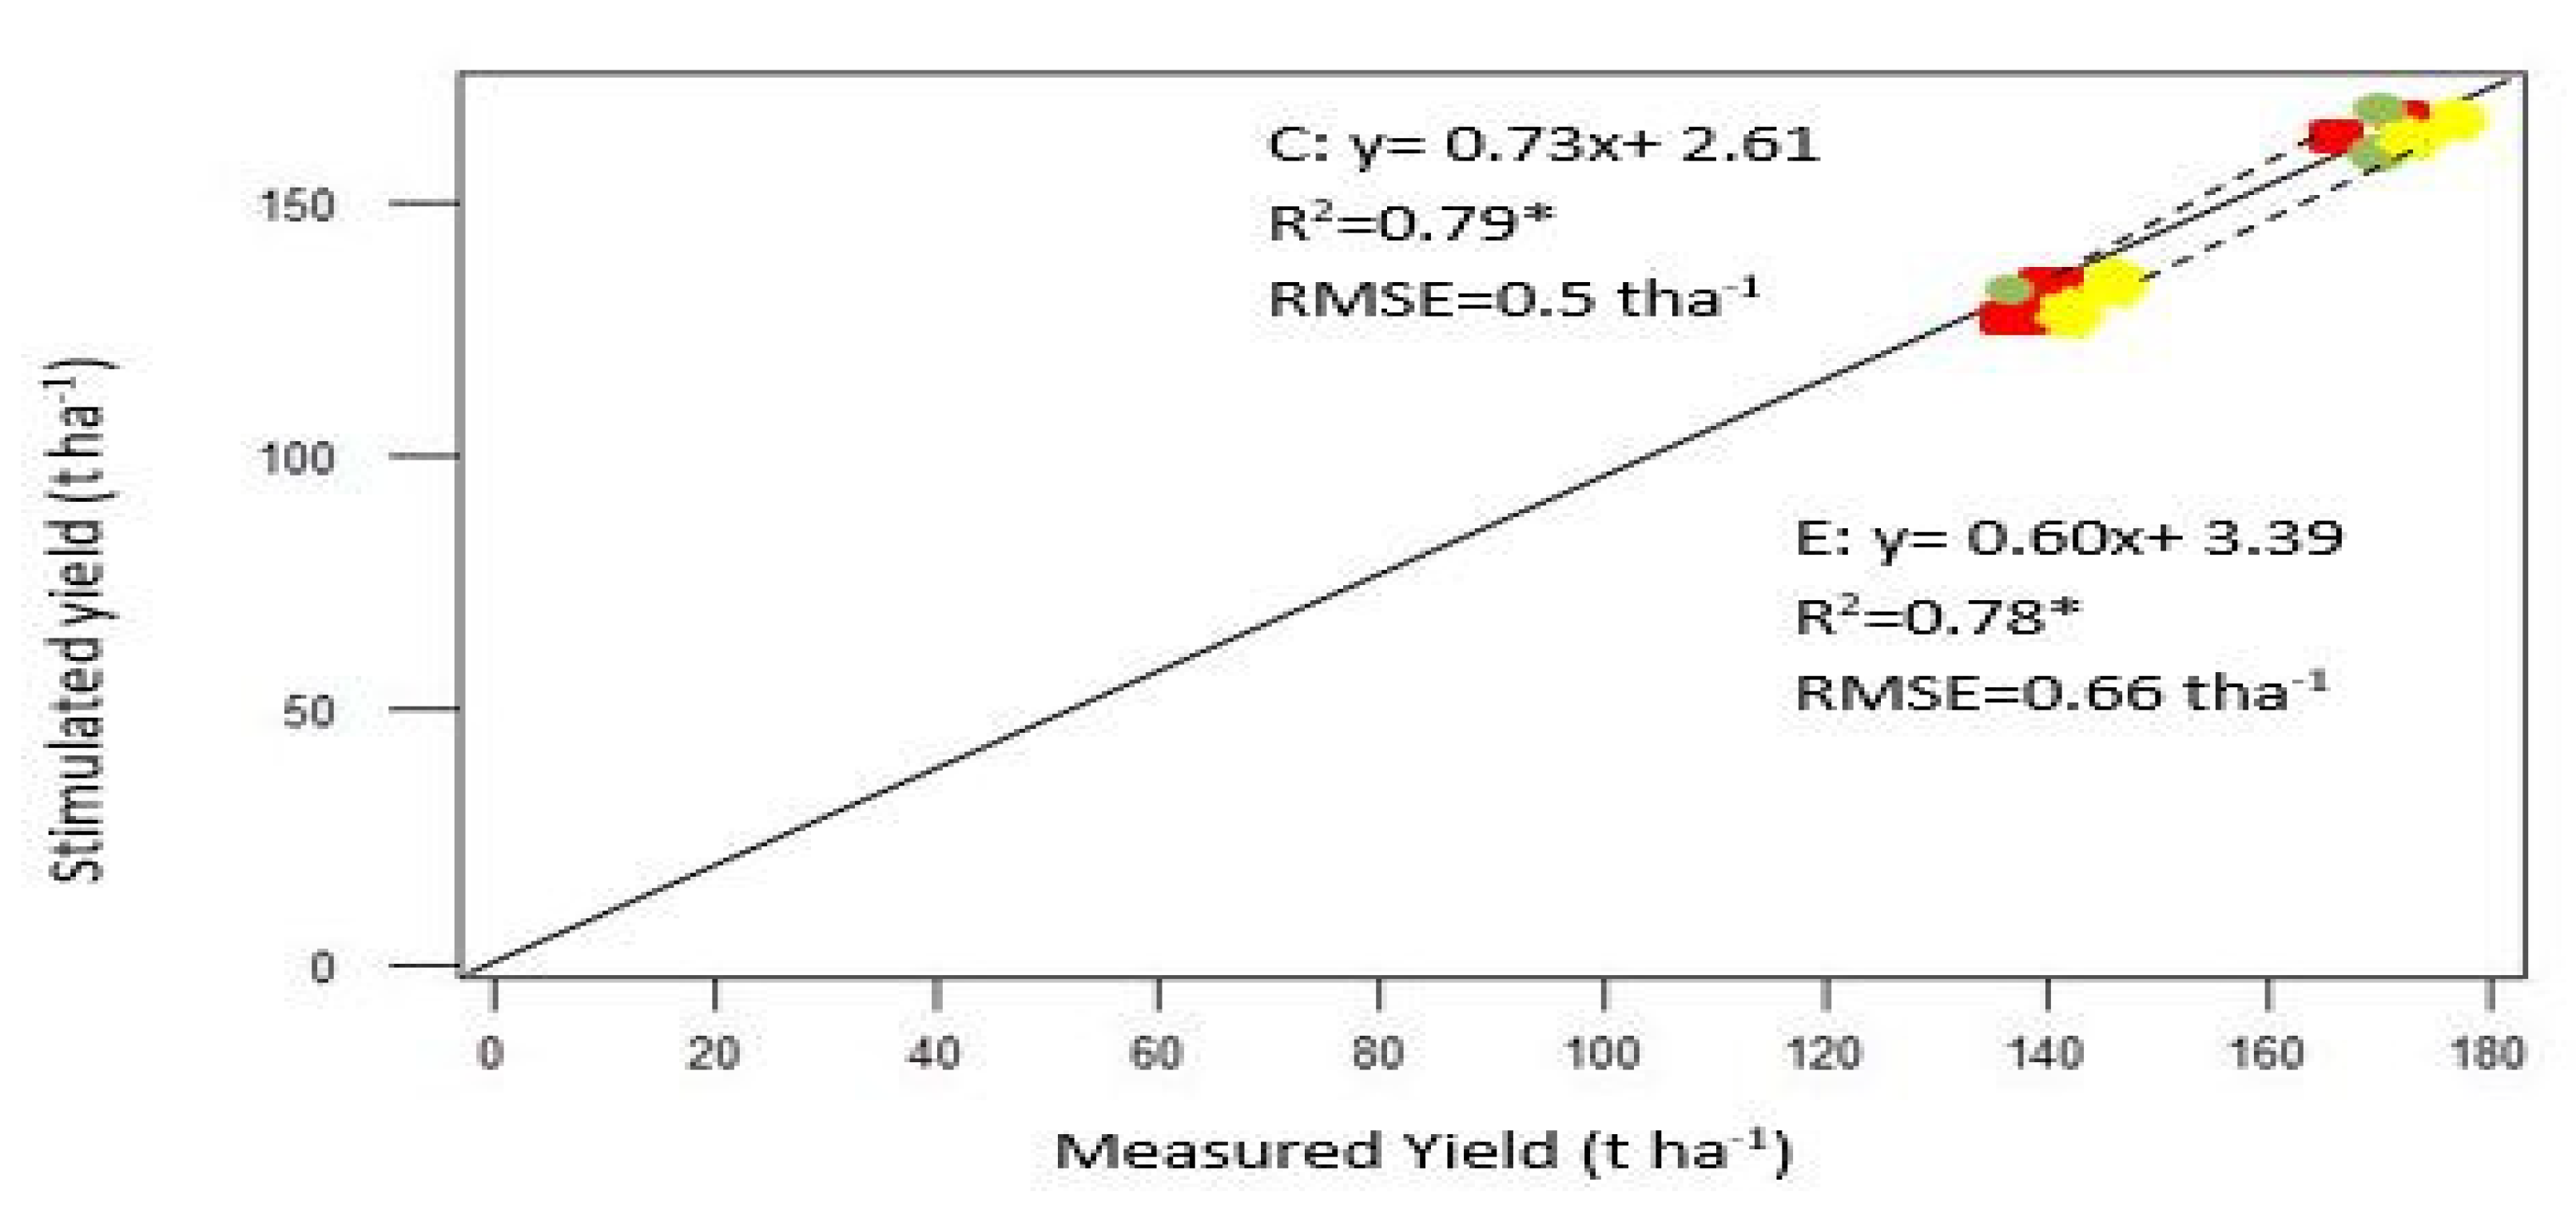
2.6. DSSAT Model Performance
2.7. Climate Change Impacts
2.8. Resistant Wheat Varieties
2.9. A Longer Grain-Filling Variety
3. Discussion
4. Materials and Methods
5. Experimental Plot
6. Conclusions
Author Contributions
Funding
Data Availability Statement
Acknowledgments
Conflicts of Interest
References
- Wolf, J. Comparison of two potato simulation models under climate change. Model calibration and sensitivity analyses. Clim. Res. 2002, 21, 173–186. [Google Scholar] [CrossRef] [Green Version]
- Singh, R.S.; Narain, P.; Sharma, K.D. Climate changes in Luni river basin of arid western Rajasthan (India). Vayu Mandal 2001, 31, 103–106. [Google Scholar]
- Hatfield, J.L.; Prueger, J.M. Temperature extremes: Effect on plant growth and development. Wthr. Cli. Extr. 2015, 10, 4–10. [Google Scholar] [CrossRef] [Green Version]
- Ewert, F.; Rounsevell, M.D.A.; Reginster, I.; Metzger, M.G.; Leemans, R. Future scenarios of European agricultural land use. I. Estimating changes in crop productivity. Agri. Eco. Envir. 2005, 107, 101–116. [Google Scholar] [CrossRef]
- Parry, M.; Rosenzweig, C.; Inglesias, A.; Livermore, M.; Gischer, G. Effects of climate change on global food production under SRES emissions and socio-economic scenarios. Glob. Envir. Chang. 2004, 14, 53–67. [Google Scholar] [CrossRef]
- Sivakumar, M.V.K.; Das, H.P.; Brunini, O. Impacts of present and future climate variability and change in agriculture and forestry in the arid and semi-arid tropics. Clim. Change 2005, 70, 31–72. [Google Scholar] [CrossRef]
- IPCC. Climate Change 2007—Impacts, Adaptation and Vulnerability. In Contribution of Working Group II to the Fourth Assessment Report of the Intergovernmental Panel on Climate Change; Parry, M.L., Canziani, O.F., Palutikof, J.P., Van der Linden, P.J., Hanson, C.E., Eds.; Cambridge University Press: Cambridge, UK, 2007. [Google Scholar]
- Srinivasarao, C.; Gopinath, K.A.; Prasad, J.V.N.S.; Prasanna, K.; Singh, A.K. Climate resilient villages for sustainable food security in tropical India: Concept, process, technologies, institutions, and impacts. Adv. Agron. 2016, 140, 101–214. [Google Scholar]
- GOP. Pakistan Economic Survey 2011-12; Ministry of Finance, Government of Pakistan: Islamabad, Pakistan, 2013; pp. 19–23.
- GOP. Pakistan Economic Survey 2007-08; Ministry of Finance, Government of Pakistan: Islamabad, Pakistan, 2008; pp. 22–23.
- Ahmad, M.; Farooq, U. State of food security in Pakistan: Future challenges and coping strategies. Pak. Dev. Rev. 2010, 49, 903–923. [Google Scholar] [CrossRef] [Green Version]
- CIMMYT Business Plan 2006–2010, Translating the Vision of Seeds of Innovation into a Vibrant Work Plan; Centro International the Mejoramiento the Maiz Trigo: El Batan, Mexico, 2005; pp. 31–37.
- Pathak, H.; Ladha Aggarwal, P.K.; Peng, S.; Das, S.; Singh, Y.; Singh, B.; Kamra, S.K.; Mishra, B.; Sastri, A.S.R.A.S.; Aggarwal, H.P.; et al. Trends of climatic potential and on-farm yields of rice and wheat in the Indo-Gangetic Plains. Field Crops Res. 2003, 80, 223–234. [Google Scholar] [CrossRef]
- Saini, A.; Nanda, R. Analysis of temperature and photoperiodic response to flowering in wheat. J. Agric. Sci. 1987, 57, 351–359. [Google Scholar]
- Kumar, A.; Singh, A. Climate Change and Its Impact on Wheat Production and Mitigation through Agroforestry Technologies. Int. J. Env. Sci. 2014, 5, 73–90. [Google Scholar]
- Adiqa, K.; Iqbal, T. Climate Change Impact on Wheat Yield in Pakistan (An Application of ARDL Approach). Nust. J. Social. Sci. Hum. 2018, 4, 240–262. [Google Scholar]
- Abrol, Y.P.; Bagga, A.K.; Chakravorty, N.V.K.; Wattal, P.N. Impact of rise in temperature on productivity of wheat in India. In Impact of Global Climate Change on Photosynthesis and Plant Productivity; Oxford Publishers: New Delhi, India, 1991; pp. 787–798. [Google Scholar]
- Abrol, Y.P.; Ingram, K.T. Effects of higher day and night temperatures on growth and yields of some crop plants. In Global Climate Change and Agricultural Production. Direct and Indirect Effects of Changing Hydrological, Pedological and Plant Physiological Processes; Bazzaz, F., Sombroek, W., Eds.; FAO: Rome, Italy; John Wiley and Sons: Chichester, UK, 1996; pp. 123–140. [Google Scholar]
- Aggarwal, P.K.; Sinha, S.K. Effect of probable increase in carbon dioxide and temperature on productivity of wheat in India. J. Agric. Meteorol. 1993, 48, 811–814. [Google Scholar] [CrossRef]
- Aggarwal, P.K. Impact of climate change on Indian agriculture. J. Plant. Bio. 2003, 30, 189–198. [Google Scholar] [CrossRef]
- Maloney, E.D.; Camargo, S.J.; Chang, E.; Colle, B.; Fu, R.; Geil, K.L. North American Climate in CMIP5 Experiments: Part III: Assessment of 21st Century Projections. J. Clim.Sci. 2013, 27, 342–356. [Google Scholar]
- Moss, R.H.; Edmonds, J.A.; Hibbard, K.A.; Manning, M.R.; Rose, S.K.; van Vuuren, D.P. The next generation of scenarios for climate change research and assessment. Nature 2010, 4, 747–756. [Google Scholar] [CrossRef]
- Vuuren, D.P.; Edmonds, J.; Kainuma, M.; Riahi, K.; Thomson, A.; Hibbard, K. The representative concentration pathways: An overview. Clim. Change 2011, 109, 5–31. [Google Scholar] [CrossRef]
- Harris, I.; Jones, P.D.; Osborn, T.J.; Lister, D.H. Updated high-resolution grids of monthly climatic observations—The CRU TS3.10 Dataset. Int. J. Climatol. 2014, 34, 623–642. [Google Scholar] [CrossRef] [Green Version]
- Gudmundsson, L.; Bremnes, J.B.; Haugen, J.E.; Engen-Skaugen, T. Technical Note: Downscaling RCM precipitation to the station scale using statistical transformations—A comparison of methods. Hydrol. Earth Syst. Sci. 2012, 16, 3383–3390. [Google Scholar] [CrossRef] [Green Version]
- Boe, J.; Terray, L.; Habets, F.; Martin, E. Statistical and dynamical downscaling of the Seine basin climate for hydro-meteorological studies. Int. J. Climatol. 2007, 27, 1643–1655. [Google Scholar] [CrossRef]
- Hesse, P.R. A Textbook of Soil Chemical Analysis; John Murray: London, UK, 1971; p. 520. [Google Scholar]
- Ukpong, E.C.; Antigha, R.E.; Moses, E.O. Assessment of heavy metals content in soil and plants around waste dumpsites in Uyo Metropolis, Akwa Ibom State. Int. J. Eng. Sci. 2013, 2, 75–86. [Google Scholar]
- Arshi, I.; Khan, T. Analysis of Soil Quality Using Physico-Chemical Parameters with Special Emphasis on Fluoride from Selected Sites of Sawai Madhopur Tehsil, Rajasthan. Int. J. Environ. Sci. Nat. Res. 2018, 12, 555847. [Google Scholar]
- Blake, G.R.; Hartge, K.H. Bulk density by Core Method. In Methods of Soil Analysis; Klute, A., Ed.; Part I; American Society of Agronomy: Madison, WI, USA, 1986; Volume 9, pp. 364–367. [Google Scholar]
- Dandwate, S.C. Analysis of soil samples for its physicochemical parameters from Sangamner city. GSC Biol. Pharm. Sci. 2020, 12, 123–128. [Google Scholar] [CrossRef]
- Olsen, S.R.; Sommers, L.E. Phosphorus. In Methods of Soil Analysis; Klute, A., Ed.; Part I; American Society of Agronomy: Madison, WI, USA, 1986; Volume 9, pp. 403–427. [Google Scholar]
- Marshal, S. Analysis of soil samples for its physico-chemical parameters from Abohar city. Phar. Innov. J. 2016, 5, 37–39. [Google Scholar]
- Chen, J.; Chen, D.; Xu, Q.; Fuhrmann, J.J.; Li, L.; Pan, G.; Li, Y.; Qin, H.; Liang, C.; Sun, X. Organic carbon quality, composition of main microbial groups, enzyme activities, and temperature sensitivity of soil respiration of an acid paddy soil treated with biochar. Biol. Fertil. Soils 2019, 55, 185–197. [Google Scholar] [CrossRef]
- Rhoades, J.D. Soluble Salts (Electrical Conductivity). In Methods of Soil Analysis, 2nd ed.; Page, A.L., Miller, R.H., Keey, D.R., Eds.; American Society of Agronomy: Madison, WI, USA, 1986; Volume 9, pp. 172–173. [Google Scholar]
- Tebaldi, C.; Lobell, D. Towards probabilistic projections of climate change impacts on global crop yields. Geophys. Res. Lett. 2008, 35, 307–315. [Google Scholar] [CrossRef]
- Rosenzweig, C.; Elliott, J.; Deryng, D.; Ruane, A.C.; MÜller, C.; Arneth, A. Assessing agricultural risks of climate change in the 21st century in a global gridded crop model intercomparison. Proc. Natl. Acad. Sci. USA 2014, 111, 3268–3273. [Google Scholar] [CrossRef] [Green Version]
- Jones, J.W.; Hoogenboom, G.; Porter, C.H.; Boote, K.J.; Batchelor, W.D.; Hunt, L.A.; Wilkens, P.W.; Singh, U.; Gijsman, A.J.; Ritchie, J.T. The DSSAT cropping system model. Europ. J. Agronomy 2003, 18, 235–265. [Google Scholar] [CrossRef]
- Jones, J.W.; Keating, B.A.; Porter, C.H. Approaches to modular model development. Agric. Syst. 2001, 70, 421–443. [Google Scholar] [CrossRef]
- Porter, C.; Jones, J.W.; Braga, R. An approach for modular crop model development. In International Consortium for Agricultural Systems Applications; Campus Rd.: Honolulu, HI, USA, 2000; p. 13. [Google Scholar]
- Carberry, P.S.; Muchow, R.C.; McCown, R.L. Testing the CERES-Maize simulation model in a semi-arid tropical environment. Field Crops Res. 1989, 20, 297–315. [Google Scholar] [CrossRef]
- Zhao, X.; Zhang, Y. Asymptotic normality of nonparametric m-estimators with applications to hypothesis testing for panel count data. Stat. Sin. 2017, 27, 931–950. [Google Scholar] [CrossRef] [Green Version]
- Obembe, O.S.; Hendricks, N.P.; Tack, J. Decreased wheat production in the USA from climate change driven by yield losses rather than crop abandonment. PLoS ONE 2021, 16, e0252067. [Google Scholar] [CrossRef] [PubMed]
- Chen, C.; Zhou, G.; Pang, Y. Impacts of climate change on maize and winter wheat yields in China from 1961 to 2010 based on provincial data. J. Agri. Sci. 2015, 153, 825–836. [Google Scholar] [CrossRef] [Green Version]
- Barnabas, B.; Jager, K.; Feher, A. The effect of drought and heat stress on reproductive processes in cereals. Plant Cell Env. 2008, 31, 11–38. [Google Scholar] [CrossRef]
- Muhammad, F.A. Responsis of Bio-Fertilizer Against Growth And Yield of Different Types of Solanum lycopersicum. Int. J. Plant Sci. Phytomedicins 2021, 1, 110–116. [Google Scholar]


| Years | Soil Type | Soil pH | Total Organic Carbon (%) | P-Content of Soil (mg/L) | Total Saturation Point (%) | Organic Matter Content (%) |
|---|---|---|---|---|---|---|
| 2019–2020 | Loamy | 7.56 | 10 | 11 | 28 | 0.45 |
| 2020–2021 | Loamy | 7.89 | 06 | 08 | 33 | 0.31 |
| Climatic Parameters | ||||||
| Years | Max. Temp (°C) | Min. Temp (°C) | Rainfall (mm) | Humidity (%) | Soil Moisture Content (%) | Solar Radiation (kWh/m2) |
| 2019–2020 | 33 | 21 | 0.6 mm | 33.5 | 25 | 5–7 kWh/m2 |
| 2020–2021 | 31 | 17 | 0.0 mm | 16.5 | 22 | 5–7 kWh/m2 |
| Name of Variety Used | |||||||||||||||
|---|---|---|---|---|---|---|---|---|---|---|---|---|---|---|---|
| Sialkot–2008 | Punjab–2018 | ||||||||||||||
| Sr.No | Area | Year | Flag Leave Formation | Sowing Days | Spikelet’s Formation | Maturity Days | Yield (t/ha) | Sr.No | Area | Year | Flag Leave Formation | Sowing Days | Spikelet’s Formation | Maturity Days | Yield (t/ha) |
| 1. | North Iftikharabad (Chamb), | 2019–2020 | 20 | 114 | 163 | 168 | 10.4 | 1. | North Iftikharabad (Chamb) | 2019–2020 | 21 | 118 | 167 | 176 | 11.5 |
| 2020–2021 | 21 | 116 | 165 | 170 | 9.9 | 2020–2021 | 22 | 119 | 169 | 173 | 11.4 | ||||
| 2. | Dander kot | 2019–2020 | 20 | 113 | 149 | 171 | 10.2 | 2. | Dander kot | 2019–2020 | 21 | 117 | 155 | 176 | 11.3 |
| 2020–2021 | 18 | 115 | 153 | 173 | 10.1 | 2020–2021 | 22 | 114 | 154 | 175 | 11.7 | ||||
| 3. | Sarla | 2019–2020 | 21 | 116 | 162 | 169 | 8.7 | 3. | Sarla | 2019–2020 | 23 | 116 | 164 | 180 | 9.7 |
| 2020–2021 | 17 | 119 | 165 | 174 | 8.3 | 2020–2021 | 20 | 121 | 168 | 176 | 9.3 | ||||
| 4. | Kalash | 2019–2020 | 20 | 118 | 169 | 170 | 7.7 | 4. | Kalash | 2019–2020 | 21 | 119 | 167 | 178 | 8.5 |
| 2020–2021 | 18 | 120 | 170 | 173 | 7.1 | 2020–2021 | 22 | 122 | 172 | 177 | 8.4 | ||||
| 5. | Manana | 2019–2020 | 21 | 115 | 165 | 172 | 6.8 | 5. | Manana | 2019–2020 | 16 | 115 | 160 | 165 | 5.8 |
| 2020–2021 | 19 | 118 | 168 | 175 | 6.4 | 2020–2021 | 21 | 122 | 169 | 181 | 7.5 | ||||
| 6. | Mean/stand.dev. | 2019–2021 | 1.4 ± 0.2 | 1.5 ± 0.3 | 1.5 ± 0.3 | 1.2 ± 0.1 | 1.1 ± 0.1 | 6. | Mean/stand.dev. | 2019–2021 | 1.7 ± 0.7 | 1.9 ± 0.6 | 1.3 ± 0.6 | 1.9 ± 0.8 | 1.3 ± 0.8 |
| Parameters | Sialkot–2008 (V-1) | Punjab–2018 (V-2) | ||||
|---|---|---|---|---|---|---|
| Per Day Difference Value | t-Test | p-Value | Per Day Difference Value | t-Test | p-Value | |
| Flag leaves formation | 9 | 0.02 | 0.20 | 9 | 0.03 | 0.36 |
| Sowing days | 12 | 0.01 | 0.76 | 12 | 0.05 | 0.96 |
| Spikelet’s formation | 13 | 0.2 | 0.79 | 13 | 0.05 | 0.99 |
| Maturity days | 15 | 0.02 | 0.65 | 15 | 0.03 | 0.76 |
| Yield | 2 | 0.03 | 0.78 | 2 | 0.04 | 0.99 |
| Months | October | November | December | January | February | March | April |
|---|---|---|---|---|---|---|---|
| CSIRO-Mk3.6.0 | |||||||
| Temp (°C) | 1.6 | 1.5 | 0.6 | 0.7 | 0.9 | 1.3 | 1.4 |
| Precipitation (mm/day) | 0.2 | 1.8 | 1.4 | 0.4 | 0.3 | 1.1 | 1.0 |
| Humidity (%) | 1.2 | 1.0 | 1.5 | 0.6 | 0.4 | 0.2 | 0.6 |
| GISS-E2-R | |||||||
| Temp (°C) | 1.9 | 1.1 | 0.9 | 0.6 | 0.2 | 1.5 | 2.0 |
| Precipitation (mm/day) | 0.3 | 2.3 | 1.7 | 1.5 | 0.7 | 1.9 | 0.9 |
| Humidity (%) | 0.9 | 0.4 | 0.3 | 0.5 | 1.3 | 1.0 | 2.9 |
| MIROC5 | |||||||
| Temp (°C) | 2.7 | 2.8 | 1.7 | 0.3 | 0.5 | 1.3 | 2.5 |
| Precipitation (mm/day) | 0.4 | 2.0 | 1.9 | 1.6 | 0.9 | 1.5 | 0.6 |
| Humidity (%) | 0.4 | 2.1 | 1.5 | 1.3 | 0.9 | 1.7 | 0.4 |
| CCSM4 | |||||||
| Temp (°C) | 2.4 | 2.1 | 1.9 | 0.5 | 0.6 | 0.7 | 0.4 |
| Precipitation (mm/day) | 1.1 | 1.2 | 0.9 | 1.1 | 0.9 | 1.4 | 1.3 |
| Humidity (%) | 0.2 | 0.1 | 0.2 | 0.6 | 0.5 | 0.8 | 1.3 |
Publisher’s Note: MDPI stays neutral with regard to jurisdictional claims in published maps and institutional affiliations. |
© 2022 by the authors. Licensee MDPI, Basel, Switzerland. This article is an open access article distributed under the terms and conditions of the Creative Commons Attribution (CC BY) license (https://creativecommons.org/licenses/by/4.0/).
Share and Cite
Ishtiaq, M.; Maqbool, M.; Muzamil, M.; Casini, R.; Alataway, A.; Dewidar, A.Z.; El-Sabrout, A.M.; Elansary, H.O. Impact of Climate Change on Phenology of Two Heat-Resistant Wheat Varieties and Future Adaptations. Plants 2022, 11, 1180. https://doi.org/10.3390/plants11091180
Ishtiaq M, Maqbool M, Muzamil M, Casini R, Alataway A, Dewidar AZ, El-Sabrout AM, Elansary HO. Impact of Climate Change on Phenology of Two Heat-Resistant Wheat Varieties and Future Adaptations. Plants. 2022; 11(9):1180. https://doi.org/10.3390/plants11091180
Chicago/Turabian StyleIshtiaq, Muhammad, Mehwish Maqbool, Mahnoor Muzamil, Ryan Casini, Abed Alataway, Ahmed Z. Dewidar, Ahmed M. El-Sabrout, and Hosam O. Elansary. 2022. "Impact of Climate Change on Phenology of Two Heat-Resistant Wheat Varieties and Future Adaptations" Plants 11, no. 9: 1180. https://doi.org/10.3390/plants11091180
APA StyleIshtiaq, M., Maqbool, M., Muzamil, M., Casini, R., Alataway, A., Dewidar, A. Z., El-Sabrout, A. M., & Elansary, H. O. (2022). Impact of Climate Change on Phenology of Two Heat-Resistant Wheat Varieties and Future Adaptations. Plants, 11(9), 1180. https://doi.org/10.3390/plants11091180