
Functional Anatomy, Impact Behavior and Energy Dissipation of the Peel of Citrus × limon: A Comparison of Citrus × limon and Citrus maxima


Abstract
:
1. Introduction
2. Results
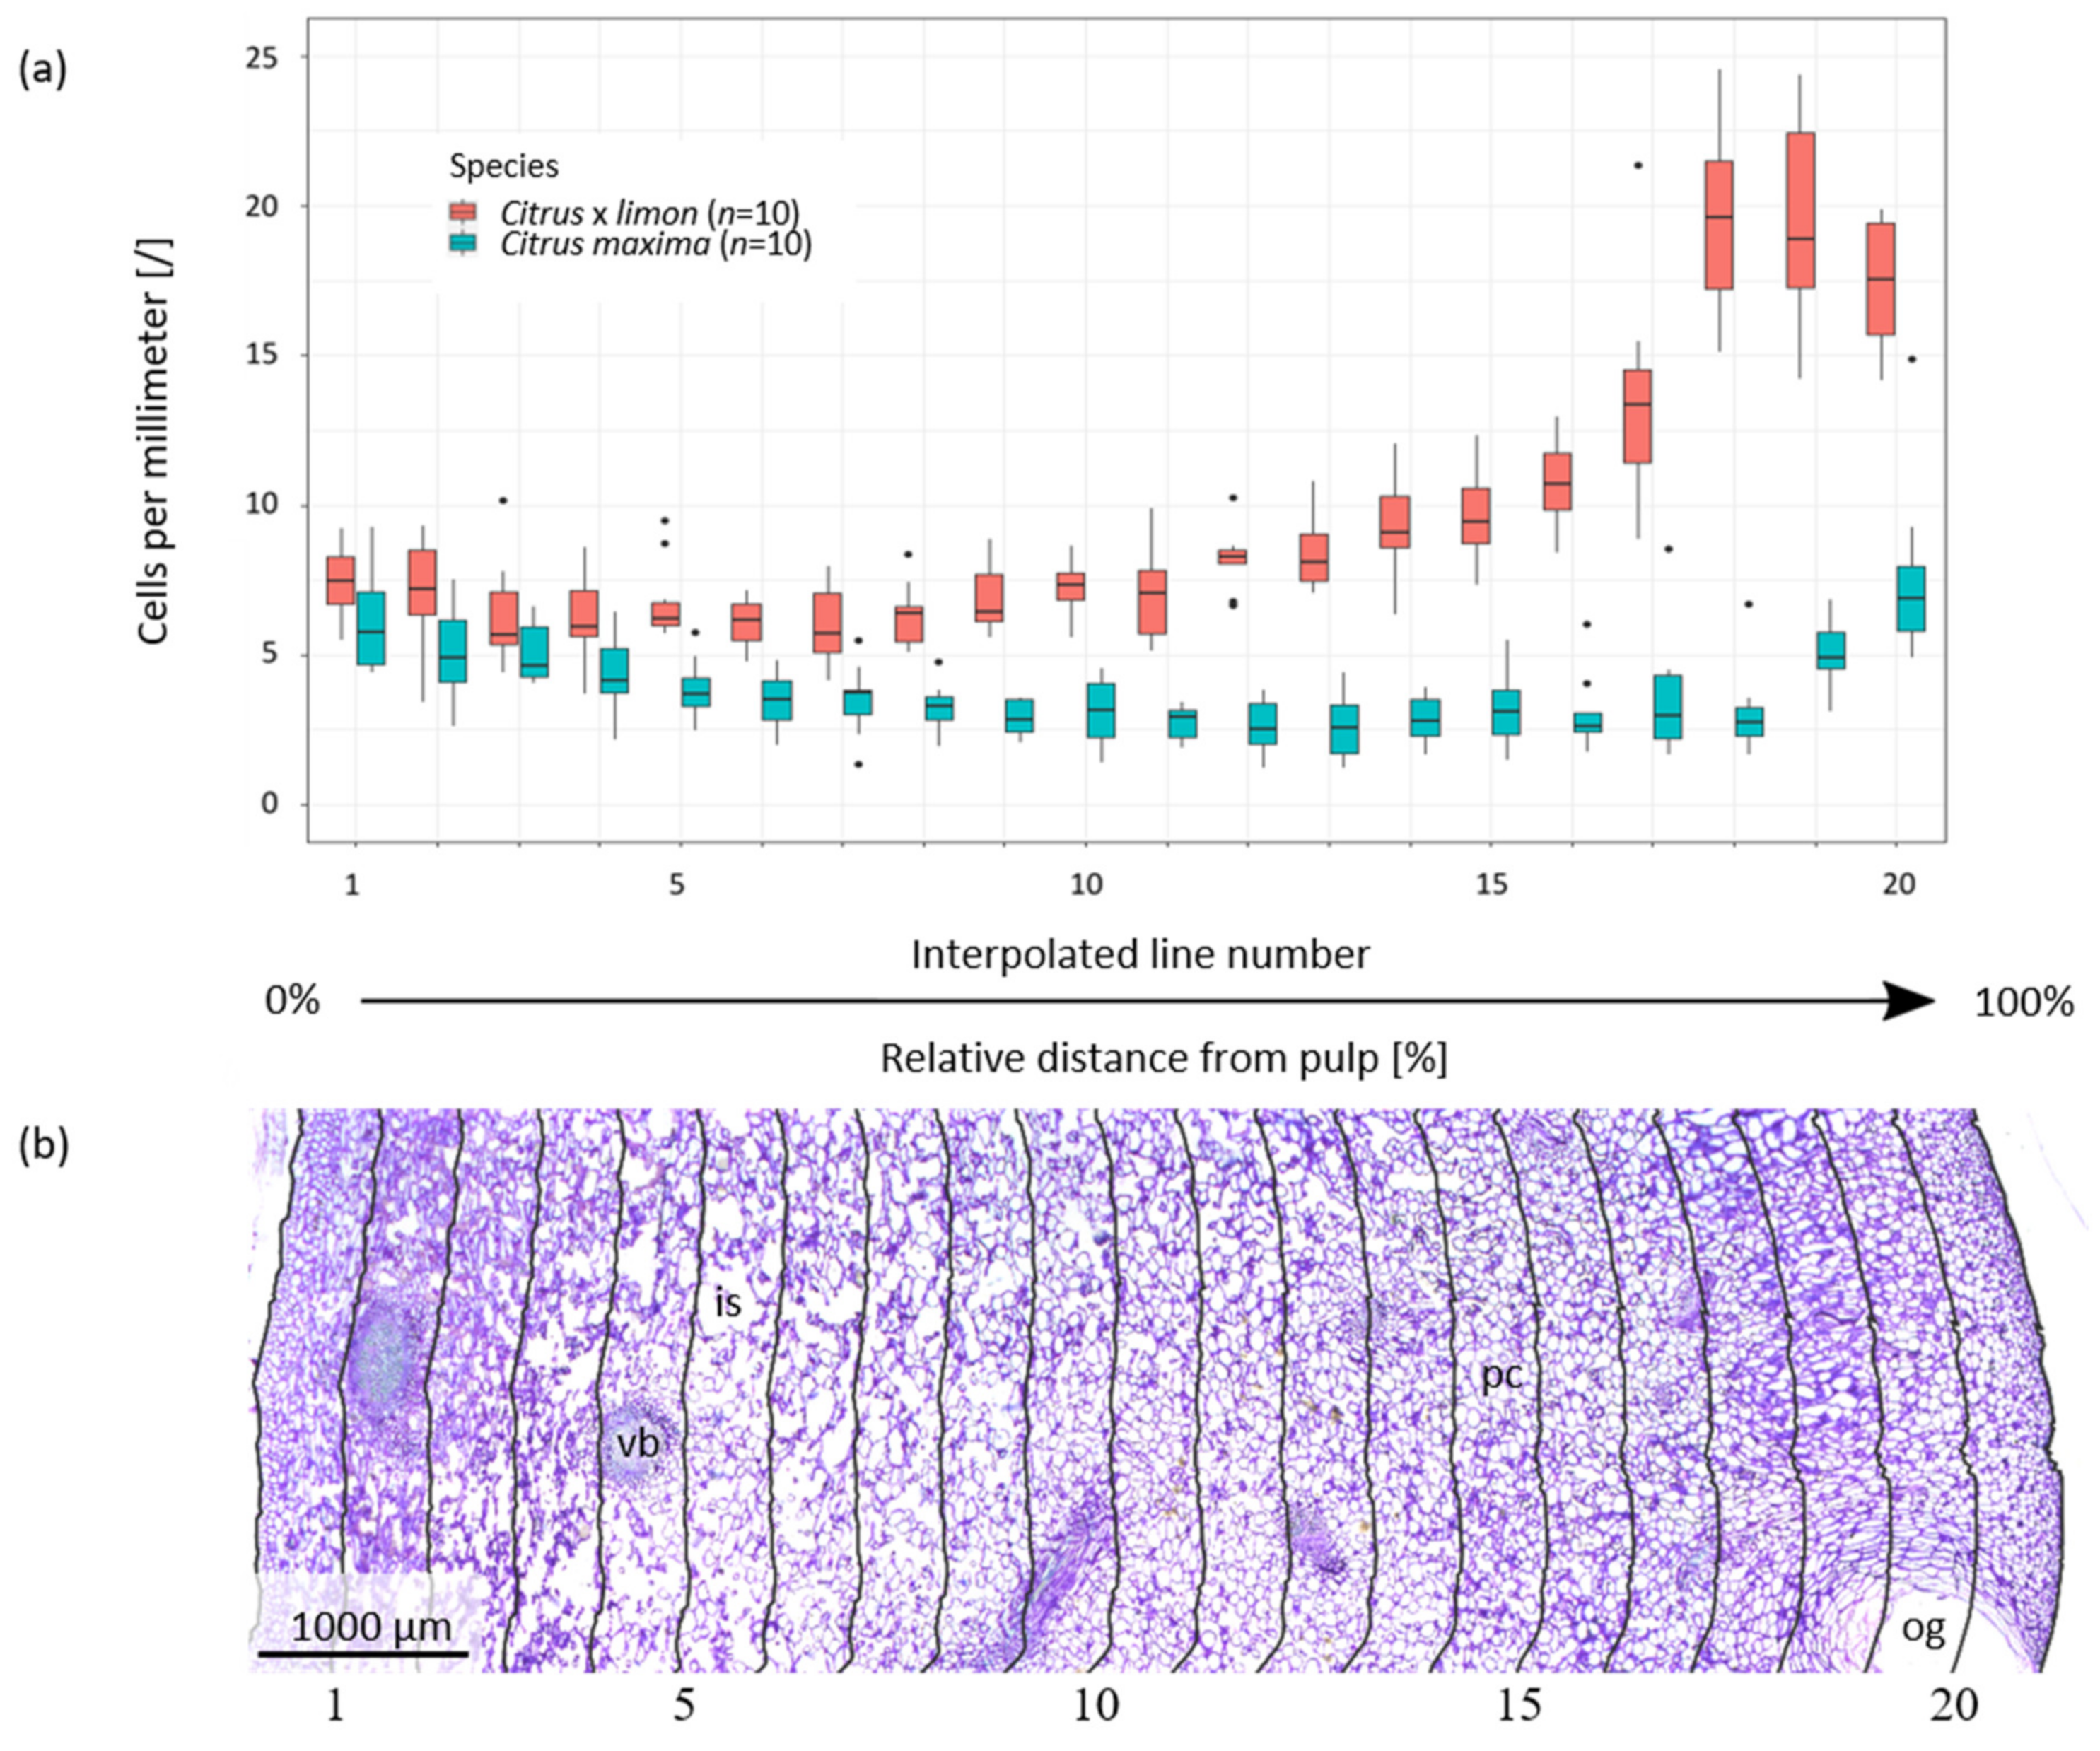
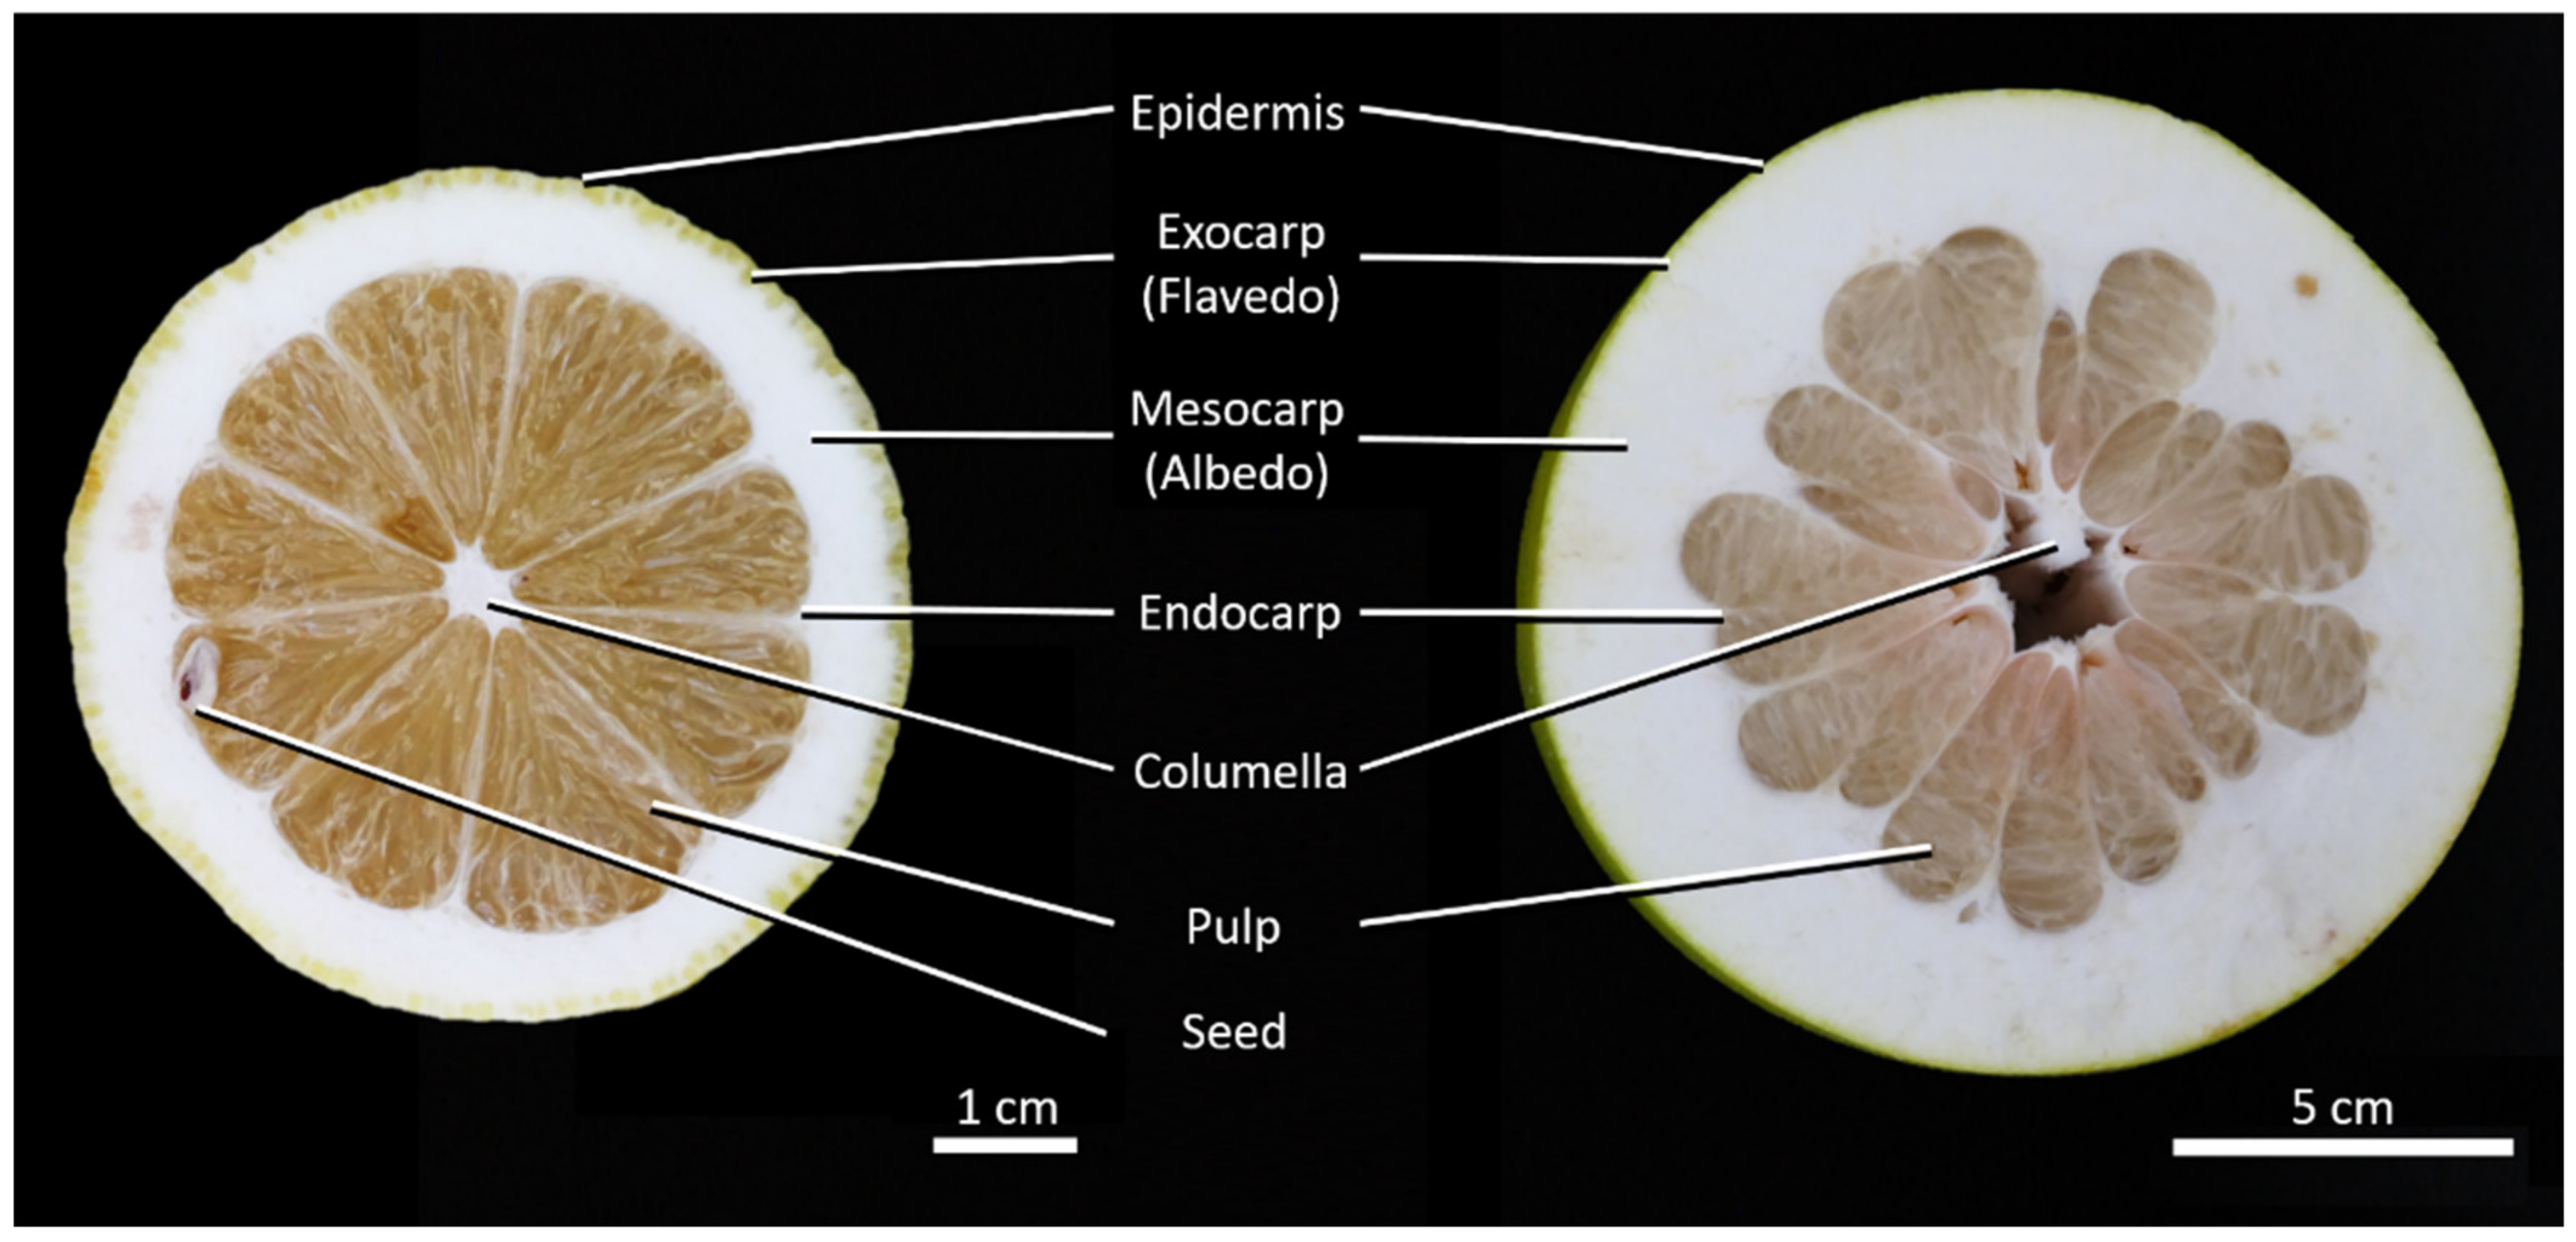
2.1. Anatomy
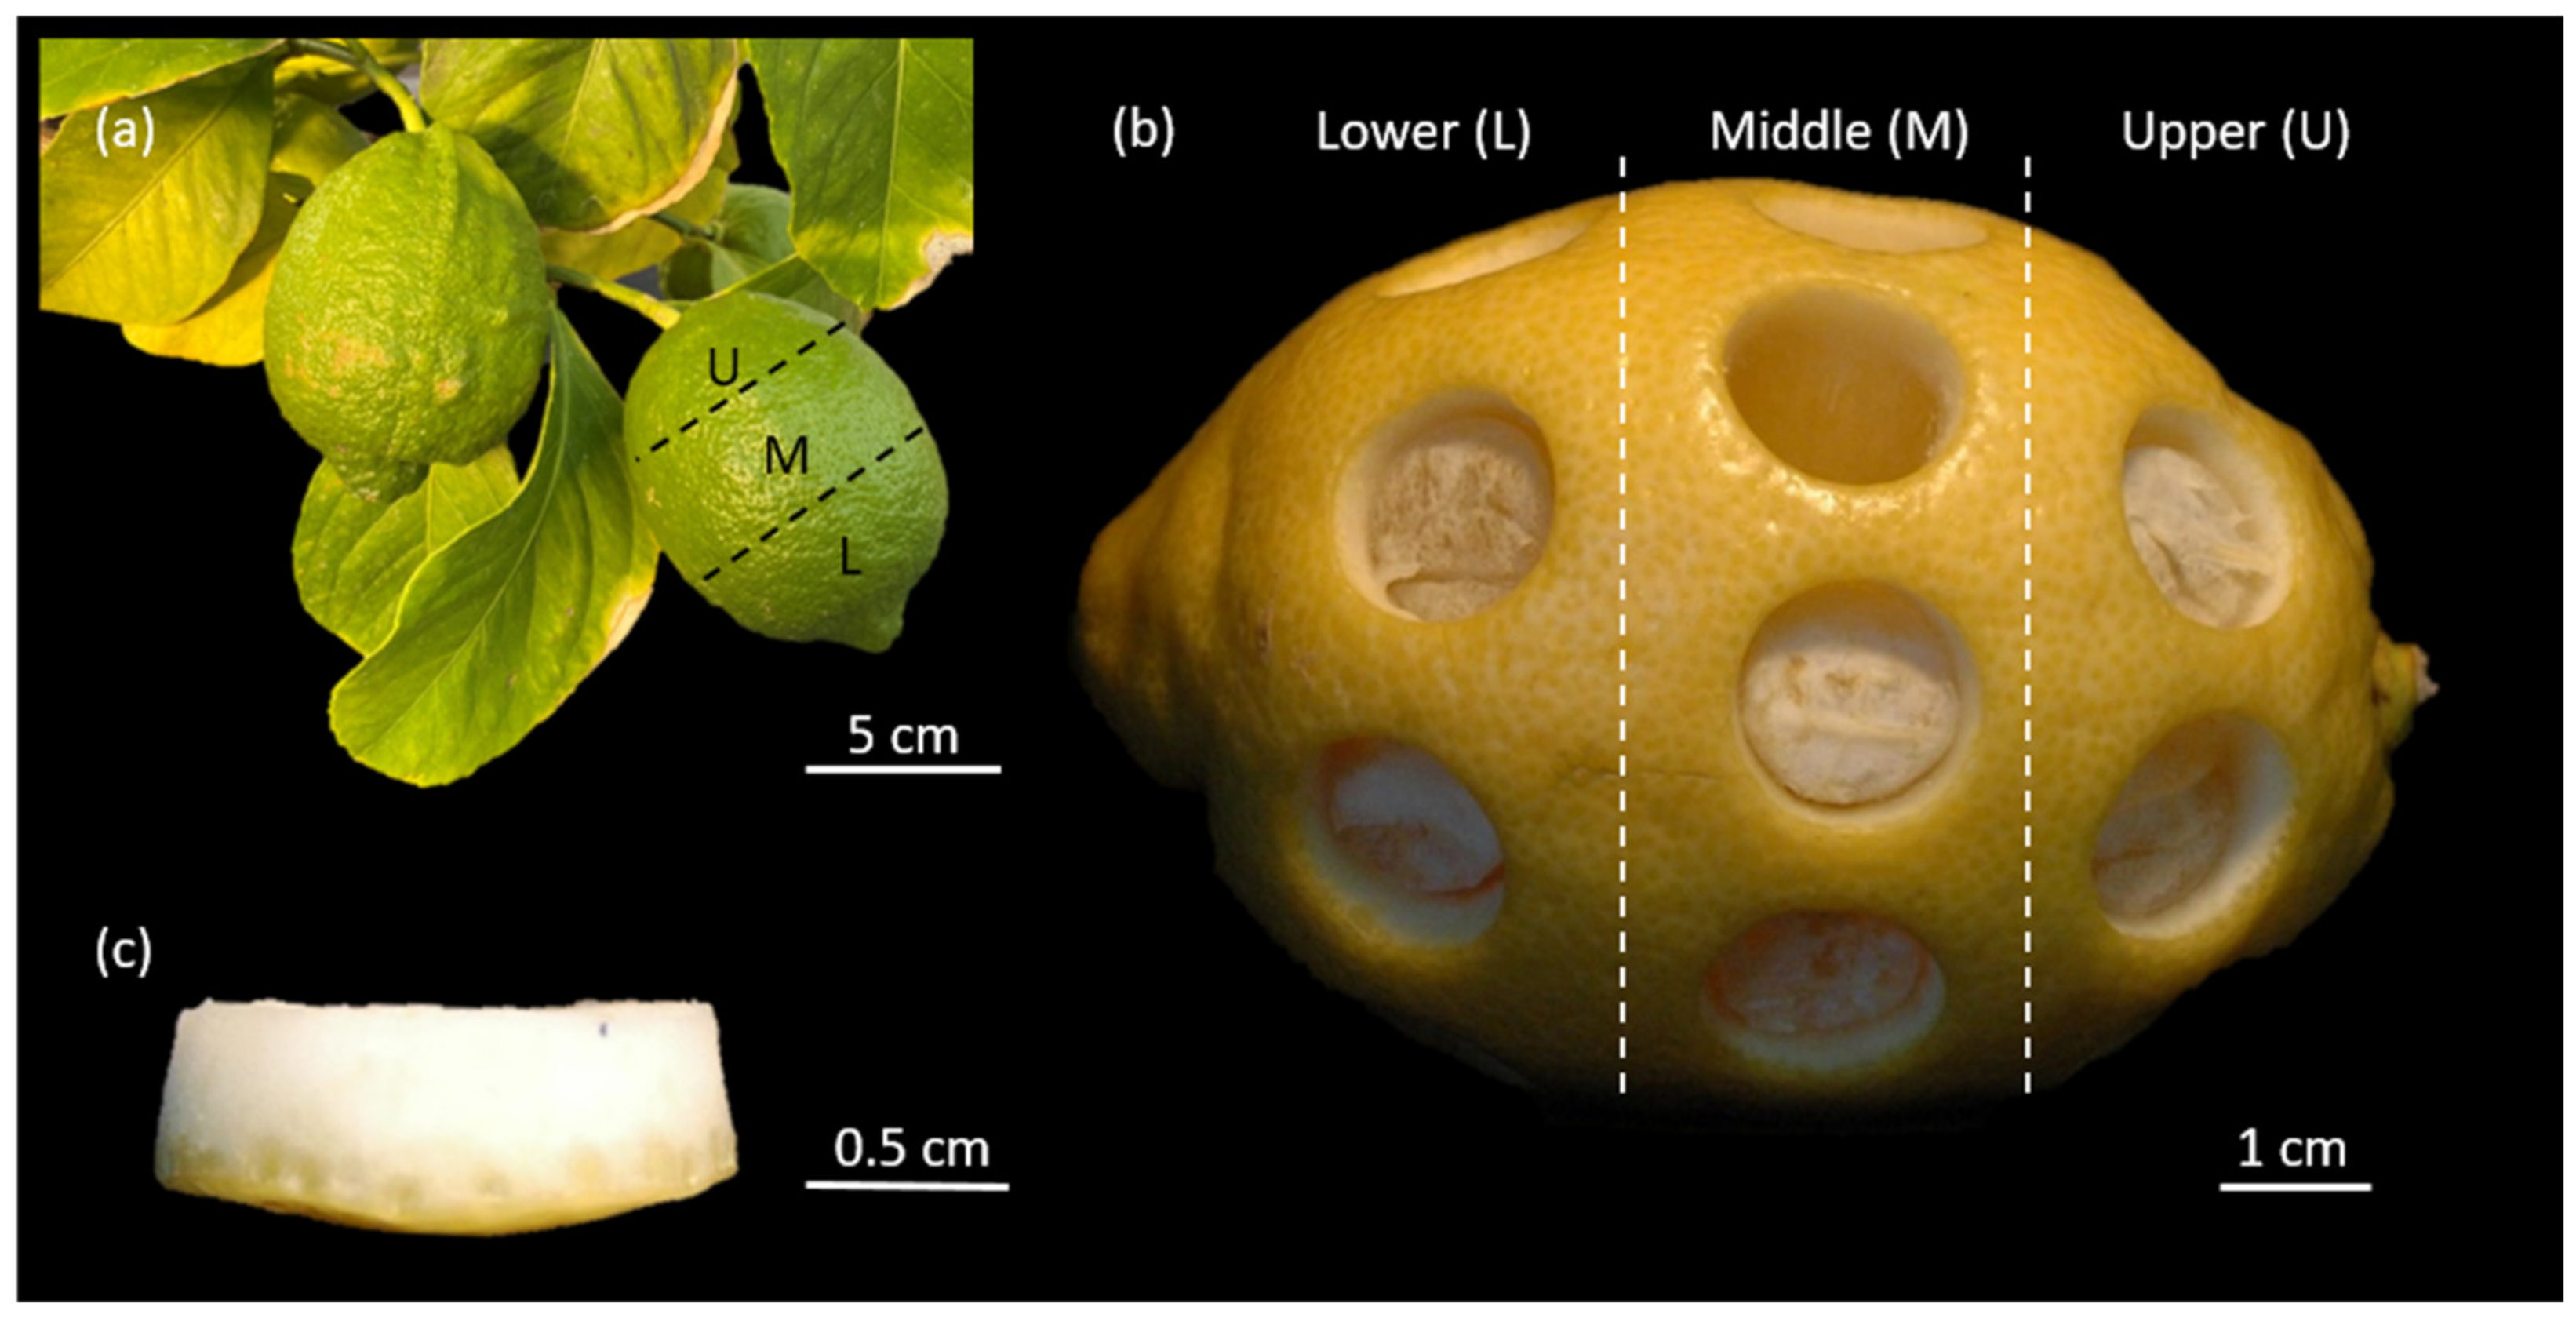
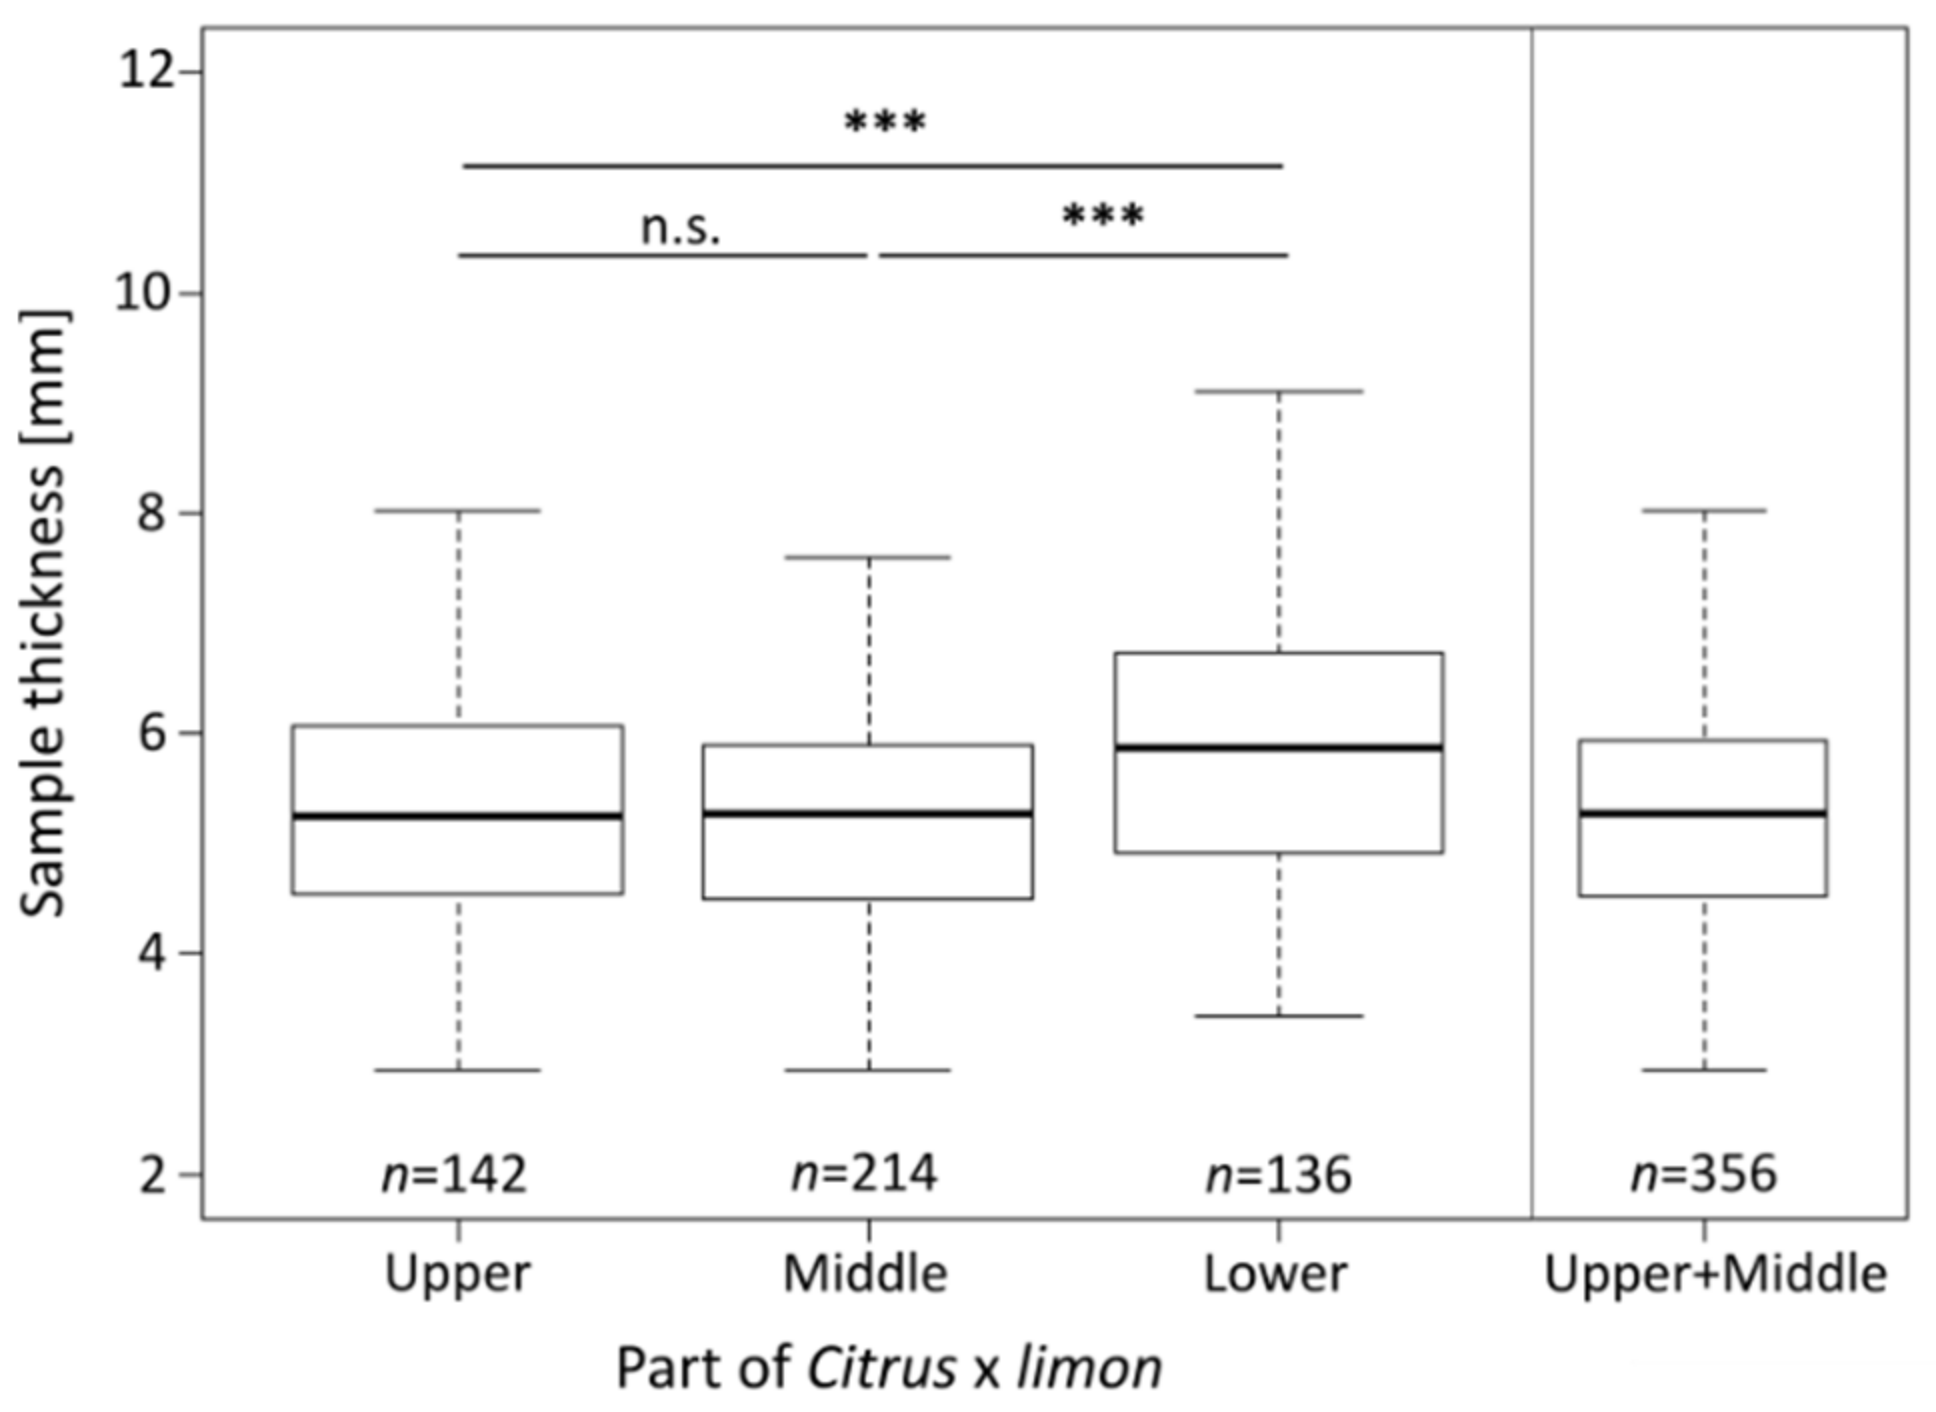
2.2. Sample Thickness
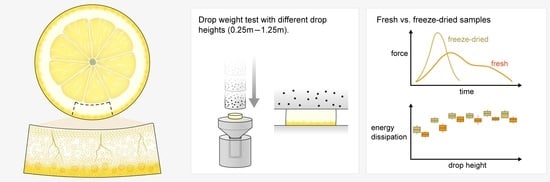
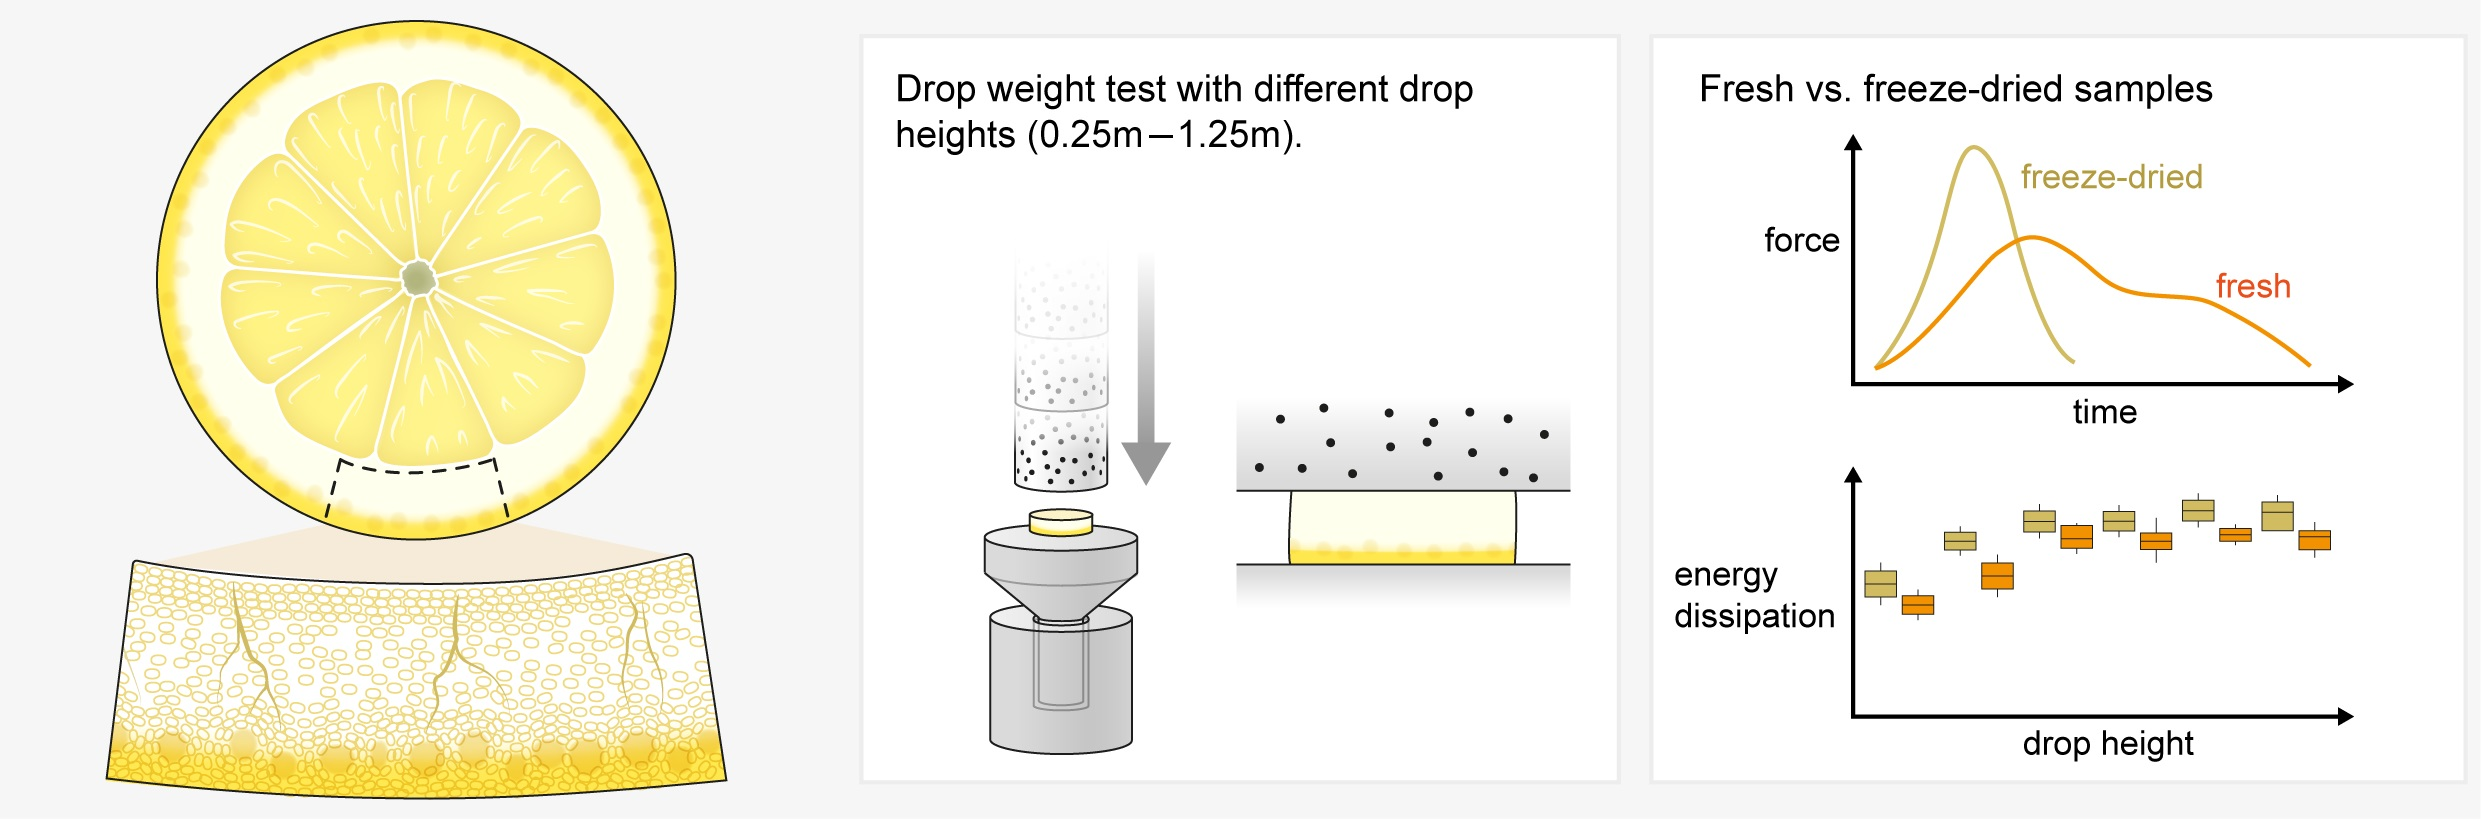
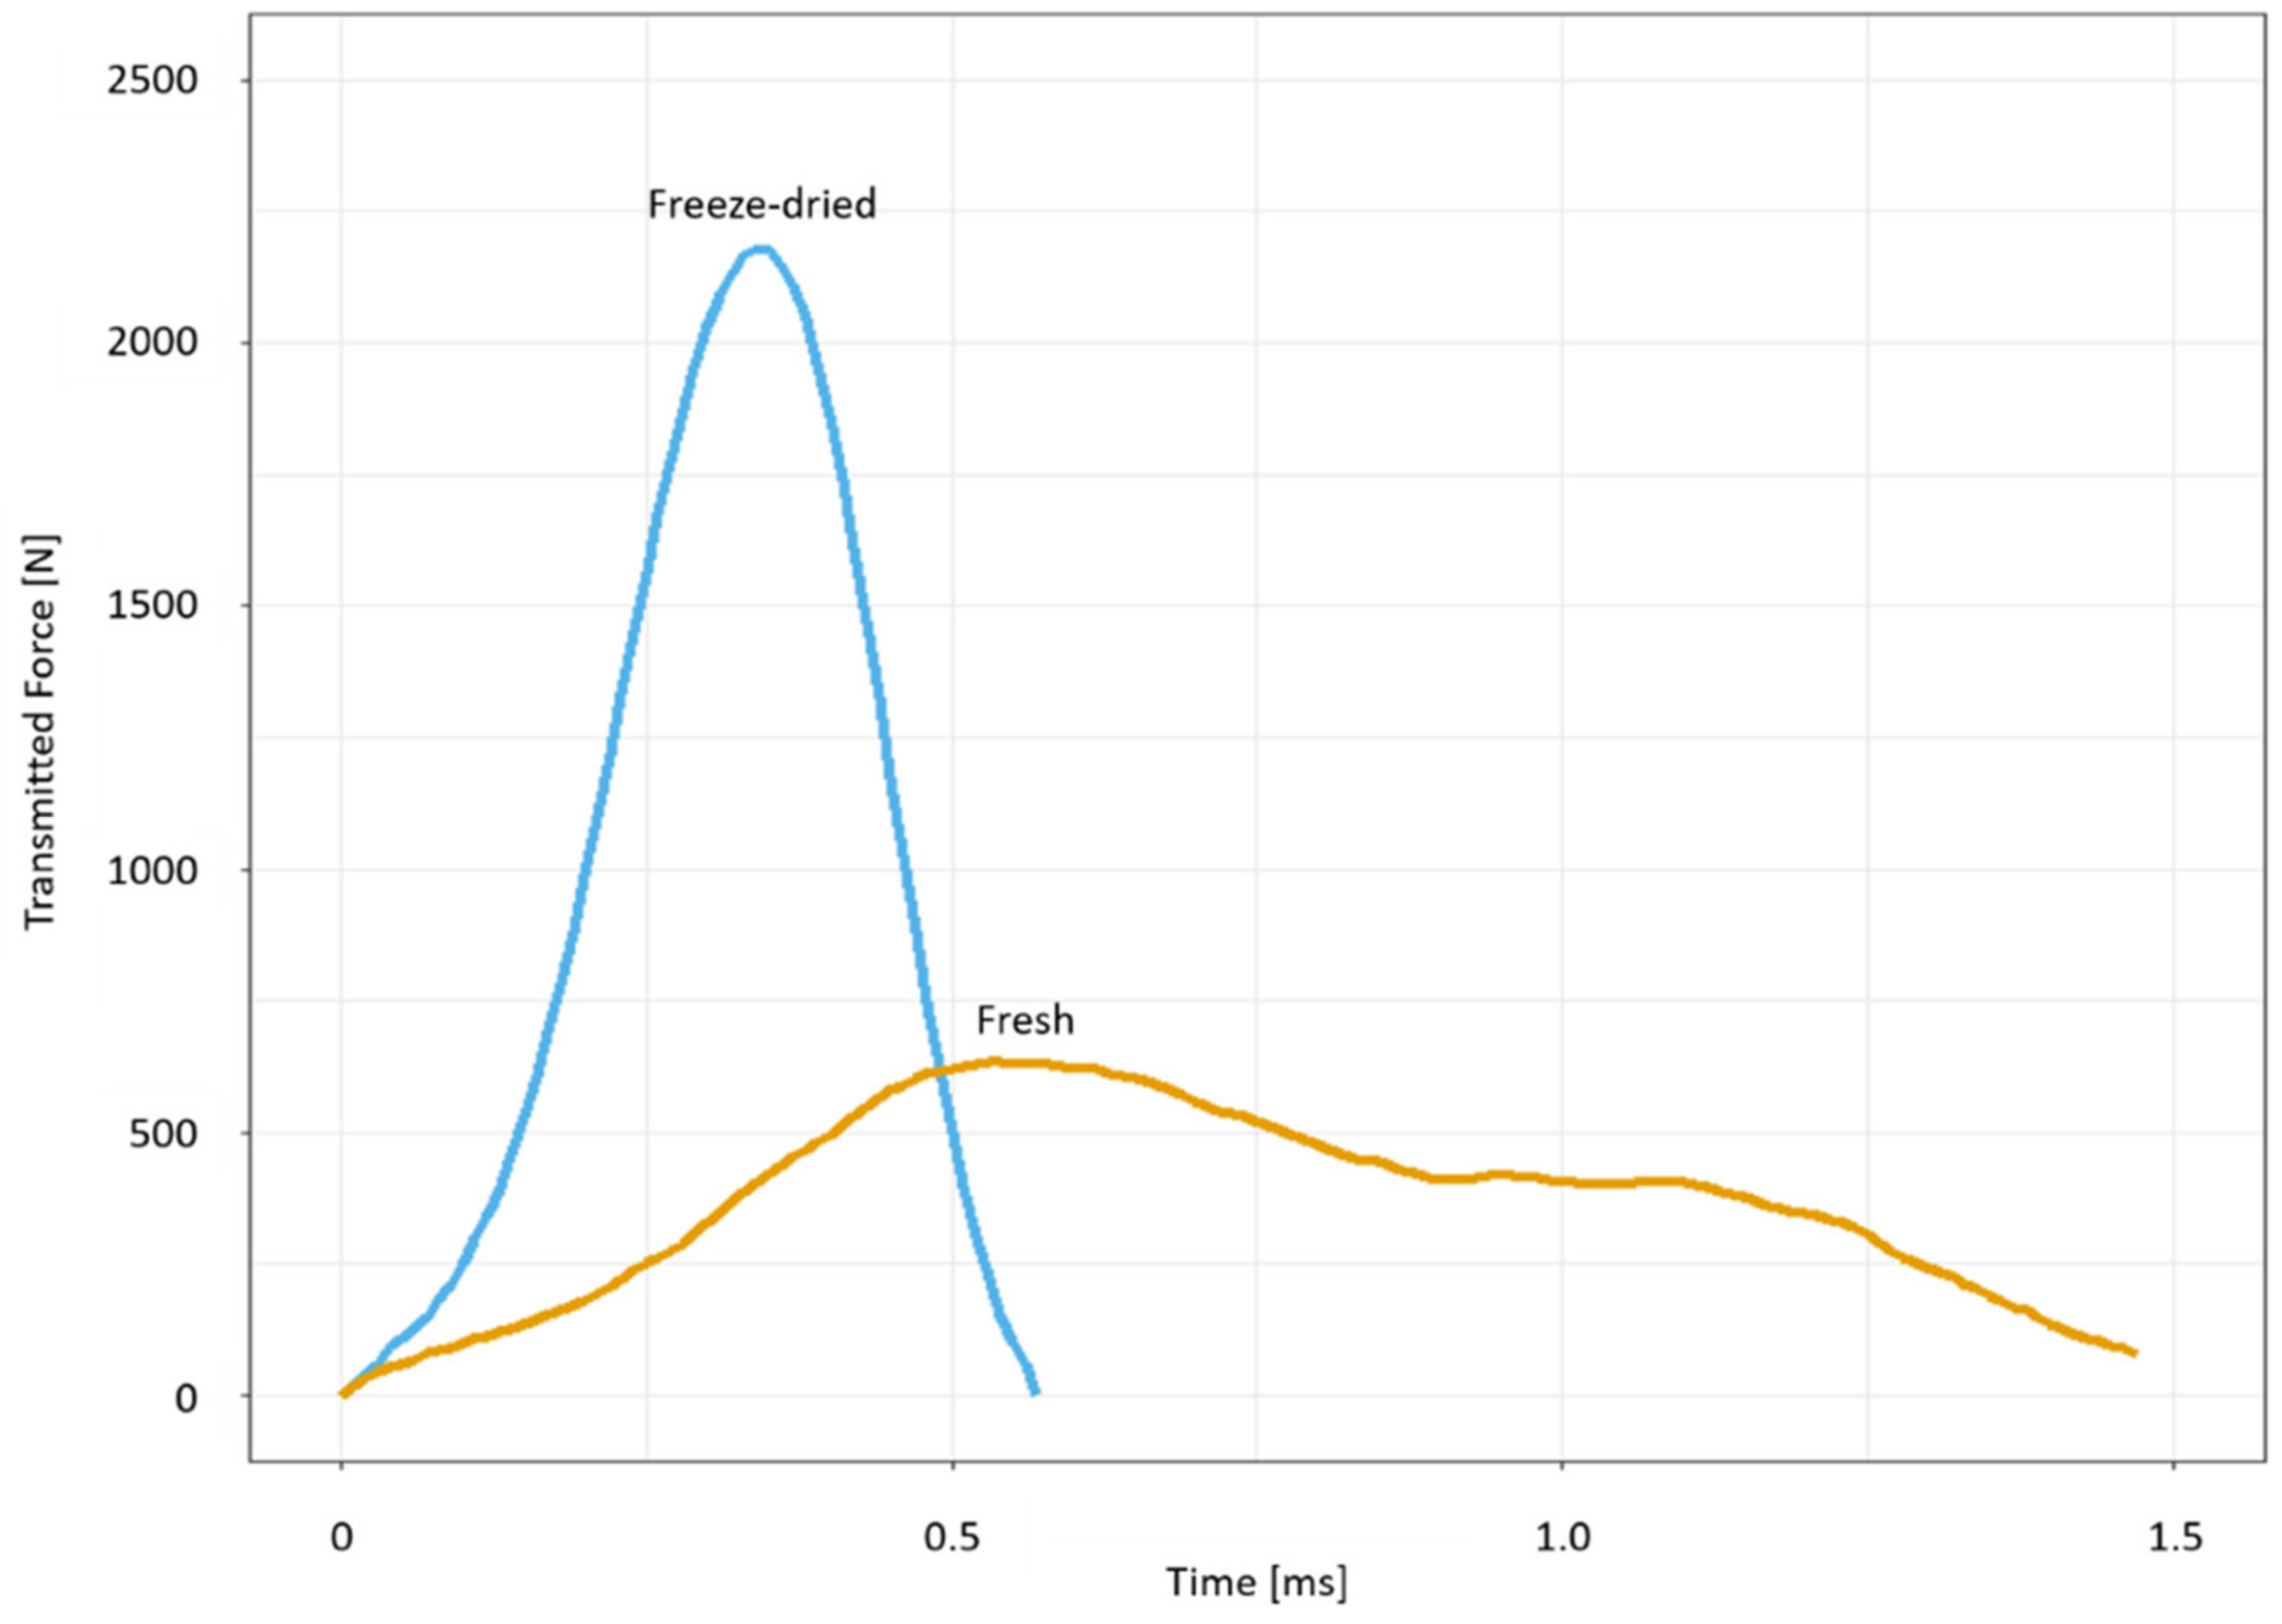
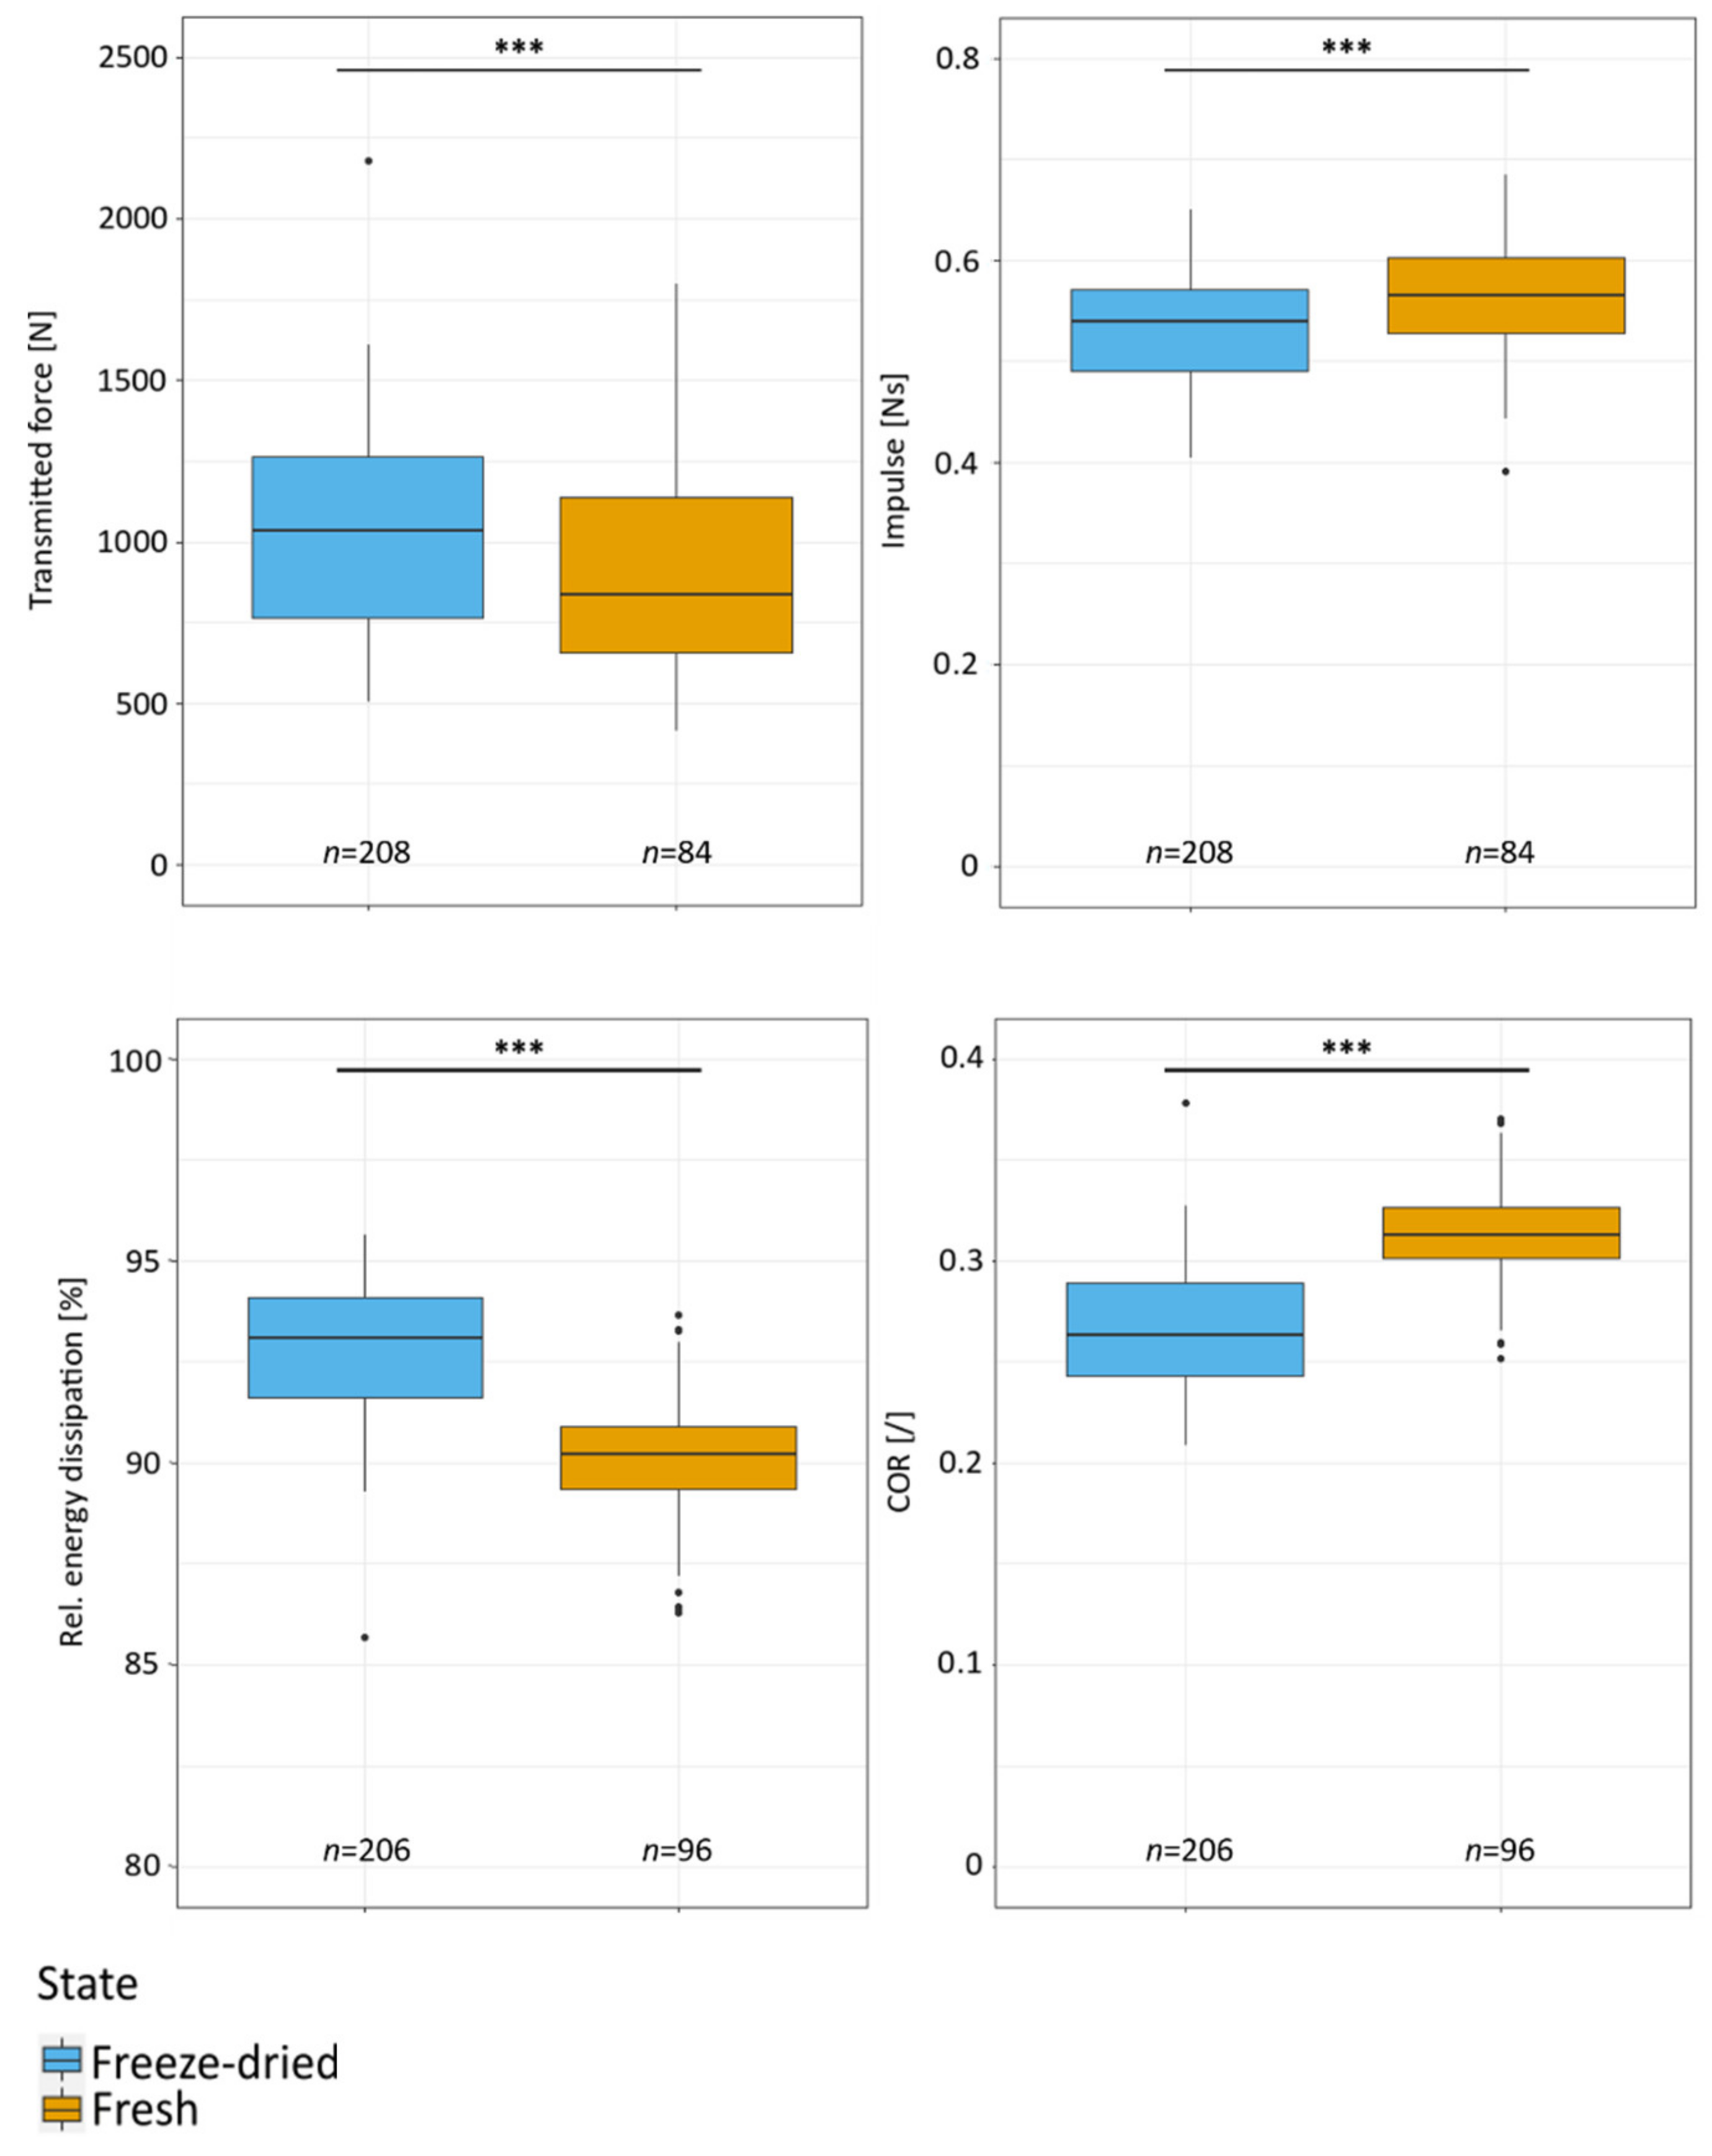
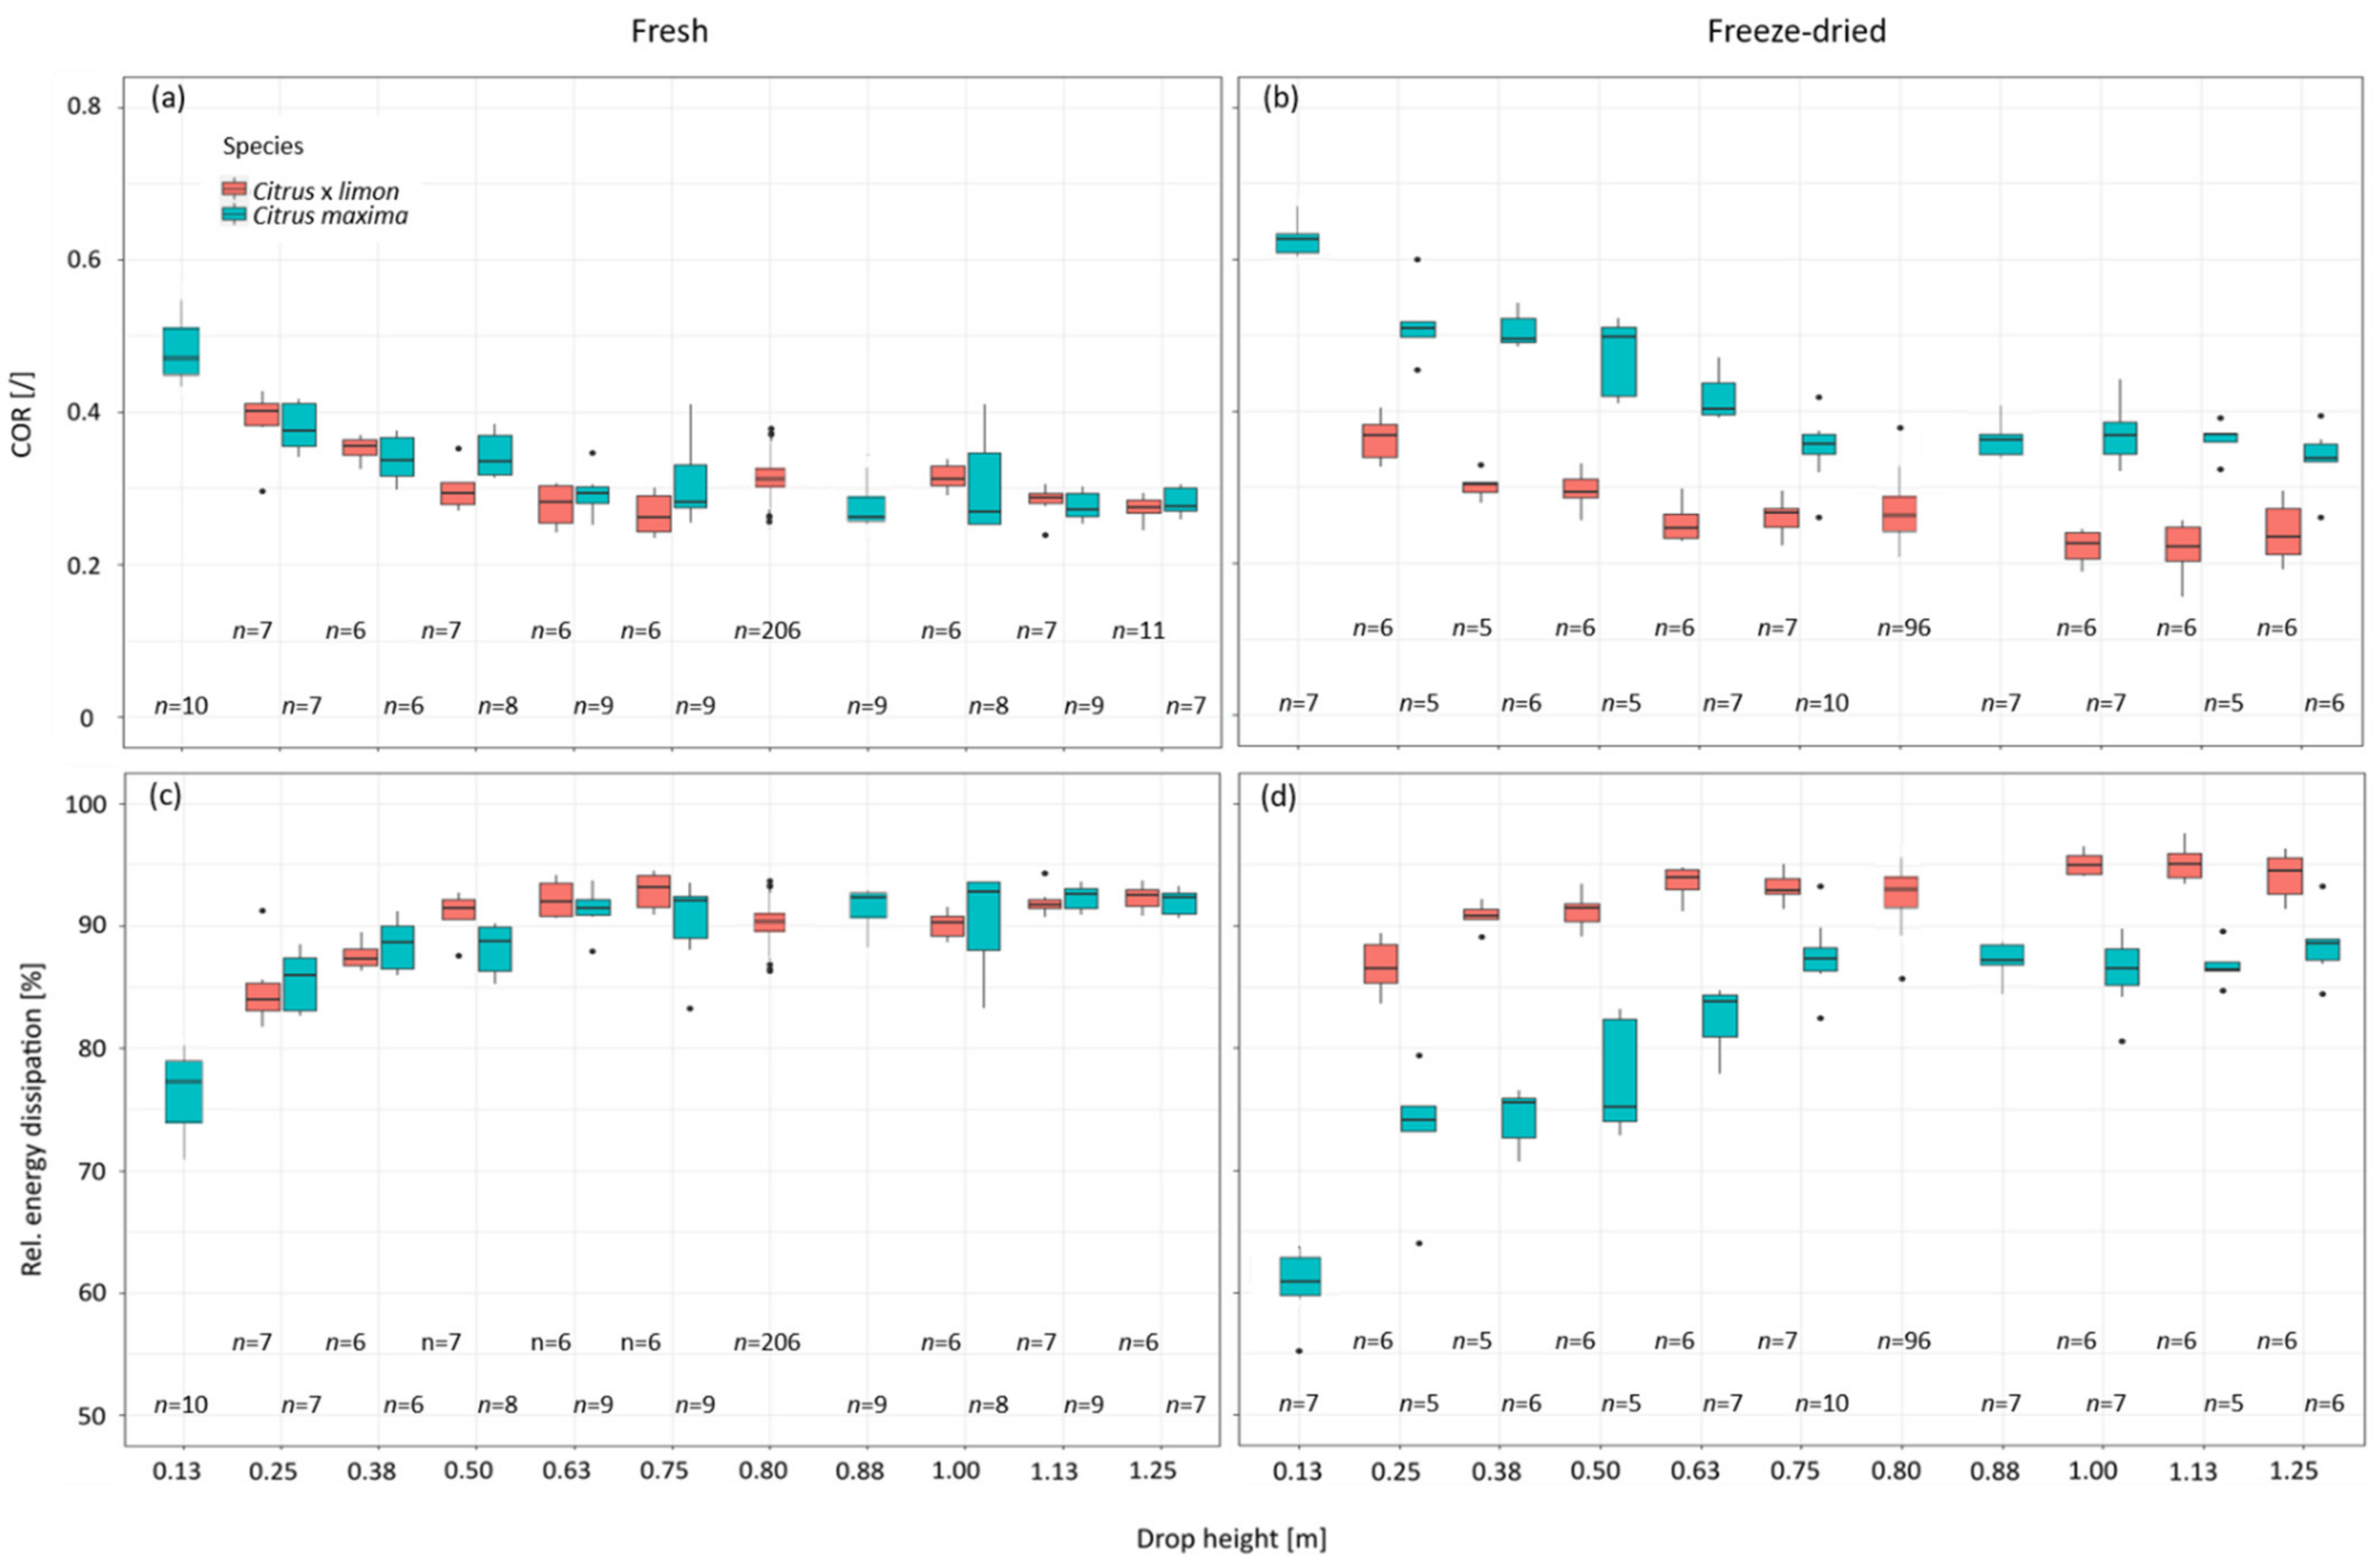
2.3. Drop-Weight Tests
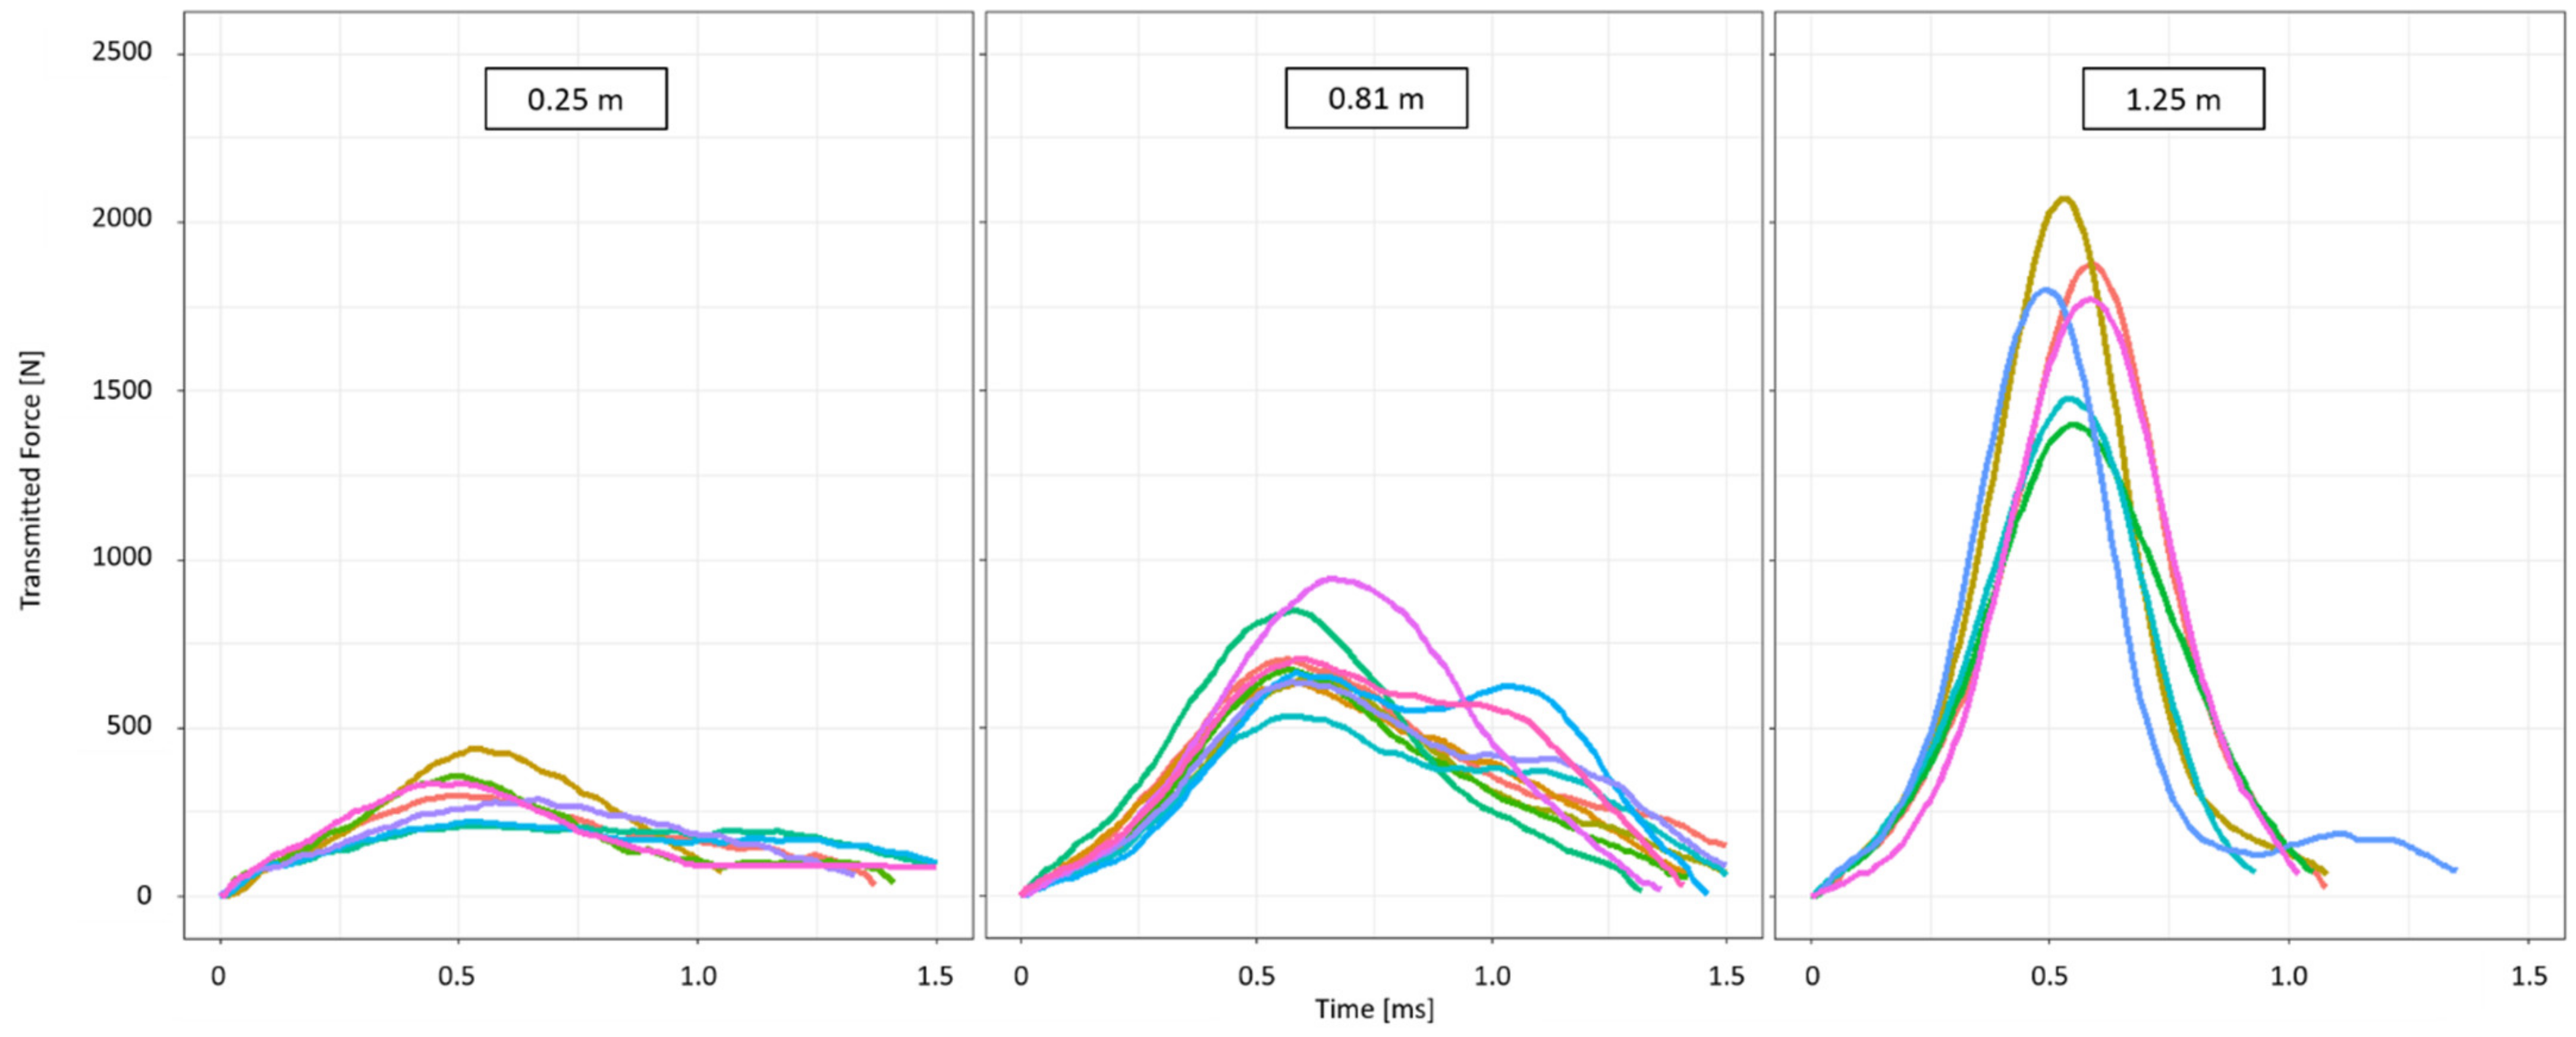
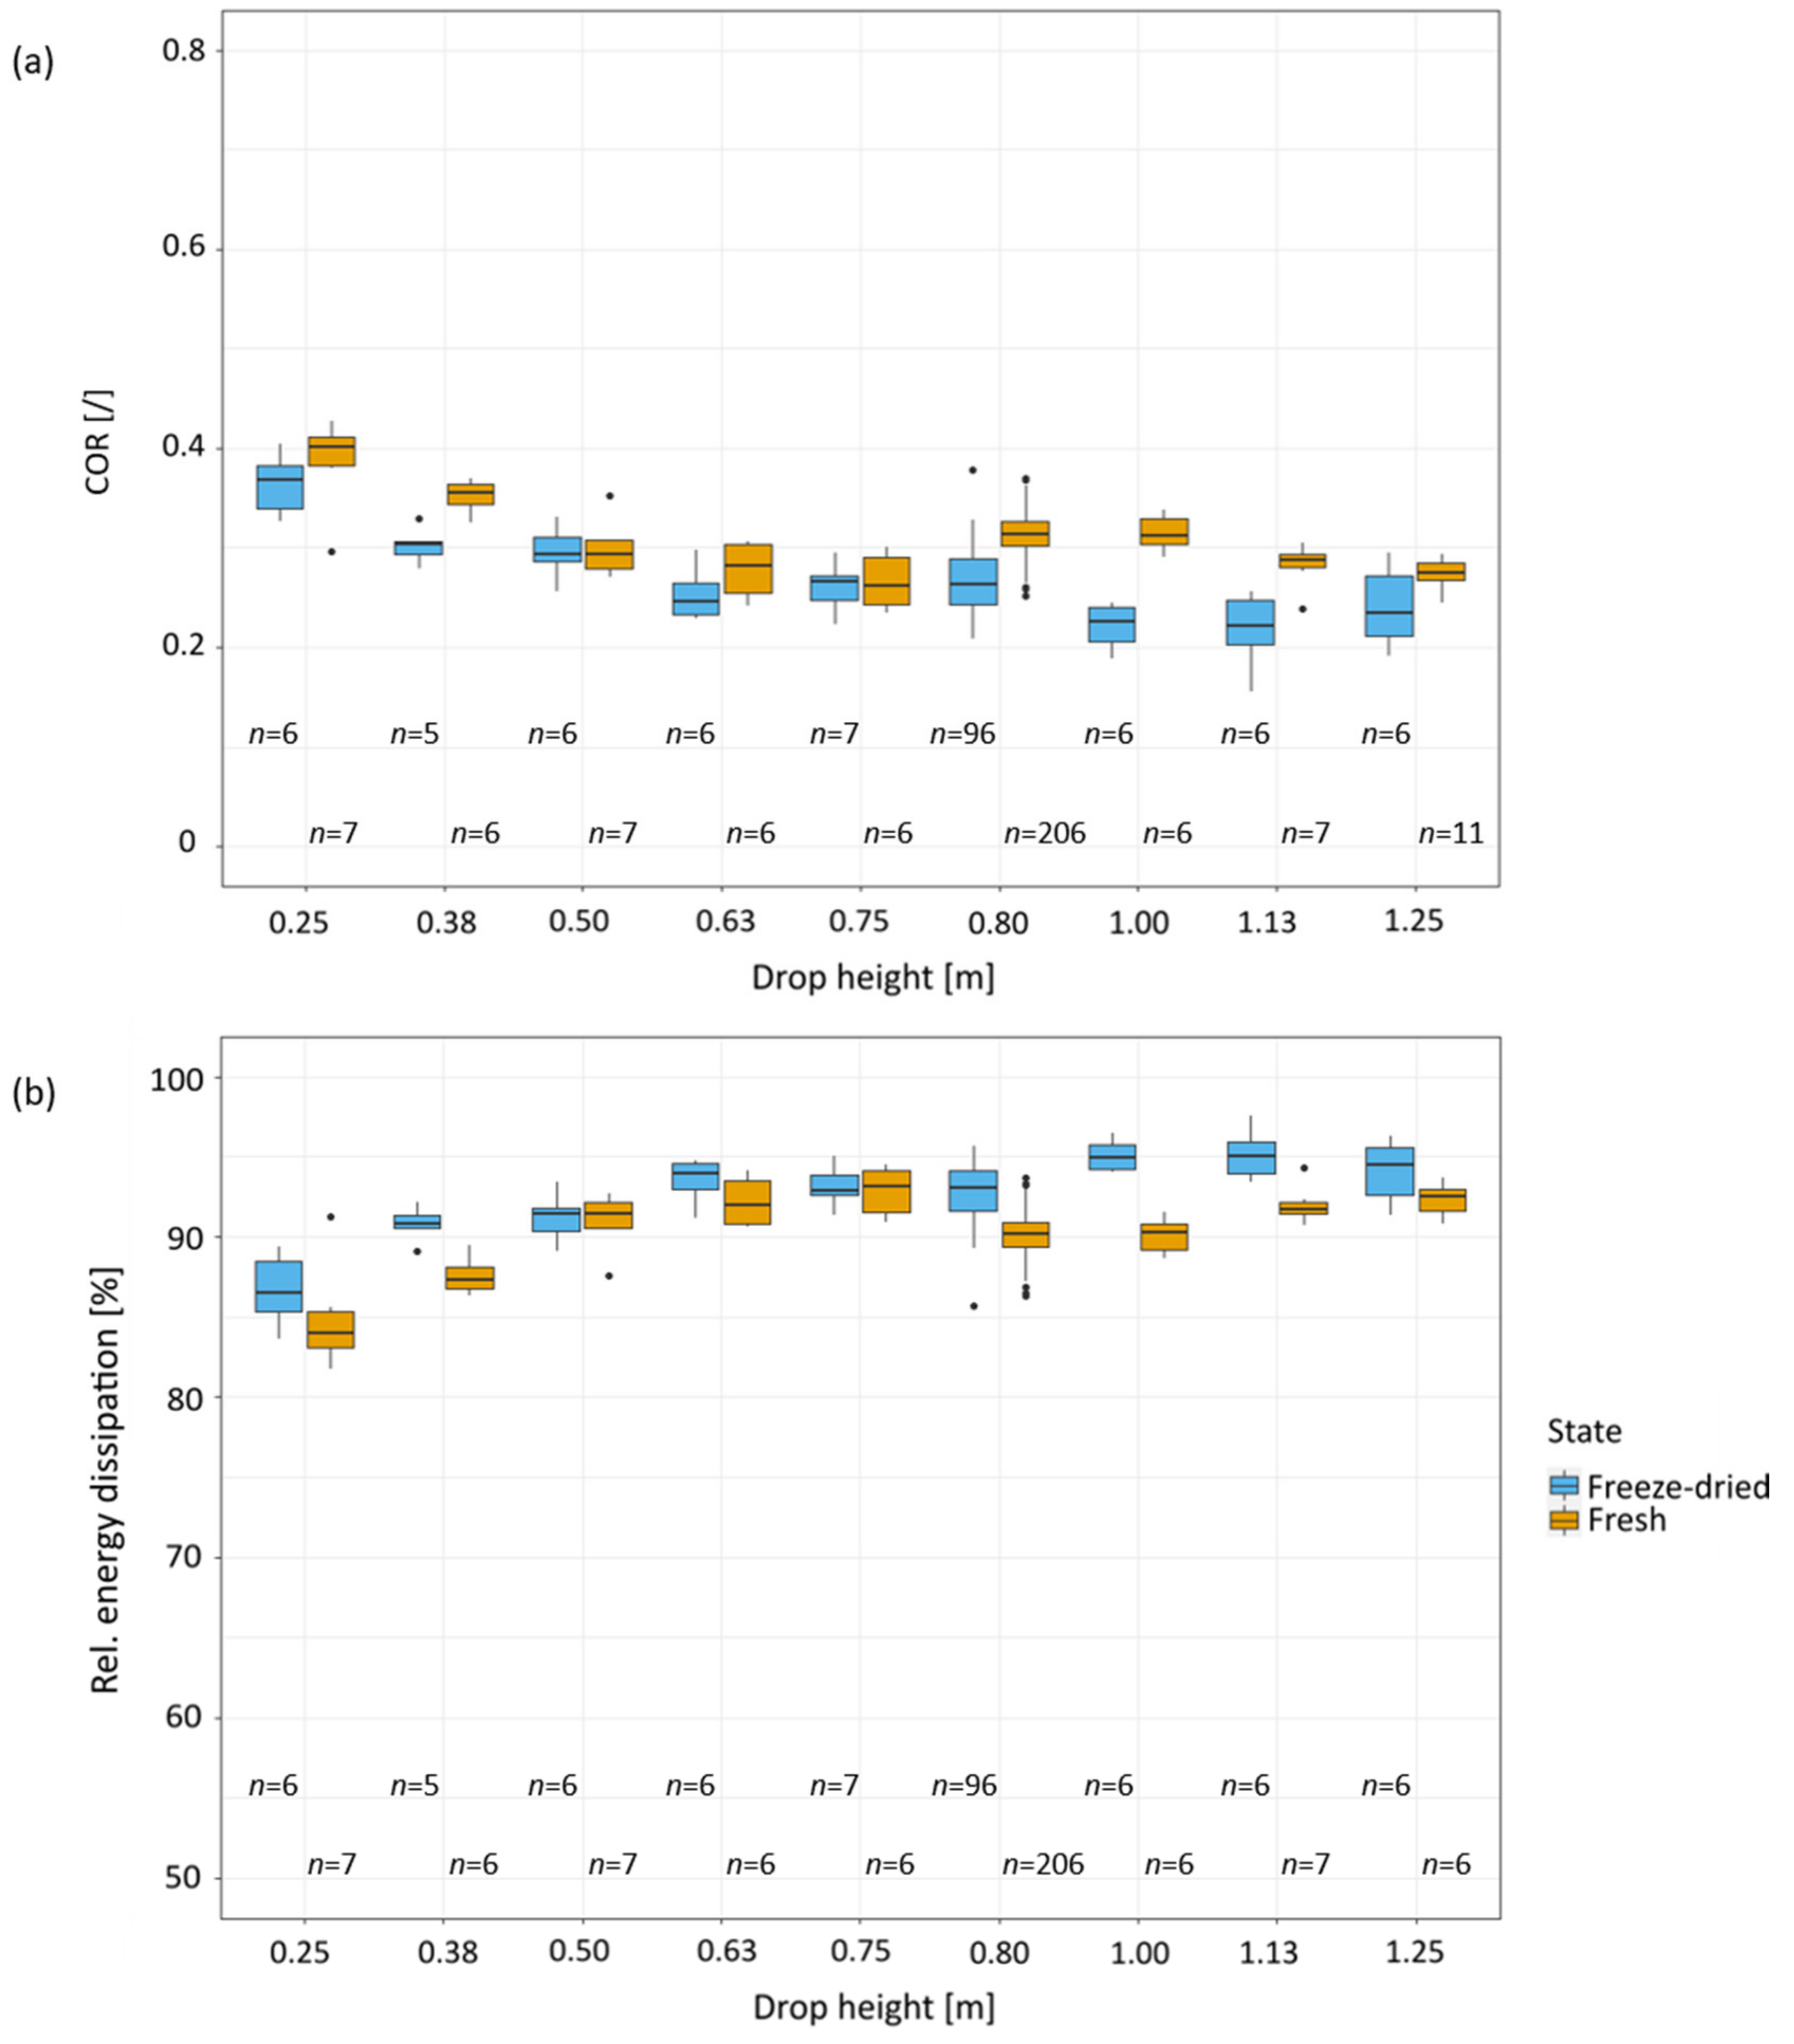
2.4. Different Drop Heights
3. Discussion
4. Materials and Methods
4.1. Plant Material
4.2. Anatomy
4.3. Sample Preparation
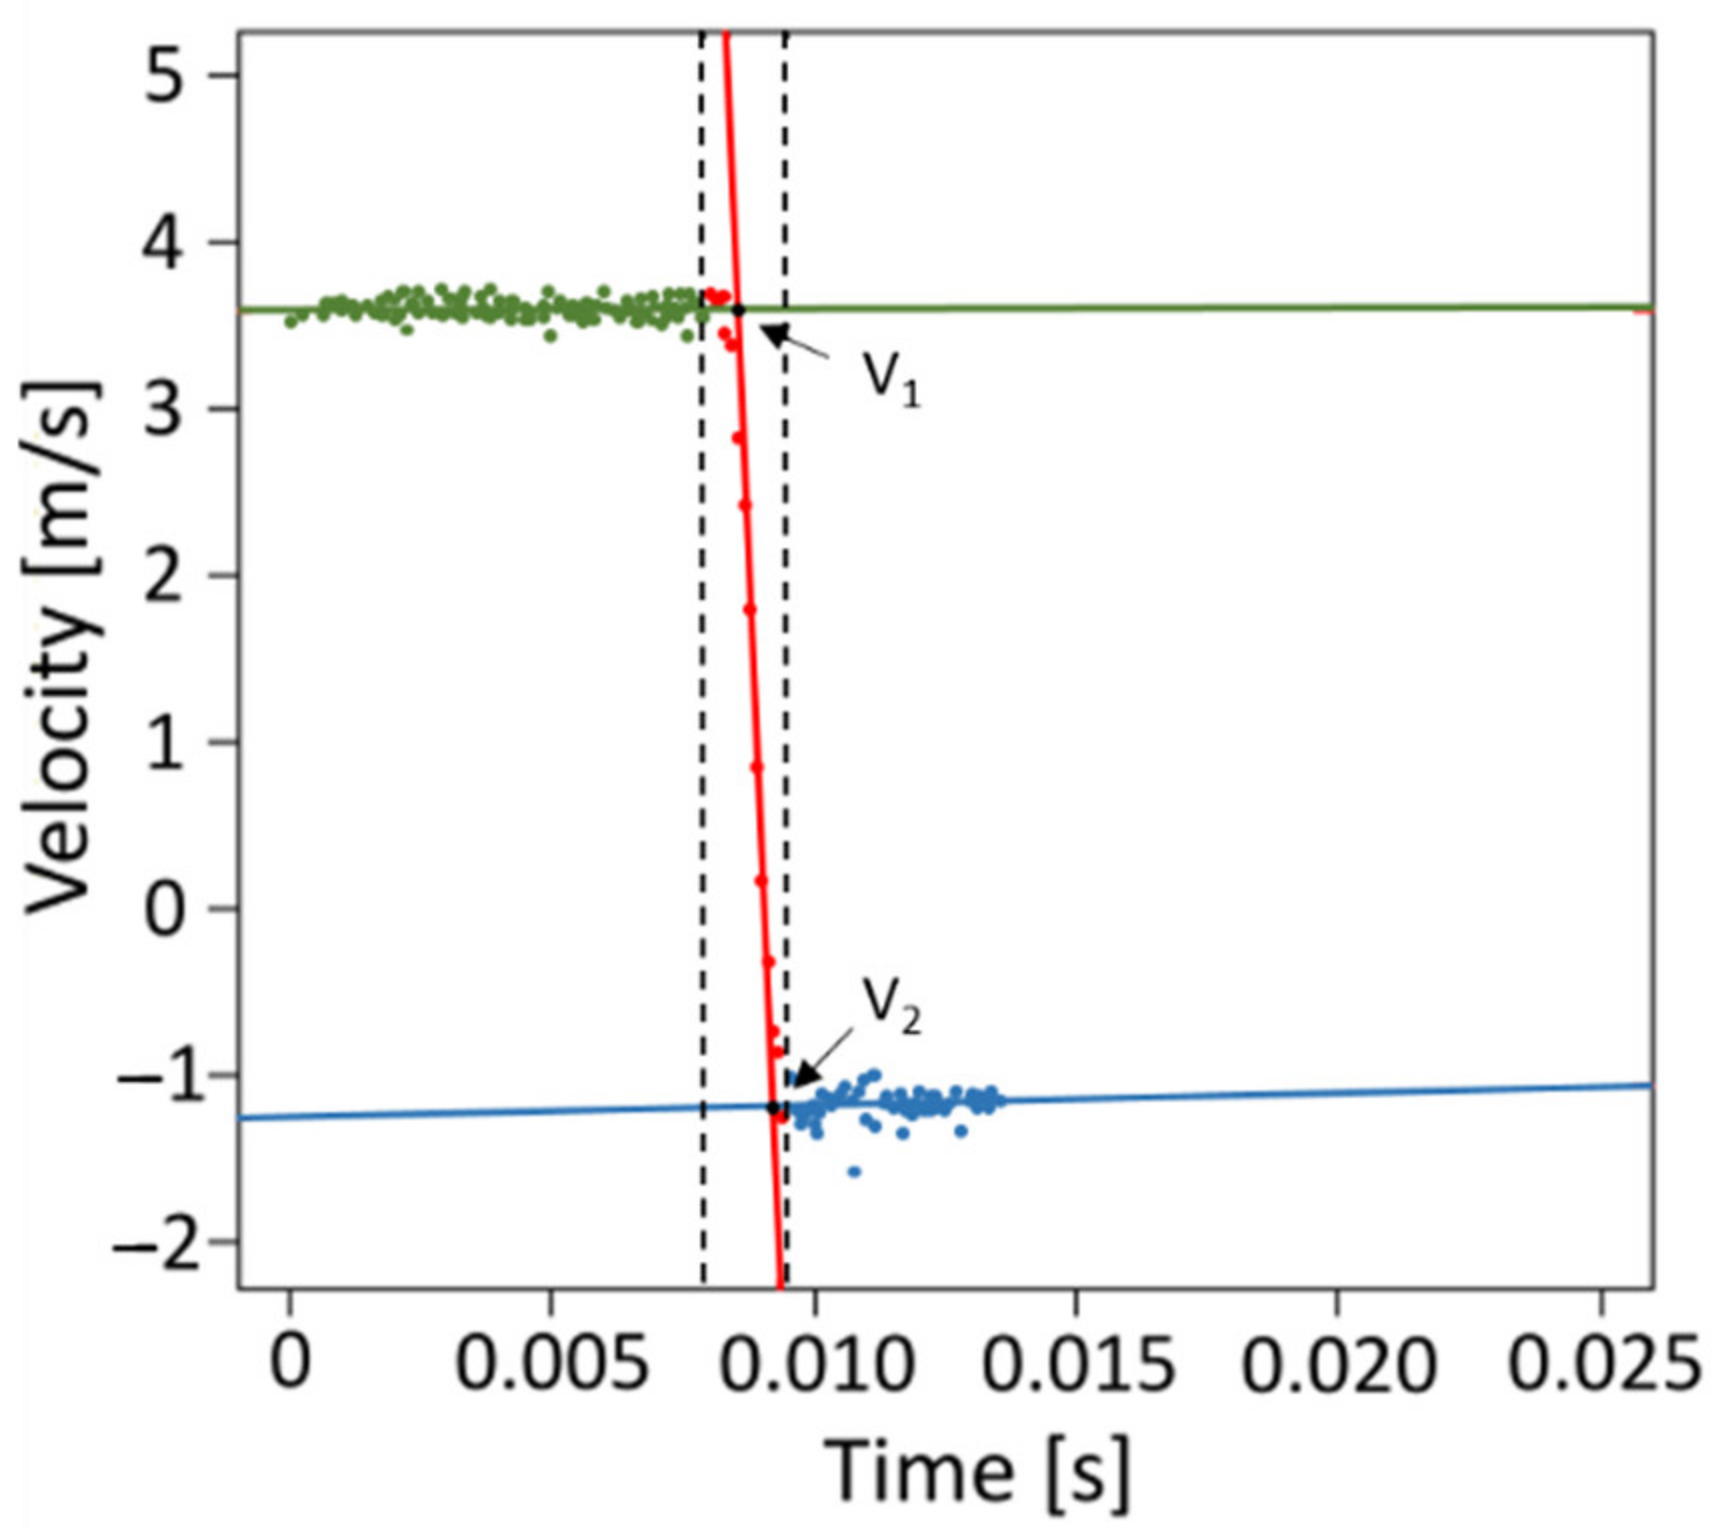
4.4. Mechanical Testing
4.5. Statistics
5. Conclusions
Author Contributions
Funding
Institutional Review Board Statement
Informed Consent Statement
Data Availability Statement
Acknowledgments
Conflicts of Interest
References
- Thielen, M.; Speck, T.; Seidel, R. Viscoelasticity and compaction behaviour of the foam-like pomelo (Citrus maxima) peel. J. Mater. Sci. 2013, 48, 3469–3478. [Google Scholar] [CrossRef]
- Thielen, M.; Schmitt, C.N.Z.; Eckert, S.; Speck, T.; Seidel, R. Structure-function relationship of the foam-like pomelo peel (Citrus maxima)—An inspiration for the development of biomimetic damping materials with high energy dissipation. Bioinspir. Biomim. 2013, 8, 25001. [Google Scholar] [CrossRef]
- Thielen, M.; Speck, T.; Seidel, R. Impact behaviour of freeze-dried and fresh pomelo (Citrus maxima) peel: Influence of the hydration state. R. Soc. Open Sci. 2015, 2, 140322. [Google Scholar] [CrossRef] [PubMed] [Green Version]
- Gentile, A.; La Malfa, S.; Deng, Z. The Citrus Genome; Springer International Publishing: Cham, Switzerland, 2020; ISBN 978-3-030-10799-4. [Google Scholar]
- Moore, G.A. Oranges and lemons: Clues to the taxonomy of Citrus from molecular markers. Trend Genet. 2001, 17, 536–540. [Google Scholar] [CrossRef]
- Klock, P.; Klock, M.; Klock, T.A. Das Große Ulmer-Buch der Zitruspflanzen; Ulmer: Stuttgart, Germany, 2007; ISBN 9783800146932. [Google Scholar]
- Ladaniya, M.S. Citrus Fruit: Biology, Technology and Evaluation; Elsevier Academic Press, ScienceDirect: Amsterdam, The Netherlands; Heidelberg, Germany, 2008; ISBN 9780123741301. [Google Scholar]
- Nicolosi, E.; Deng, Z.N.; Gentile, A.; La Malfa, S.; Continella, G.; Tribulato, E. Citrus phylogeny and genetic origin of important species as investigated by molecular markers. Theor. Appl. Genet. 2000, 100, 1155–1166. [Google Scholar] [CrossRef]
- Fang, D.; Krueger, R.R.; Roose, M.L. Phylogenetic Relationships among Selected Citrus Germplasm Accessions Revealed by Inter-simple Sequence Repeat (ISSR) Markers. J. Am. Soc. Hortic. Sci. 1998, 123, 612–617. [Google Scholar] [CrossRef] [Green Version]
- Gross, J.; Timberg, R.; Graef, M. Pigment and Ultrastructural Changes in the Developing Pummelo Citrus grandis ‘Goliath’. Bot. Gaz. 1983, 144, 401–406. [Google Scholar] [CrossRef]
- Morton, J.F. Fruits of Warm Climates; Julia F. Morton: Miami, FL, USA, 1987; Available online: https://hort.purdue.edu/newcrop/morton/index.html (accessed on 21 November 2021).
- Fischer, S.F.; Thielen, M.; Loprang, R.R.; Seidel, R.; Fleck, C.; Speck, T.; Bührig-Polaczek, A. Pummelos as Concept Generators for Biomimetically Inspired Low Weight Structures with Excellent Damping Properties. Adv. Eng. Mater. 2010, 12, B658–B663. [Google Scholar] [CrossRef]
- Janzen, D.H. Why Fruits Rot, Seeds Mold, and Meat Spoils. Am. Nat. 1977, 111, 691–713. [Google Scholar] [CrossRef]
- Bührig-Polaczek, A.; Fleck, C.; Speck, T.; Schüler, P.; Fischer, S.F.; Caliaro, M.; Thielen, M. Biomimetic cellular metals-using hierarchical structuring for energy absorption. Bioinspir. Biomim. 2016, 11, 45002. [Google Scholar] [CrossRef]
- Sharma, B.D.; Hore, D.K.; Gupta, S.G. Genetic resources of Citrus of north-eastern India and their potential use. Genet. Resour. Crop Evol. 2004, 51, 411–418. [Google Scholar] [CrossRef]
- Ford, E.S. Anatomy and Histology of the Eureka Lemon. Bot. Gaz. 1942, 104, 288–305. [Google Scholar] [CrossRef]
- Scott, F.M.; Baker, K.C. Anatomy of Washington Navel Orange Rind in Relation to Water Spot. Bot. Gaz. 1947, 108, 459–475. [Google Scholar] [CrossRef]
- Underhill, S.J.; McLauchlan, R.L.; Dahler, J.M.; Bertram, J. Flavedo and albedo changes in ‘eureka’ lemons caused by static compression and impact loading. J. Texture Stud. 1998, 29, 437–452. [Google Scholar] [CrossRef]
- Yang, B.; Chen, W.; Xin, R.; Zhou, X.; Tan, D.; Ding, C.; Wu, Y.; Yin, L.; Chen, C.; Wang, S.; et al. Pomelo Peel-Inspired 3D-Printed Porous Structure for Efficient Absorption of Compressive Strain Energy. J. Bionic Eng. 2022, 19, 448–457. [Google Scholar] [CrossRef]
- Wang, B.; Pan, B.; Lubineau, G. Morphological evolution and internal strain mapping of pomelo peel using X-ray computed tomography and digital volume correlation. Mater. Des. 2018, 137, 305–315. [Google Scholar] [CrossRef] [Green Version]
- Van Opdenbosch, D.; Thielen, M.; Seidel, R.; Fritz-Popovski, G.; Fey, T.; Paris, O.; Speck, T.; Zollfrank, C. The pomelo peel and derived nanoscale-precision gradient silica foams. Bioinspired Biomim. Nanobiomater. 2012, 1, 117–122. [Google Scholar] [CrossRef]
- Li, T.-T.; Wang, H.; Huang, S.-Y.; Lou, C.-W.; Lin, J.-H. Bioinspired foam composites resembling pomelo peel: Structural design and compressive, bursting and cushioning properties. Compos. Part B Eng. 2019, 172, 290–298. [Google Scholar] [CrossRef]
- Fischer, S.F.; Thielen, M.; Weiß, P.; Seidel, R.; Speck, T.; Bührig-Polaczek, A.; Bünck, M. Production and properties of a precision-cast bio-inspired composite. J. Mater. Sci. 2014, 49, 43–51. [Google Scholar] [CrossRef]
- Speck, T.; Bold, G.; Masselter, T.; Poppinga, S.; Schmier, S. Biomechanics and functional morphology of plants—Inspiration for biomechanic materials and structures. In Plant Biomechanics: From Structure to Function at Multiple Scales; Geitmann, A., Gril, J., Eds.; Springer International Publishing: Cham, Switzerland, 2018; pp. 399–433. ISBN 978-3-319-79098-5. [Google Scholar]
- Gibson, L.J.; Ashby, M.F. Cellular Solids: Structure and Properties, 2nd ed.; Cambridge University Press: Cambridge, UK, 1997; ISBN 0521495601. [Google Scholar]
- Birman, V.; Byrd, L.W. Modeling and Analysis of Functionally Graded Materials and Structures. Appl. Mech. Rev. 2007, 60, 195–216. [Google Scholar] [CrossRef]
- Tarlochan, F. Sandwich Structures for Energy Absorption Applications: A Review. Materials 2021, 14, 4731. [Google Scholar] [CrossRef] [PubMed]
- Gibson, L.J.; Ashby, M.F. The mechanics of three-dimensional cellular materials. Proc. R. Soc. Lond. A 1982, 382, 43–59. [Google Scholar] [CrossRef]
- Gibson, L.J. Biomechanics of cellular solids. J. Biomech. 2005, 38, 377–399. [Google Scholar] [CrossRef] [PubMed]
- Apetre, N.A.; Sankar, B.V.; Ambur, D.R. Low-velocity impact response of sandwich beams with functionally graded core. Int. J. Solids Struct. 2006, 43, 2479–2496. [Google Scholar] [CrossRef] [Green Version]
- Ortiz, J.; Zhang, G.; McAdams, D.A. A Model for the Design of a Pomelo Peel Bioinspired Foam. J. Mech. Des. 2018, 140, 114501. [Google Scholar] [CrossRef] [Green Version]
- Liu, Z.; Meyers, M.A.; Zhang, Z.; Ritchie, R.O. Functional gradients and heterogeneities in biological materials: Design principles, functions, and bioinspired applications. Prog. Mater. Sci. 2017, 88, 467–498. [Google Scholar] [CrossRef]
- Stover, E.; Castle, W.; Chao, C.-C.T. Trends in U.S. Sweet Orange, Grapefruit, and Mandarin-type Cultivars. Horttech 2005, 15, 501–506. [Google Scholar] [CrossRef]
- Abouzari, A.; Mahdi Nezhad, N. The Investigation of Citrus Fruit Quality. Popular Characteristic and Breeding. Acta Univ. Agric. Silvic. Mendel. Brun. 2016, 64, 725–740. [Google Scholar] [CrossRef] [Green Version]
- Jenks, M.A.; Bebeli, P.J. (Eds.) Breeding for Fruit Quality; Wiley-Blackwell: Ames, IA, USA, 2011; ISBN 0470959355. [Google Scholar]
- Niklas, K.J. Plant Biomechanics: An Engineering Approach to Plant form and Function; University of Chicago Press: Chicago, IL, USA, 1992; ISBN 0226586308. [Google Scholar]
- Lewicki, P.P.; Witrowa-Rajchert, D.; Mariak, J. Changes of Structure During Rehydration of Dried Apples. J. Food Eng. 1997, 32, 347–350. [Google Scholar] [CrossRef]
- Caliaro, M.; Schmich, F.; Speck, T.; Speck, O. Effect of drought stress on bending stiffness in petioles of Caladium bicolor (Araceae). Am. J. Bot. 2013, 100, 2141–2148. [Google Scholar] [CrossRef]
- Westerman, B.; Stringfellow, P.M.; Eccleston, J.A. EVA mouthguards: How thick should they be? Dent. Traumatol. 2002, 18, 24–27. [Google Scholar] [CrossRef] [PubMed]
- Kirugulige, M.; Kitey, R.; Tippur, H.V. Dynamic fracture behavior of model sandwich structures with functionally graded core: A feasibility study. Compos. Sci. Technol. 2005, 65, 1052–1068. [Google Scholar] [CrossRef]
- Verissimo, C.; Costa, P.V.M.; Santos-Filho, P.C.F.; Fernandes-Neto, A.J.; Tantbirojn, D.; Versluis, A.; Soares, C.J. Evaluation of a dentoalveolar model for testing mouthguards: Stress and strain analyses. Dent. Traumatol. 2016, 32, 4–13. [Google Scholar] [CrossRef] [PubMed]
- Kampowski, T.; Mylo, M.D.; Speck, T.; Poppinga, S. On the morphometry, anatomy and water stress behaviour of the anisocotyledonous Monophyllaea horsfieldii (Gesneriaceae) and their eco-evolutionary significance. Bot. J. Linn. Soc. 2017, 185, 425–442. [Google Scholar] [CrossRef]
- R Core Team. R: A Language and Environment for Statistical Computing; R Foundation for Statistical Computing: Vienna, Austria, 2019. [Google Scholar]


Publisher’s Note: MDPI stays neutral with regard to jurisdictional claims in published maps and institutional affiliations. |
© 2022 by the authors. Licensee MDPI, Basel, Switzerland. This article is an open access article distributed under the terms and conditions of the Creative Commons Attribution (CC BY) license (https://creativecommons.org/licenses/by/4.0/).
Share and Cite
Jentzsch, M.; Becker, S.; Thielen, M.; Speck, T. Functional Anatomy, Impact Behavior and Energy Dissipation of the Peel of Citrus × limon: A Comparison of Citrus × limon and Citrus maxima. Plants 2022, 11, 991. https://doi.org/10.3390/plants11070991
Jentzsch M, Becker S, Thielen M, Speck T. Functional Anatomy, Impact Behavior and Energy Dissipation of the Peel of Citrus × limon: A Comparison of Citrus × limon and Citrus maxima. Plants. 2022; 11(7):991. https://doi.org/10.3390/plants11070991
Chicago/Turabian StyleJentzsch, Maximilian, Sarah Becker, Marc Thielen, and Thomas Speck. 2022. "Functional Anatomy, Impact Behavior and Energy Dissipation of the Peel of Citrus × limon: A Comparison of Citrus × limon and Citrus maxima" Plants 11, no. 7: 991. https://doi.org/10.3390/plants11070991
APA StyleJentzsch, M., Becker, S., Thielen, M., & Speck, T. (2022). Functional Anatomy, Impact Behavior and Energy Dissipation of the Peel of Citrus × limon: A Comparison of Citrus × limon and Citrus maxima. Plants, 11(7), 991. https://doi.org/10.3390/plants11070991