1. Introduction
The plant physiological processes affected by the concentration of CO
2 in the air that are most directly related to plant production are photosynthesis and leaf area development. Much more research has been directed toward measuring, understanding, and modelling plant photosynthetic responses to rising atmospheric CO
2 than toward CO
2 effects on leaf area development. This is not because CO
2 effects on leaf area are less important to plant growth stimulation at elevated CO
2. For example, even in soybean, which has only minor downregulation of photosynthesis during growth at elevated CO
2, and therefore has a large stimulation in photosynthesis per unit leaf area, increased leaf size at elevated CO
2 was a large component of its overall growth stimulation [
1].
Early work testing plant responses to elevated CO
2 indicated that leaf size was often, but not always, increased by elevated CO
2 (e.g., [
2,
3], and reviewed in [
4]), and more recent work has also indicated increases, decreases, and no change in leaf size at elevated CO
2 in a range of species. For example, Manderscheid et al. [
5] reported increased leaf size at elevated CO
2 in sugarbeet, as did Bunce [
6] in common bean, and Song et al. in soybean [
1]. On the other hand, Kim et al. [
7] and Tsutsumi et al. [
8] both found decreased leaf area or leaf size in rice at elevated CO
2, as did Brinkoff in perennial ryegrass [
9], and decreased leaf size was also found by McGranahan and Poling [
10] in barley, wheat, maize, oats, sorghum, pinto bean, and sunflower. Yu and Korner [
11] and Kizildeniz et al. [
12] found no effect of elevated CO
2 on leaf size in tomato and grape leaves, respectively. A recent meta-analysis of responses of C
3 plants indicated an average slight linear increase in leaf size with increasing CO
2 [
13], but with relatively low consistency. Ultimately, leaf size is determined by the combination of cell numbers and cell size. Cell number per leaf is determined relatively early during leaf expansion. Cell expansion requires turgor pressure, but relationships between rates of expansion and turgor pressure vary with multiple endogenous and exogenous factors [
3,
4].
In a study of four herbaceous species, leaf extension rate was increased by elevated CO
2 primarily at night [
14], as also occurred in poplar [
15]. In a study of two cultivars of common bean in the field, exposure to elevated CO
2 only at night increased leaf size in one cultivar but not in the other [
6]. Daytime only CO
2 elevation did not increase leaf size in either cultivar, whereas continuous elevation CO
2 did increase leaf size in both cultivars [
6].
Partial stomatal closure is a frequent response to elevated CO
2 treatments [
16], and might result in reduced transpiration rates, and higher daytime leaf water potentials and turgor pressures. Higher turgor pressure might increase the expansion rates of developing leaves and the final leaf size. However, none of this would explain how elevated CO
2 at night would affect leaf size. One possibility is that stomatal closure at night is incomplete [
17], and that CO
2 at night could affect stomatal conductance, leaf water potential, turgor pressure, leaf expansion rate, and final leaf size. Arguing against this scenario is the fact that leaf to air water vapor pressure differences at night in the field at Beltsville, Maryland, are usually very low, so that any differences in stomatal conductance between CO
2 treatments would have very little impact on leaf water potential. This scenario would also fail to explain why CO
2 elevation only during the daytime did not affect leaf size, or why the two common bean cultivars in a prior experiment differed in leaf size response to CO
2 elevation at night.
The purpose of these experiments was first to learn whether the field responses of leaf size of the two cultivars of common bean to the CO2 treatments could be duplicated under more controlled conditions; secondly, to determine the leaf size responses of several other cultivars to day and/or night elevated CO2; and thirdly, to test for the involvement of leaf water potential and turgor pressure in CO2 treatment effects on leaf size.
2. Results
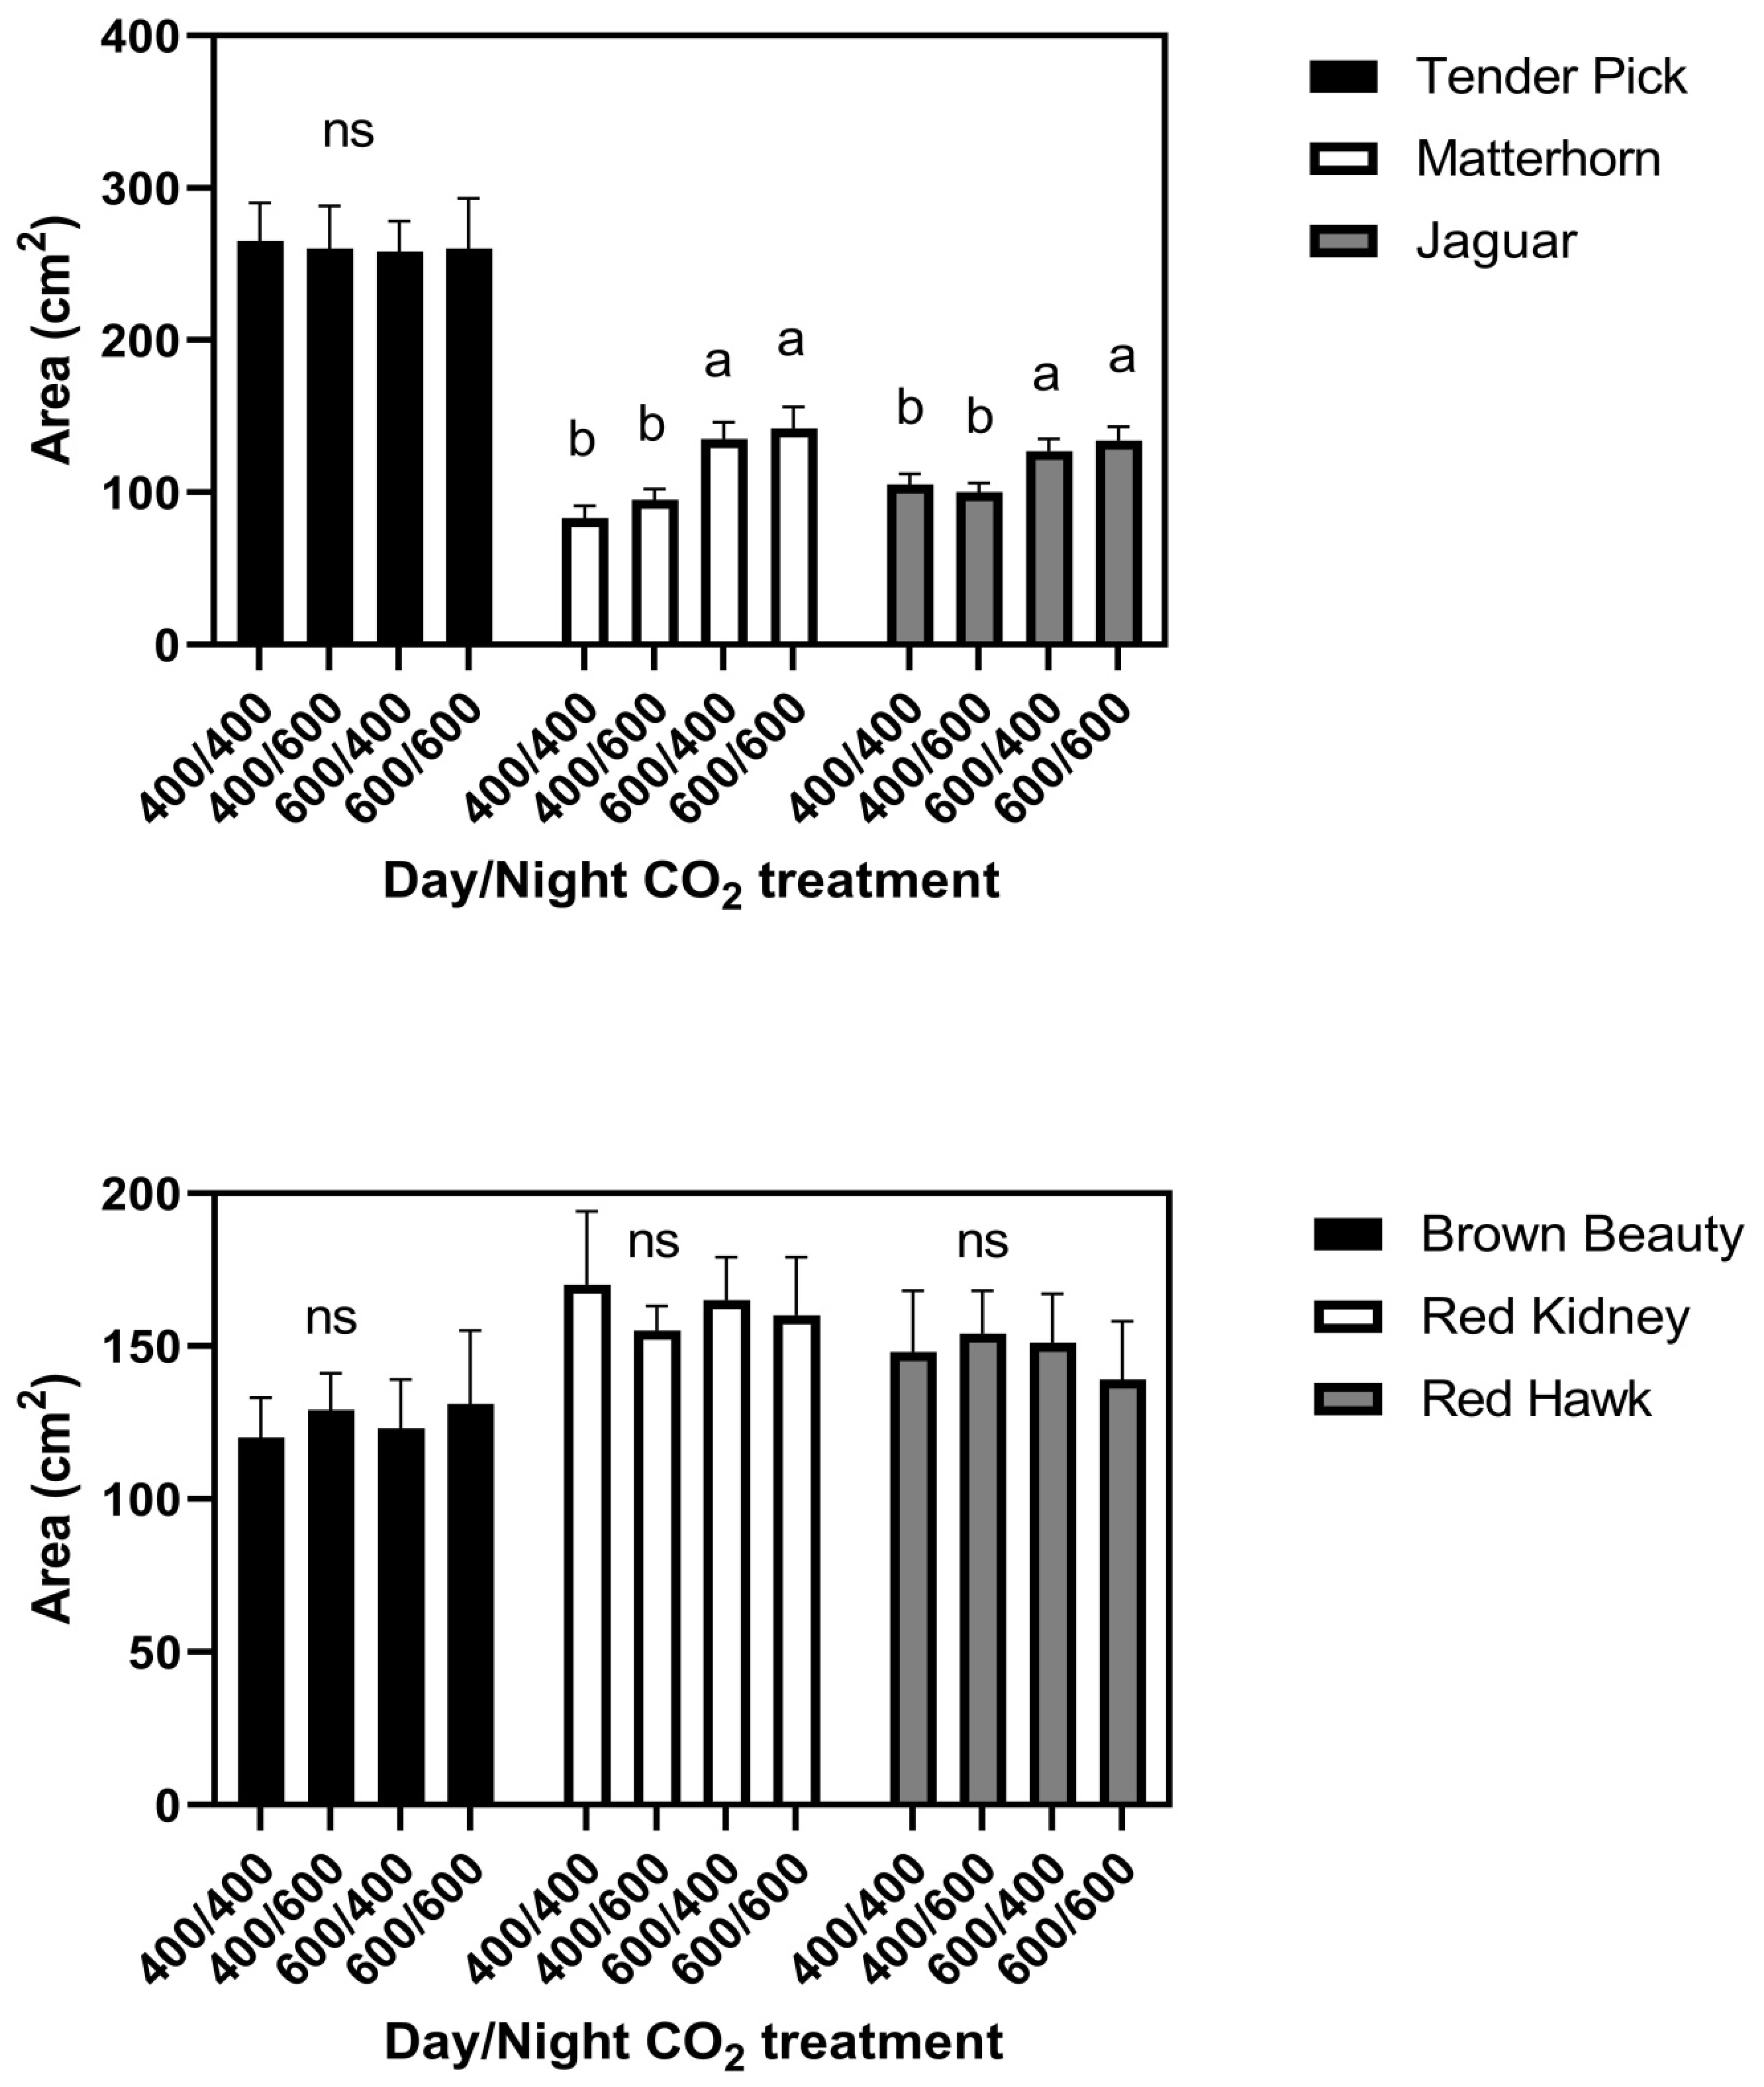
At the constant 23 °C growth condition, elevated CO
2 given either continuously or only during the day increased leaf size in the cultivars Jaguar and Matterhorn (
Figure 1). Elevated CO
2 provided only at night did not affect leaf size in these two cultivars. None of the CO
2 treatments significantly affected leaf size in any of the other four cultivars in this temperature regime (
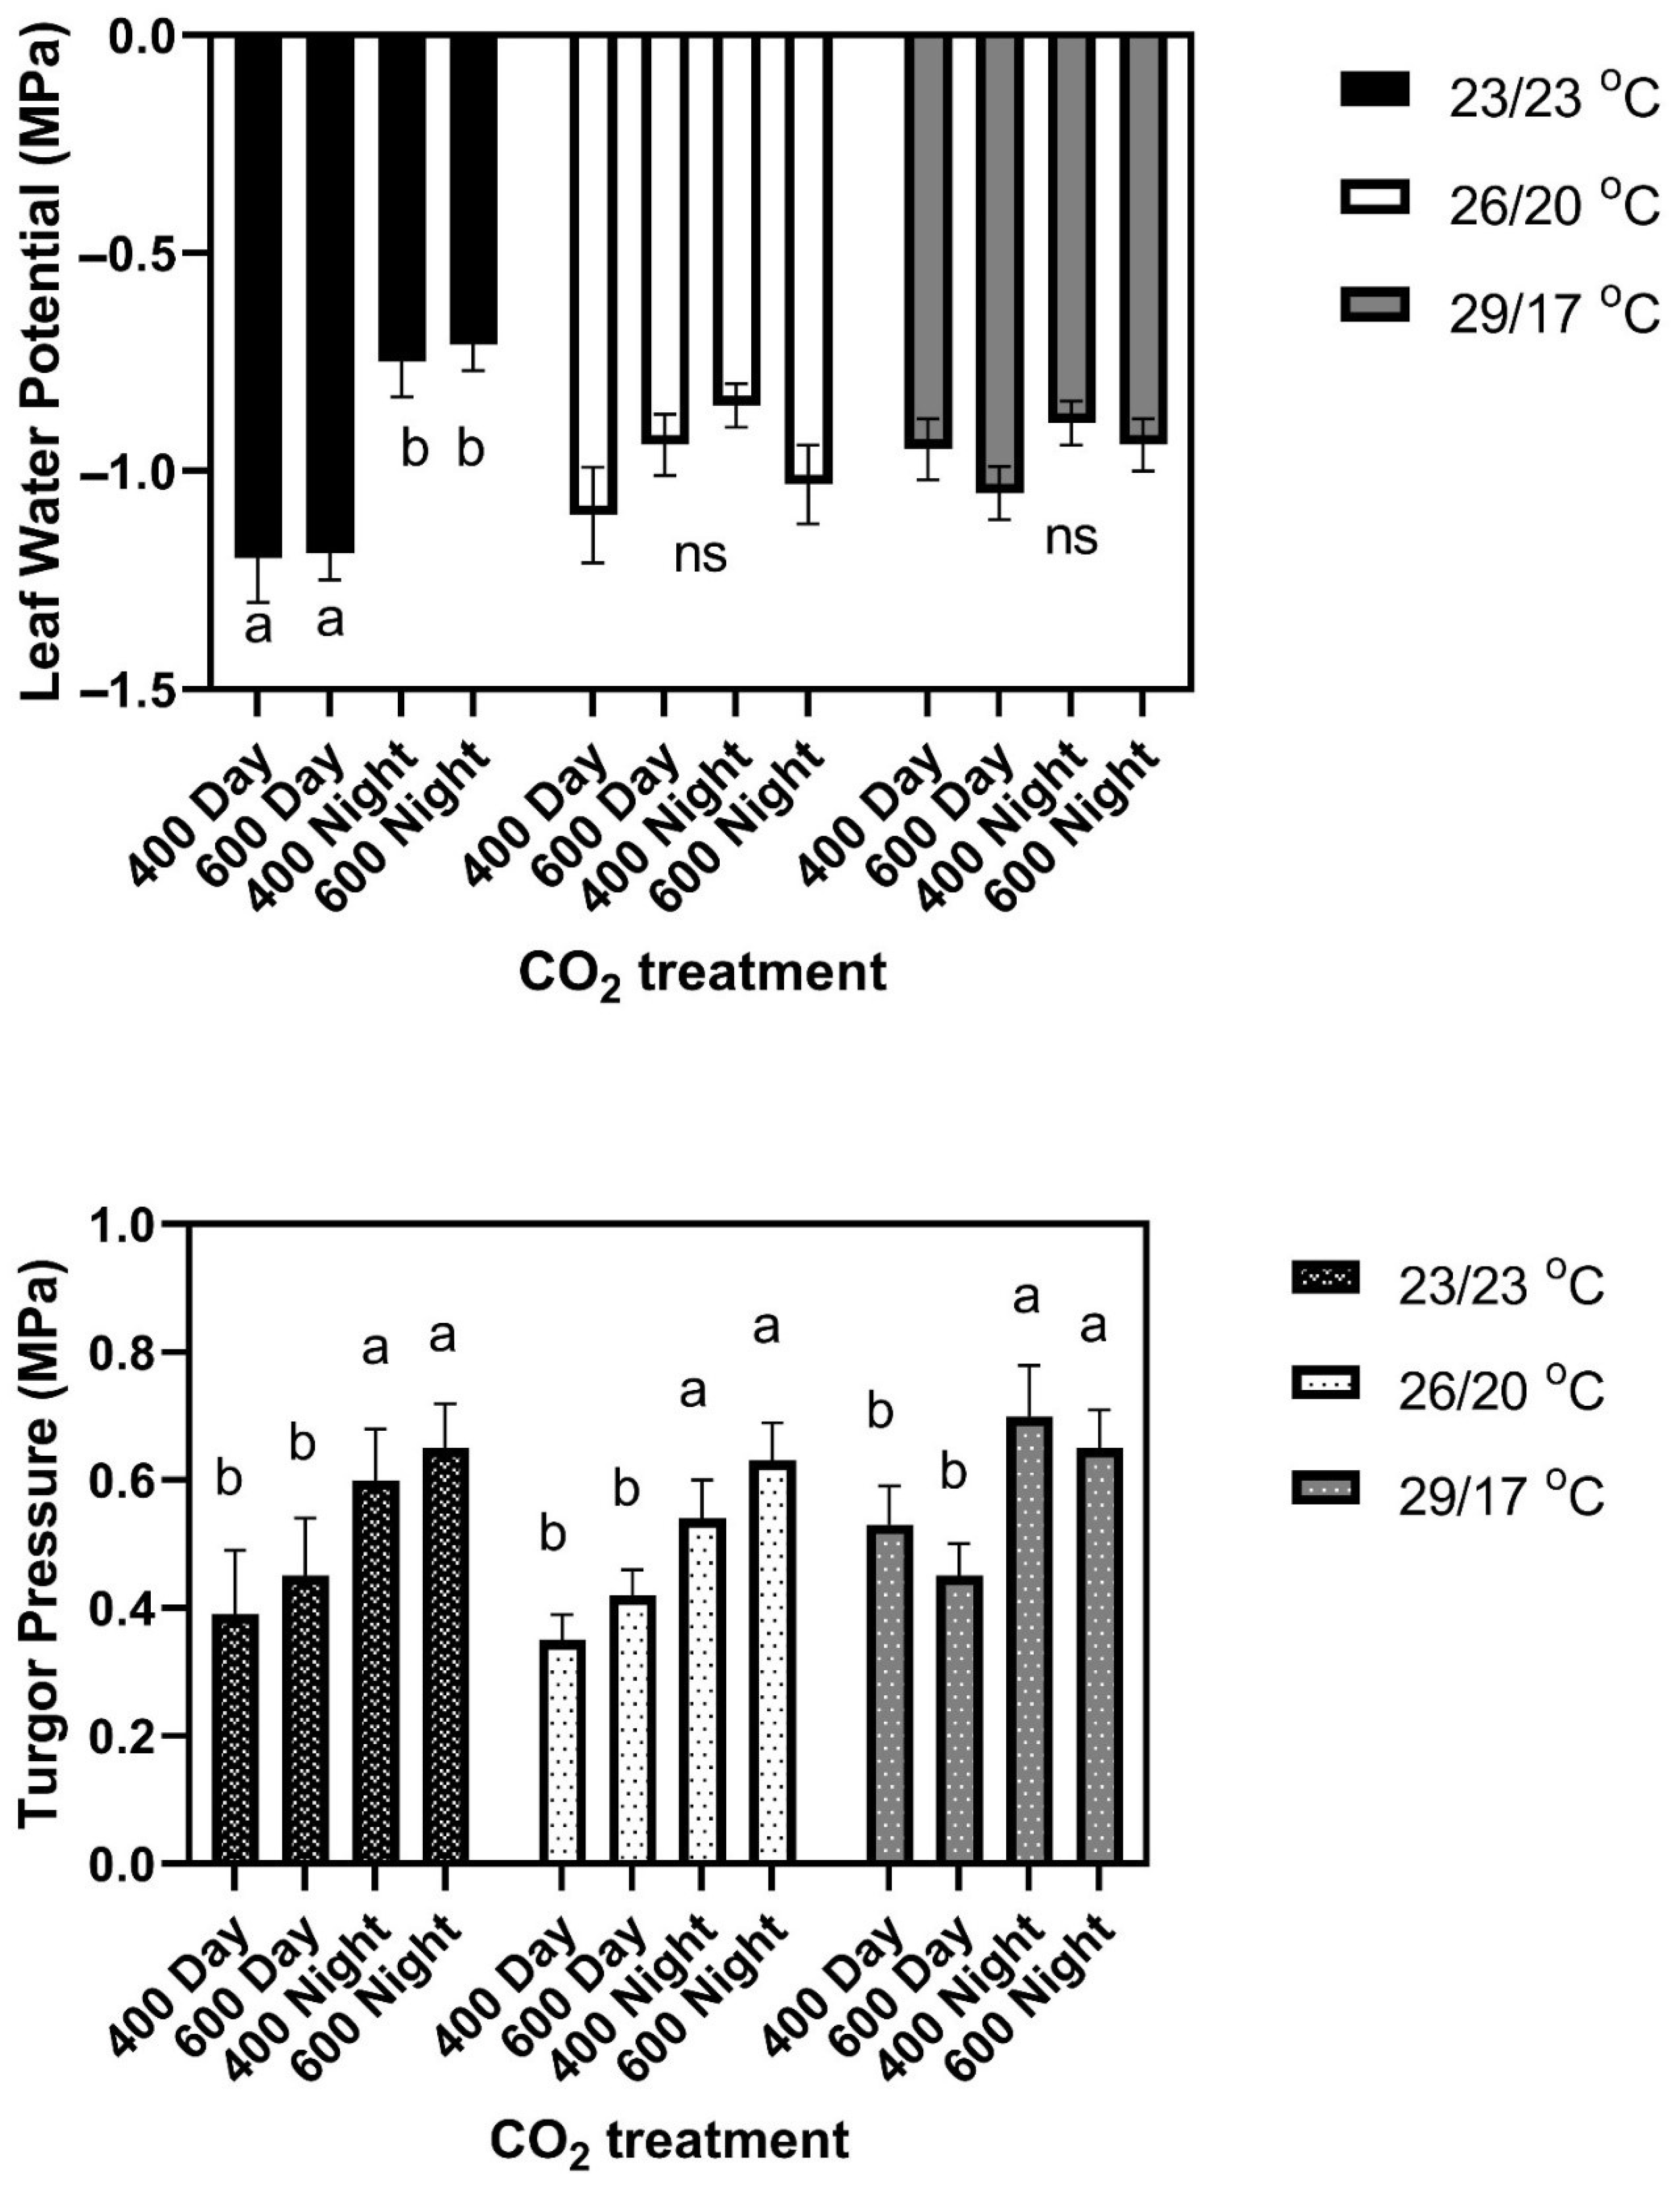
Figure 1). There were no differences among cultivars in leaf water potential or turgor pressure under any CO
2 treatment conditions. Leaf water potentials averaged −1.20 ± 0.07 MPa in the daytime and −0.73 ± 0.05 MPa at night for all CO
2 treatments and cultivars (
Figure 2). Turgor pressures across cultivars averaged 0.45 MPa in the day time, and 0.60 Pa at night, with no significant differences among CO
2 treatments (
Figure 2). Mean leaf water potentials and turgor pressures, and standard deviations for each cultivar and for all three temperature regimes, are listed in
Supplemental Table S1.
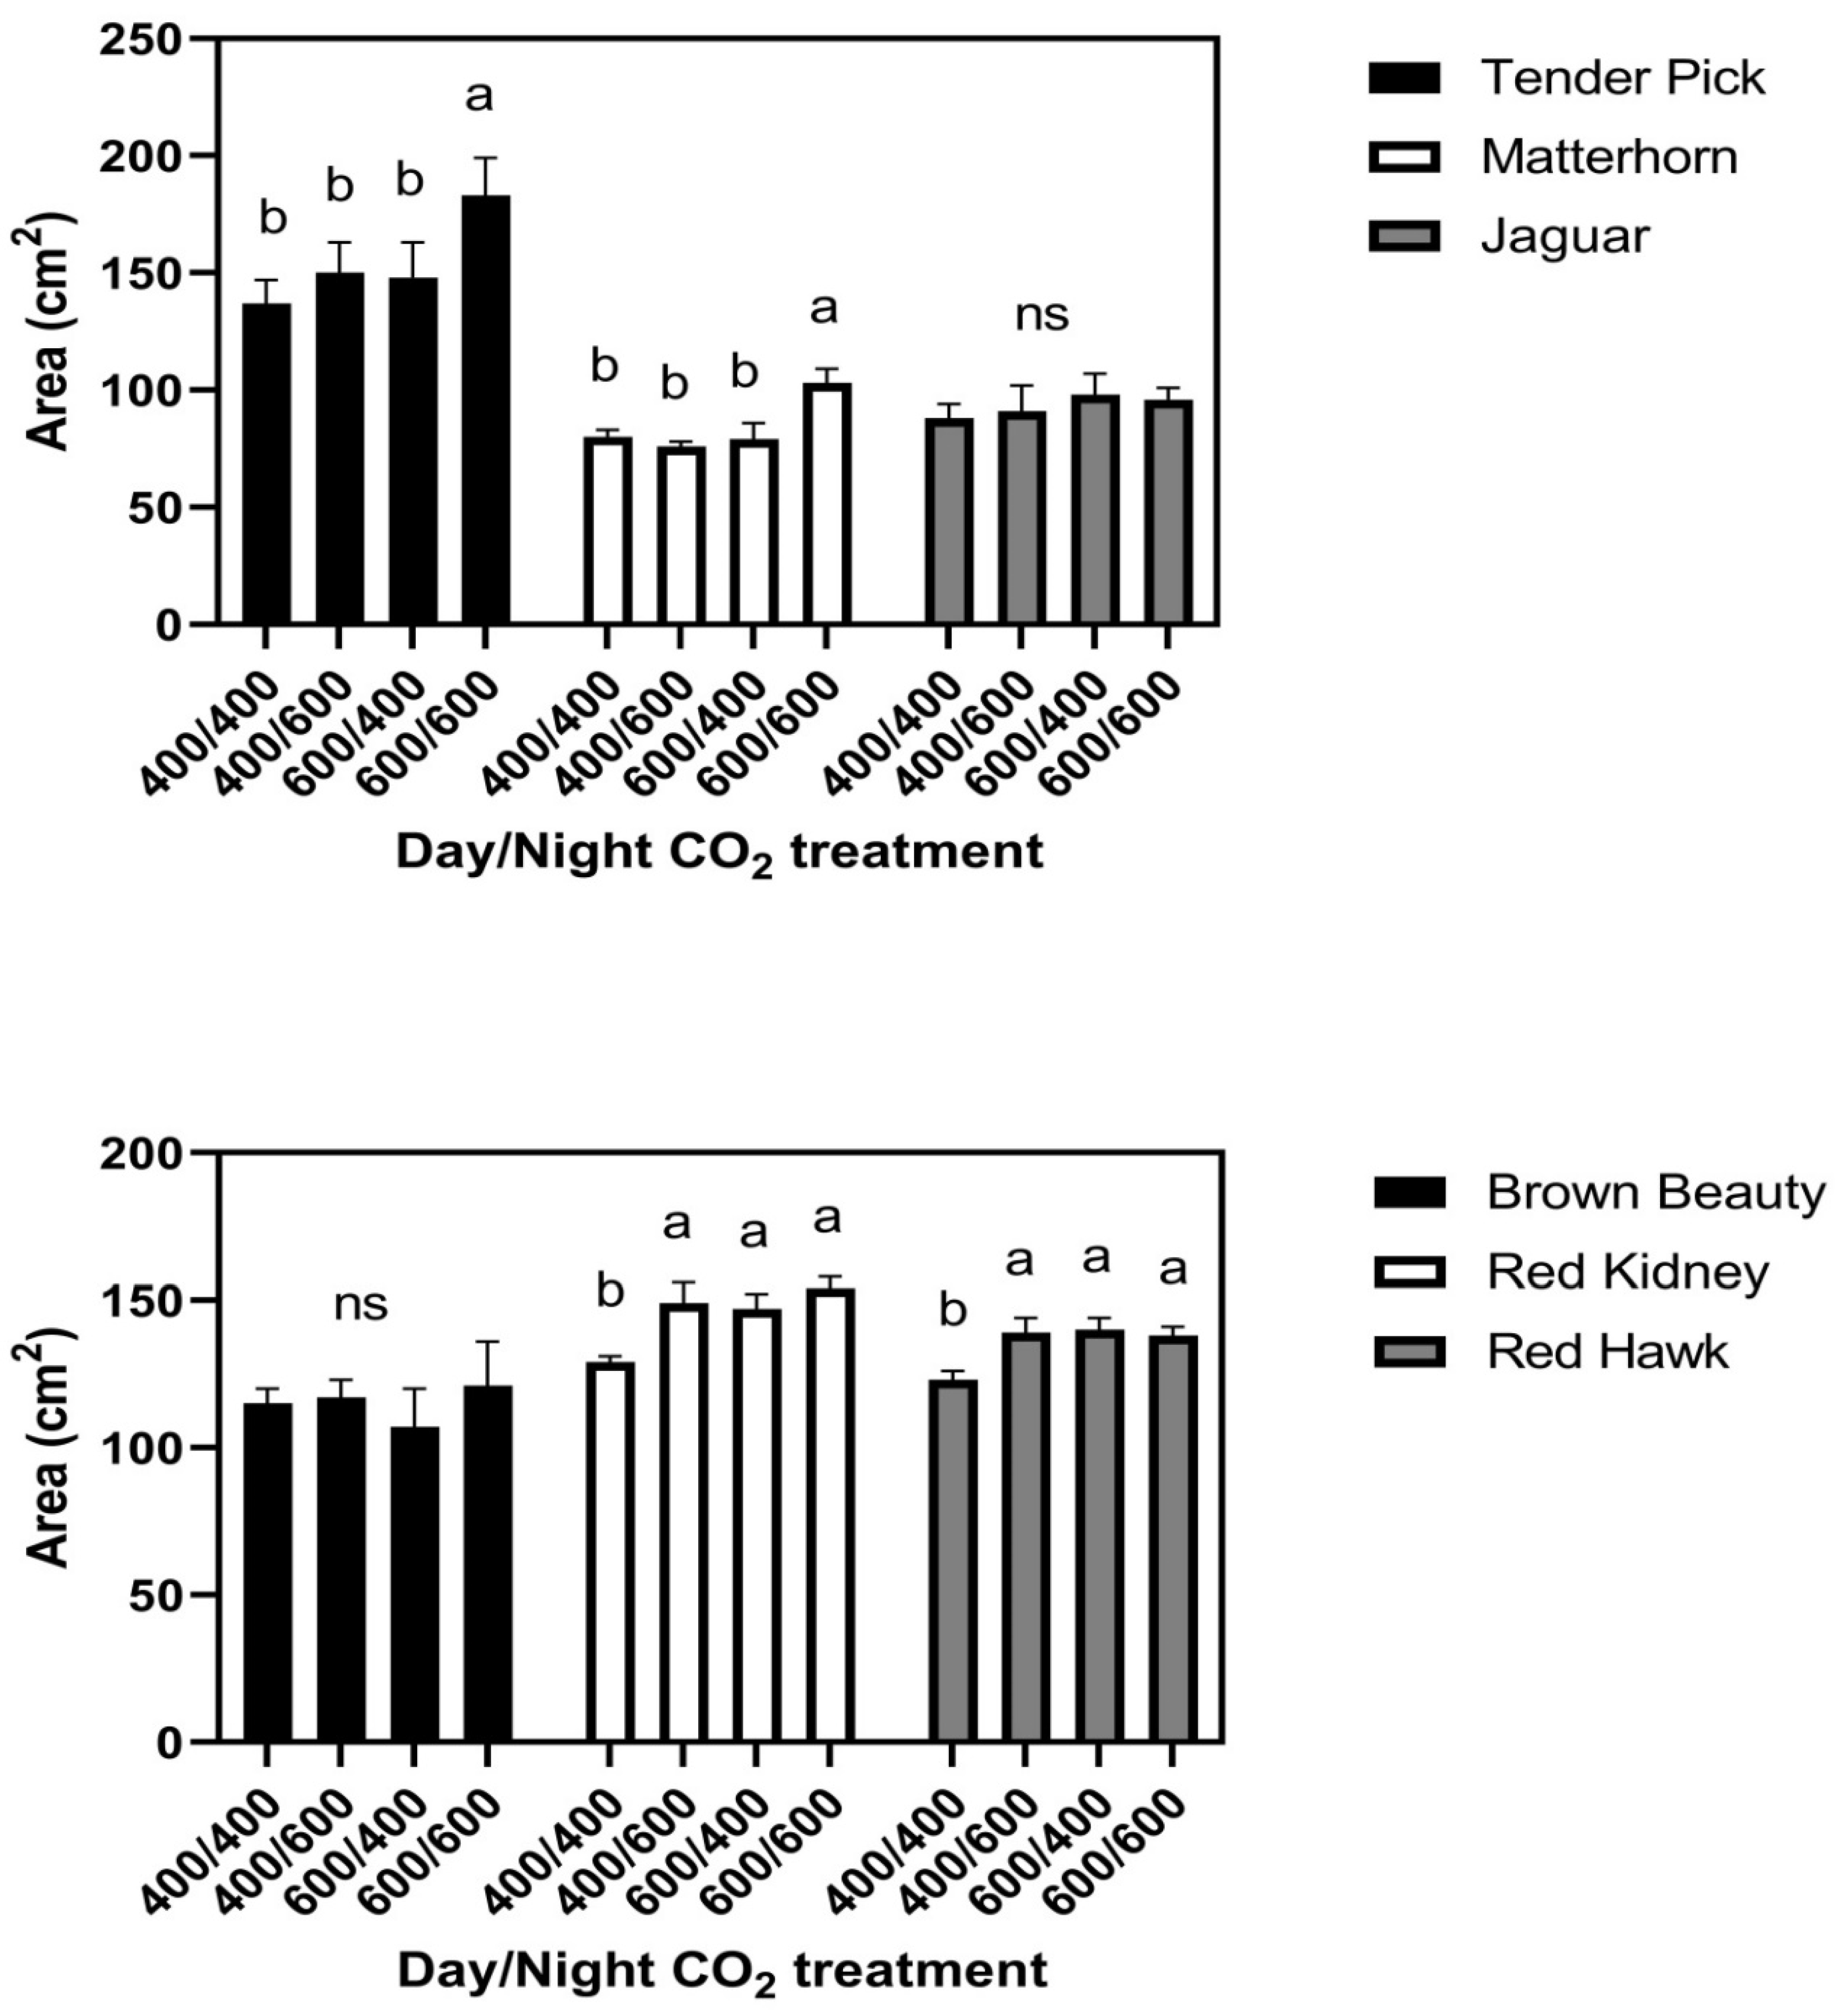
In the 26/20 °C day/night temperature regime, responses of leaf size to the day/night CO
2 treatments fell into three groups, with two cultivars in each group. There were no CO
2 treatment effects on leaf size in Brown Beauty or Jaguar (
Figure 3). In Tenderpick and Matterhorn, elevated CO
2 given continuously increased leaf size, but elevated CO
2 only at night or only in the daytime had no effect on leaf size compared with constant ambient CO
2 (
Figure 3). In Red Hawk and Red Kidney, elevated CO
2 during either the day or the night continuously increased leaf size (
Figure 3). There were no significant differences among cultivars in leaf water potential either day or night, and no significant effects of CO
2 treatment (
Figure 2). Turgor pressure averaged higher at night than during the daytime in all cultivars (
Figure 2).
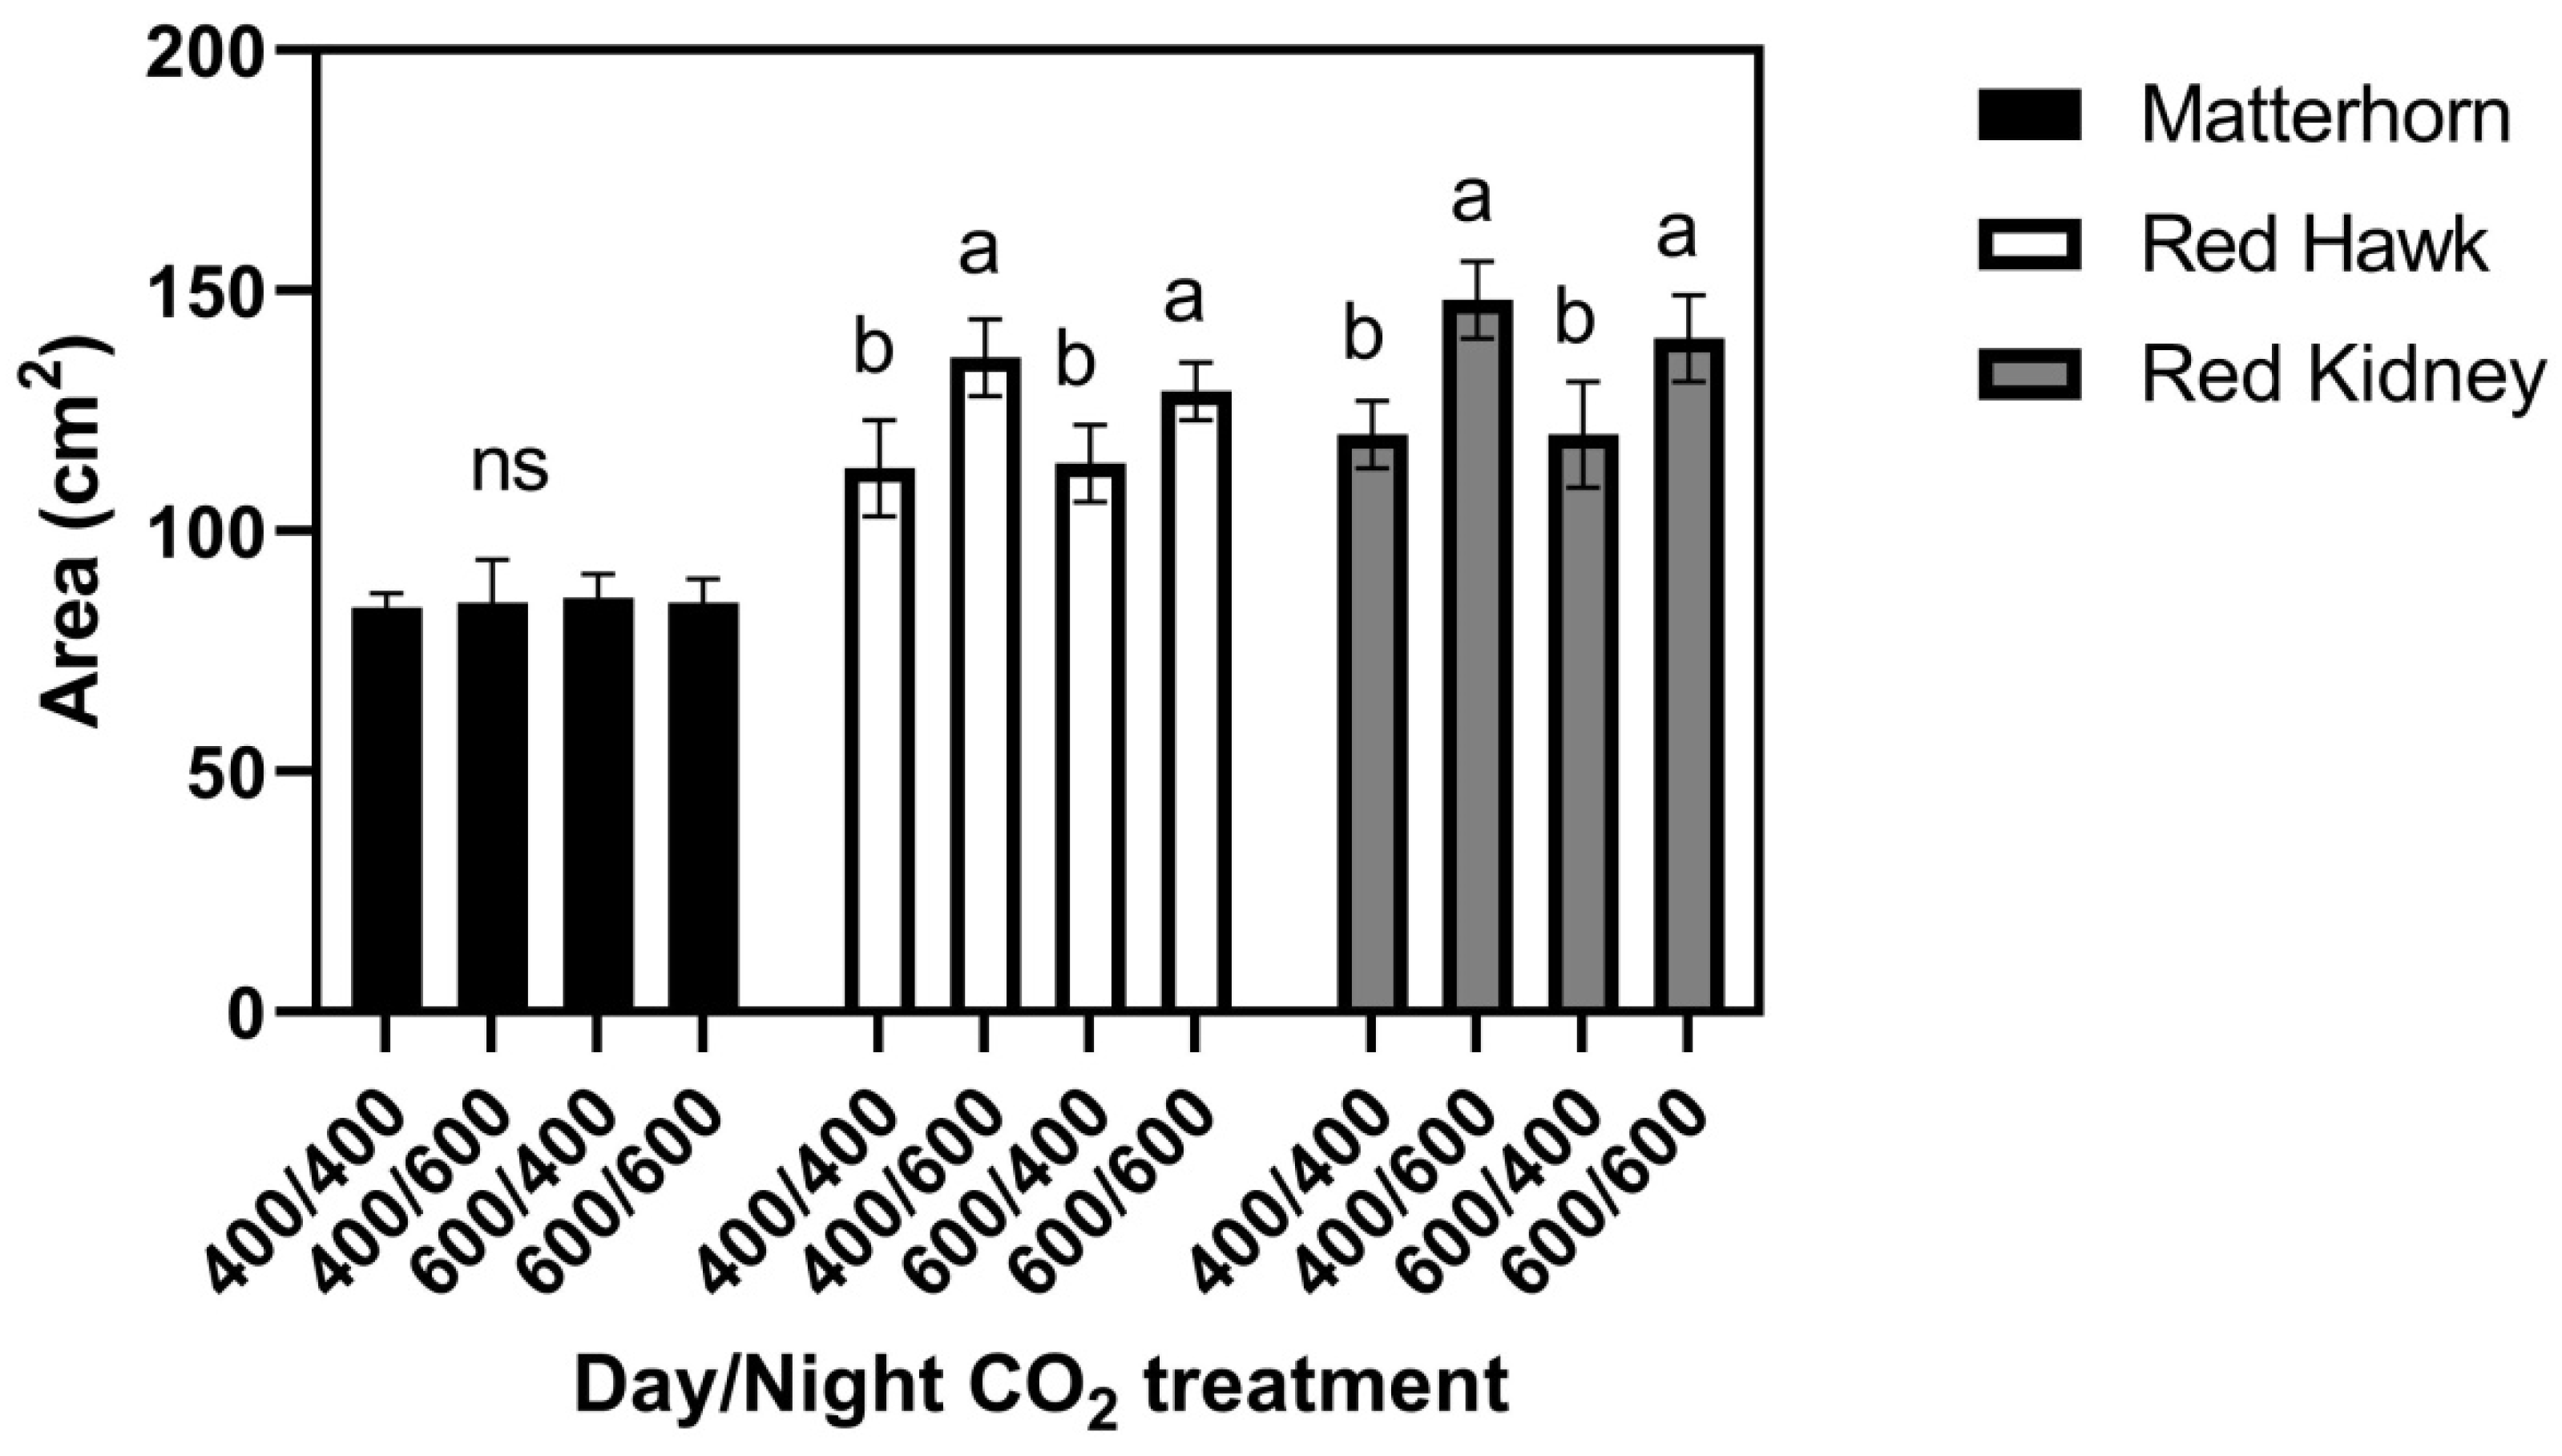
When three cultivars were grown at 29/17 °C, leaf size in Matterhorn did not differ among the four CO
2 treatments (
Figure 4), while both Red Hawk and Red Kidney had larger leaves when grown at 400/600 and 600/600 μmol mol
−1 day/night CO
2 concentrations than when grown at 600/400 or 400/400 μmol mol
−1 Figure 4. For Red Hawk and Red Kidney, these leaf size patterns mimicked the response of Red Kidney previously observed in the field [
6]. Leaf water potentials did not differ significantly between cultivars or CO
2 treatments either during the light or the dark (
Figure 2). Turgor pressures averaged higher at night than in the daytime (
Figure 2), with no significant differences between cultivars or CO
2 treatments.
3. Discussion
These indoor experiments were successful in duplicating the contrasting leaf size responses to day and/or night elevation of CO
2 observed in field experiments in the cultivars Tenderpick and Red Kidney [
6]. In the field, leaf size in Tenderpick was increased only by continuous elevation of CO
2. In these experiments in controlled environment chambers, this response occurred in both the cultivars Tenderpick and Matterhorn when grown at 26/20 °C day/night temperatures, and in Matterhorn when grown at 29/17 °C. In the field experiment, leaf size in Red Kidney was increased to the same extent by elevated CO
2 provided only at night, or both night and day, but not when provided only in the daytime. In these indoor experiments, that same leaf size response occurred in both Red Kidney and Red Hawk when grown at 29/17 °C day/night temperatures. The importance of the day/night temperature regime to the responses of leaf size to CO
2 elevation is illustrated by the elimination of leaf size responses to elevated CO
2 in Matterhorn as the amplitude of the day/night temperature difference increased, and the lack of CO
2 effect on leaf size in Red Kidney and Red Hawk at constant temperature contrasting with strong responses with day/night temperature differences. These contrasting responses of the cultivars to the CO
2 treatments occurred despite all cultivars being grown simultaneously in the same chamber.
Neither leaf water potentials nor turgor pressures, either in daytime or at night, helped to explain the cultivar differences in leaf size response to the temperature or CO
2 treatment regimes, because no significant differences occurred among cultivars in either parameter in any environment. Leaf water potentials were significantly lower in daytime only in the constant temperature regime. Turgor pressures averaged about 0.2 MPa higher at night than in daytime in all temperature regimes, perhaps being a more sensitive indicator of water status than leaf water potential. Ferris and Taylor [
14] and Gardner et al. [
3] were also unable to relate CO
2 effects on leaf extension rates to treatment differences in turgor or leaf water potential. All of these results suggest some sort of metabolic control of leaf expansion rather than control by transpiration or leaf water potential [
15]. Seneweera and Conroy [
18] concluded that faster expansion of wheat leaves at elevated CO
2 was related to greater availability of soluble carbohydrates for export from mature to developing leaves, but how this might relate to day/night patterns of leaf expansion or effects of CO
2 at night on expansion are unclear.
There are certain similarities between leaf size responses to CO
2 and to the light environment, with increases in light sometimes increasing and sometimes decreasing leaf size, depending on the light level and the species (e.g., [
19,
20]). For responses of expansion to light regimes, changes in gene expression, and changes in auxin, gibberellin, and cytokinin and phototropin content have sometimes been identified as controlling factors (e.g., [
21,
22,
23]), but to our knowledge there is no similar data for responses of leaf size to CO
2. In previous work with bean primary leaves, elevated CO
2 applied throughout leaf development did not affect final leaf size, but it increased final size when applied only during the cell expansion phase [
24], which suggests that it decreased cell proliferation. In ryegrass leaves increasing CO
2 concentration increased leaf elongation rate during the daytime, but decreased it during the night [
25], with the 24-h rates unaffected.
In some annual crops, such as determinate cultivars of common beans, canopies often have a fairly low leaf area index for much of the yield formation period. In this situation, differences in leaf size among CO
2 treatments may have a large impact on seed yield, which makes cultivar differences in CO
2 effects on leaf size an important factor in yield responses. For example, the relative seed yield increase was nearly the same in Tenderpick and Red Kidney when elevated CO
2 was applied only in the daytime, but was about 20% larger in Red Kidney than in Tenderpick when CO
2 was elevated continuously [
6]. Clearly, elevating CO
2 only during the daytime, as many free air CO
2 enrichment systems do, would misrepresent some cultivar differences in yield responses to rising atmospheric CO
2 in common bean, and probably in other species as well, simply because of the complex responses of leaf size to elevated CO
2. Effects of CO
2 on plants during darkness have been recognized for several years (e.g., [
26,
27]). In the context of climate change, only free-air CO
2 enrichment (FACE) experiments have frequently chosen not to increase CO
2 at night as well as daytime, sometimes because of the expense, and sometimes because of a lack of wind to distribute the CO
2 across the plot. The latter problem can be overcome by using area-distributed FACE systems [
28]. Soybean yield at elevated CO
2 in FACE was larger when elevated CO
2 was applied for 24 h per day than when applied only in the daytime [
29], as reported for beans in open top chambers [
6]. Responses of leaf size to CO
2 both day and night, and interactions with temperature remain unexplained plant physiological phenomena, but have important practical implications for efforts to adapt crops to the rising atmospheric CO
2.
4. Materials and Methods
Six cultivars of common bean (Phaseolus vulgaris L.), namely, Brown Beauty, Red Kidney, Jaguar, Matterhorn, Red Hawk, and Tenderpick, were grown in indoor controlled environment chambers. Tenderpick and Red Kidney were used, because this was an attempt to duplicate and understand the leaf size responses of these two cultivars observed previously under field conditions. The other four cultivars were selected as also being determinate, bush-type bean plants, as are Tenderpick and Red Kidney. Four chambers, each with 3.7 m2 ground area, were utilized, with day/night CO2 concentrations controlled to 400/400, 400/600, 600/400, or 600/600 μmol mol−1. Light was provided for 12 h per day from a mixture of high-pressure sodium and metal halide lamps with dimmable ballasts, programmed to maintain a PPFD of 1000 μmol m−2 s−1 measured at the tops of the plants. Pure CO2, or CO2-free air was added to each chamber under the control of an absolute infrared CO2 analyzer (WMA-4 or WMA-5, PP Systems, Amesbury, MA, USA) whose output was sent to a proportional–integral–derivative (PID) controller. Peak to trough variation in CO2, as measured with an open path CO2 analyzer sampling at 0.1 Hz, was 15 μmol mol−1 at 400 μmol mol−1, and 22 μmol mol−1 at 600 μmol mol−1 control concentrations. Experiments using all cultivars were run with day/night air temperatures of 23/23 and 26/20 °C. Experiments with three cultivars, namely, Red Kidney, Matterhorn, and Red Hawk, were also run at 29/17 °C, because, for Red Kidney, the field responses of leaf size of were not precisely mimicked in either of the other temperature regimes, as they were for Tenderpick, and Red Hawk had responses similar to Red Kidney in the other environments tested here. These temperature regimes were chosen to approximate growing season temperatures in Beltsville MD, where the mean is 23 °C, the average day and night temperatures are 26 and 20 °C, and the average daily maximum and minimum temperatures are 29 and 17 °C. In all experiments, temperature, humidity, CO2, and PPFD were logged every 2.5 min to a computer. Temperature was controlled to ±0.3 °C. Air saturation deficits for water vapor during the day time averaged 1.1, 1.3, and 1.6 kPa at 23, 26, and 29 °C air temperatures. Air saturation deficits at night were 0.4 to 0.6 kPa in all thermal regimes. Each combination of CO2 and temperature had three chamber replicates over time, with the four CO2 treatments rotated among chambers.
Plants were grown rooted in a medium grade of vermiculite and watered daily with a complete nutrient solution containing 14.5 mM nitrogen. Plants were grown in plastic bins, 0.30 m2 in area, and 50 cm in depth, with one bin per cultivar in each chamber. Seeds were overplanted, and seedlings thinned for uniformity of emergence time and for even spacing to 10 plants per bin. The position of the bin for each cultivar within the chambers was kept the same for all four chambers within a replicate experiment, and randomized between replicate experiments.
Plants were grown until the third mainstem trifoliolate leaf was fully expanded, and then the areas of the terminal leaflets of the third trifoliolate leaves of all plants were measured with a leaf area meter (LI-3000C, LiCor Inc., Lincoln, NB, USA). Prior to the final harvest, when third trifoliolate leaves were less than half of their final area, leaf water potentials and turgor pressures were measured both in the dark and in the light. Leaf discs were removed from leaves either shortly before lights came on, or at least two hours after lights came on. Leaf water potentials were measured on the excised discs using an HR33 dew point hygrometer and C-52 sample chambers (Wescor Inc., Logan, UT, USA). The leaf discs were then sealed in the sample cups, frozen in a −80 °C freezer, thawed, and water potential measured again, to indicate osmotic potential. Turgor pressure was calculated as the difference between the leaf total and osmotic water potentials. These estimates of turgor are subject to some error caused by dilution of intracellular water by less concentrated water in cell walls, upon thawing. For each chamber run, for each cultivar, two replicate leaf discs from two different randomly selected plants were collected in the dark and in the light.
Leaf size responses of the cultivars to the CO
2 and temperature treatments were compared by analysis of variance, initially using three-way ANOVA to test for differences in response to cultivar, CO
2, and temperature, and their interactions. Because responses of size to cultivar and CO
2 interacted with temperature, each temperature was then analyzed separately using two-way ANOVA. For each temperature, the interaction of cultivar and CO
2 was significant. These two-way ANOVAs are presented in
Appendix A and
Table A1,
Table A2 and
Table A3. Because for each temperature, the cultivar by CO
2 interaction was significant, the response of each cultivar to the CO
2 treatments is shown in
Figure 1,
Figure 2 and
Figure 4. For daytime and night time leaf water potential and turgor pressure, the same 3-way analyses of variance indicated no significant effects of cultivar or interactions of cultivar with CO
2 or temperature, and therefore two-way ANOVA was used (
Table A4 and
Table A5) to test for effects of CO
2 and temperature across all cultivars.


