Article

Multi-Species Prediction of Physiological Traits with Hyperspectral Modeling

1
Department of Agronomy, Purdue University, West Lafayette, IN 47907, USA
2
Department of Agricultural and Biological Engineering, Purdue University, West Lafayette, IN 47907, USA
*
Author to whom correspondence should be addressed.
Plants 2022, 11(5), 676; https://doi.org/10.3390/plants11050676
Submission received: 31 January 2022 / Revised: 15 February 2022 / Accepted: 28 February 2022 / Published: 1 March 2022

Abstract

:
Lack of high-throughput phenotyping is a bottleneck to breeding for abiotic stress tolerance in crop plants. Efficient and non-destructive hyperspectral imaging can quantify plant physiological traits under abiotic stresses; however, prediction models generally are developed for few genotypes of one species, limiting the broader applications of this technology. Therefore, the objective of this research was to explore the possibility of developing cross-species models to predict physiological traits (relative water content and nitrogen content) based on hyperspectral reflectance through partial least square regression for three genotypes of sorghum (Sorghum bicolor (L.) Moench) and six genotypes of corn (Zea mays L.) under varying water and nitrogen treatments. Multi-species models were predictive for the relative water content of sorghum and corn (R2 = 0.809), as well as for the nitrogen content of sorghum and corn (R2 = 0.637). Reflectances at 506, 535, 583, 627, 652, 694, 722, and 964 nm were responsive to changes in the relative water content, while the reflectances at 486, 521, 625, 680, 699, and 754 nm were responsive to changes in the nitrogen content. High-throughput hyperspectral imaging can be used to predict physiological status of plants across genotypes and some similar species with acceptable accuracy.

1. Introduction

Most agricultural production environments are exposed to abiotic stresses at one time or another, causing at least 50% economic loss in production each year [1]. Breeding for abiotic stress tolerant cultivars is essential for enhancing crop productivity and quality under global climate change [2]. However, breeding progress highly depends on the efficiency and accuracy of genotyping and phenotyping [3]. Genotyping is a high-throughput process that is well adapted to different species and accurate [4]. In contrast, improvements in phenotyping lag far behind. Traditional phenotyping methods are typically time consuming, labor intensive, species specific, destructive, and expensive. As a result, there is increasing interest in development of high-throughput phenotyping through machine learning-integrated remote sensing [5].
Water is required for normal plant growth and development. Plants have different strategies to adapt to water deficit, including changes in pigment composition and photosynthesis [6]. Water deficit decreases chlorophyll content in plants [7,8,9] due to degradation of light-harvesting chlorophyll a/b binding (LHCB) protein, the consequences of which are elevated chlorophyll a:b ratios [10]. Moreover, stomata close to reduce transpiration under water deficit, which limits carbon dioxide intake, slowing down carbon dioxide fixation. This leads to greater fluorescence, and heat is produced from chlorophyll absorbing similar amount of light [11]. Decreased carbon dioxide fixation further causes accumulation of electron donors in photosystem I, resulting in the over-production of reactive oxygen species [12], which induces the synthesis of antioxidants, such as carotenoid and anthocyanin [13].
Nitrogen is the most important nutrient for plants, accounting for 1.5% of dry matter [14]. Plants use an array of strategies to adapt for survival under nitrogen-limited condition. Since ammonia is required for biosynthesis of chlorophyll [15], plants inhibit chlorophyll accumulation under nitrogen deficiency [16], which indirectly reduces the abundance of the LHCB protein containing chlorophyll a and b [17]. Moreover, it is found that the expression of the LHCB protein is directly downregulated under nitrogen deficiency [18]. Further, plants accumulate anthocyanins to reduce oxidative damage [19] caused by production of reactive oxygen species under nitrogen deficiency [20].
Since plants produce specialized metabolites with unique reflectance characteristics under water or nitrogen stresses, reflectance with high-spectral resolution (hyperspectral reflectance, HR) is proposed as a method to predict water and nitrogen status of plants under water or nitrogen deficit. Predictive models have been developed for many plant species. The coefficient of determination (R2) is 0.98 for prediction of the relative water content (RWC) for five drought-sensitive and five drought-tolerant genotypes of rice [21]. R2 is 0.74 for the prediction of leaf water content (LWC) for four wheat genotypes [22]. The R2 is 0.81 and 0.92 for the prediction of LWC for two corn genotypes, separately [23]. Pre-dawn leaf water potential can be also predicted for three grapevine genotypes [24]. The fuel moisture content and equivalent water thickness of Azalea japonica, Buxus sempervirens, Euonymus japonicus, and Ficus benjamina can be also predicted, respectively [25]. On the other hand, canopy nitrogen content can be predicted for seven wheat genotypes [26]. Quantification of the nitrogen concentration in the leaf of one oilseed rape genotype [27] and estimation of the nitrogen concentration for one sugarcane genotype [28] can be also achieved by the predictive models.
However, models developed based on the responses of only one species and tested for prediction of the same species largely restrict the uses of these phenotyping models. In this study, HS imaging was used to study the water and nitrogen adaptation characteristics of corn and sorghum concerning the following questions: (1) the limitations of one genotype or species-based models, (2) the similarities in adaptation and genetics plays a role in prediction accuracy, (3) how cross-species models perform, and (4) the physiological basis of cross-species models. Three genotypes of sorghum and six genotypes of corn were selected for their adaptations to water and nitrogen deficits (Table 1). The relative water content (RWC) and nitrogen content (NC) were modeled with HR using partial least square regression (PLSR). Models were developed based on the responses of one genotype—combined sorghum, combined corn, or combined sorghum and corn—and used to predict RWC and NC. The R2 values are reported and compared for each model. Wavelengths important for RWC and NC were detected using coefficients and variable importance in projection (VIP) scores are reported.

2. Results

2.1. Diverse Responses of Sorghum and Corn to Water Deficit and Nitrogen Deficiency

Water and N treatment effects were significant in the study (Table 2). Regardless of genotypes, sorghum and corn had a significantly lower RWC under the water deficit condition compared to water sufficient condition. Similarly, sorghum and corn, regardless of genotypes, had a significantly lower NC under the nitrogen deficit condition compared to nitrogen sufficient condition.
The sorghum and corn genotypes were selected for this study based on differences in adaptation to drought and nitrogen stresses under field conditions (Table 1). Tx623 is susceptible to water deficit [29], while B35 and Tx7000 exhibit post-flowering tolerance [30] and pre-flowering tolerance [31] to water deficit, respectively. Moreover, B73xMo17, G80xPHP02, and BCC03xPHP02 are susceptible to water deficit [32], while PHJ33xPHP02 and CML550xPHP02 are tolerant to water deficit [33]. Although significant differences in RWC were not detected among sorghum or corn genotypes (Table 3), the observed plant responses should reflect that the range of physiological and spectral variation that are expected in these two important crop species.
Although there were few papers about nitrogen use efficiency of genotypes studied in this report (Table 1), lower NC in leaf tissue is associated with higher nitrogen use efficiency for both sorghum and corn. Tx7000 and CML550xPHP02 have high nitrogen use efficiency [34,35], while Tx623, B35, and B73xMo17 have low nitrogen use efficiency [36,37,38]. Tx7000 had lower NC in leaf tissue under nitrogen sufficient condition than Tx623 and B35, and CML550xPHP02 had lower NC in leaf tissue under nitrogen deficient condition than B73xMo17 (Table 3).

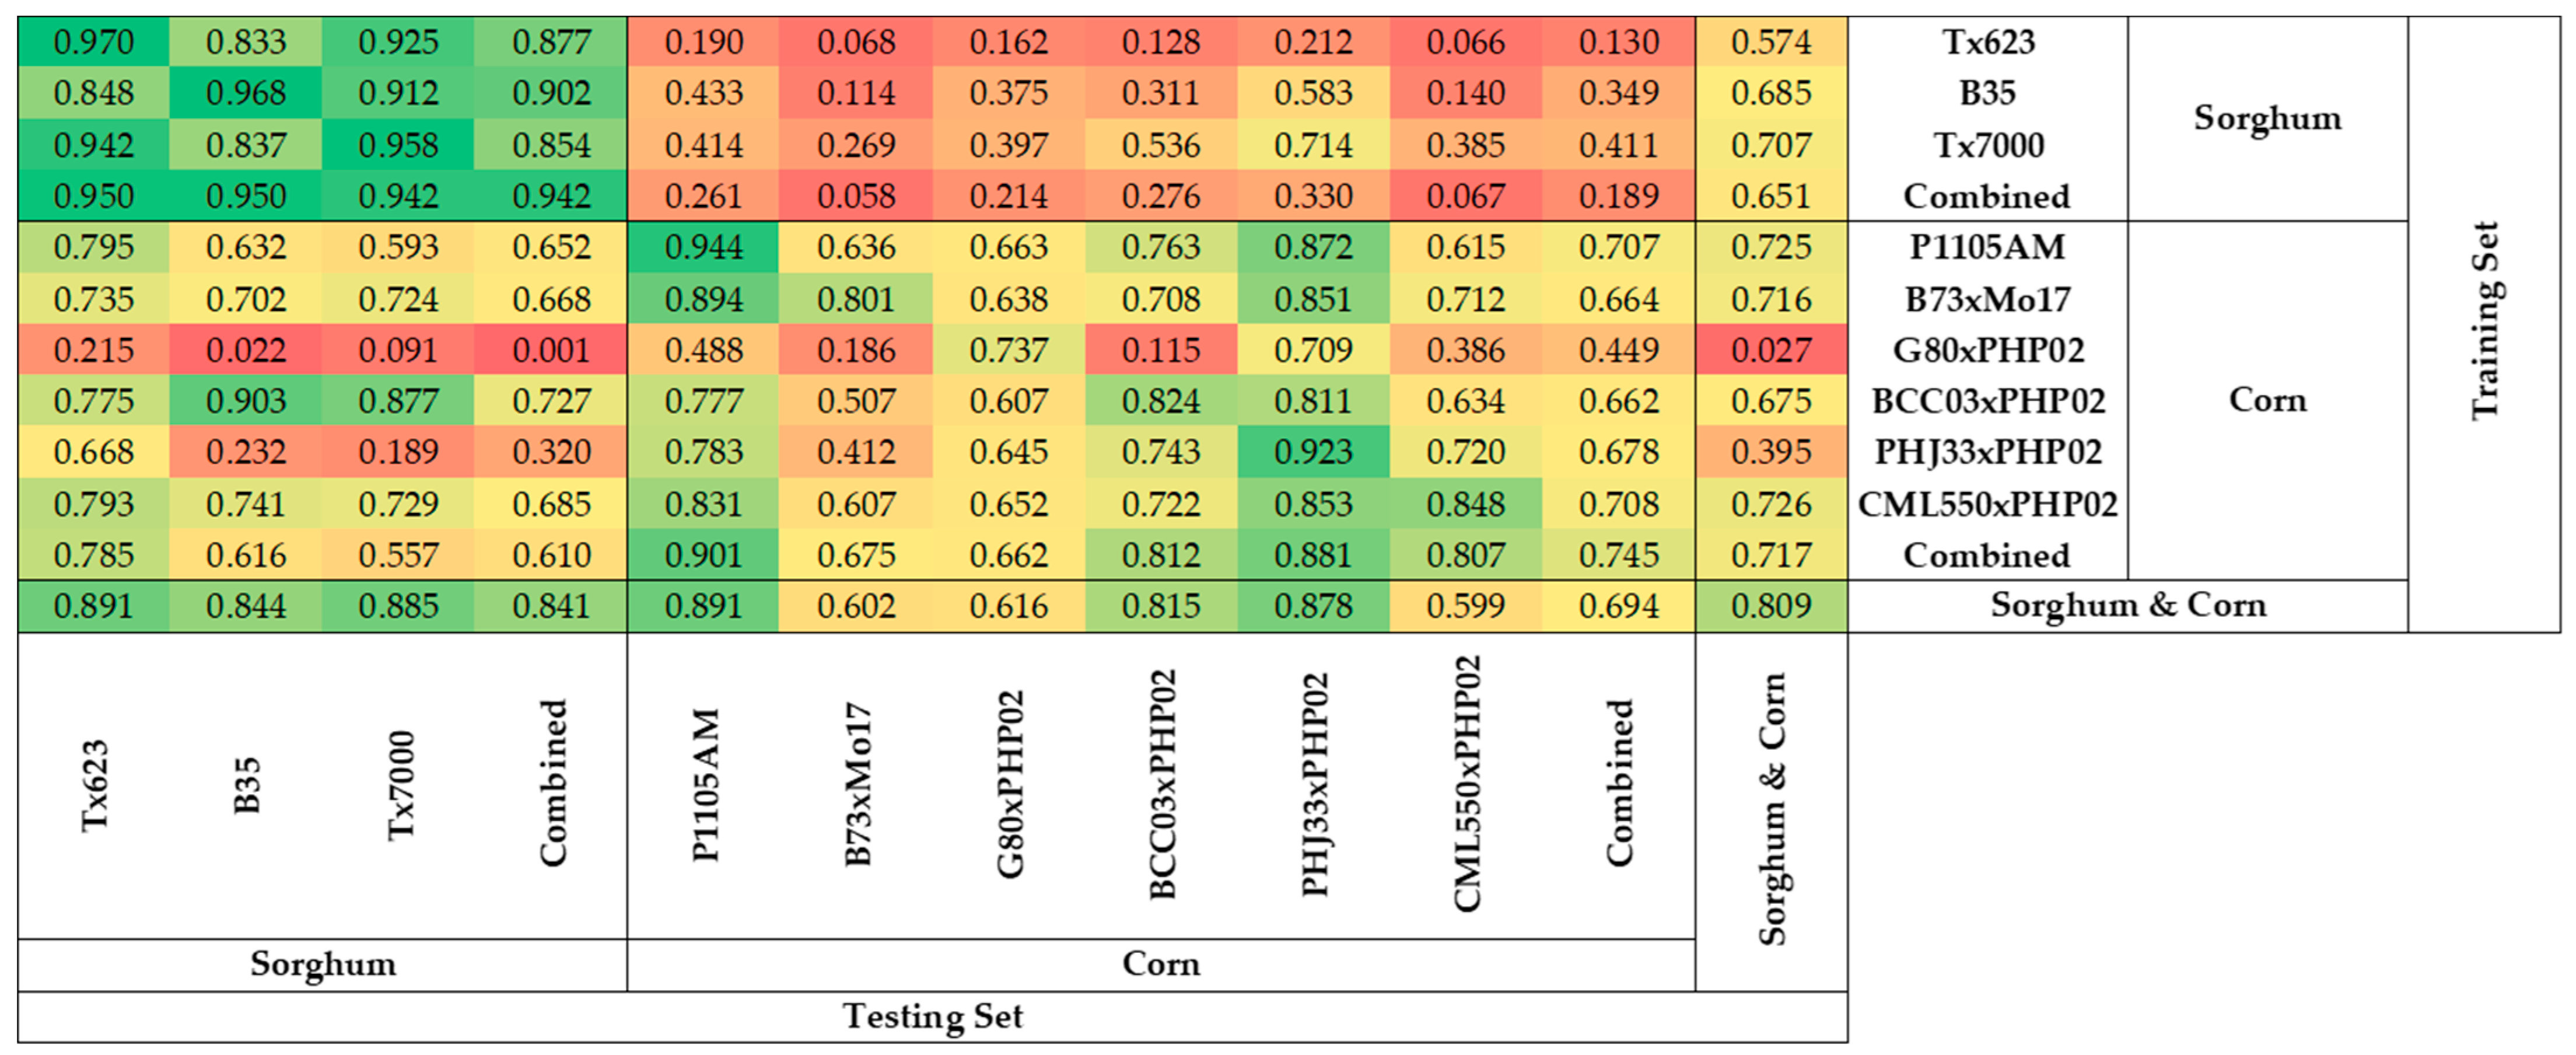
2.2. Prediction of Relative Water Content Using One Species Model

Sorghum models performed better in predicting the RWC of sorghum than in predicting the RWC of corn (Figure 1). The R2 of sorghum models to predict the RWC of sorghum ranged from 0.833 (Tx623 model to predict B35) to 0.970 (Tx623 model to predict Tx623), while the R2 for sorghum models to predict RWC of corn ranged from 0.066 (Tx623 model to predict CML550xPHP02) to 0.714 (Tx7000 model to predict PHJ33xPHP02). It was also clear that the combined sorghum model had a higher accuracy predicting the RWC of combined sorghum (R2 = 0.942) compared to predicting the RWC of combined corn (R2 = 0.189).
Similarly, corn models performed better in predicting the RWC of corn than in predicting the RWC of sorghum (Figure 1). The R2 for corn models to predict RWC of corn was between 0.115 (G80xPHP02 model to predict BCC03xPHP02) and 0.944 (P1105AM model to predict P1105AM), while the R2 for corn models to predict RWC of sorghum was between 0.022 (G80xPHP02 model to predict B35) and 0.903 (BCC03xPHP02 model to predict B35). The combined corn model had a higher accuracy predicting the RWC of combined corn (R2 = 0.745) compared to predicting the RWC of combined sorghum (R2 = 0.610).

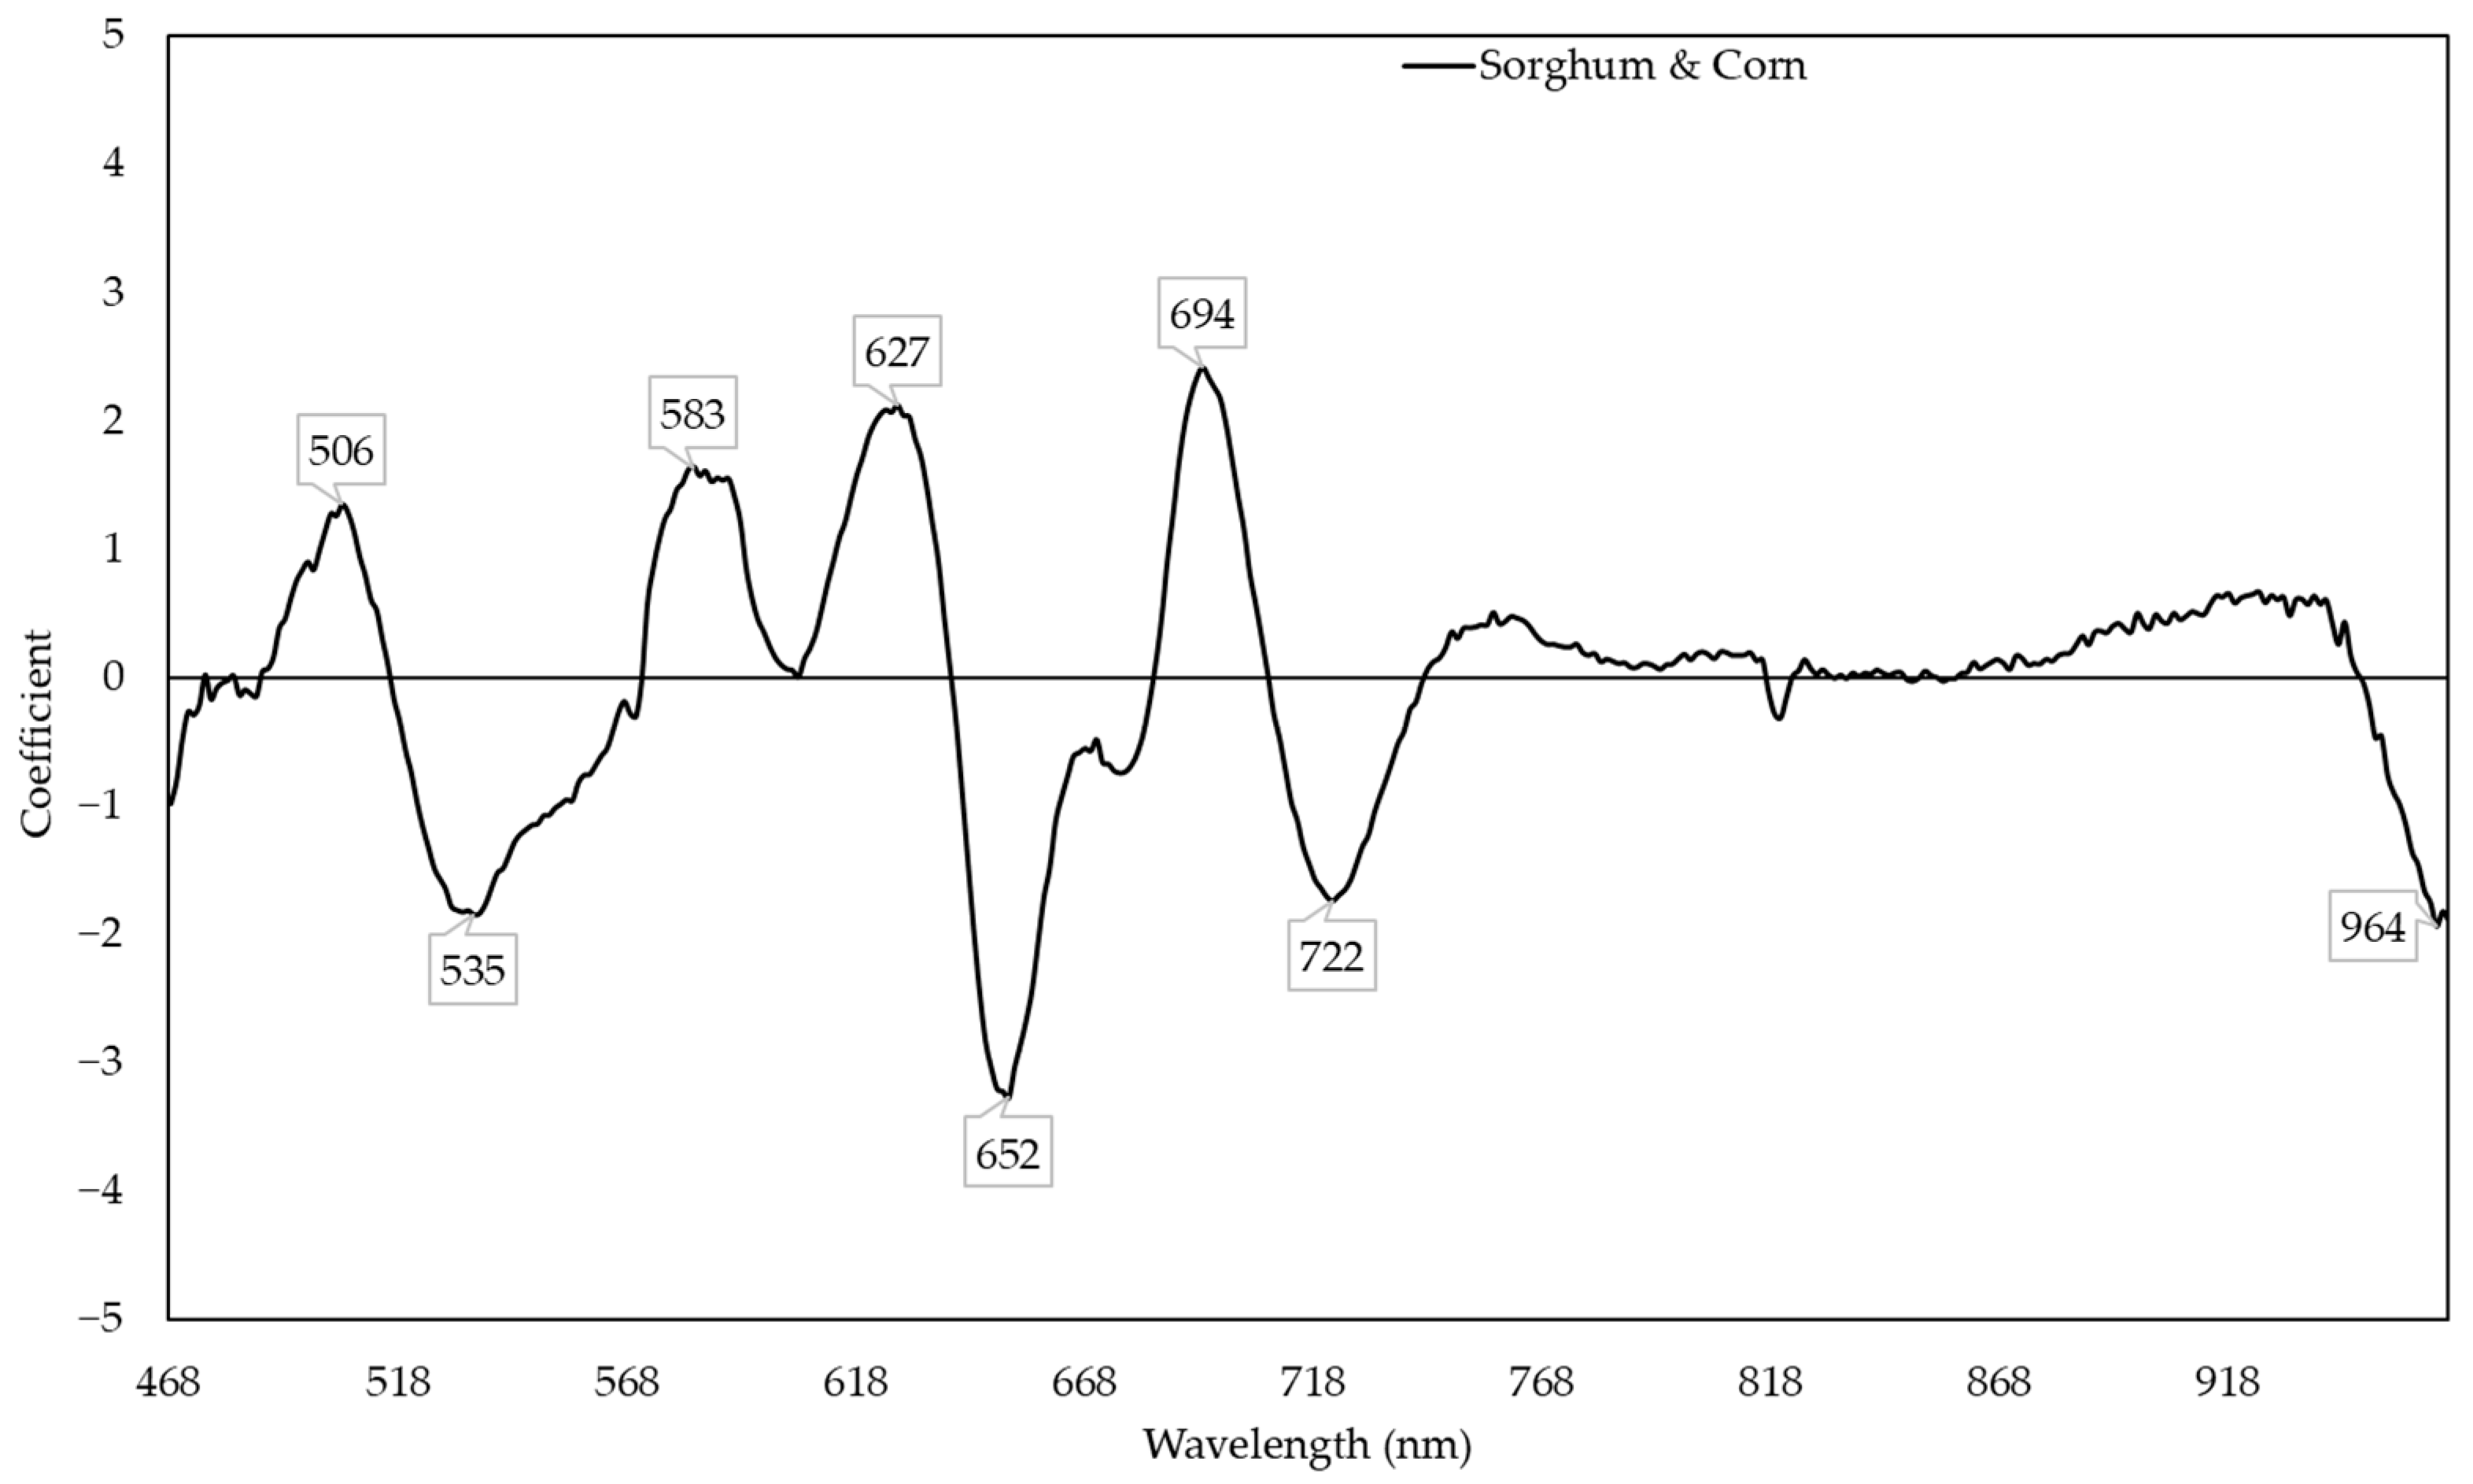
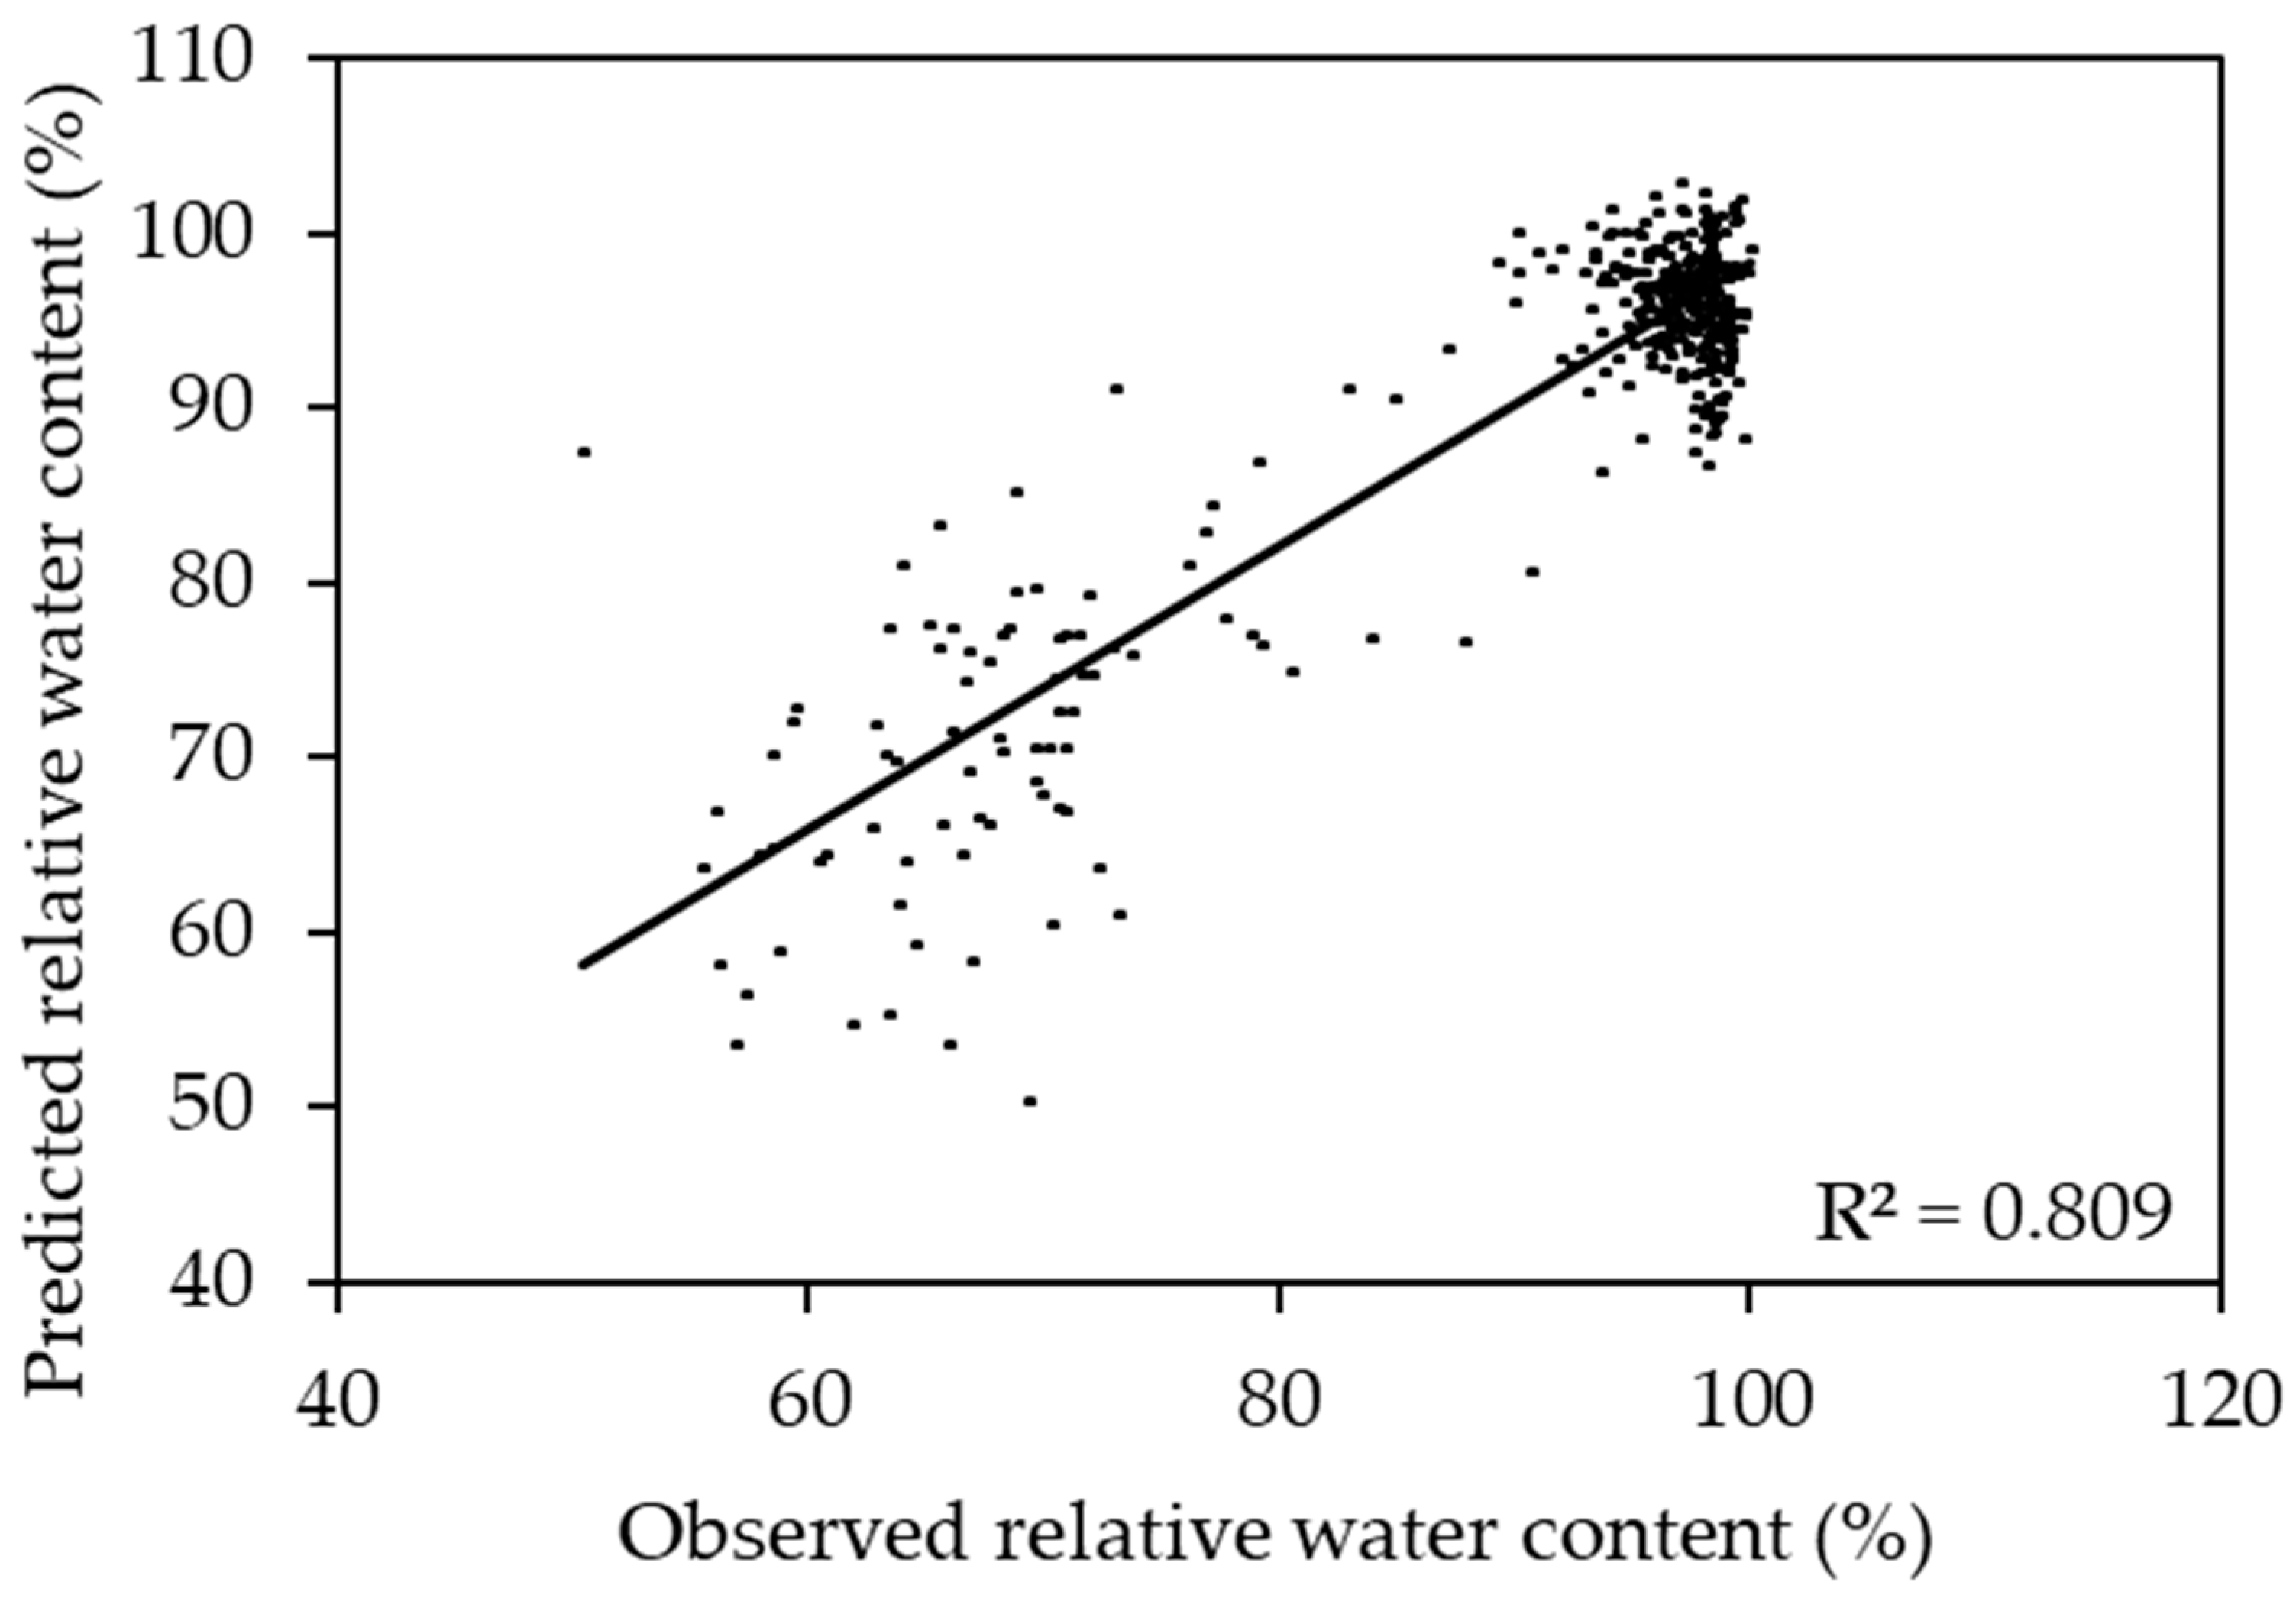
2.3. Prediction of Relative Water Content Using a Two Species Model

The sorghum and corn model performed well in predicting both sorghum (R2 ranging from 0.844 to 0.891) and corn (R2 ranging from 0.599 to 0.891). Compared to other models, the sorghum and corn model had the highest R2 for prediction of the RWC of sorghum and corn (Figure 2). In this model, the reflectances around 506, 535, 583, 627, 652, 694, 722, and 964 nm were responsive to change in the RWC (Figure 3). The combined corn and combined sorghum models generally had a similar coefficient pattern in the visible light range (400–700 nm), but the coefficients in much of the near-infrared (NIR, 700–1000 nm) region had the opposite sign, resulting in a coefficient close to zero for sorghum and corn model (Figure 4).

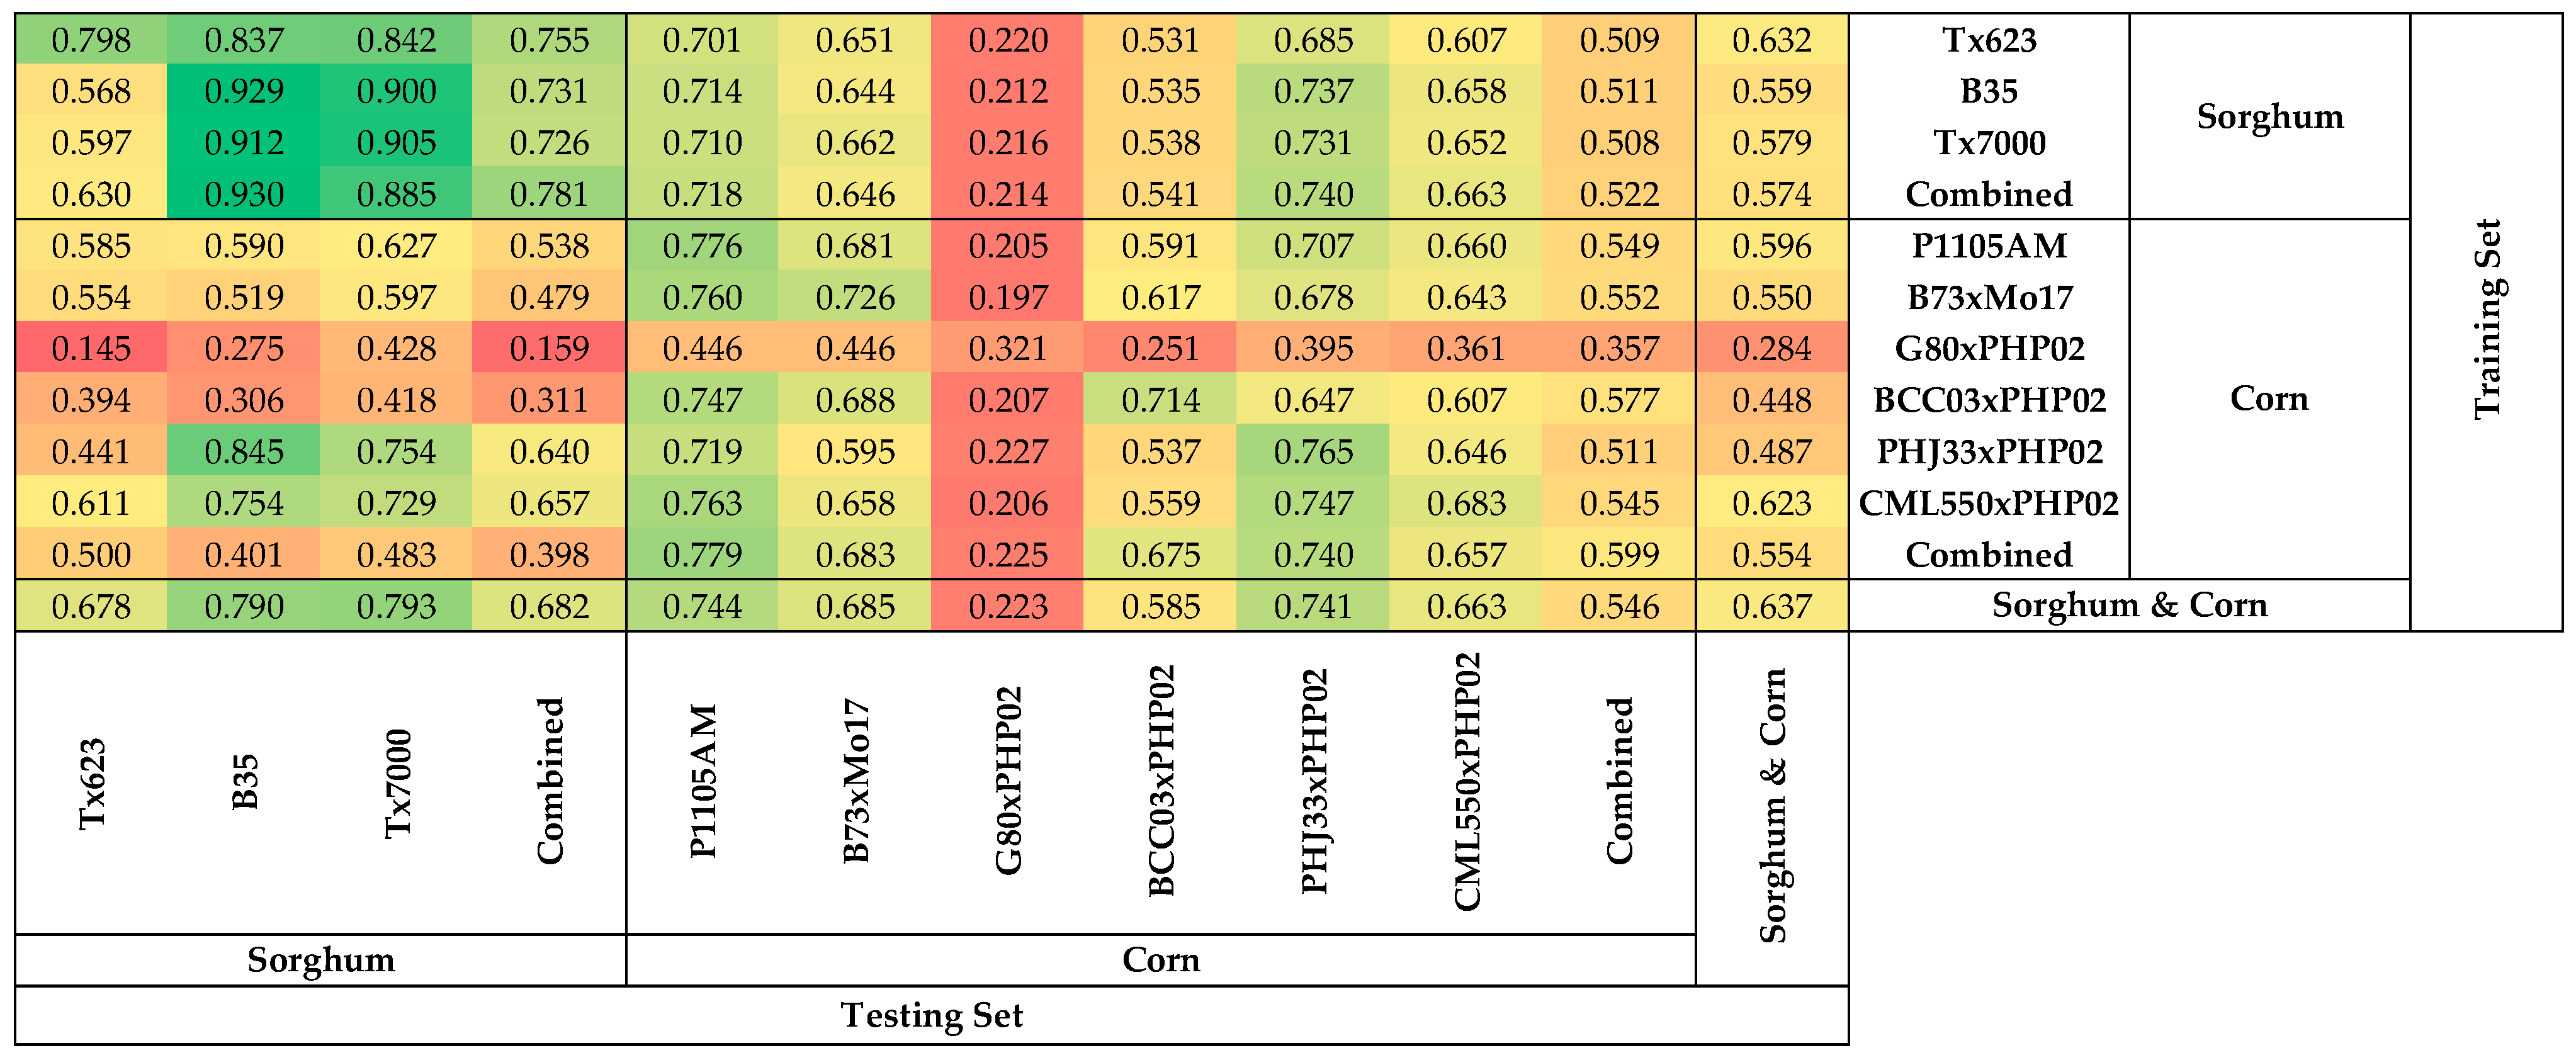
2.4. Prediction of Nitrogen Content Using One Species Models

Sorghum models performed better in predicting NC of sorghum than in predicting NC of corn (Figure 5). The R2 for the sorghum models to predict the nitrogen of sorghum was between 0.568 (B35 model to predict Tx623) and 0.929 (B35 model to predict B35), while the R2 for sorghum models to predict the NC of corn was between 0.212 (B35 model to predict G80xPHP02) and 0.737 (B35 model to predict PHJ33xPHP02). The combined sorghum model had a higher accuracy predicting the NC of combined sorghum (R2 = 0.781) compared to predicting the NC of combined corn (R2 = 0.522). Similarly, the combined corn model had a higher accuracy predicting the NC of combined corn (R2 = 0.599) compared to predicting the NC of combined sorghum (R2 = 0.398).

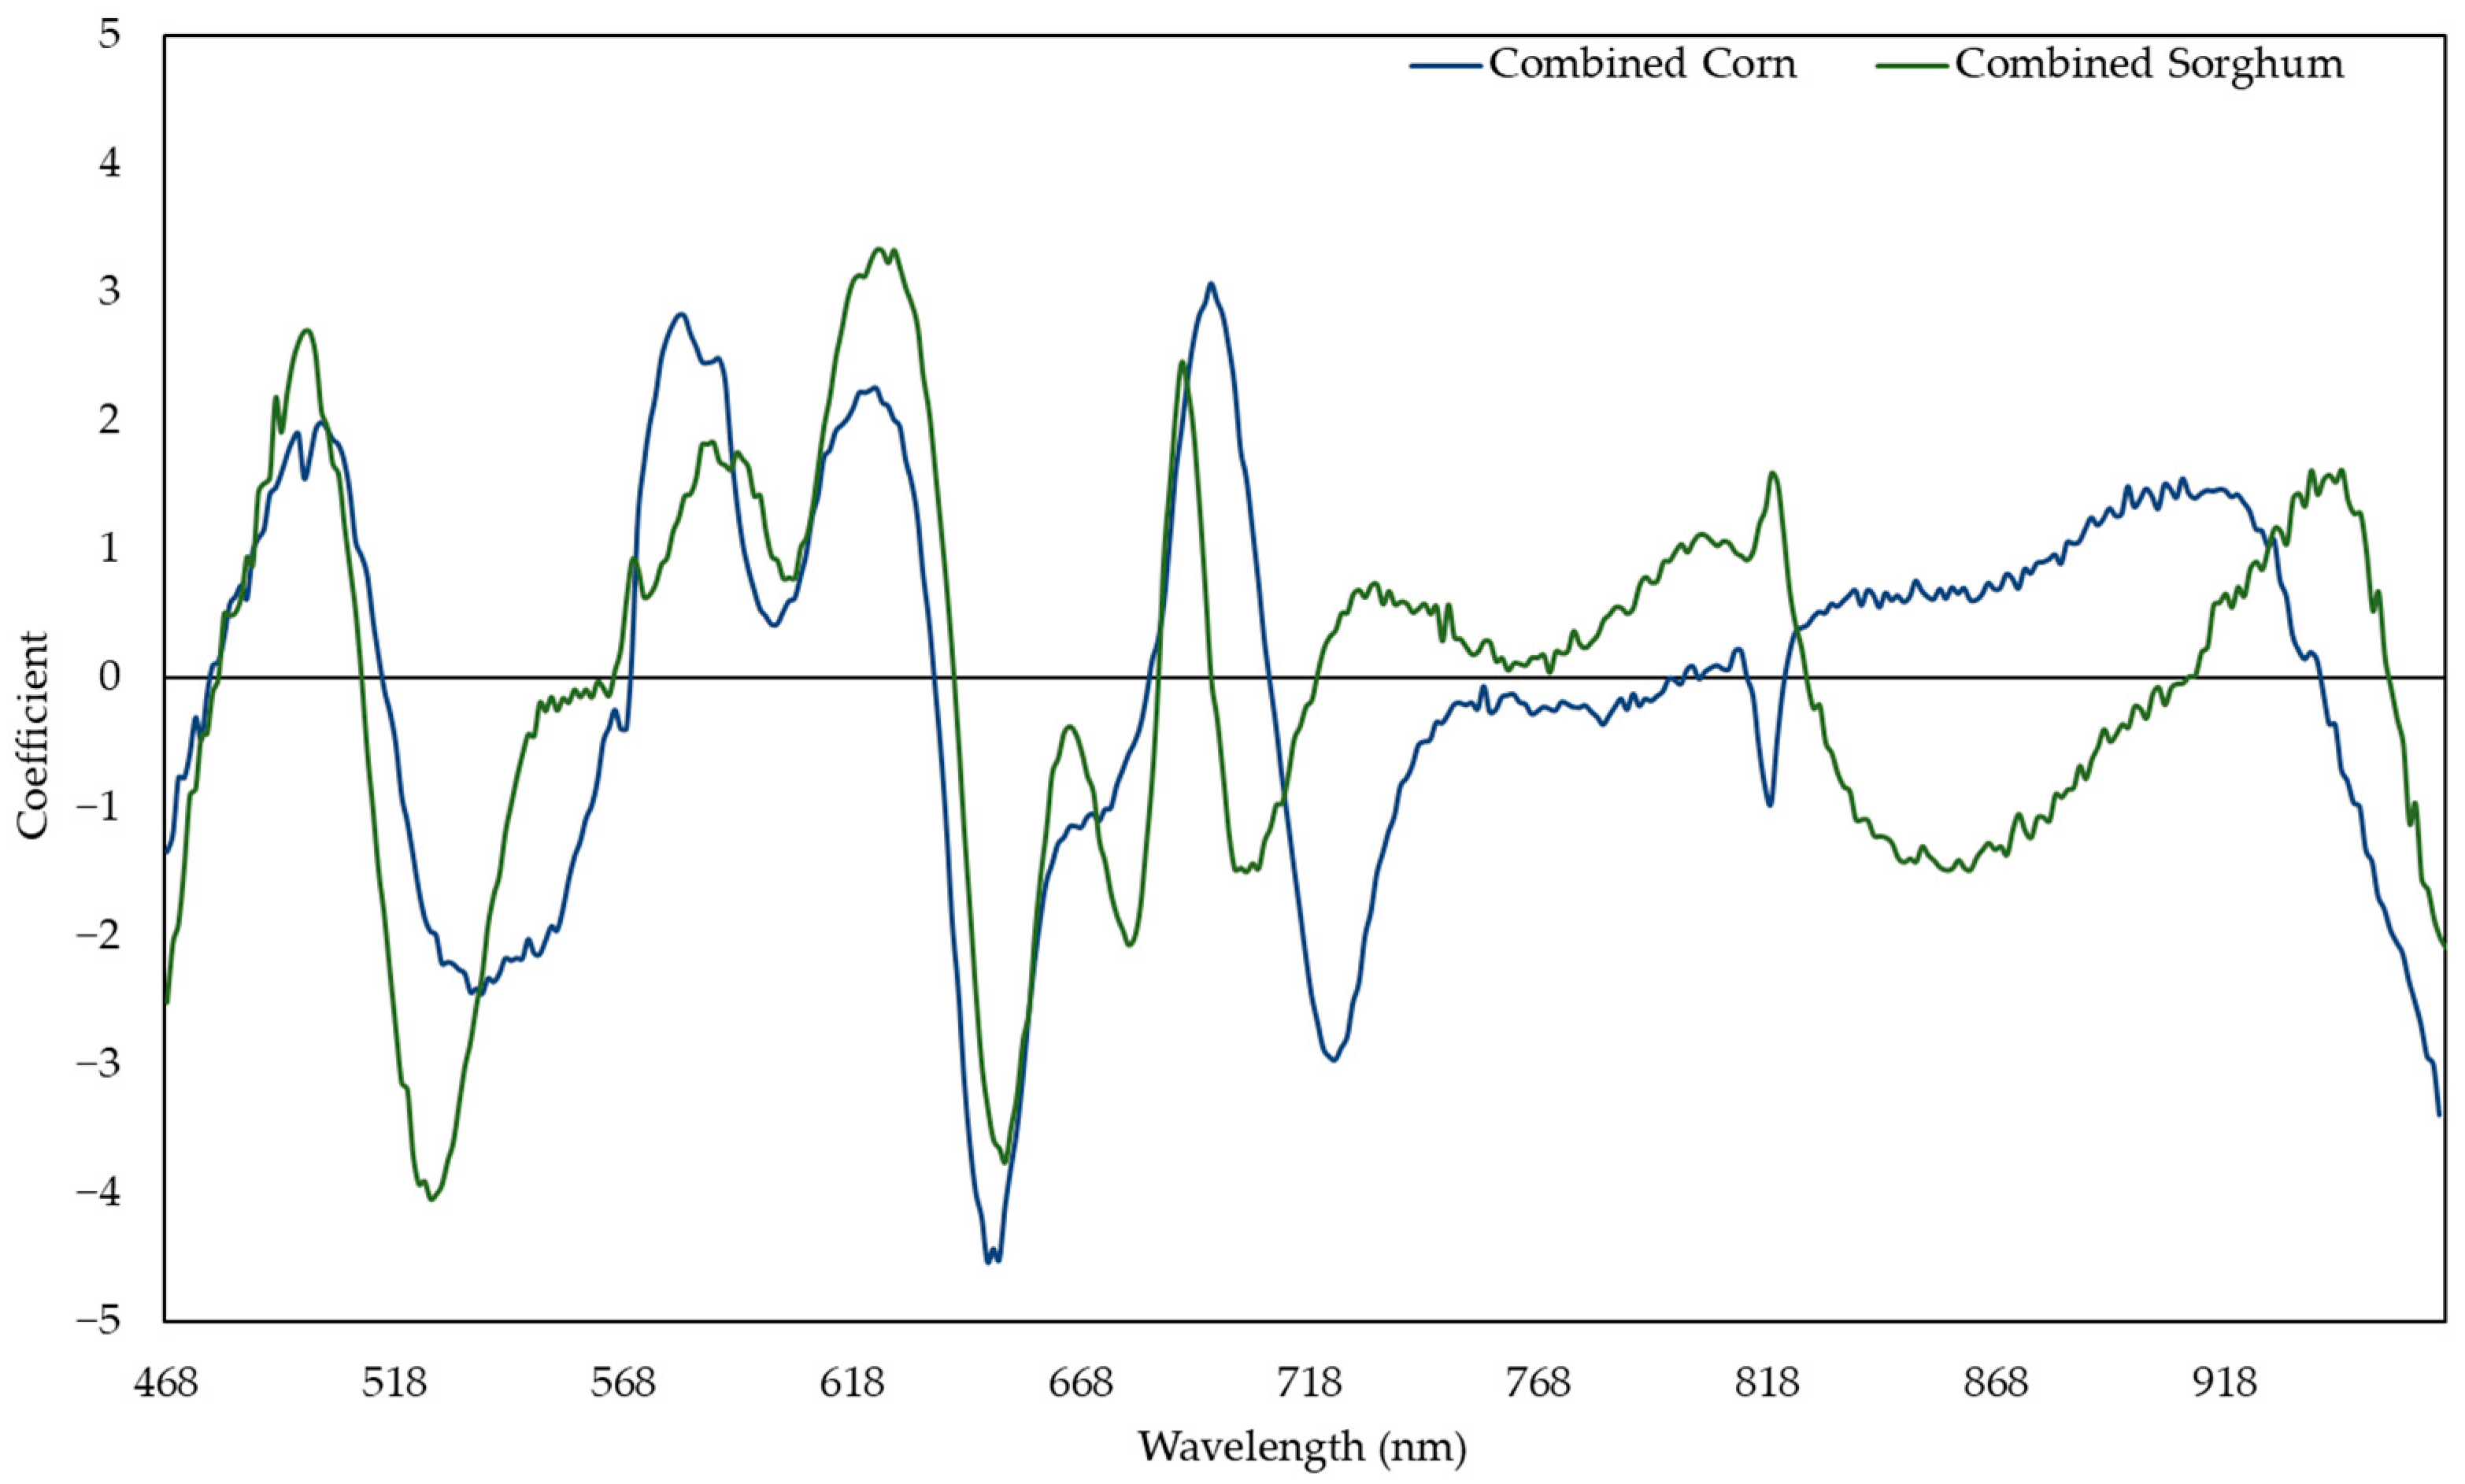
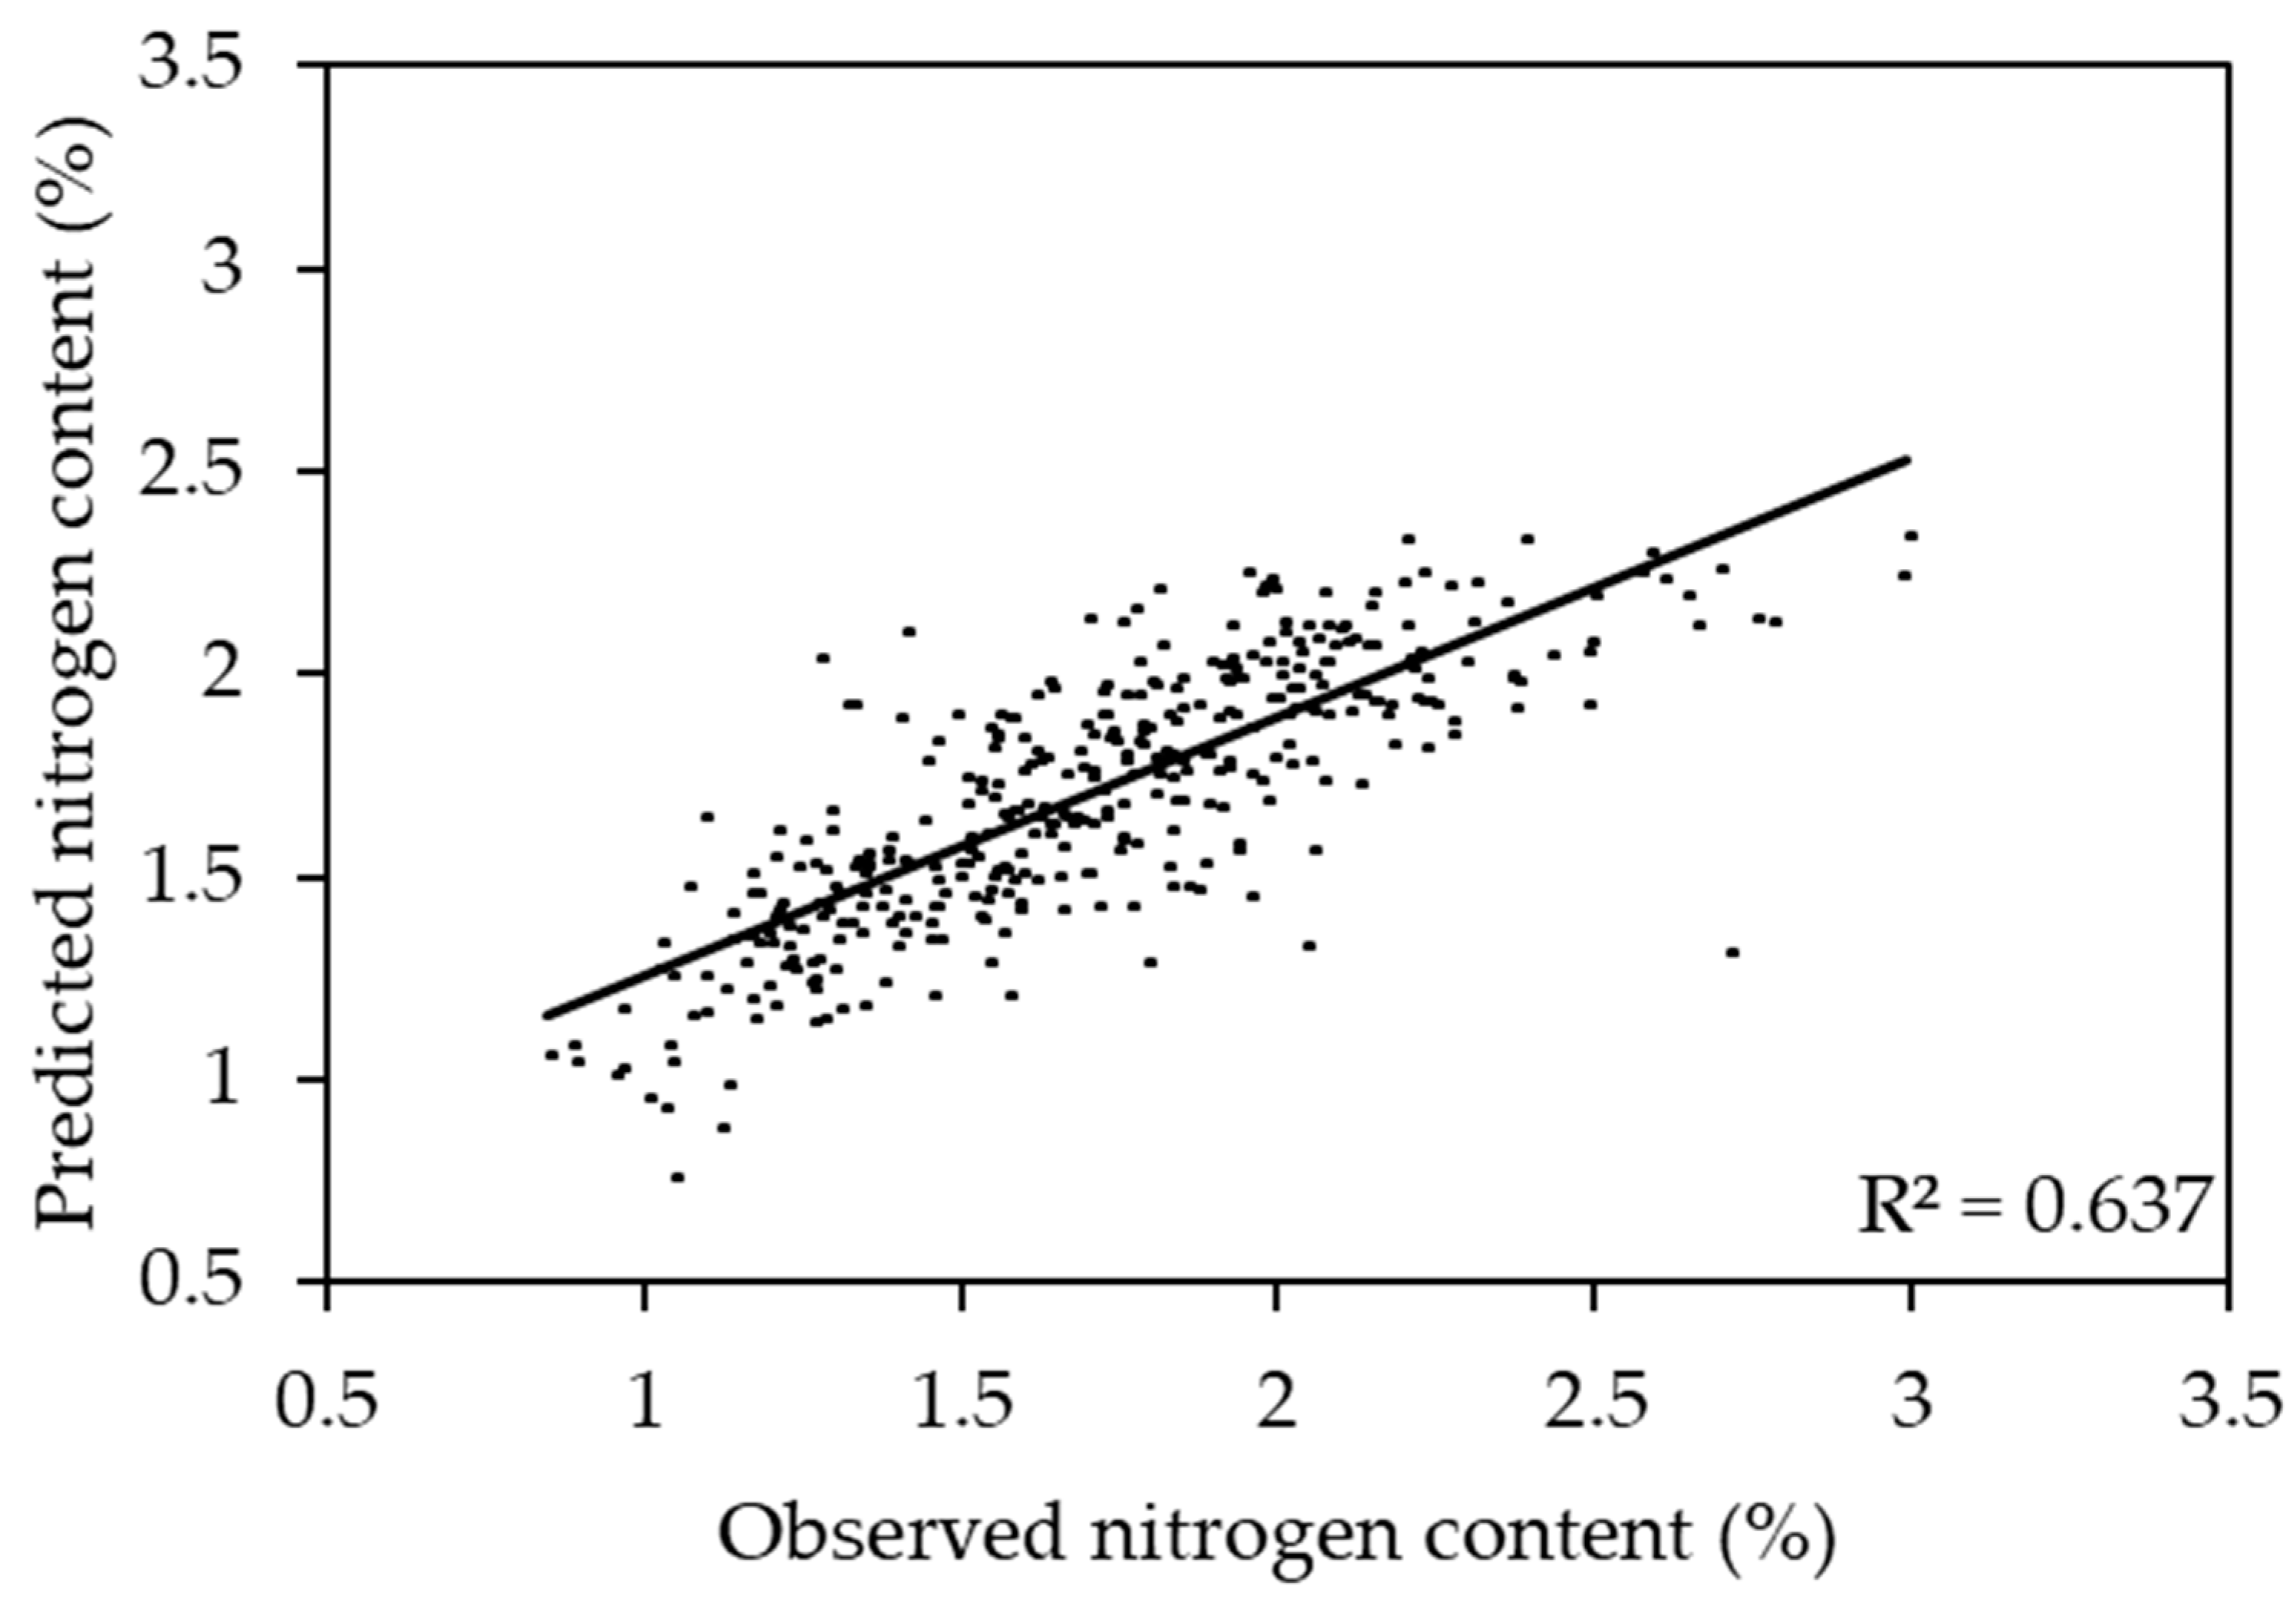
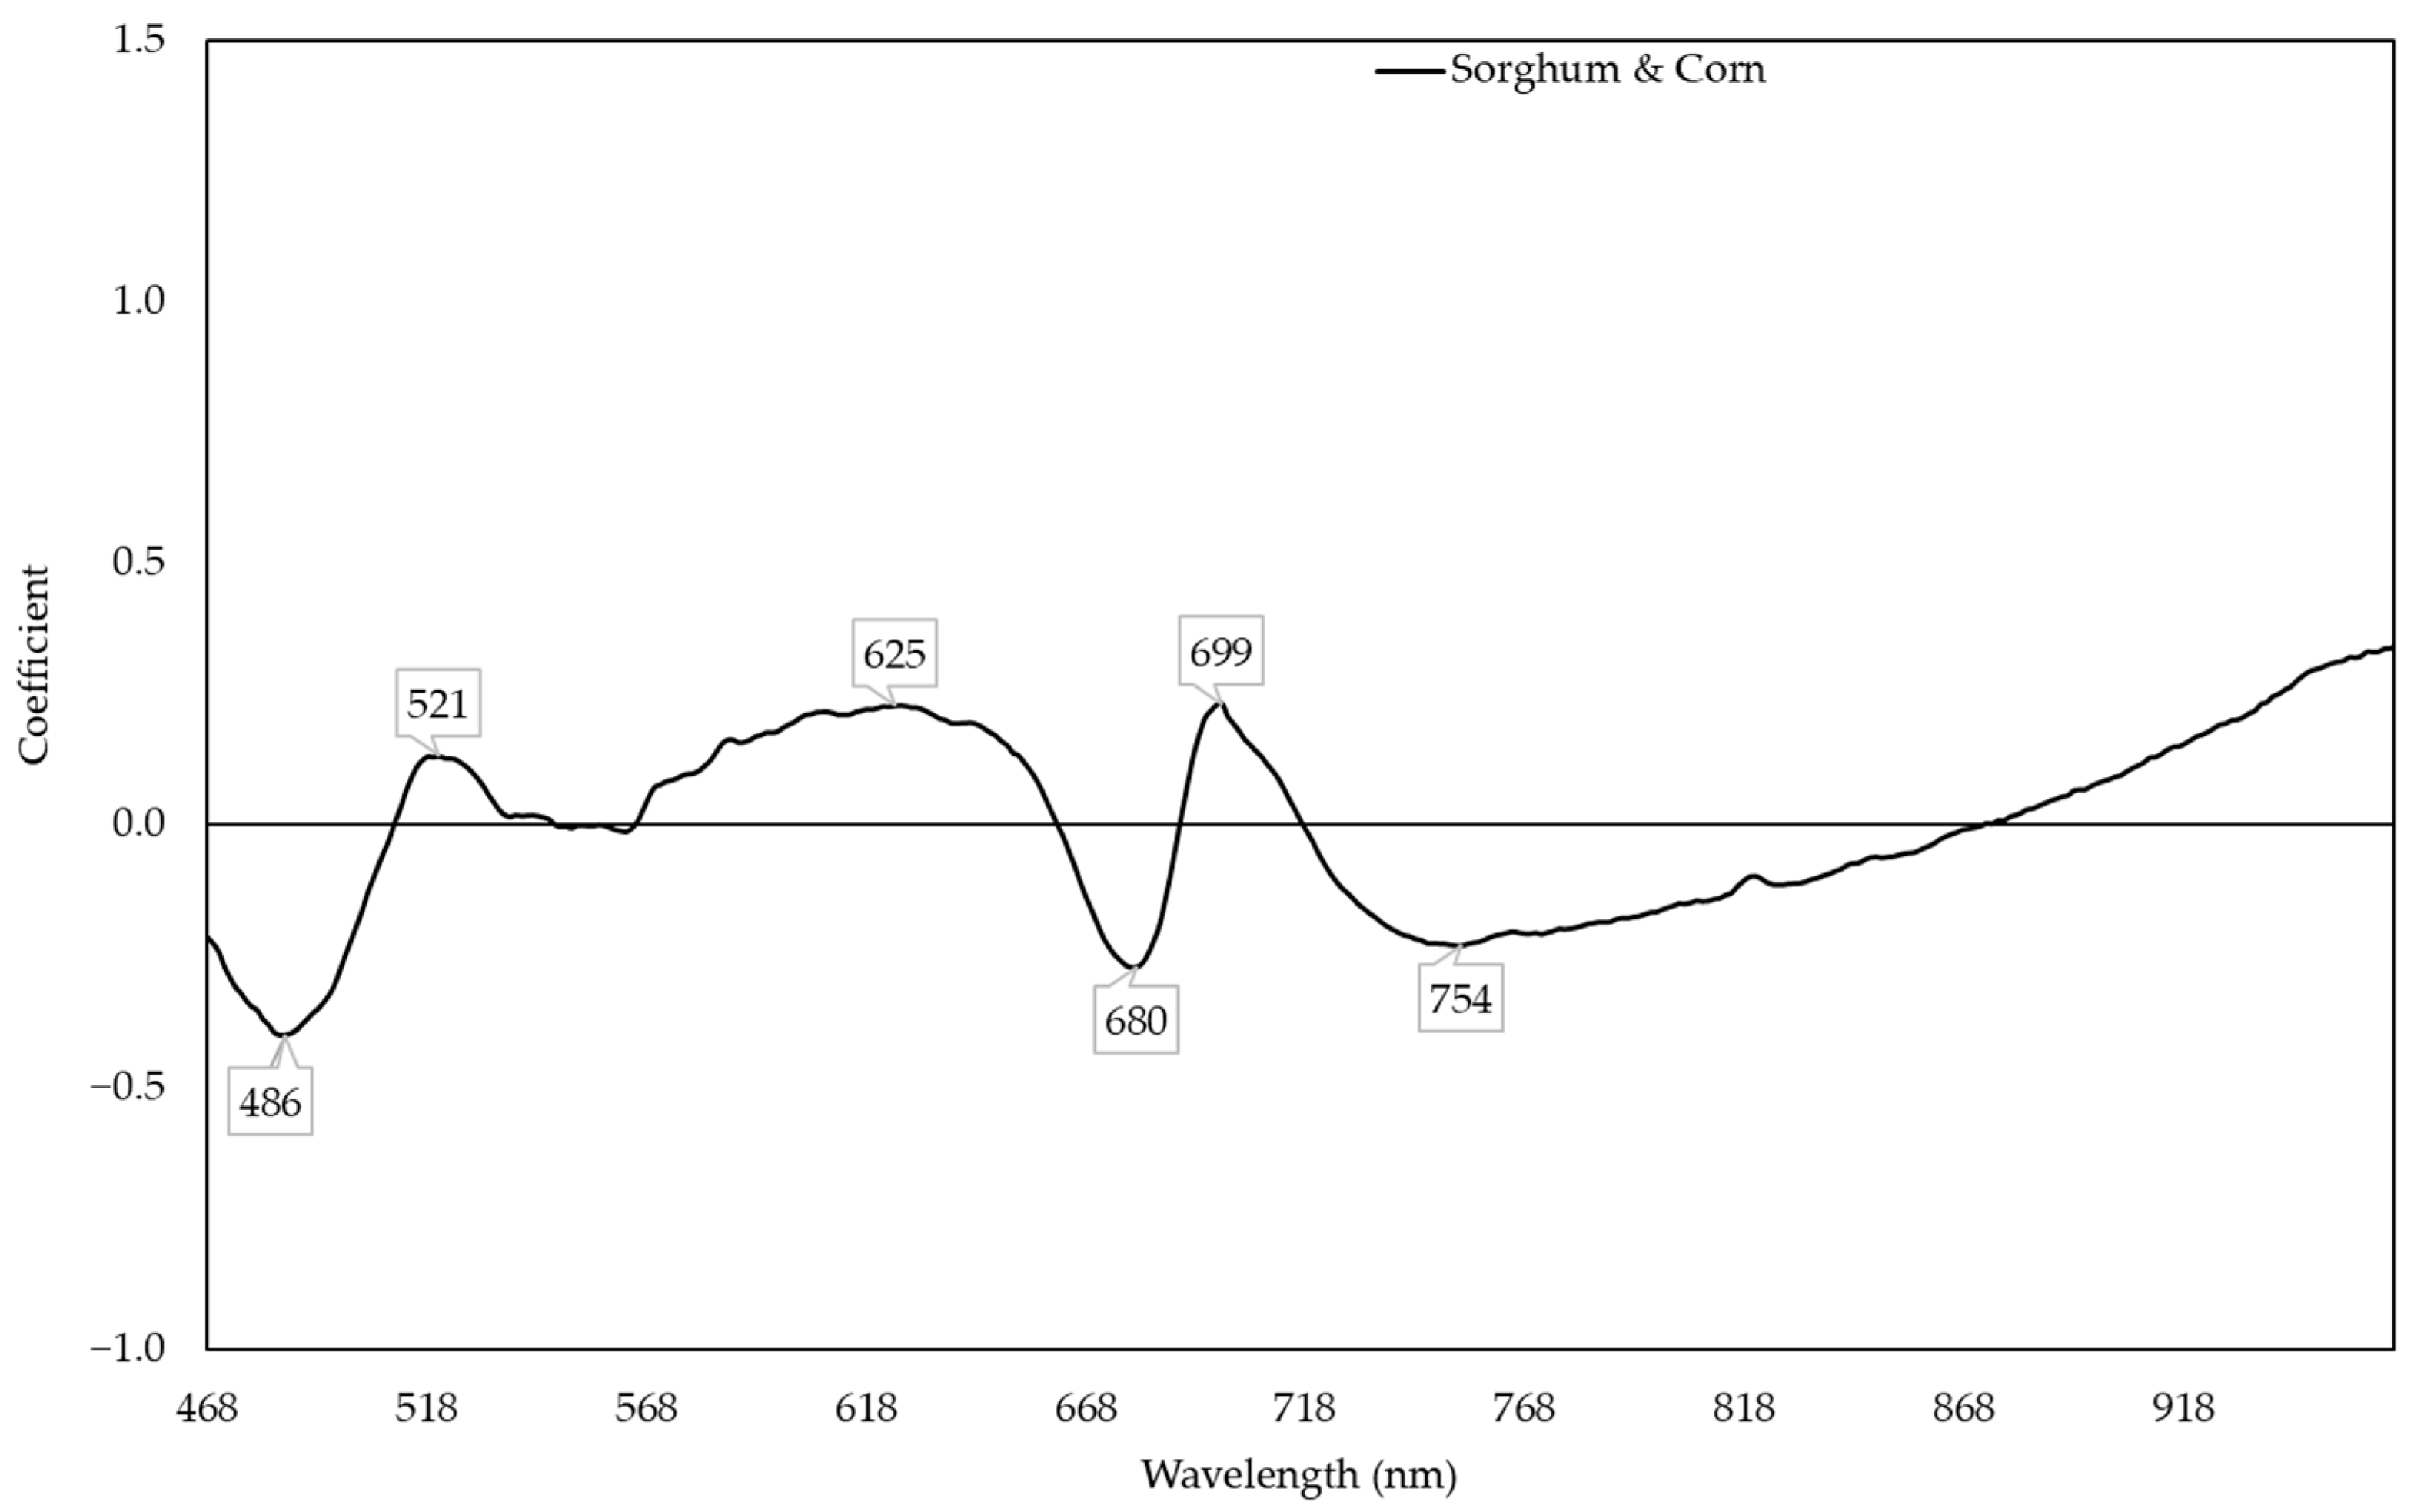
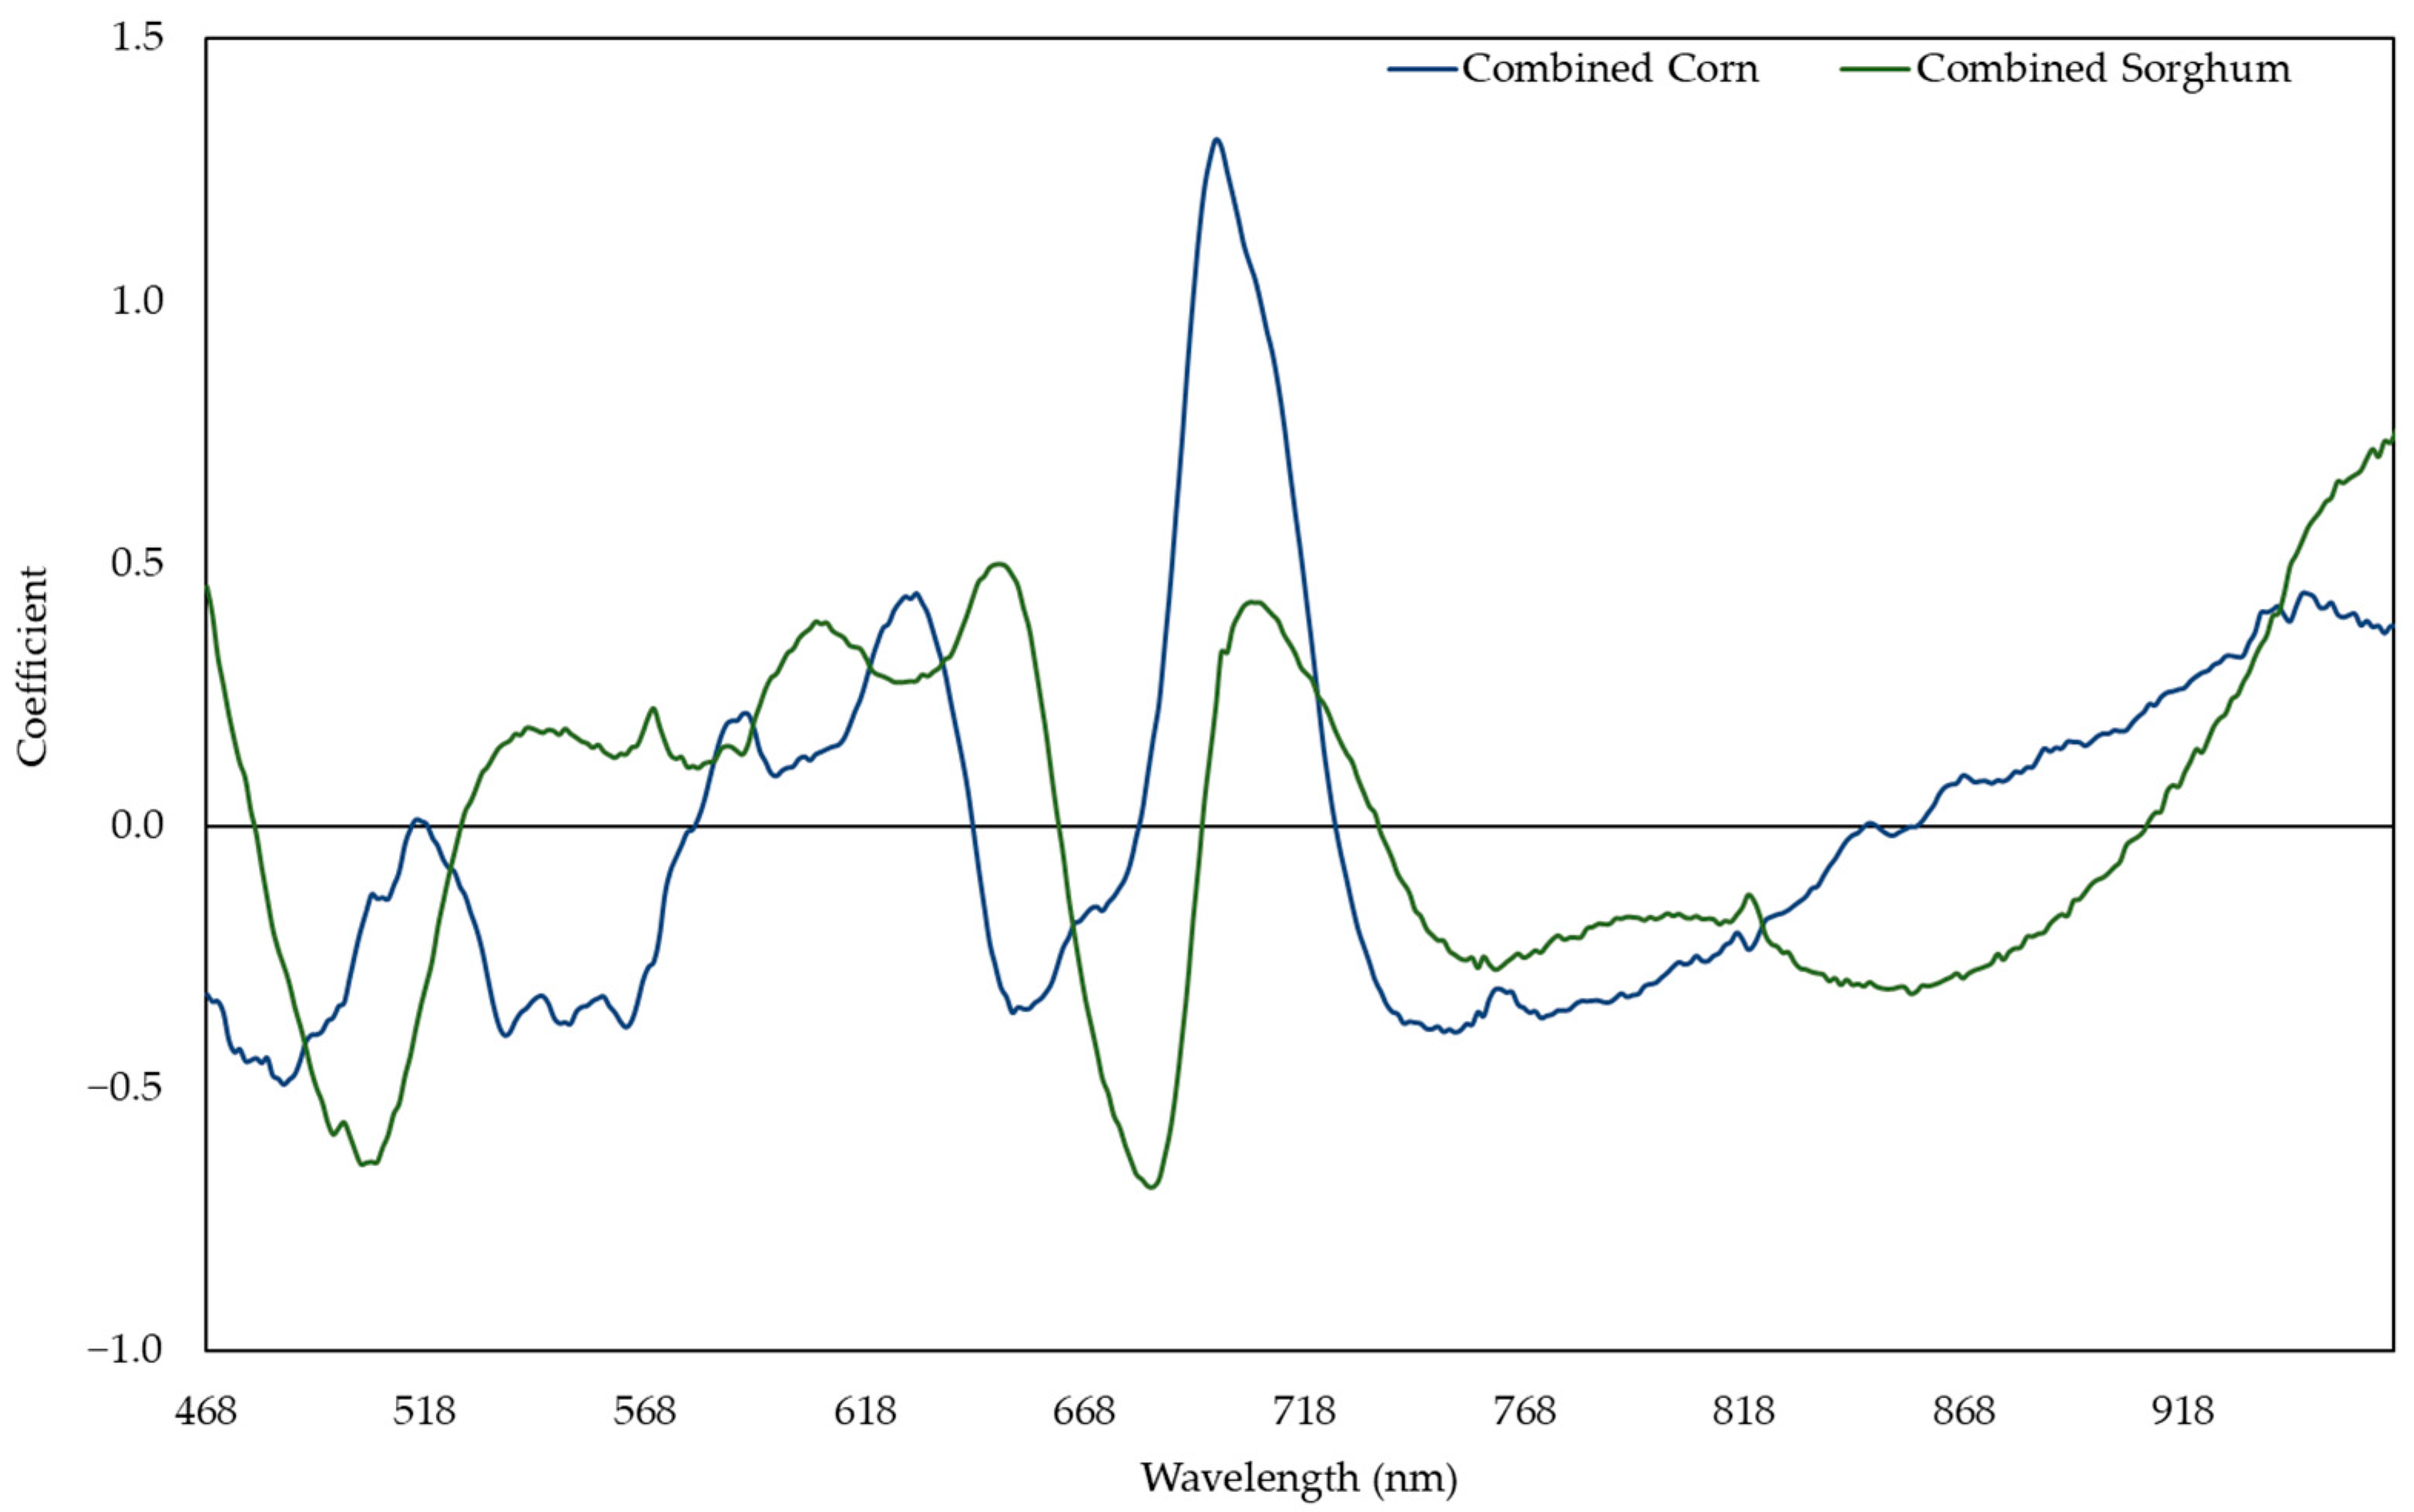
2.5. Prediction of Nitrogen Content Using Two Species Model

The sorghum and corn model performed well in predicting both sorghum (R2 ranging from 0.678 to 0.793) and corn (R2 ranging from 0.223 to 0.744) (Figure 5). The sorghum and corn model had the highest R2 to predict the NC of sorghum and corn (Figure 6). In this model, the reflectances around 486, 521, 625, 680, 699, and 754 nm were responsive to the change in NC (Figure 7). In general, the combined corn and combined sorghum models had a similar coefficient pattern to the sorghum and corn model, but the coefficients of the combined corn and combined sorghum models in part of the green region (500–600 nm) were significantly different (Figure 8).

3. Discussion

3.1. Sorghum and Corn Models for Predicting the Relative Water Content

The reflectances around 506, 535, 583, 627, 652, 694, 722, and 964 nm were responsive to changes in the RWC in the sorghum and corn model (Figure 3) and may be related to previously reported responses of pigments and photosynthetic activity to water deficit. R506 (R with subscript indicates reflectance at a certain wavelength) is associated with anthocyanin [39] and with water deficit inducing anthocyanin accumulation [13]. R535 and R694 are associated with chlorophyll and carotenoid [40,41] and with water deficit decreasing chlorophyll content while increasing the carotenoid content in corn [9,42], as well as with water deficit reducing chlorophyll content in sorghum [7,43]. R627 and R652 are associated with the chlorophyll b:a ratio [44], with the ratio decreasing in leaf tissues in response to water deficit in corn [45] and sorghum [46]. R722 is associated with the fluorescence of photosystem I [47], with chlorophyll a fluorescence increasing in response to water deficit due to a loss of photosystem I reaction centers [48]. R964 indicates a known water absorption peak [49].
The stepwise model (R2 = 0.810; Table S1) had a similar prediction accuracy compared to the PLSR model (R2 = 0.809; Figure 2), which can be a narrow-band spectral index for predicting the RWC. R506, R583, R627, and R964 were negatively correlated with RWC, while R535 and R652 were positively correlated with the RWC (Table S1). R506, R583, and R627 had positive coefficients while R535, R652, and R964 had negative coefficients in the PLSR model (Figure 3), which is consistent with R506, R583, and R627 having more negative slopes compared to R535, R652, and R964 in the stepwise model (Table S1). Moreover, R694 and R722 were dropped in the stepwise model because the coefficients of combined corn and combined sorghum models in the red edge range were incompatible (Figure 4). In fact, the coefficients of combined corn and combined sorghum models in most of NIR had opposite signs. Reflectance in NIR is related to leaf browning and necrosis [50] caused by phenolic compounds, such as p-coumaric acid and ferulic acid [51,52]. Additionally, reflectance in NIR is related to leaf structure [53,54], such as the ratio of mesophyll cell surface area exposed to intercellular air spaces per unit leaf surface area, leaf bi-coloration, and the presence of a thick leaf cuticle [55]. Further studies are needed to elucidate the differences in leaf browning, necrosis, and anatomy between corn and sorghum under water deficit.

3.2. Sorghum and Corn Models for Predicting Nitrogen Content

Models for N in sorghum and corn showed that R486, R521, R625, R680, R699, and R754 were responsive to changes in the NC (Figure 7), which is consistent with previous reports [56,57]. R699 is associated with LHCB [58], which may be related to LHCB being downregulated by nitrogen deficiency in maize [18]. R680 and R754 are associated with chlorophyll content [59,60], which is consistent with chlorophyll content in the leaf decreasing under nitrogen deficiency in maize [61], as well as in sorghum [62].
The stepwise model (R2 = 0.634; Table S1) had similar prediction accuracy compared to the PLSR model (R2 = 0.637; Figure 6), which can be a narrow-band spectral index for predicting NC. R521 and R625 were negatively correlated with NC, while R486 and R754 were positively correlated with NC (Tables S1 and S2). R521 and R625 had positive coefficients, while R486 and R754 had negative coefficients in the PLSR model (Figure 7), which is consistent with R521 and R625 having more negative slopes compared to R486 and R754 in the stepwise model (Table S1). Moreover, R680 and R699 were dropped in stepwise model because the coefficients of combined corn and combined sorghum models in the red edge range were incompatible (Figure 8). The coefficients from 518 to 568 nm of the combined corn and combined sorghum models were significantly different (Figure 8), possibly due to different profiles of anthocyanin, which possesses an absorption maximum near 540–550 nm [63]. Sorghum produces an unique anthocyanin, 3-deoxyanthocyanidin, under nitrogen deficiency, which is not found in maize [64,65]. However, whether the existence of 3-deoxyanthocyanidin changes the coefficient pattern between 518 and 568 nm in the combined sorghum model needs to be further investigated.

3.3. Similarity in Adaptation and Genetics

These studies showed that similarities in adaptation and genetic background do not necessarily ensure that models developed for one individual will perform well for other genotypes. B73xMo17, G80xPHP02, and BCC03xPHP02 are susceptible to water deficit (Table 1), but the R2 of the single genotype models ranged from 0.115 (G80xPHP02 model to predict BCC03xPHP02) to 0.824 (BCC03xPHP02 model to predict BCC03xPHP02) (Figure 1). These differences may indicate that the mechanisms for adaptation to water deficit vary among genotypes [66,67]. Genetic relatedness also does not ensure that models developed for one individual will perform well for other genotypes with a similar genetic background. In the PHP02 half-sibs, the R2 of the single genotype models varied significantly, ranging from 0.115 (G80xPHP02 model to predict BCC03xPHP02) to 0.923 (PHJ33xPHP02 model to predict PHJ33xPHP02) (Figure 1). This was surprising because each of these hybrids has one parent in common. This is similar to the finding that the transferability for predicting crop photosynthetic capacity does not necessarily depend on phylogenetic similarity [68].

3.4. Asymmetric Heatmap of Coefficients of Determination of the Models

Single genotype models may predict the responses of another genotype but not necessarily vice versa (Figure 1; Figure 5), and may depend on the intersection of wavelengths with higher VIP scores in the two models. For example, the Tx623 model predicted the RWC of B35 well (R2 = 0.833), and the B35 model predicted the RWC of Tx623 well (R2 = 0.848). This can be explained by the VIP scores over the wavelengths in the models predicting the RWC, where the responses of Tx623 and B35 were similar (Figure S1), suggesting that they have similar responses of reflectance to water deficit. On the other hand, the CML550xPHP02 model performed well predicting the RWC of Tx623 (R2 = 0.793), but the Tx623 model performed poorly predicting the RWC of CML550xPHP02 (R2 = 0.066). This is consistent with the observation that the CML550xPHP02 model contains more informative wavelengths with higher VIP scores compared to the Tx623 model (Figure S2), suggesting that CML550xPHP02 contains most of Tx623’s responsive reflectance to water deficit, but not vice versa.

3.5. Poor Performance in Predicting Nitrogen Content of G80xPHP02

The NC of G80xPHP02 was not predicted well using any model, and the G80xPHP02-based model cannot be used for predicting the NC of any genotypes, including itself (Figure 5). One of the reasons may be that reflectance changes are not correlated with the NC for G80xPHP02. The NC is the sum of all nitrogen compounds in plant tissue, so it is possible that G80xPHP02 has unique nitrogen-containing metabolites, whose reflectance cannot be captured by hyperspectral camera in visible-NIR range (350–1000 nm). Alternatively, the minor changes in metabolites only happen in a portion of the leaf, so the average reflectance of the whole shoot may not represent the phenotypic changes of G80xPHP02 in response to nitrogen deficiency. Follow-up studies on short-wave infrared range (1000–2500 nm) and more detailed image processing are needed.

3.6. Non-Linear Models for Predicting the Relative Water Content and Nitrogen Content

The RWC and NC were also modeled using other machine learning algorithms including support vector machine regression (SVMR) and XGBoost regression (XGBR). SVMR exhibited the highest R2 cross-validated (CV) value, followed by XGBR and PLSR, which is consistent with PLSR having the highest root mean square error (RMSE), followed by XGBR and SVMR. On the other hand, SVMR had the highest absolute value of bias CV, followed by XGBR and PLSR. Both accuracy and bias should be considered for statistical model selection [69], which consequently depends on the application of the model. If the accuracy is important for application, the SVMR with the highest R2 CV and the lowest RMSE CV performs the best compared to XGBR and PLSR. However, if bias plays a role in application, the PLSR with the lowest absolute value of bias performs the best compared to XGBR and SVMR. Moreover, if biological meaning is essential for the application of the models, the PLSR is generally suggested, since the interpretability of non-linear models can be challenging [70].

4. Materials and Methods

4.1. Plant Material and Growing Condition

Three genotypes of sorghum (Tx623, B35, and Tx7000) and six genotypes of corn (P1105AM, B73xMo17, G80xPHP02, BCC03xPHP02, PHJ33xPHP02, and CML550xPHP02) were selected for their diverse adaptions to water and nitrogen stresses (Table 1). Phenotyping trials for sorghum were conducted in 2018 using a randomized complete block design with nine blocks, with each combination of three genotypes and four treatments represented in each block (Table S3). The corn phenotyping trails were conducted in 2017 using a randomized complete block design with 12 blocks, with each combination of six genotypes and four treatments represented in each block of the design (Table S3). In each trial, one plant was grown in a 5.7 L pot filled with the mixture of one-third topsoil, one-third sand, and one-third Turface Athletics™ MVP® (Profile Products LLC, Buffalo Grove, IL, USA) with low water holding capacity and nutrient content but high cation exchange capacity. To develop models for plants with various water and nitrogen availability, treatments were factorial, including two levels of water conditions (well-watered or drought) and two levels of nitrogen conditions (nitrogen sufficient or deficient) (Table S3). The photoperiod was regulated using overhead high-pressure sodium lights from 6 am to 9 pm. Day and night temperatures were set at 24–32 °C and 24–27 °C, respectively.
From vegetative growth stage 4 until vegetative growth stage 6, all plants received 600 mL of water each day from the automated conveyor belt system. After vegetative growth stage 6, the plants assigned to receive well-watered and drought treatment were watered with 600 mL and 150 mL of water each day for a week, respectively. A volume of 12 mL of 1 M potassium phosphate monobasic solution, 6 mL of 0.33 M magnesium sulfate anhydrous solution, 8 mL of 0.017 M ferrous sulfate heptahydrate solution, 5 mL of 1 M calcium nitrate solution, and 2 mL of micronutrient stock solution (containing 50 mM of potassium chloride, 25 mM of boric acid, 2 mM of manganese sulfate tetrahydrate, 2 mM of zinc sulfate, 0.5 mM of cupric sulfate, and 0.5 mM of molybdic acid) was added to 1 L of deionized water as basic Hoagland’s solution. Volumes of 5 and 40 mL of 1 M ammonium nitrate solution were added into 1 L of basic Hoagland’s solution as the final solutions for the nitrogen deficient and sufficient treatments, respectively. Then, 300 mL of the final solutions were applied to each plant once a week over the course of the experiment. Phenotyping was conducted when plants reached V9.

4.2. Phenotyping Facility

An automated, high-throughput imaging system installed in a greenhouse at Purdue University was used in these studies [71]. The automated system consisted of a conveyor belt system that accommodated up to 108 pots in carriers with radio-frequency identification tags for high-throughput imaging. The pots were periodically relocated in the greenhouse by the conveyer to avoid ununiform plant growth caused by microclimates in the room [72]. The system included a hyperspectral imaging tower that accommodated imaging plants up to 1.5 meters tall from the top view and side view with MSV 500 hyperspectral cameras (Middleton Spectral Vision, Middleton, WI, USA) using push broom style scanning. The camera scanned from 400 to 1000 nm with an optical resolution down to 1.2 nm. Inside the imaging tower, there were eight studio halogen lamps to provide light for imaging. The towers had doors that automatically opened for moving plants and closed for phenotyping the plants, which took approximately 1 min per plant. The plants were automatically rotated on the imaging platform, so the widest plane of the plant was facing the camera. The top-view hyperspectral images were segmented into a black and white image to distinguish plant material from surrounding material based on the red edge (680–730 nm), which allowed for the calculation of the average reflectance of the top-view plant over wavelengths.

4.3. Ground Reference Data Collection

Further, 2.5 cm × 5.0 cm of top collar leaf was harvested for RWC measurement following the protocol below [73]. The fresh weight (FW) was determined immediately after harvesting. Then, the samples were submerged in deionized water overnight to obtain the turgid weight (TW). Finally, the dry weight (DW) was measured after drying in a 60 °C dryer overnight. All weights were measured using the AJ100L analytical balance (Mettler Toledo, Columbus, OH, USA) with a readability of 0.1 mg. RWC was determined using the following equation: RWC (%) = [(FW − DW)/(TW − DW)] ∗ 100%.
The NC of leaf samples was analyzed by a Thermo Scientific FlashEA 1112 Nitrogen and Carbon Analyzer for Soils, Sediments, and Filters (CE Elantech, Lakewood, NJ, USA) based on the flash dynamic combustion method described below. First, the gas mixture entered reactor one, a quart oxidation of the component, at 950 °C. Next, nitrogen oxides were reduced to elemental nitrogen in the copper-made reactor two at 840 °C. Finally, the sample was filtered through an adsorption filter, and the percentage of nitrogen in dry matter was determined by a gas chromatography column with thermal conductivity detector.

4.4. Statistical Analysis

The explanatory variables were reflectance from 468 to 966 nm with an interval of 1.34 nm, which were preprocessed through log (1/X) conversion and multiplicative signal correction with the mean and mean center. The response variables were RWC or NC, which were preprocessed through autoscaling. Partial least square regression (PLSR), support vector machine regression (SVMR), and XGBoost regression (XGBR) models were built and cross-validated (CV) with the leave-one-out method using PLS Toolbox 8.2.1 [74,75] in MATLAB R2018b (MathWorks, Natick, MA, USA). The number of latent variables used in models for the RWC and NC were six and three, respectively. The R2 and RMSE of models were calculated using the predicted and observed values (Equations (1) and (2)). The VIP scores and coefficients in models were also reported, and optimal wavelengths were selected based on the coefficient [21]. For further biological interpretation, stepwise regression models with optimal wavelengths were built using the mixed direction selection method with 0.25 as the p-value threshold for both entry and removal of dependent variables in JMP Pro 15 (SAS Institute, Cary, NC, USA).
R 2 = 1 ( y i y ^ i ) 2 ( y i y ¯ ) 2
RMSE = 1 N × ( y i y ^ i ) 2

5. Conclusions

Hyperspectral imaging is a non-destructive, high-throughput, and inexpensive method compared to traditional methods of quantifying plant water and nutrient status. This study demonstrated that multi-species models could be developed to predict water and nitrogen status of plants within and across these crop species with acceptable accuracy for agricultural uses. These models exhibit a broader application compared to previous studies using only few genotypes in one species.

Supplementary Materials

The following are available online at https://www.mdpi.com/article/10.3390/plants11050676/s1, Table S1: Stepwise regression for reflectance at optimal wavelength and trait, Table S2: Evaluation of models built with different machine learning algorithms, Table S3. Number of samples in each treatment, Figure S1: Variable importance in projection (VIP) scores in models predicting the relative water content with the responses of Tx623 and B35, Figure S2: Variable importance in projection (VIP) scores in models predicting the relative water content with the responses of Tx623 and CML550xPHP02.

Author Contributions

Conceptualization, V.L., M.-Y.L. and M.T.; methodology, V.L., D.M., H.M., M.-Y.L., M.T. and J.J.; software, M.-Y.L. and D.M.; validation, M.-Y.L.; formal analysis, M.-Y.L.; investigation, M.-Y.L.; resources, M.T.; data curation, M.-Y.L.; writing—original draft preparation, V.L.; writing—review and editing, M.-Y.L.; visualization, M.-Y.L.; supervision, M.T.; project administration, M.T.; funding acquisition, M.T. All authors have read and agreed to the published version of the manuscript.

Funding

This work was partially supported by a grant (Grant Number 41000314) from the United Sorghum Checkoff, “Developing Prediction Models for Water and Nitrogen Status in Sorghum”.

Institutional Review Board Statement

Not applicable.

Informed Consent Statement

Not applicable.

Data Availability Statement

Data and meta-data are available at The Purdue University Research Repository (PURR), https://purr.purdue.edu/publications/3958/1 (accessed on 30 January 2022).

Acknowledgments

We are grateful to Sylvie Brouder for help analyzing the nitrogen content and Michael Mickelbart for help analyzing the relative water content.

Conflicts of Interest

The authors declare no conflict of interest.

References

  1. Minhas, P.S.; Rane, J.; Pasala, R.K. Abiotic Stresses in Agriculture: An Overview. In Abiotic Stress Management for Resilient Agriculture; Minhas, P.S., Rane, J., Pasala, R.K., Eds.; Springer: Singapore, 2017; pp. 3–8. ISBN 978-981-10-5744-1. [Google Scholar]
  2. Roberts, D.P.; Mattoo, A.K. Sustainable Agriculture—Enhancing Environmental Benefits, Food Nutritional Quality and Building Crop Resilience to Abiotic and Biotic Stresses. Agriculture 2018, 8, 8. [Google Scholar] [CrossRef] [Green Version]
  3. Großkinsky, D.K.; Svensgaard, J.; Christensen, S.; Roitsch, T. Plant Phenomics and the Need for Physiological Phenotyping across Scales to Narrow the Genotype-to-Phenotype Knowledge Gap. J. Exp. Bot. 2015, 66, 5429–5440. [Google Scholar] [CrossRef] [PubMed] [Green Version]
  4. Huang, X.; Han, B. Natural Variations and Genome-Wide Association Studies in Crop Plants. Annu. Rev. Plant Biol. 2014, 65, 531–551. [Google Scholar] [CrossRef]
  5. Yang, W.; Feng, H.; Zhang, X.; Zhang, J.; Doonan, J.H.; Batchelor, W.D.; Xiong, L.; Yan, J. Crop Phenomics and High-Throughput Phenotyping: Past Decades, Current Challenges, and Future Perspectives. Mol. Plant 2020, 13, 187–214. [Google Scholar] [CrossRef] [Green Version]
  6. Jaleel, C.A.; Manivannan, P.; Wahid, A.; Farooq, M.; Al-Juburi, H.J.; Somasundaram, R.; Panneerselvam, R. Drought Stress in Plants: A Review on Morphological Characteristics and Pigments Composition. Int. J. Agric. Biol. 2009, 11, 100–105. [Google Scholar]
  7. Younis, M.E.; El-Shahaby, O.A.; Abo-Hamed, S.A.; Ibrahim, A.H. Effects of Water Stress on Growth, Pigments and 14CO2 Assimilation in Three Sorghum Cultivars. J. Agron. Crop Sci. 2000, 185, 73–82. [Google Scholar] [CrossRef]
  8. Nyachiro, J.M.; Briggs, K.G.; Hoddinott, J.; Johnson-Flanagan, A.M. Chlorophyll Content, Chlorophyll Fluorescence and Water Deficit in Spring Wheat. Cereal Res. Commun. 2001, 29, 135–142. [Google Scholar] [CrossRef]
  9. Mohammadkhani, N.; Heidari, R. Effects of Water Stress on Respiration, Photosynthetic Pigments and Water Content in Two Maize Cultivars. Pak. J. Biol. Sci. 2007, 10, 4022–4028. [Google Scholar] [CrossRef] [PubMed] [Green Version]
  10. Alberte, R.S.; Thornber, J.P.; Fiscus, E.L. Water Stress Effects on the Content and Organization of Chlorophyll in Mesophyll and Bundle Sheath Chloroplasts of Maize. Plant Physiol. 1977, 59, 351–353. [Google Scholar] [CrossRef] [Green Version]
  11. Mueller-moule, P.; Li, X.; Niyogi, K. Non-Photochemical Quenching. A Response to Excess Light Energy. Plant Physiol. 2001, 125, 1558–1566. [Google Scholar] [CrossRef] [Green Version]
  12. Chool Boo, Y.; Jung, J. Water Deficit—Induced Oxidative Stress and Antioxidative Defenses in Rice Plants. J. Plant Physiol. 1999, 155, 255–261. [Google Scholar] [CrossRef]
  13. Spyropoulos, C.G.; Mavrommatis, M. Effect of Water Stress on Pigment Formation in Quercus Species. J. Exp. Bot. 1978, 29, 473–477. [Google Scholar] [CrossRef]
  14. Taiz, L.; Zeiger, E.; Møller, I.M.; Murphy, A. Plant Physiology and Development, 6th ed.; Oxford University Press: Oxford, NY, USA, 2018; ISBN 978-1-60535-745-4. [Google Scholar]
  15. Chatterjee, A.; Kundu, S. Revisiting the Chlorophyll Biosynthesis Pathway Using Genome Scale Metabolic Model of Oryza Sativa Japonica. Sci. Rep. 2015, 5, 14975. [Google Scholar] [CrossRef] [Green Version]
  16. Shangguan, Z.; Shao, M.; Dyckmans, J. Effects of Nitrogen Nutrition and Water Deficit on Net Photosynthetic Rate and Chlorophyll Fluorescence in Winter Wheat. J. Plant Physiol. 2000, 156, 46–51. [Google Scholar] [CrossRef]
  17. Pietrzykowska, M.; Suorsa, M.; Semchonok, D.A.; Tikkanen, M.; Boekema, E.J.; Aro, E.-M.; Jansson, S. The Light-Harvesting Chlorophyll a/b Binding Proteins Lhcb1 and Lhcb2 Play Complementary Roles during State Transitions in Arabidopsis. Plant Cell 2014, 26, 3646–3660. [Google Scholar] [CrossRef] [Green Version]
  18. Jin, X.; Li, W.; Hu, D.; Shi, X.; Zhang, X.; Zhang, F.; Fu, Z.; Ding, D.; Liu, Z.; Tang, J. Biological Responses and Proteomic Changes in Maize Seedlings under Nitrogen Deficiency. Plant Mol. Biol. Rep. 2015, 33, 490–504. [Google Scholar] [CrossRef]
  19. Han, Y.; Vimolmangkang, S.; Soria-Guerra, R.E.; Rosales-Mendoza, S.; Zheng, D.; Lygin, A.V.; Korban, S.S. Ectopic Expression of Apple F3′H Genes Contributes to Anthocyanin Accumulation in the Arabidopsis Tt7 Mutant Grown Under Nitrogen Stress. Plant Physiol. 2010, 153, 806–820. [Google Scholar] [CrossRef] [Green Version]
  20. Tewari, R.K.; Kumar, P.; Sharma, P.N. Oxidative Stress and Antioxidant Responses in Young Leaves of Mulberry Plants Grown Under Nitrogen, Phosphorus or Potassium Deficiency. J. Integr. Plant Biol. 2007, 49, 313–322. [Google Scholar] [CrossRef]
  21. Krishna, G.; Sahoo, R.N.; Singh, P.; Bajpai, V.; Patra, H.; Kumar, S.; Dandapani, R.; Gupta, V.K.; Viswanathan, C.; Ahmad, T.; et al. Comparison of Various Modelling Approaches for Water Deficit Stress Monitoring in Rice Crop through Hyperspectral Remote Sensing. Agric. Water Manag. 2019, 213, 231–244. [Google Scholar] [CrossRef]
  22. Jin, X.; Xu, X.; Song, X.; Li, Z.; Wang, J.; Guo, W. Estimation of Leaf Water Content in Winter Wheat Using Grey Relational Analysis–Partial Least Squares Modeling with Hyperspectral Data. Agron. J. 2013, 105, 1385. [Google Scholar] [CrossRef]
  23. Ge, Y.; Bai, G.; Stoerger, V.; Schnable, J.C. Temporal Dynamics of Maize Plant Growth, Water Use, and Leaf Water Content Using Automated High Throughput RGB and Hyperspectral Imaging. Comput. Electron. Agric. 2016, 127, 625–632. [Google Scholar] [CrossRef] [Green Version]
  24. Pôças, I.; Gonçalves, J.; Costa, P.M.; Gonçalves, I.; Pereira, L.S.; Cunha, M. Hyperspectral-Based Predictive Modelling of Grapevine Water Status in the Portuguese Douro Wine Region. Int. J. Appl. Earth Obs. Geoinf. 2017, 58, 177–190. [Google Scholar] [CrossRef]
  25. Neinavaz, E.; Skidmore, A.K.; Darvishzadeh, R.; Groen, T.A. Retrieving Vegetation Canopy Water Content from Hyperspectral Thermal Measurements. Agric. For. Meteorol. 2017, 247, 365–375. [Google Scholar] [CrossRef]
  26. Li, F.; Mistele, B.; Hu, Y.; Chen, X.; Schmidhalter, U. Reflectance Estimation of Canopy Nitrogen Content in Winter Wheat Using Optimised Hyperspectral Spectral Indices and Partial Least Squares Regression. Eur. J. Agron. 2014, 52, 198–209. [Google Scholar] [CrossRef]
  27. Yu, X.; Lu, H.; Liu, Q. Deep-Learning-Based Regression Model and Hyperspectral Imaging for Rapid Detection of Nitrogen Concentration in Oilseed Rape (Brassica Napus L.) Leaf. Chemom. Intell. Lab. Syst. 2018, 172, 188–193. [Google Scholar] [CrossRef]
  28. Abdel-Rahman, E.M.; Ahmed, F.B.; Ismail, R. Random Forest Regression and Spectral Band Selection for Estimating Sugarcane Leaf Nitrogen Concentration Using EO-1 Hyperion Hyperspectral Data. Int. J. Remote Sens. 2013, 34, 712–728. [Google Scholar] [CrossRef]
  29. Paterson, A.H.; Bowers, J.E.; Bruggmann, R.; Dubchak, I.; Grimwood, J.; Gundlach, H.; Haberer, G.; Hellsten, U.; Mitros, T.; Poliakov, A.; et al. The Sorghum Bicolor Genome and the Diversification of Grasses. Nature 2009, 457, 551–556. [Google Scholar] [CrossRef] [Green Version]
  30. Tuinstra, M.R.; Grote, E.M.; Goldsbrough, P.B.; Ejeta, G. Identification of Quantitative Trait Loci Associated with Pre-Flowering Drought Tolerance in Sorghum. Crop Sci. 1996, 36, 1337–1344. [Google Scholar] [CrossRef]
  31. Kebede, H.; Subudhi, P.K.; Rosenow, D.T.; Nguyen, H.T. Quantitative Trait Loci Influencing Drought Tolerance in Grain Sorghum (Sorghum bicolor L. Moench). Appl. Genet. 2001, 103, 266–276. [Google Scholar] [CrossRef]
  32. Schoper, J.B.; Lambert, R.J.; Vasilas, B.L. Maize Pollen Viability and Ear Receptivity under Water and High Temperature Stress. Crop Sci. 1986, 26, 1029–1033. [Google Scholar] [CrossRef]
  33. Oluwaranti, A.; Edema, R.; Ajayi, S.A.; Atkinson, C.J.; Asea, G.; Makumbi, D.; Kwemoi, D.B. Characterization of Elite Maize Inbred Lines for Drought Tolerance Using Simple Sequence Repeats Markers. Int. J. Agric. Environ. Res. 2018, 4, 552–566. [Google Scholar]
  34. Mahama, G.Y.; Prasad, P.V.V.; Mengel, D.B.; Tesso, T.T. Influence of Nitrogen Fertilizer on Growth and Yield of Grain Sorghum Hybrids and Inbred Lines. Agron. J. 2014, 106, 1623–1630. [Google Scholar] [CrossRef] [Green Version]
  35. Trachsel, S.; Leyva, M.; Lopez, M.; Suarez, E.A.; Mendoza, A.; Montiel, N.G.; Macias, M.S.; Burgueno, J.; San Vicente, F. Identification of Tropical Maize Germplasm with Tolerance to Drought, Nitrogen Deficiency, and Combined Heat and Drought Stresses. Crop Sci. 2016, 56, 3031–3045. [Google Scholar] [CrossRef]
  36. Tsai, C.Y.; Dweikat, I.; Huber, D.M.; Warren, H.L. Interrelationship of Nitrogen Nutrition with Maize (Zea Mays) Grain Yield, Nitrogen Use Efficiency and Grain Quality. J. Sci. Food Agric. 1992, 58, 1–8. [Google Scholar] [CrossRef]
  37. Maranville, J.W.; Madhavan, S. Physiological Adaptations for Nitrogen Use Efficiency in Sorghum. In Food Security in Nutrient-Stressed Environments: Exploiting Plants’ Genetic Capabilities; Adu-Gyamfi, J.J., Ed.; Developments in Plant and Soil Sciences; Springer: Dordrecht, The Netherlands, 2002; pp. 81–90. ISBN 978-94-017-1570-6. [Google Scholar]
  38. Mahama, G.Y. Variation among Grain Sorghum Genotypes in Response to Nitrogen Fertilizer. Master’s Thesis, Kansas State University, Manhattan, KS, USA, 2012. [Google Scholar]
  39. Asen, S.; Stewart, R.N.; Norris, K.H. Co-Pigmentation of Anthocyanins in Plant Tissues and Its Effect on Color. Phytochemistry 1972, 11, 1139–1144. [Google Scholar] [CrossRef]
  40. Lichtenthaler, H.K.; Miehé, J.A. Fluorescence Imaging as a Diagnostic Tool for Plant Stress. Trends Plant Sci. 1997, 2, 316–320. [Google Scholar] [CrossRef]
  41. Garbulsky, M.F.; Peñuelas, J.; Gamon, J.; Inoue, Y.; Filella, I. The Photochemical Reflectance Index (PRI) and the Remote Sensing of Leaf, Canopy and Ecosystem Radiation Use Efficiencies: A Review and Meta-Analysis. Remote Sens. Environ. 2011, 115, 281–297. [Google Scholar] [CrossRef]
  42. Khayatnezhad, M.; Gholamin, R. The Effect of Drought Stress on Leaf Chlorophyll Content and Stress Resistance in Maize Cultivars (Zea Mays). AJMR 2012, 6, 2844–2848. [Google Scholar] [CrossRef]
  43. Jagtap, V.; Bhargava, S.; Streb, P.; Feierabend, J. Comparative Effect of Water, Heat and Light Stresses on Photosynthetic Reactions in Sorghum bicolor (L.) Moench. J. Exp. Bot. 1998, 49, 1715–1721. [Google Scholar] [CrossRef] [Green Version]
  44. Siebke, K.; Ball, M.C. Non-Destructive Measurement of Chlorophyll B:A Ratios and Identification of Photosynthetic Pathways in Grasses by Reflectance Spectroscopy. Funct. Plant Biol. 2009, 36, 857–866. [Google Scholar] [CrossRef]
  45. Kebede, H.; Fisher, D.K.; Young, L.D. Determination of Moisture Deficit and Heat Stress Tolerance in Corn Using Physiological Measurements and a Low-Cost Microcontroller-Based Monitoring System. J. Agron. Crop Sci. 2012, 198, 118–129. [Google Scholar] [CrossRef]
  46. Ogbaga, C.C.; Stepien, P.; Johnson, G.N. Sorghum (Sorghum Bicolor) Varieties Adopt Strongly Contrasting Strategies in Response to Drought. Physiol. Plant. 2014, 152, 389–401. [Google Scholar] [CrossRef] [PubMed]
  47. Li, Y.; Zhang, J.; Xie, J.; Zhao, J.; Jiang, L. Temperature-Induced Decoupling of Phycobilisomes from Reaction Centers. Biochim. Biophys. Acta (BBA) Bioenerg. 2001, 1504, 229–234. [Google Scholar] [CrossRef] [Green Version]
  48. Oukarroum, A.; Schansker, G.; Strasser, R.J. Drought Stress Effects on Photosystem I Content and Photosystem II Thermotolerance Analyzed Using Chl a Fluorescence Kinetics in Barley Varieties Differing in Their Drought Tolerance. Physiol. Plant. 2009, 137, 188–199. [Google Scholar] [CrossRef] [PubMed]
  49. Peñuelas, J.; Gamon, J.A.; Fredeen, A.L.; Merino, J.; Field, C.B. Reflectance Indices Associated with Physiological Changes in Nitrogen- and Water-Limited Sunflower Leaves. Remote Sens. Environ. 1994, 48, 135–146. [Google Scholar] [CrossRef]
  50. Merzlyak, M.N.; Chivkunova, O.B.; Melø, T.B.; Naqvi, K.R. Does a Leaf Absorb Radiation in the near Infrared (780–900 Nm) Region? A New Approach to Quantifying Optical Reflection, Absorption and Transmission of Leaves. Photosynth. Res. 2002, 72, 263–270. [Google Scholar] [CrossRef] [PubMed]
  51. Chishaki, N.; Horiguchi, T. Responses of Secondary Metabolism in Plants to Nutrient Deficiency. In Plant Nutrition for Sustainable Food Production and Environment: Proceedings of the XIII International Plant Nutrition Colloquium, 13–19 September 1997, Tokyo, Japan; Ando, T., Fujita, K., Mae, T., Matsumoto, H., Mori, S., Sekiya, J., Eds.; Developments in Plant and Soil Sciences; Springer: Dordrecht, The Netherlands, 1997; pp. 341–345. ISBN 978-94-009-0047-9. [Google Scholar]
  52. Ivanova, D.; Deneva, V.; Zheleva-Dimitrova, D.; Balabanova-Bozushka, V.; Nedeltcheva, D.; Gevrenova, R.; Antonov, L. Quantitative Characterization of Arnicae Flos by RP-HPLC-UV and NIR Spectroscopy. Foods 2018, 8, 9. [Google Scholar] [CrossRef] [Green Version]
  53. Sinclair, T.R.; Schreiber, M.M.; Hoffer, R.M. Diffuse Reflectance Hypothesis for the Pathway of Solar Radiation through Leaves. Agron. J. 1973, 65, 276–283. [Google Scholar] [CrossRef]
  54. Peñuelas, J.; Filella, I. Visible and Near-Infrared Reflectance Techniques for Diagnosing Plant Physiological Status. Trends Plant Sci. 1998, 3, 151–156. [Google Scholar] [CrossRef]
  55. Slaton, M.R.; Hunt, E.R.; Smith, W.K. Estimating Near-Infrared Leaf Reflectance from Leaf Structural Characteristics. Am. J. Bot. 2001, 88, 278–284. [Google Scholar] [CrossRef]
  56. Zhao, D.; Reddy, K.R.; Kakani, V.G.; Read, J.J.; Koti, S. Selection of Optimum Reflectance Ratios for Estimating Leaf Nitrogen and Chlorophyll Concentrations of Field-Grown Cotton. Agron. J. 2005, 97, 89–98. [Google Scholar] [CrossRef] [Green Version]
  57. Bajwa, S.G.; Mishra, A.R.; Norman, R.J. Canopy Reflectance Response to Plant Nitrogen Accumulation in Rice. Precis. Agric. 2010, 11, 488–506. [Google Scholar] [CrossRef]
  58. Yan, X.; Shi, W.; Zhao, W.; Luo, N. Estimation of Protein Content in Plant Leaves Using Spectral Reflectance: A Case Study in Euonymus Japonica. Anal. Lett. 2014, 47, 517–530. [Google Scholar] [CrossRef]
  59. Thomas, J.R.; Oerther, G.F. Estimating Nitrogen Content of Sweet Pepper Leaves by Reflectance Measurements. Agron. J. 1972, 64, 11–13. [Google Scholar] [CrossRef]
  60. Datt, B. A New Reflectance Index for Remote Sensing of Chlorophyll Content in Higher Plants: Tests Using Eucalyptus Leaves. J. Plant Physiol. 1999, 154, 30–36. [Google Scholar] [CrossRef]
  61. Girardin, P.; Tollenaar, M.; Muldoon, J.F. Effect of Temporary N Starvation on Leaf Photosynthetic Rate and Chlorophyll Content of Maize. Can. J. Plant Sci. 1985, 65, 491–500. [Google Scholar] [CrossRef]
  62. Zhao, D.; Reddy, K.R.; Kakani, V.G.; Reddy, V.R. Nitrogen Deficiency Effects on Plant Growth, Leaf Photosynthesis, and Hyperspectral Reflectance Properties of Sorghum. Eur. J. Agron. 2005, 22, 391–403. [Google Scholar] [CrossRef]
  63. Merzlyak, M.N.; Gitelson, A.A.; Chivkunova, O.B.; Solovchenko, A.E.; Pogosyan, S.I. Application of Reflectance Spectroscopy for Analysis of Higher Plant Pigments. Russ. J. Plant Physiol. 2003, 50, 704–710. [Google Scholar] [CrossRef]
  64. Wharton, P.S.; Nicholson, R.L. Temporal Synthesis and Radiolabelling of the Sorghum 3-Deoxyanthocyanidin Phytoalexins and the Anthocyanin, Cyanidin 3-Dimalonyl Glucoside. New Phytol. 2000, 145, 457–469. [Google Scholar] [CrossRef]
  65. Shih, C.-H.; Chu, I.K.; Yip, W.K.; Lo, C. Differential Expression of Two Flavonoid 3′-Hydroxylase CDNAs Involved in Biosynthesis of Anthocyanin Pigments and 3-Deoxyanthocyanidin Phytoalexins in Sorghum. Plant Cell Physiol. 2006, 47, 1412–1419. [Google Scholar] [CrossRef]
  66. Grzesiak, M.T.; Grzesiak, S.; Skoczowski, A. Changes of Leaf Water Potential and Gas Exchange during and after Drought in Triticale and Maize Genotypes Differing in Drought Tolerance. Photosynthetica 2006, 44, 561–568. [Google Scholar] [CrossRef]
  67. Moussa, H.R.; Abdel-Aziz, S.M. Comparative Response of Drought Tolerant and Drought Sensitive Maize Genotypes to Water Stress. Aust. J. Crop Sci. 2008, 1, 31–36. [Google Scholar]
  68. Heckmann, D.; Schlüter, U.; Weber, A.P.M. Machine Learning Techniques for Predicting Crop Photosynthetic Capacity from Leaf Reflectance Spectra. Mol. Plant 2017, 10, 878–890. [Google Scholar] [CrossRef] [PubMed] [Green Version]
  69. Walther, B.A.; Moore, J.L. The Concepts of Bias, Precision and Accuracy, and Their Use in Testing the Performance of Species Richness Estimators, with a Literature Review of Estimator Performance. Ecography 2005, 28, 815–829. [Google Scholar] [CrossRef]
  70. Pandey, P.; Ge, Y.; Stoerger, V.; Schnable, J.C. High Throughput In Vivo Analysis of Plant Leaf Chemical Properties Using Hyperspectral Imaging. Front. Plant Sci. 2017, 8, 1348. [Google Scholar] [CrossRef] [PubMed] [Green Version]
  71. Ma, D.; Carpenter, N.; Maki, H.; Rehman, T.U.; Tuinstra, M.R.; Jin, J. Greenhouse Environment Modeling and Simulation for Microclimate Control. Comput. Electron. Agric. 2019, 162, 134–142. [Google Scholar] [CrossRef]
  72. Ma, D.; Carpenter, N.; Amatya, S.; Maki, H.; Wang, L.; Zhang, L.; Neeno, S.; Tuinstra, M.R.; Jin, J. Removal of Greenhouse Microclimate Heterogeneity with Conveyor System for Indoor Phenotyping. Comput. Electron. Agric. 2019, 166, 104979. [Google Scholar] [CrossRef]
  73. Turner, N.C. Techniques and Experimental Approaches for the Measurement of Plant Water Status. Plant Soil 1981, 58, 339–366. [Google Scholar] [CrossRef]
  74. de Jong, S. SIMPLS: An Alternative Approach to Partial Least Squares Regression. Chemom. Intell. Lab. Syst. 1993, 18, 251–263. [Google Scholar] [CrossRef]
  75. Wise, B.M.; Gallagher, N.B.; Bro, R.; Shaver, J.M.; Windig, W.; Koch, R.S. PLS_Toolbox 4.0; Eigenvector Research, Inc.: Wenatchee, WA, USA, 2006. [Google Scholar]
Figure 1. Heatmap of coefficients of determination of models predicting the relative water content of different genotypes with hyperspectral reflectance.
Plants 11 00676 g001
Figure 2. Scatter plot of observed vs. predicted relative water content using the sorghum- and corn-based model.
Plants 11 00676 g002
Figure 3. Coefficient in models predicting the relative water content with the responses of sorghum and corn.
Plants 11 00676 g003
Figure 4. Coefficients in models predicting the relative water content with the responses of combined sorghum or combined corn.
Plants 11 00676 g004
Figure 5. Heatmap of coefficients of determination of models predicting nitrogen content of different genotypes with hyperspectral reflectance.
Plants 11 00676 g005
Figure 6. Scatter plot of observed vs. predicted nitrogen content using the sorghum- and corn-based model.
Plants 11 00676 g006
Figure 7. Coefficient in models predicting nitrogen content with the responses of sorghum and corn.
Plants 11 00676 g007
Figure 8. Coefficient in models predicting nitrogen content with the responses of combined sorghum or combined corn.
Plants 11 00676 g008
Table 1. Adaptation to water deficit and nitrogen use efficiency of the genotypes investigated in the study.
Plant SpeciesGenotypeAdaption to
Water Deficit
Nitrogen Use
Efficiency
SorghumTx623SusceptibleLow
B35Post-flowering toleranceLow
Tx7000Pre-flowering toleranceHigh
CornP1105AMUnknownUnknown
B73xMo17SusceptibleLow
G80xPHP02SusceptibleUnknown
BCC03xPHP02SusceptibleUnknown
PHJ33xPHP02TolerantUnknown
CML550xPHP02TolerantHigh
Table 2. Effects of treatments on relative water content and nitrogen content for sorghum and corn.
Relative Water Content (%)Nitrogen Content (%)
TreatmentWater SufficientWater DeficientSignificanceNitrogen
Sufficient
Nitrogen DeficientSignificance
Sorghum98.4 ± 0.54 a66.0 ± 5.29 b***1.81 ± 0.18 a1.16 ± 0.13 b***
Corn97.0 ± 1.60 a91.0 ± 11.10 b***1.99 ± 0.34 a1.59 ± 0.28 b***
Each value in the table is the mean ± standard deviation for each treatment. One-way analysis of variance (ANOVA) was used to determine significant differences among the treatments. * 0.01< p ≤ 0.05; ** 0.001 < p ≤ 0.01; *** p ≤ 0.001; NS, nonsignificant at p > 0.05. Values with different letters within the row are significantly different among the water or nitrogen treatments determined by Student’s t test (α = 0.05).
Table 3. Effects of genotypes on relative water content and nitrogen content under different water and nitrogen conditions.
Relative Water Content (%)Nitrogen Content (%)
SpeciesGenotypesWater SufficientWater DeficientNitrogen SufficientNitrogen Deficient
SorghumTx62398.4 ± 0.5167.2 ± 5.431.82 ± 0.08 a1.19 ± 0.10
B3598.5 ± 0.5966.1 ± 5.031.92 ± 0.22 a1.15 ± 0.13
Tx700098.5 ± 0.5464.7 ± 5.371.69 ± 0.15 b1.13 ± 0.15
SignificanceNSNS***NS
CornP1105AM97.7 ± 1.05 a90.6 ± 11.62.16 ± 0.351.70 ± 0.27 a
B73xMo1795.4 ± 1.42 c92.1 ± 6.22.00 ± 0.351.67 ± 0.29 a
G80xPHP0297.6 ± 1.27 ab89.0 ± 13.71.91 ± 0.281.65 ± 0.36 a
BCC03xPHP0296.8 ± 1.81 b90.2 ± 12.41.96 ± 0.281.57 ± 0.20 ab
PHJ33xPHP0297.5 ± 1.13 ab89.3 ± 13.62.02 ± 0.361.46 ± 0.19 b
CML550xPHP0297.2 ± 1.61 ab95.2 ± 6.21.89 ± 0.351.47 ± 0.25 b
Significance***NSNS*
Each value in the table is the mean ± standard deviation for each treatment. One-way analysis of variance (ANOVA) was used to determine significant differences among the treatments. * 0.01< p ≤ 0.05; ** 0.001 < p ≤ 0.01; *** p ≤ 0.001; NS, nonsignificant at p > 0.05. Values with different letters within the row are significantly different among the water or nitrogen treatments determined by Student’s t test (α = 0.05).
Publisher’s Note: MDPI stays neutral with regard to jurisdictional claims in published maps and institutional affiliations.

