Abstract
Salinity is a growing global concern that affects the yield of crop species, including tomato (Solanum lycopersicum). Its wild relative Solanum chilense was reported to have halophyte properties. We compared salt resistance of both species during the reproductive phase, with a special focus on sodium localization in the flowers. Plants were exposed to NaCl from the seedling stage. Salinity decreased the number of inflorescences in both species but the number of flowers per inflorescence and sepal length only in S. lycopersicum. External salt supply decreased the stamen length in S. chilense, and it was associated with a decrease in pollen production and an increase in pollen viability. Although the fruit set was not affected by salinity, fruit weight and size decreased in S. lycopersicum. Concentrations and localization of Na, K, Mg, and Ca differed in reproductive structures of both species. Inflorescences and fruits of S. chilense accumulated more Na than S. lycopersicum. Sodium was mainly located in male floral organs of S. chilense but in non-reproductive floral organs in S. lycopersicum. The expression of Na transporter genes differed in flowers of both species. Overall, our results indicated that S. chilense was more salt-resistant than S. lycopersicum during the reproductive phase and that differences could be partly related to dissimilarities in element distribution and transport in flowers.
1. Introduction
Tomato (Solanum lycopersicum) is cultivated worldwide and is of great economic importance. In 2020, more than 6 Mha of tomato plants was cultivated and 252 Mt of fruits was harvested [1]. Plant breeding increased tomato yields, and the world average yield in 2020 was 598 t ha−1 with values ranging from 14 t to 5 kt ha−1, depending on the region and the cultural mode [1]. However, tomato is sensitive to abiotic stresses, including salinity, because of its glycophytic nature [2]. Salinity is a growing global concern, and it is estimated that salinity is present in 900 million ha of soils worldwide [3]. Sodium chloride (NaCl) is the most common of salts and represents more than 90% of salt in the world [4]. Tomato is cultivated in many countries affected by salinity (e.g., East Asia, the Middle East, and North Africa), and salinity decreases tomato yield by on average 50% for an electrical conductivity of 5 dS m−1 [5].
Despite decades of tomato breeding programs, resistance to abiotic stress has been neglected [6]. Indeed, since the 1960s, tomato improvement has mainly focused on fruit yield, shelf-life, and taste [7,8]. Because of the self-pollination of cultivated tomato and varietal selection, genetic diversity has been considerably lost in this species [9]. Miller and Tanksley [10] estimated that the S. lycopersicum genome contained less than 5% of the genetic variation of its wild relatives and, according to Bretó et al. [11], this species is considered to have the lowest genetic diversity in the tomato clade (Clade II of Solanum, consisting of S. lycopersicum, S. tuberosum, and S. muricatum, [12]). Solanum lycopersicum has many wild relatives including a few originating from harsh environments [13]. The use of resistant wild relatives in breeding is a common practice to improve the resistance of crop species to abiotic stresses [14]. Solanum chilense is a wild tomato relative native from the Atacama desert, one of the most salty and arid areas in the world [15,16]. Due to its high level of genetic variability, S. chilense is considered one of the most promising sources of genes for selection of tomato genotypes resistant to abiotic and biotic stress [11,17,18]. Like some tomato relatives, S. chilense is self-incompatible and requires cross-pollination, while S. lycopersicum is self-compatible and self-pollinates [16]. The resistance of S. chilense to biotic stress has been largely investigated, and this species has been used in breeding programs for resistance to viruses such as the tomato yellow leaf curl virus [19] or the cucumber mosaic virus [20]. However, despite a great interest in improving the abiotic stress resistance of tomato, investigation into the resistance of S. chilense to abiotic stress such as salinity is rarely studied [2,21].
The effects of NaCl stress on S. lycopersicum culture have been explored for a long time, and studies have mainly focused on vegetative growth or yield parameters [8,21,22,23]. Even if fruit formation is a direct function of reproduction efficiency, the flowering stage is a necessary process before fructification and is consequently impacted by salinity stress before fruit formation. However, the effect of salt on reproductive structures has been little explored in tomato, although abiotic stresses and more specifically salinity may have an impact on the flowering stage. The reproductive phase is indeed considered one of the most sensitive plant developmental stages toward salinity [24]. Ultimately, salinity leads to a decrease in fruit yield and fruit weight and modification of sugar concentration and antioxidant compounds [25,26]. However, earlier in the reproductive development, it can lead to decrease of flower production or decrease of pollen germination and pollen tube growth and even modifications of flower morphology [24,27,28]. In tomato, salinity was shown to induce inflorescence failure and fertility decrease [29,30]. Nevertheless, how salinity affects the flowering and reproductive stage of the halophyte S. chilense remains largely unknown.
Solanum chilense has been shown to accumulate more Na in the vegetative aerial parts than S. lycopersicum in response to salt [2] but Na accumulation in the reproductive parts has not been investigated as yet. Sodium transport and storage play key roles in the plant response to salinity [31]. Transporters of mineral elements involved in salinity resistance have been widely studied in several plant species, including tomato [32,33]. Several families of transporters are indeed involved in salinity resistance at different stages, especially to maintain Na and potassium (K) homeostasis [34,35]. Briefly, sodium can enter the cell via class I-HKT (High Affinity K+) transporters and non-selective cation channels. Other transporters, such as the SOS (salt overly sensitive) pathway genes are involved in Na exclusion [34,35,36]. NHX (vacuolar Na+/H+ antiporters) transporters are believed to be Na+/H+ exchangers implied in vacuolar Na+ sequestration [37,38]. Other transporters may play a role in salinity resistance in other ways. HAK (High Affinity K+) transporters are involved in potassium nutrition and so could help against salt stress [39]. AKT2/3 (inward-rectifying K+ channel) is a potassium transporter involved in sucrose import in the phloem, which is also activated in response to salt stress [40,41]. In inflorescences of tomato, silencing of HKT1;2 was shown to increase the Na+/K+ ratio [25]. However, involvement of transporters activity in salinity resistance in the reproductive structures remains largely unknown in tomato.
In this paper, we compared the Na and K concentrations and localization in the reproductive structures of the halophyte S. chilense and the glycophyte S. lycopersicum as affected by salt stress and investigated responses of the reproduction of S. chilense to salt stress. We aimed to answer the following questions: (1) How does salinity affect flowering, flower development and fertility, and fruit production in these species? (2) Does salinity affect Na and mineral accumulation and partitioning in the reproductive structures of the two species? (3) Does a different Na partitioning in flowers affect flower fertility? (4) What are the responses of putative Na transporters and their contribution to Na accumulation and partitioning in the reproductive structures?
2. Results
2.1. Impact of Salinity on Reproductive Growth
Salt stress was applied before floral transition up to fruit maturation. Throughout the experiment, S. lycopersicum produced more leaves on the main stem than S. chilense, even under salt stress conditions (Figure 1a,b, Table S2). At 113 days after stress imposition (DASt), the average number of leaves on the main stem was 34.06 ± 5.72 in S. lycopersicum and 29.47 ± 4.77 in S. chilense (Figure 1a,b). Salt decreased the leaf production in both species (Figure 1a,b): leaf production decreased gradually with stress intensity in S. lycopersicum while it was similar in plants treated with 60 and 120 mM NaCl in S. chilense. As S. chilense had a bushier appearance than S. lycopersicum, the total number of leaves produced at 85 DASt was higher in S. chilense (80.22 ± 46.63) than in S. lycopersicum (47.67 ± 29.97) but it also decreased by 71% and 65% with salt stress, respectively.
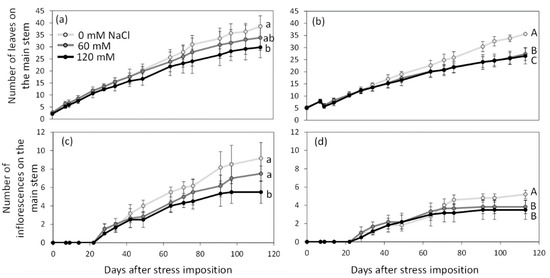
Figure 1.
Number of leaves (a,b) and of inflorescences (c,d) on the main stem of Solanum lycopersicum (a,c) and Solanum chilense (b,d) grown in perlite:vermiculite mixture supplied with 0, 60, and 120 mM NaCl from 0 to 113 days after stress imposition. Data are means ± SD, treatments followed by different letters are significantly different (lowercase, S. lycopersicum, uppercase, S. chilense) at p < 0.05 for a same species at 113 DASt.
Regarding reproductive growth, flowering times of the initial and sympodial segments were similar between species and salt treatments (Table 1 and Table S2). However, as observed for leaf production, S. lycopersicum produced more inflorescences on the main stem than S. chilense (Figure 1c,d): at 113 DASt, 7.39 ± 1.97 and 4.12 ± 1.05 inflorescences were observed on the main stem of S. lycopersicum and S. chilense, respectively. Taking into account the ramifications, the total number of inflorescences per plant was similar in both species (Table 1 and Table S2). NaCl decreased the number of inflorescences on the main stem and the total number of inflorescences per plant in both species (Table 1 and Table S2); the effect was dose-dependent in S. lycopersicum but not in S. chilense (Figure 1c,d, Table 1). The number of floral buds per inflorescence was always higher in S. chilense than in S. lycopersicum (Table 1 and Table S2). This number decreased with salt stress in S. lycopersicum but not in S. chilense. In the same way, salinity decreased the percentage of flower buds reaching anthesis only in the cultivated tomato (Table 1 and Table S2).

Table 1.
Effects of salt stress on flowering parameters of Solanum lycopersicum and Solanum chilense grown at 0, 60, and 120 mM NaCl.
2.2. Impact of Salinity on Flower Morphology and Fertility
Flower morphology differed among tomato species (Table 2 and Table S2): sepals, petals, and stamens were always longer in S. lycopersicum than in S. chilense, while pistils were longer in S. chilense than in S. lycopersicum and style exertion was only observed in S. chilense. Salt affected flower morphology by decreasing the length of sepals in S. lycopersicum and modifying the length of stamens in S. chilense.
Table 2.
Effects of salt stress on flowering morphology and fertility of Solanum lycopersicum and Solanum chilense grown at 0, 60, and 120 mM NaCl.
Flower fertility was assessed by stigma receptivity, pollen production, and viability (Table 2 and Table S2). Overall, stigma receptivity was slightly lower in S. lycopersicum than in S. chilense. S. lycopersicum also produced fewer pollen grains per anther than S. chilense. However, pollen viability was 23% higher in S. lycopersicum than in S. chilense. Salt did not affect stigma receptivity, pollen viability, or the number of pollen grains per anther in S. lycopersicum. However, in S. chilense, the number of pollen grains per anther decreased with salt while pollen viability increased gradually with salt concentration.
2.3. Impact of Salinity on Fruit Production and Quality
Fruit set was higher in S. chilense than in S. lycopersicum and was not affected by salt stress whatever the species (Table 3 and Table S2).
Table 3.
Effects of salt stress on fructification parameters of Solanum lycopersicum and Solanum chilense grown at 0, 60, and 120 mM NaCl.
S. lycopersicum produced bigger fruits than S. chilense. Indeed, fruit FW, DW, WC, and size were higher in S. lycopersicum than in S. chilense (Table 3). Following the fruit size, the number of seeds per fruit was 69% higher in S. lycopersicum than in S. chilense (Table 3), although, when expressed per gram of fruit FW, the number of seeds was 90% higher in S. chilense than in S. lycopersicum. Salinity mainly affected fruit growth in S. lycopersicum as fruit DW, FW, WC, and size decreased with a higher salt concentration in S. lycopersicum while salinity modified only fruit WC in S. chilense, which increased with salt concentration (Table 3). However, the number of seeds per fruit or per gram of fruit FW were not affected by salinity whatever the species (Table 3).
Concerning fruit quality, fruits of S. lycopersicum were less sweet and less acidic than those of S. chilense (Table 3): sugar content and pH were, respectively, 3.3 and 1.1 times lower in fruits of S. lycopersicum than in the ones of S. chilense under control conditions. Salinity affected fruit quality in both species (Table S2). The fruit sugar content was modified in different ways according to the species: sugar concentration increased in S. lycopersicum but decreased in S. chilense with salt concentration (Table 3). However, fruit pH decreased with salinity in both species (Table 3).
2.4. Impact of Salinity on Mineral Concentration and Distribution in Reproductive Organs
2.4.1. Inflorescences and Flowers
Inflorescences of S. chilense accumulated more Na than the ones of S. lycopersicum (Figure 2a), even under control conditions. Salinity induced a significant increase in Na concentration in the inflorescences of both species (Figure 2a, Table S2), although it was larger in S. chilense than in S. lycopersicum. Indeed, Na concentration increased by 223% and 465%, given as the percentual difference between control and 120 mM NaCl treated plants in S. lycopersicum and S. chilense, respectively. Moreover, Na distribution mapping showed that, in addition to the Na concentration, there was a difference in Na location inside the flowers in the two species (Figure 3 and Figure S1). In S. chilense, Na mainly accumulated in the male organs (Figure 3), whereas in S. lycopersicum, most of the Na was located in the receptacle and pedicel (Figure 3). Moreover, the ratio between the number of counts of Na in the floral receptacle and reproductive (stamens + pistil) floral whorls was higher in S. lycopersicum than in S. chilense and increased with salt stress, mainly in S. lycopersicum (Table 4). The ovary had the lowest Na signal compared to the rest of the flower in both species (Figure 3). As a result, the ratio between the Na signal in the stamens and the pistil was higher in S. chilense than in S. lycopersicum (Table 4). This ratio decreased with salt stress in both species.
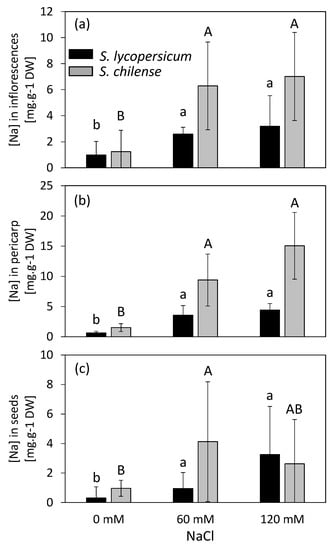
Figure 2.
Sodium (Na) concentration in inflorescences (a), pericarp of fruits (b), and seeds (c) of Solanum lycopersicum and Solanum chilense grown in perlite:vermiculite mixture supplied with 0, 60, and 120 mM NaCl. Data are means ± SD; treatments followed by different letters are significantly different (lowercase, S. lycopersicum, uppercase, S. chilense) at p < 0.05 for a same species.
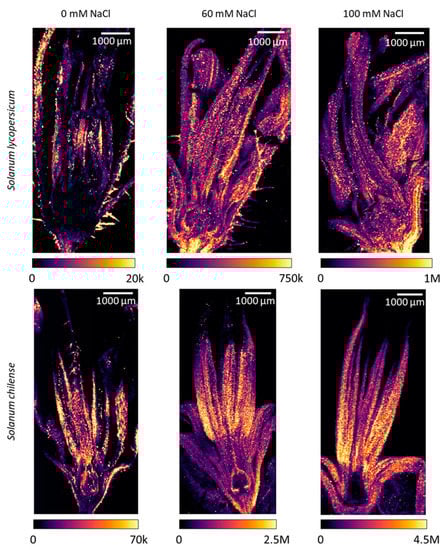
Figure 3.
Sodium (Na) distribution in flowers of Solanum lycopersicum (top row) and Solanum chilense (bottom row) grown in perlite:vermiculite mixture supplied with 0, 60, and 100 mM NaCl as revealed by LA-ICP-MS (laser ablation inductively coupled plasma mass spectroscopy) and visualized using ImageJ (version 1.53a). Color legends represent the number of counts per pixel (20 × 20 µm2) of each analysis.
Table 4.
Effects of salt stress on ratio (vegetative/reproductive organs and male/female organs) of mineral elements signals in flowers of Solanum lycopersicum and Solanum chilense grown at 0, 60, and 100 mM NaCl.
As for Na, inflorescences of S. chilense accumulated more K than those of S. lycopersicum (Table 5 and Table S2). Salinity did not affect the K concentration in the inflorescences whatever the species (Table 5 and Table S2). The K/Na ratio was, however, higher in the inflorescences of S. lycopersicum than in those of S. chilense and decreased with salt stress in both species (Table 5 and Table S2). In flowers of S. chilense, K mainly accumulated in male organs with no accumulation in female organs (Figure 4 and Figure S2). In contrast, K accumulated mainly in female organs in S. lycopersicum (Figure 4 and Figure S2). As a result, the ratio of the number of counts of K in stamens and pistil was higher in S. chilense than in S. lycopersicum (Table 4). However, the ratio between the K signals in floral receptacle and reproductive floral organs was similar in both species under control conditions but decreased with salt in S. chilense and not in S. lycopersicum (Table 4).
Table 5.
Effects of salt stress K, Ca, and Mg concentrations of different organs of Solanum lycopersicum and Solanum chilense grown at 0, 60, and 120 mM NaCl.
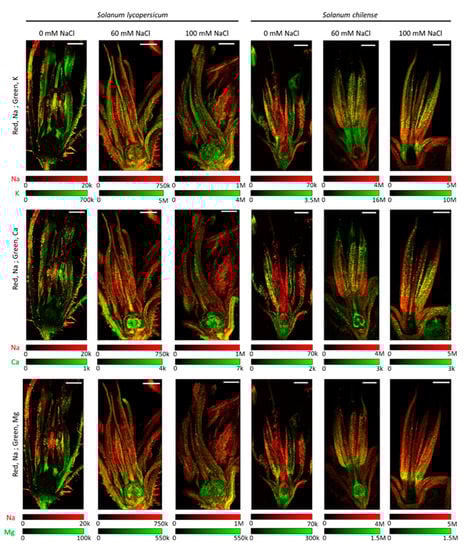
Figure 4.
Distribution of sodium (Na) shown in red and potassium (K), calcium (Ca) and magnesium (Mg) shown in green and their co-localization (yellow) in flowers of Solanum lycopersicum and Solanum chilense grown in perlite:vermiculite mixture supplied with 0, 60, and 100 mM NaCl. Distribution of individual element was determined using LA-ICP-MS (laser ablation inductively coupled plasma mass spectroscopy) and visualized using ImageJ (version 1.53a). Color legends represent the number of counts per pixel (20 × 20 µm²) for each analysis and each element. Signal intensities are correlated with the concentrations of a particular element. Scale bar = 1000 µm.
Inflorescences of S. lycopersicum accumulated about 10 times more Ca than those of S. chilense, and their Ca concentrations were not affected by salinity (Table 5 and Table S2). Ca mainly accumulated in floral receptacle of S. lycopersicum and mainly in reproductive floral organs of S. chilense (Figure 4 and Figure S3). Indeed, the ratio between the Ca signals in floral receptacle and reproductive floral organs was higher in S. lycopersicum than in S. chilense (Table 4). Ca was particularly visible in the ovary of salt-treated S. lycopersicum flowers (Figure 4 and Figure S3), explaining the lower ratio of Ca signal between stamens and pistil in salt-treated flowers (Table 4).
The concentration of Mg in inflorescences of S. lycopersicum was more important than in those of S. chilense (Table 5 and Table S2). However, only the former was affected by salinity (Table 5 and Table S2). Mg mainly accumulated in the stamens and ovary of S. chilense and in the ovary of S. lycopersicum (Figure 4 and Figure S4). The ratio of Mg signals between floral receptacle and reproductive floral organs and between stamens and pistil decreased with salt stress in S. chilense and S. lycopersicum, respectively (Table 4).
2.4.2. Fruits and Seeds
The Na concentration in fruit pericarp was similar to in the inflorescences for the same species (S. lycopersicum, t101 = −0.161, p = 0.872, S. chilense, t49 = −0.818, p = 0.417, Figure 2a,b). Nevertheless, as observed in the inflorescences, the pericarp of S. lycopersicum fruits were less concentrated in Na than the pericarp of S. chilense fruits (Figure 2b, Table S2): the difference was about 2.4 times that of control plants, 2.6 times that of 60 mM NaCl treated plants, and 3.4 times that of 120 mM NaCl treated plants. Salinity indeed increased the Na concentration in the pericarp of both species but to a higher extent in S. chilense. For both species, the Na concentration was 0.6 and 0.4 times lower in seeds than in pericarp for S. lycopersicum and S. chilense, respectively, but again, seeds of S. chilense contained more Na that the ones of S. lycopersicum (Figure 2c, Table S2). However, the Na concentration increased with salt stress in the seeds of S. lycopersicum, but only slightly in those of S. chilense (Figure 2b,c).
The concentrateion of K in the pericarp was similar in both species and decreased significantly with salt stress in both species (Table 5 and Table S2). However, the K concentration in the seeds was higher under control conditions in S. chilense than in S. lycopersicum, and it decreased with salinity only in the former so that the K concentration was similar in the seeds of stressed plants of both species (Table 5 and Table S2).
The concentration of Ca was higher in the pericarp of S. chilense than in the one of S. lycopersicum, but there was no clear difference under salinity (Table 5 and Table S2). However, the Ca concentration in seeds did not differ between species (Table 5 and Table S2). The concentration of Mg was higher in the pericarp of S. chilense than in the one of S. lycopersicum, but it was higher in the seeds of S. lycopersicum than in the ones of S. chilense (Table 5 and Table S2).
2.5. Impact of Salinity on the Expression of Mineral Transporters in Flowers
To improve our understanding of Na accumulation and its distribution in flowers, we investigated the expression of genes coding for transporters involved in Na transport in flowers at anthesis. We particularly focused on the SOS pathway, and the NHX, HKT and HAK transporters.
Concerning the SOS pathway, SOS1 expression was higher in S. lycopersicum than in S. chilense, while the opposite trend was observed for SOS3 expression (Figure 5a,c, Table S2). However, there was no difference of expression for SOS2 between species (Figure 5b, Table S2). Salt stress increased SOS1 expression in both species but more significantly and at a lower salt concentration in S. lycopersicum than in S. chilense (Figure 5a). Expression of SOS2 and SOS3, respectively, increased and decreased with salt in S. lycopersicum only; nevertheless, a decrease of SOS3 expression was observed in S. chilense at 60 mM NaCl (Figure 5b,c).
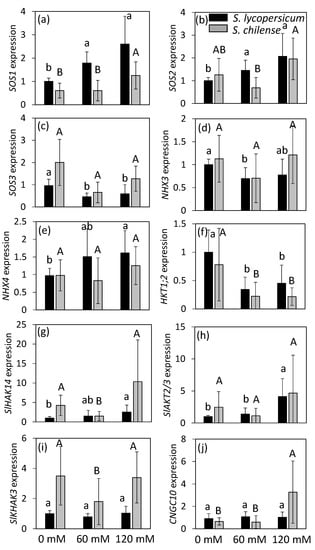
Figure 5.
Expression of 10 genes involved in minerals transport analyzed by qRT-PCR on flowers of Solanum lycopersicum and Solanum chilense growing at 0, 60, and 120 mM NaCl. (a) SOS1 (Salt Overly Sensitive 1, Solyc01g005020); (b) SOS2 (Salt Overly Sensitive 2, Solyc12g009570); (c) SOS3 (Salt Overly Sensitive 3, Solyc06g051970); (d) NHX3 (vacuolar Na+/H+ antiporter 3, Solyc01g067710); (e) NHX4 (vacuolar Na+/H+ antiporter 4, Solyc01g098190); (f) HKT1;2 (class I—High affinity K+ transporter 2, Solyc07g014680); (g) SlHAK14 (High Affinity K+ transporter 14, Solyc09g074820); (h) SlAKT2/3 (inward-rectifying K+ channel, Solyc10g024360); (i) SlHAK3 (High Affinity K+ transporter 3, Solyc12g096580); (j) CNGC10 (Cyclic Nucleotide Gated Channel 10, Solyc05g050350). The tomato elongation factor gene (LeEF-1α, Solyc06g005060) and TIP41-like protein (TIP41, Solyc10g04985) were used as the reference genes. Expressions are given based on S. lycopersicum grown at 0 mM NaCl, to which a value of 1 was assigned. Data are means ± SD, treatments followed by different letters are significantly different at p < 0.05 for the same species (lowercase, S. lycopersicum, uppercase, S. chilense).
The gene NHX3, which encodes a tonoplast transporter, had similar expression levels in both species regardless of treatment (Figure 5d, Table S2), contrary to NHX4, which was more expressed in S. lycopersicum than in S. chilense at least in salt-treated flowers (Figure 5e, Table S2). Salt stress decreased the expression of NHX3 and increased the expression of NHX4 in S. lycopersicum but did not affect their expression in S. chilense (Figure 5d,e).
The expression of HKT1;2 was slightly higher in S. lycopersicum than in S. chilense and decreased with salt treatment in both species from 60 mM NaCl (Figure 5f, Table S2).
The expression of SlHAK14 and SlHAK3 was higher in S. chilense than in S. lycopersicum, while the expression of SlAKT2/3 and CNGC10 was similar in both species (Figure 5g–j, Table S2). Salinity affected these genes differently, depending on the species. The expression of SlHAK14 gradually increased with salt in S. lycopersicum but decreased in S. chilense at 60 mM NaCl only (Figure 5g). The expression of SlAKT2/3 increased in S. lycopersicum from 60 mM NaCl but was unchanged in S. chilense (Figure 5h). The expression of SlHAK3 was stable in S. lycopersicum but decreased at 60 mM NaCl in S. chilense (Figure 5i). The expression of CNGC10 was stable in S. lycopersicum but increased at 120 mM NaCl in S. chilense (Figure 5j).
2.6. Correlations among Flower Morphology, Mineral Concentrations, and Gene Expression
Analysis of correlations among flower fertility parameters, concentrations of elements in inflorescences and flowers, and expression of mineral transporters in flowers showed a different behavior between both species (Figure 6). Overall, few correlations were observed between flower fertility parameters and mineral concentrations in the flowers, mainly in S. lycopersicum (Figure 6a,b). In S. chilense, the number of pollen grains per stamen was negatively correlated with the concentration of Na in inflorescences, although this correlation was not observed in S. lycopersicum. Some correlations were observed between floral organ size and elements signals in the reproductive structures in both species (Figure 6a,b). In S. lycopersicum, sepal length was negatively correlated with the ratio of Na signal between vegetative and reproductive floral organs and positively correlated with the ratio of elements signals between male and female reproductive organs and with the K/Na ratio in the inflorescences (Figure 6a). Moreover, in S. chilense, the pistil length and the style exertion were negatively correlated with, respectively, the Na concentration in the inflorescence and the ratio of Na signal between vegetative and reproductive organs (Figure 6b). Stamen and pistil lengths were also negatively correlated with, respectively, the Ca and Mg concentrations in inflorescences and positively correlated with the ratio of Mg signals between vegetative and reproductive floral organs in S. lycopersicum. Correlations between Na signals in reproductive structures and Na transporter gene expression also differed among species (Figure 6c,d). The Na concentration in inflorescences was negatively correlated with the expression of SOS3 and positively correlated with the expression of SOS2 and SlHAK14 in S. lycopersicum while it was negatively correlated with the expression of HKT1;2 in S. chilense (Figure 6c,d). The ratio of Na concentrations in male and female floral organs was negatively correlated with the expression of SOS1, SOS2, and SlAKT2/3 and positively correlated with the expression of NHX3 and HKT1;2 in S. lycopersicum while it was positively correlated with the expression of SOS3 and HKT1;2 in S. chilense. The ratio between Na signals in vegetative and reproductive floral organs was negatively correlated with the expression of NHX3 and HKT1;2 in both species; it was also negatively correlated with the expression of SlHAK3 and SOS3 in S. chilense and positively correlated with the expression of SOS1, SOS2, SlHAK14, and SlAKT2/3 in S. lycopersicum (Figure 6c,d).
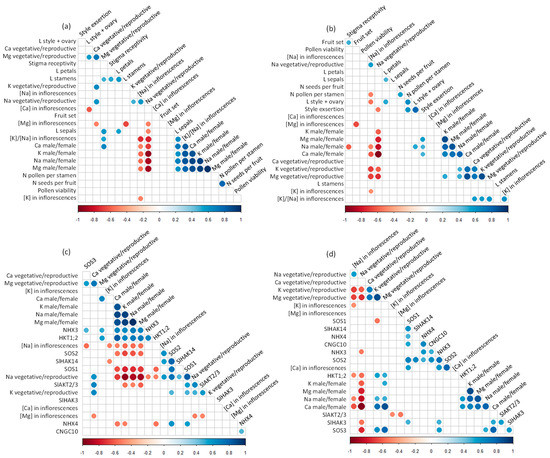
Figure 6.
(a,b) Correlation graphs of concentrations of elements in inflorescences, ratios of element signals in the vegetative/reproductive organs and male/female organs on flowers and fertility parameters of flowers of Solanum lycopersicum (a) and Solanum chilense (b). (c,d) Correlation graphs of concentrations of elements in inflorescences, ratios of element signals in the vegetative/reproductive organs and male/female organs on flowers and expression of mineral transporters in flowers of S. lycopersicum (c) and S. chilense (d). Only significant correlations (p < 0.05) are indicated with circles. Negative correlations are highlighted in red and positive correlations in blue. CNGC10, Cyclic Nucleotide Gated Channel 10; HKT1;2, class I—High affinity K+ transporter 2; L petals, sepals, style + ovary: length of, respectively, petals, sepals, and the sum of style and the ovary; NHX3, 4, vacuolar Na+/H+ antiporter 3, 4; N pollen per stamen, seeds per fruit: number of, respectively, pollen grains per stamen and seeds per fruit; SlAKT2/3, inward-rectifying K+ channel; SlHAK3, 14, High Affinity K+ transporter 3,14; SOS1, 2, 3, Salt Overly Sensitive 1, 2, 3.
3. Discussion
3.1. Salinity Affects Reproductive Structures in Both Species
Flowering and reproduction differed between S. lycopersicum and S. chilense. The former is considered as an autonomous flowering plant [42] while the latter is a short-day plant [16,43]. Moreover, S. lycopersicum is self-compatible and self-pollinates while S. chilense is self-incompatible and requires insect pollination [13]. We observed that salinity affected the reproductive phase in both species but in different ways. Salt stress decreased the number of inflorescences in both species but the number of floral buds and opened flowers per inflorescence was only reduced in S. lycopersicum. Solanum chilense produced more flowers per inflorescence than S. lycopersicum like most wild tomato relatives, which could be an advantage for breeding [44], but this parameter was not affected by salt stress in S. chilense. Inflorescence and flower production seemed thus more affected by salinity in S. lycopersicum than in S. chilense, and the effect was more dose-dependent in the former than in the latter. Flower abortion was previously observed under salt conditions in cultivated tomato [29]. A decrease in inflorescence and flower production and an increase in flower abortion are common phenomena observed in response to stress; abortion of spikelets was, for instance, observed in rice under salinity treatments [45].
Salinity also affected flower morphology and fertility. Flower morphology differed between species: the ratio between corolla and calyx area was higher in S. chilense than in S. lycopersicum, and style exertion was observed only in the former. These differences could be related to the self-incompatibility of S. chilense [16] that needs to attract pollinators for cross-pollination. Concerning floral organs, salt decreased sepal length in S. lycopersicum and decreased stamen length in S. chilense. Modification of flower morphology due to salinity was reported in Spergularia maritima (petal size increased in salinity treatments) [27]. In tomato, other environmental constraints such as temperature also affect flower morphology [46,47]. Those modifications could have an impact on flower attractivity for pollinators, as it has been shown in Raphanus sativus [48] or Borago officinalis [49,50]. Flower and petal size are indeed important floral signals for pollinators [49]. The decrease of stamen length observed in salt-treated S. chilense was associated with a decrease in the number of pollen grain per anther and an increase in pollen viability. However, in our study, pollen production and viability were not affected by salinity in S. lycopersicum, and stigma receptivity was not affected by salt stress whatever the species. Anther development and microsporogenesis are generally considered the most sensitive reproductive stages to abiotic stresses, which could explain the more important effect on male organs than on female organs [51]. Gynoecium fertility is not often affected by abiotic stress in tomato or is affected as a consequence of male development failure [52,53].
In accordance with the low impact of salinity on flower fertility, fruit set was not affected by salt treatment in our study whatever the species. However, fruit weight, size, and water content decreased with salinity in S. lycopersicum while these parameters were not affected or even increased (for WC) under salt treatment in S. chilense. Moreover, the seed set decreased with salinity in S. lycopersicum but not in S. chilense. The effect of salinity on flower fertility is thus not sufficient to explain the salt-induced modifications of fruit parameters despite the positive correlation between pollen per anther and seeds per fruit. Pollen tube growth, fertilization, and seed development may be affected by abiotic stress such as salinity [54]. Moreover, the decrease of sepal length observed in salt-treated S. lycopersicum may limit sepal photosynthesis and reduce the supply of carbohydrates for fruit and seed growth as observed in hellebore [55]. It was indeed reported that photosynthesis of green reproductive organs contribute in a significant way to fruit growth [56,57]. A decrease of yield in S. lycopersicum subjected to salinity has frequently been described and was explained by a decrease in fruit size rather than by a decrease in fruit number [21,58], which corroborates our observations. Martínez et al. [21] compared fruit yield in S. lycopersicum and S. chilense in response to NaCl (0–80 mM) and observed that, although salt decreased fruit production and fruit weight in S. lycopersicum, it did not affect these parameters in S. chilense. Solanum chilense seems thus able to maintain its fruit production in salt conditions. Maintenance of fruit size and seed set under salt stress could be of great interest for tomato improvement. However, salinity affected fruit quality in both species. We observed that salinity increased fruit sugar concentrations in S. lycopersicum but decreased it in S. chilense; salt also decreased fruit pH in both species. Martínez et al. [21,26] also observed a change in fruit quality in both species as a response to salt. For example, they observed that both species differed regarding their main antioxidant compounds and that salinity increased the antioxidant capacity in S. chilense while it decreased it in S. lycopersicum [26].
3.2. Salinity Affects Mineral Accumulation and Distribution Which May Affect Fertility
The decrease of inflorescence and flower production and of flower fertility as well as the increase of flower abortion in response to abiotic stress is often explained in terms of competition for assimilates or alteration of carbohydrates metabolism [29,30,59]. However, in response to salinity, we may not exclude that the negative impact on flower production and fertility could be due to an accumulation of toxic ions in the reproductive structures [60,61].
The sodium concentration increased in the inflorescences and the fruits of salt treated plants of both species as soon as they were exposed to 60 mM NaCl, but final concentrations in S. chilense were higher than in S. lycopersicum. However, Na concentrations were lower in the seeds than in the pericarp, suggesting that the plant protect the next generation. A limitation of toxic ions in the seeds has indeed been reported in other plant species such as rice [62] and Kosteletzkya pentacarpos [63]. It was previously shown that S. chilense accumulated more Na in the vegetative aerial parts than S. lycopersicum during vegetative growth [64]. Our results showed that a similar situation occurred in the reproductive organs. The higher salinity resistance of S. chilense compared to S. lycopersicum regarding flower and fruit production can therefore not be explained by Na exclusion in the reproductive parts.
However, the Na distribution in the flowers differed in the species. In S. lycopersicum, Na was mostly accumulated in the non-reproductive parts of the flowers and especially in the pedicel and receptacle. This suggests that S. lycopersicum protects the reproductive organs by limiting Na accumulation in this sensitive tissue. Ghanem et al. [29] previously reported that S. lycopersicum limited Na accumulation in the reproductive organs and particularly in pollen grains. However, we may not exclude that the higher Na accumulation in the non-reproductive floral organs contributed to the decrease of sepal length. The sepal length was indeed negatively correlated with the Na signal ratio between floral receptacle and reproductive floral organs in S. lycopersicum. It is known that Na accumulation reduced vegetative growth in S. lycopersicum [64,65]. In S. chilense, Na accumulated more in reproductive floral organs and mainly in stamens. This could explain the decrease of stamen length and pollen production observed in salt-treated S. chilense. The number of pollen grains per stamen was indeed negatively correlated with the concentration of Na in the inflorescences in this species. In S. lycopersicum, the exclusion of Na in the male floral organs probably led to the protection of pollen because neither pollen viability nor the number of pollen grains per stamen were affected by salt stress in our study. It is often reported that male reproductive floral organs are more affected by abiotic stress than female floral organs in tomato [29,66], suggesting that the latter is more protected than the former. However, we observed that the ratio of the Na signals between male and female floral organs decreased with salt in both species. Regarding female floral organs, Na accumulated in the external tissues over the ovary but not in the ovules in S. chilense, whereas in S. lycopersicum, Na signal was low in female organs but was distributed in the whole ovary. Such differences in Na localization between species may explain the effects of salinity on fruit development in both species. Fruit and seed development were indeed more affected in S. lycopersicum than in S. chilense.
In addition to the accumulation of Na, modification of the concentration or localization of other key minerals may also affect flower development and fertility. Indeed, K is an essential macronutrient in flower development, particularly for stamen and pollen grains [67]. We observed that the concentrations of K and Na in inflorescences were negatively correlated and that the K/Na ratio decreased with salt stress in both species although K concentrations in inflorescences were not affected by salinity. In vegetative organs, a decrease of K is often observed in response to NaCl [2,29,64,68], which negatively affects C/N nutrition and the activity of several enzymes [69,70]. The maintenance of sufficient K concentration in inflorescences despite salt stress can be explained by the importance of this element for reproductive development and especially for elongation of filaments and release of pollen [67]. For example, K contributed to anther dehiscence and pollen imbibition in rice [71,72]. Decrease of the K/Na ratio is commonly reported as symptomatic of salinity stress [73]. Surprisingly, we observed that the K/Na ratio is more important in the inflorescences of S. lycopersicum than in those of S. chilense, even at high NaCl concentration. Albaladejo et al. [74] observed also a more significant decrease in K concentration with salinity in the halophyte S. pennellii than in S. lycopersicum. They hypothesized that this wild tomato species is able to withstand K deficiency by using Na in osmoregulation: K may indeed be replaced by Na in non-specific activities in a few species [69], notably in enzyme activities [75]. This could be a resistance strategy also shared by S. chilense to withstand the Na accumulation. Magnesium is also required for pollen development since mutants in the Mg transporter family genes, AtMGT, showed pollen-abortive phenotypes [76]. We observed that Mg accumulated in the stamens and the ovary of S. chilense and in the ovary of S. lycopersicum, suggesting also a potential role for ovary and fruit development. Because of its fundamental role in phloem export of carbohydrates, Mg is of critical importance during the reproductive growth stage of plants to maintain and maximize carbohydrates transport to sink organs [77]. Calcium is known to play a key role in pollination and pollen tube growth [78] as well as in fruit development [79]. We observed that Ca concentration and localization also differed between both species and Ca accumulated in ovaries in response to salt. Concentrations of Mg and Ca were higher in the inflorescences of S. lycopersicum than in the ones of S. chilense. However, more research is required to understand their role in flower and fruit development.
3.3. Mineral Transporters Are Involved in Na Accumulation and Partitioning in the Reproductive Structures
To better understand the localization of Na in tomato reproductive structures, we investigated the expression of genes coding for Na transporters. SOS1 is a Na+/H+ exchanger activated by the complex formed by SOS2 and SOS3 [80,81,82]. The SOS pathway is involved in Na exclusion out of the cell [83,84,85]. We observed that expression of SOS1 and SOS2 increased with salt stress in flowers of S. lycopersicum and to a lesser extent in the ones of S. chilense. Moreover, their expression was positively correlated with the Na concentration ratio between non-reproductive and reproductive floral organs in S. lycopersicum. Surprisingly, we found a decrease of SOS3 expression with salt in S. lycopersicum, despite its role in activation of SOS1 [83]. However, pathways other than the SOS2–SOS3 complex are involved in Na+ activation of SOS1 [83]. Induction of the expression of SOS1 and SOS2 is commonly reported in response to salt stress in vegetative parts, and their overexpression induces a better salt resistance [81,86,87]. By contrast, knock-out mutants of these genes lead to a decrease in salt resistance [88,89]. Our results suggested that the SOS pathway is also activated in reproductive organs in response to salt stress. In contrast to our results, Romero-Aranda et al. [25] did not observe any induction of SOS1 in inflorescences of tomato near-isogenic lines homozygous for S. cheesmaniae SOS1 allele under salinity conditions. The involvement of SOS1 in inflorescences thus seems species-dependent in the tomato clade and may differ among halophyte and glycophyte species. Based on those results, SOS1 expression is induced in salt response in a higher extent in the glycophyte S. lycopersicum than in the halophytes S. cheesmaniae and S. chilense at the reproductive level. We indeed observed that the expression of SOS genes was correlated with Na concentrations in the inflorescences of S. lycopersicum but not of S. chilense.
Other genes involved in the Na transport at the cell level are NHX3 and NHX4, which encode tonoplast transporters involved in the import of Na to the vacuole [90,91,92]. In our study, NHX3 expression decreased and NHX4 expression increased with salt stress in S. lycopersicum flowers while their expression was not affected by salinity in S. chilense flowers. This differs with the results of Gálvez et al. [91], who compared the response of S. lycopersicum and S. pimpinellifolium to salinity. They indeed observed that NHX3 and NHX4 were upregulated by salinity, especially in the wild halophyte S. pimpinellifolium [91]. However, they analyzed plants at the vegetative stage and did not investigate expression in the reproductive organs. We may thus not exclude that the involvement of NHX genes differ in vegetative and reproductive organs in tomato species subjected to salinity. Nevertheless, Bassil et al. [67] have shown that, in Arabidopsis, AtNHX1 and AtNHX2 are involved in flower development by regulating vacuolar pH and K+ homeostasis and that Na+ could partially substitute K+ in presence of salt. AtNHX1 and AtNHX2 are the closest AtNHX homologs of SlNHX4 [91]. We could hypothesize that, in S. lycopersicum, under salt stress conditions, the increase of NHX4 expression would be related to an attempt to increase the K concentration in the anthers, whereas the fact that S. chilense could use Na instead of K for flower development and therefore would not require high NHX4 expression remains an open question.
Other transporters are involved in Na and K transport. HKT1;2 belongs to HKT1-like transporters whose role is to remove Na from the xylem in the roots [93]. However, it has been shown that this gene family is important in salinity resistance during the reproductive stage [25,94]. In our study, HKT1;2 expression decreased with salinity in both species, possibly explaining the accumulation of Na in the inflorescences. This gene seems to be involved in the partitioning of Na in the flowers as its expression was positively correlated with the Na ratio between male and female floral organs and negatively correlated with the Na ratio between vegetative and reproductive floral organs in both species. SlAKT2/3 is a phloem K transporter involved in long-distance transport of sucrose [40]. This gene is expressed in tomato flowers and especially sepals [95,96]. We observed that the expression of SlAKT2/3 increased with NaCl in S. lycopersicum but not in S. chilense. In the same way, the expression of SlHAK14 increased with salt stress in S. lycopersicum only. SlHAK14 and SlHAK3 are K transporters belonging to the KT/KUP/HAK family [97], and they are both very highly expressed in pollen [96]. In S. chilense, the expression of both SlHAK14 and SlHAK3 decreased at a concentration of 60 mM NaCl compared to the other treatments. The expression of SlHAK14 negatively correlated with the K concentration in inflorescences in S. lycopersicum only, suggesting a different role in element regulation in S. lycopersicum and in S. chilense. The expression of CNGC10 also differed among tomato species. It increased with salinity in S. chilense but not in S. lycopersicum. This gene is linked to the import of Na and K in flowers, and its expression is inhibited by salinity in Arabidopsis [98]. Its higher expression in S. chilense could partly explain the higher Na concentration in inflorescences and flowers of S. chilense compared to S. lycopersicum. Our results suggest that Na and K transport could be differently regulated in flowers of S. lycopersicum and S. chilense. Moreover, correlations between transporters expression and mineral concentrations in flowers differed in both species, mainly for the SOS pathway. Further studies are required to decipher the role of transporters in Na and K localization in flowers of both species.
4. Materials and Methods
4.1. Plant Material and Growth Conditions
Seeds of Solanum lycopersicum L. cv Ailsa Craig (accession LA2838A) and of Solanum chilense Dunal (accession LA4107) were obtained from the Tomato Genetics Resource Center (TGRC, University of California, Davis, CA, USA) and INIA-La Cruz (La Cruz, Chile), respectively. S. chilense was subjected to 6 days pre-germination in Petri dishes on humid filter paper at 25 °C and 12 h photoperiod before sowing in peat compost (DCM, Amsterdam, The Netherlands) and transferred to a temperate greenhouse. Sowing of S. lycopersicum was performed in the same peat compost and in the same greenhouse 13 days after the sowing of S. chilense so they would be of the same developmental stage at the start of stress application. When the two-leaf stage was reached, the plants were individually transplanted in pots (2.5 L) on perlite/vermiculite (50% v/v) and were grown under the same temperate greenhouse conditions (24 ± 1.5 °C, 63 ± 8% RH day, 21 ± 0.8 °C, 67 ± 5% RH night, 16 h-photoperiod). In addition to natural light, supplementary lighting was provided by LED LumiGrow lights (650 W, red-blue) to maintain a minimum light intensity (mean light in the middle of a cloudy day 181.33 ± 63.42 µmol m−2 s−1). Plants were watered three times a week with modified Hoagland solution (5 mM KNO3, 5.5 mM Ca(NO3)2, 1 mM NH4H2PO4, 0.5 mM MgSO4, 25 µM KCl, 10 µM H3BO4, 1 µM MnSO4, 0.25 µM CuSO4, 1 µM ZnSO4, 10 µM (NH4)6Mo7O and 1.87 g L−1 Fe-EDTA, and pH 5.5–6). After four days of acclimation, plants were randomly divided into four groups (25 plants per group) receiving 0, 60, 100, or 120 mM NaCl (respectively, 0.86, 7.07, 10.82, and 12.72 mS cm−1). Salt solutions were applied three times a week at the same time that the Hoagland solution, with volumes depending on the physiological stage of the plant.
4.2. Growth
Vegetative growth was assessed by counting the number of leaves on the main stem on 10 plants per condition and species, once a week. Reproductive growth was also assessed on the same 10 plants per condition and species. Flowering time of the initial and the sympodial segments were assessed by counting the number of leaves below the first inflorescence and between inflorescences, respectively. The number of inflorescences on the main stem was counted once a week from 20 days after stress imposition (DASt). The number of flower buds and flowers at anthesis per inflorescence was followed on the second and third inflorescences.
Per condition and species, 11 to 20 flowers at anthesis from the second inflorescence of the main stem were harvested to evaluate the length of sepals, petals, stamens, pistil, and ovary. The style exertion was also assessed for S. chilense by measuring the length of the pistil outside the stamen cone. Organs were dissected, flattened, and measured using ImageJ (version 1.53a).
4.3. Flower Fertility
To detect stigma receptivity, peroxidase activity was tested at the stigma’s surface according to Dafni and Maués [99]. At anthesis, 14 to 22 flowers per condition were harvested. Stigmas were dissected and immersed for 5 min in acetate buffer with 112.2 mM CaCl2·2H2O, 2.3 mM 3-amino-9-ethylcarbazole diluted in N-N-dimethylformamide, and 0.014% H2O2 (v/v). The reddish-brown color developed on the surface was scored by 0 (no receptive stigma) or 1 (receptive stigma). Pollen viability was assessed on two stamens of the same flowers using Alexander dye [100]. Pollen was considered viable when a red coloration appeared, whereas it was considered non-viable when its coloration was green. A minimum of 100 pollen grains was counted by anther. The number of pollen grains per anther was determined by crushing an anther in 40 µL of Alexander’s dye and counting using ImageJ as described by Ayenan et al. [101], showing a pollen size of 5–800 pixel2 and a circularity of 0.3–1.0. Six pictures were taken by anther, and two anthers per flower and 10 flowers per condition and species were analyzed.
4.4. Fruit Parameters
For fruit production, flowers of S. lycopersicum were self-pollinated, and flowers of the self-incompatible S. chilense were hand pollinated with pollen from the same condition. The fruit set was assessed by the ratio between the number of obtained fruits and the number of pollinated flowers. Fruits were collected at the maturity stage. The number of seeds per fruit, circumference, and fresh weight (FW) were measured for 10 to 15 fruits per condition and species. For the same fruits, sugar concentration was estimated in degrees Brix by refractometry (Eclipse, Bellingham + Stanley, Tunbridge Wells, UK), and the pH of the juice was evaluated by pH paper (Dosatest pH test strips pH 3.6–6.1, VWR).
4.5. Mineral Elements Concentrations and Element Distribution
Sodium (Na), potassium (K), calcium (Ca), and magnesium (Mg) were quantified in inflorescences, pericarp, and seeds of fruits. Material was oven-dried at 70 °C for 72 h, and 50 to 100 mg dry weight (DW) was weighted and digested in 4 mL of warm 68% (v/v) HNO3. After complete dissolution, minerals were dissolved in aqua regia (HCl 37%:HNO3 68% 3:1), filtered (Whatman, 11 µm), and quantified by flame atomic absorption spectrophotometry (ICE 3300, Thermo Scientific, Waltham, MA, USA) using suitable standards (Spectracer-CPACHEM; accredited through ISO/IEC17025). Quantification was performed on at least nine samples per condition and species.
Flowers of both species growing at 0, 60, and 100 mM were longitudinally cut using a platinum coated razor blade and sandwiched between two aluminum foils, flattened, frozen in liquid nitrogen, and freeze-dried (−30 °C, 0.210 mbar, Alpha 2–4, Christ, Osterode am Harz, Germany) for 72 h. Two flowers per condition and species were placed on double sided Scotch® tape on glass slides, and the distribution of Na, Mg, K, and Ca was evaluated by laser ablation inductively coupled plasma mass spectrometry (LA-ICP-MS, Agilent 7900×, Agilent Technologies, Palo Alto, CA and Analyte G2, Teledyne Photon Machines Inc., Bozeman, MT, USA). The laser ablation system contains a HelEx II 2-volume ablation cell with integrated Aerosol Rapid Introduction System [102]. The imaging parameters for best image quality were set according to van Elteren et al. [103] (LA settings: square 20 μm beam size, 275 Hz, dosage 11, 1 J/cm2; ICP-MS: acquisition time 40 ms, dwell times Mg, Na, K, 7 ms and Ca 12 ms). Distribution of elements was visualized using ImageJ [104] by adjusting contrasts and using Look Up Table (LUT) menu. Colocalisation maps (Na with K, Mg, or Ca) were generated by merging channels in ImageJ. Number of counts in specific organs was estimated in two flowers per condition and per species using ROI (Regio Of Interest) manager by selecting an ovary, a style, one stamen, and a floral receptacle. The ratio between the number of counts of each element in the male part (one stamen) and female parts (ovary and style) and the ratio between vegetative (floral receptacle) and reproductive (stamen, ovary, and style) parts were determined.
4.6. Transporters Expression Analysis by qRT-PCR
The expression of 10 genes coding for mineral transporters was analyzed. Genes were selected according to the literature [25,37,40,98,105,106,107] and on transcriptome profiling of inflorescences of tomato during salt stress imposition [96]. When the sequences were not described in tomato, sequences of tomato homologs were identified using nucleotide BLAST again National Center for Biotechnology Information (NCBI) and Sol Genomics Network (SGN) databases and alignment with BioEdit. A first bioinformatics study of the expression of these genes was analyzed via available databases (TomExpress, SGN, [96]). The obtained full-length tomato sequences were used for primer design using Primer3Plus [108]. The analyzed genes and primer sequences are described in Table S1.
Flowers at anthesis were collected at 35 DASt and stored in liquid nitrogen. RNA extraction was performed on three samples of 100 mg of flowers per condition and species using TRI Reagent Solution (Ambion, Austin, TX, USA) with DNase treatment (RQ1 DNase 1 U/µg Promega, Leiden, The Netherlands) according to the manufacturer’s instructions. First-strand cDNA was synthesized from 1 µg RNA using the Revertaid H Minus First Strand cDNA Synthesis Kit (ThermoFisher, Waltham, MA, USA). The concentration and purity of the RNA were measured using a NanoDrop ND-1000 spectrophotometer (Thermo Scientific, Villebon-sur-Yvette, France). Transcript levels were quantified in two independent qPCR (in triplicates for each of the three biological replicates) using the GoTaq qPCR Master Mix (Promega) in StepOnePlus Real-Time PCR systems (Applied Biosystems, Foster City, CA, USA). Cycling conditions were initial denaturation 10 min at 95 °C, then 40 cycles of 15 s at 95 °C, and 1 s at 60 °C. The tomato housekeeping genes LeEF1-α (Elongation factor 1-alpha, Solyc06g005060) and TIP41 (TIP41-like protein, Solyc10g049850) were used as reference genes [109]. Results were expressed using the ΔΔCt calculation method in arbitrary units by comparison to the expression of S. lycopersicum under control conditions, and normalization was carried out with LeEF1-α and TIP41. A melt-curve analysis was performed to check the specific amplifications.
4.7. Statistical Analysis
All statistical analyses were performed in RStudio (R Development Core Team, 2017). Normality distribution and homoscedasticity were verified using the Shapiro–Wilk and Levene’s tests, respectively, and data were transformed when required. When possible, two-way analysis of variance (ANOVA II) was used to compare species, salinity, and their interactions. Comparisons between the two species were analyzed using the Student’s test, the permutation Student’s t-test (if normality was not met), or the Wilcoxon test (if homoscedasticity was not met). For a single species, comparisons between NaCl treatments were made using one-way analysis of variance (ANOVA I), ANOVA I using the permutation test (if normality was not met), or the Kruskal–Wallis test (if homoscedasticity was not met), followed by appropriate post-hoc tests. Data are shown as means ± standard deviation. For results obtained by LA-ICP-MS, no statistical treatment was applied because of the lack of repetitions (two repetitions per condition and species). Statistical results are presented in Table S2.
Supplementary Materials
The following supporting information can be downloaded at: https://www.mdpi.com/article/10.3390/plants11050672/s1, Figure S1: Distribution of sodium (Na) in flowers of Solanum lycopersicum (top row) and Solanum chilense (bottom row) grown in perlite:vermiculite mixture supplied with 0, 60 and 100 mM NaCl as revealed by LA-ICP-MS (Laser ablation inductively coupled plasma mass spectroscopy) and visualized using ImageJ (version 1.53a) by using the same scale for all treatments. Colour legend represents the number of counts per pixel (20 × 20 µm2), the number of counts is linearly proportional to the Na concentration. Flowers are the same than in Figure 3, Figure S2: Distribution of potassium (K) in flowers of Solanum lycopersicum (top row) and Solanum chilense (bottom row). For details, see the legend of Figure S1, Figure S3: Distribution of calcium (Ca) in flowers of Solanum lycopersicum (top row) and Solanum chilense (bottom row). For details, see the legend of Figure S1, Figure S4: Distribution of magnesium (Mg) in flowers of Solanum lycopersicum (top row) and Solanum chilense (bottom row). For details, see the legend of Figure S1, Table S1: List of genes and their primers used for qRT-PCR and their efficiency, Table S2: Statistical results for the analyzed parameters.
Author Contributions
Conceptualization, S.B., S.L., J.-P.M. and M.Q.; methodology, S.B., P.P., J.T.v.E. and M.Q.; formal analysis, S.B. and M.Q.; investigation, S.B., P.P. and M.Š.; resources, M.Q., S.L., J.-P.M. and J.T.v.E.; writing—original draft preparation, S.B. and M.Q.; writing—review and editing, S.B., P.P., M.Š., J.T.v.E., J.-P.M., S.L. and M.Q.; supervision, M.Q.; project administration, M.Q., S.L. and J.-P.M.; funding acquisition, M.Q., S.L., J.-P.M. and J.T.v.E. All authors have read and agreed to the published version of the manuscript.
Funding
This research was funded by the Belgian “Fonds National de la Recherche” Scientifique (FRS-FNRS), grant number CDR J.0136.19, the FSR-UCLouvain 2018–2020, and by the WBI/Chili project number 17. P.P., M.Š. and J.T.v.E. acknowledge the support from the Slovenian Research Agency (ARRS), contracts numbers P1-0034, P1-0212, N1-0090 and J7-9418.
Data Availability Statement
The datasets generated during and/or analyzed during the current study are available from the corresponding author on reasonable request.
Acknowledgments
The authors are grateful to Brigitte Van Pee, Marie-Eve Renard, and Katarina Vogel-Mikuš for technical support. They also would like to thank the Fondation Universitaire de Belgique for its contribution to publication fees.
Conflicts of Interest
The authors declare no conflict of interest. The funders had no role in the design of the study; in the collection, analyses, or interpretation of data; in the writing of the manuscript; or in the decision to publish the results.
References
- FAOStats Tomato Yields and Cultivated Area of Tomato in the World. Available online: https://www.fao.org/faostat/en/#data/QCL (accessed on 28 January 2022).
- Gharbi, E.; Martínez, J.-P.; Benahmed, H.; Fauconnier, M.-L.; Lutts, S.; Quinet, M. Salicylic Acid Differently Impacts Ethylene and Polyamine Synthesis in the Glycophyte Solanum lycopersicum and the Wild-Related Halophyte Solanum chilense Exposed to Mild Salt Stress. Physiol. Plant. 2016, 158, 152–167. [Google Scholar] [CrossRef] [PubMed]
- Singh, R.P.; Prasad, P.V.V.; Reddy, K.R. Impacts of Changing Climate and Climate Variability on Seed Production and Seed Industry. In Advances in Agronomy; Elsevier: Rome, Italy, 2013; Volume 118, pp. 49–110. ISBN 978-0-12-405942-9. [Google Scholar]
- Dudley, L. Salinity in the Soil Environment. In Handbook of Plant and Crop Stress; Marcel Dekker, Inc.: New York, NY, USA, 1994; pp. 13–30. [Google Scholar]
- Campos, C.A.B.; Fernandes, P.D.; Gheyi, H.R.; Blanco, F.F.; Gonçalves, C.B.; Campos, S.A.F. Yield and Fruit Quality of Industrial Tomato under Saline Irrigation. Sci. Agric. 2006, 63, 146–152. [Google Scholar] [CrossRef]
- Gerszberg, A.; Hnatuszko-Konka, K. Tomato Tolerance to Abiotic Stress: A Review of Most Often Engineered Target Sequences. Plant Growth Regul. 2017, 83, 175–198. [Google Scholar] [CrossRef]
- Bai, Y.; Lindhout, P. Domestication and Breeding of Tomatoes: What Have We Gained and What Can We Gain in the Future? Ann. Bot. 2007, 100, 1085–1094. [Google Scholar] [CrossRef]
- Diouf, I.A.; Derivot, L.; Bitton, F.; Pascual, L.; Causse, M. Water Deficit and Salinity Stress Reveal Many Specific QTL for Plant Growth and Fruit Quality Traits in Tomato. Front. Plant Sci. 2018, 9, 279. [Google Scholar] [CrossRef]
- Rick, C.M.; Chetelat, R.T. Utilization of Related Wild Species for Tomato Improvement. Acta Hortic. 1995, 412, 21–38. [Google Scholar] [CrossRef]
- Miller, J.C.; Tanksley, S.D. RFLP Analysis of Phylogenetic Relationships and Genetic Variation in the Genus Lycopersicon. Theor. Appl. Genet. 1990, 80, 437–448. [Google Scholar] [CrossRef]
- Bretó, M.P.; Asins, M.J.; Carbonell, E.A. Genetic Variability in Lycopersicon Species and Their Genetic Relationships. Theor. Appl. Genet. 1993, 86, 113–120. [Google Scholar] [CrossRef]
- Asamizu, E.; Ezura, H. Inclusion of Tomato in the Genus Solanum as “Solanum lycopersicum” Is Evident from Phylogenetic Studies. J. Jpn. Soc. Hortic. Sci. 2009, 78, 3–5. [Google Scholar] [CrossRef]
- Peralta, I.E.; Spooner, D.M.; Knapp, S. Taxonomy of Wild Tomatoes and Their Relatives (Solanum Sect. Lycopersicoides, Sect. Juglandifolia, Sect. Lycopersicon; Solanaceae). Syst. Bot. Monogr. 2008, 84, 186. [Google Scholar]
- Dwivedi, S.L.; Scheben, A.; Edwards, D.; Spillane, C.; Ortiz, R. Assessing and Exploiting Functional Diversity in Germplasm Pools to Enhance Abiotic Stress Adaptation and Yield in Cereals and Food Legumes. Front. Plant Sci. 2017, 8. [Google Scholar] [CrossRef] [PubMed]
- Houston, J. Variability of Precipitation in the Atacama Desert: Its Causes and Hydrological Impact. Int. J. Climatol. 2006, 26, 2181–2198. [Google Scholar] [CrossRef]
- Chetelat, R.T.; Pertuzé, R.A.; Faúndez, L.; Graham, E.B.; Jones, C.M. Distribution, Ecology and Reproductive Biology of Wild Tomatoes and Related Nightshades from the Atacama Desert Region of Northern Chile. Euphytica 2009, 167, 77–93. [Google Scholar] [CrossRef]
- Nakazato, T.; Warren, D.L.; Moyle, L.C. Ecological and Geographic Modes of Species Divergence in Wild Tomatoes. Am. J. Bot. 2010, 97, 680–693. [Google Scholar] [CrossRef] [PubMed]
- Böndel, K.B.; Nosenko, T.; Stephan, W. Signatures of Natural Selection in Abiotic Stress-Responsive Genes of Solanum chilense. R. Soc. Open Sci. 2018, 5, 171198. [Google Scholar] [CrossRef] [PubMed]
- Ji, Y.; Scott, J.W.; Schuster, D.J.; Maxwell, D.P. Molecular Mapping of Ty-4, a New Tomato Yellow Leaf Curl Virus Resistance Locus on Chromosome 3 of Tomato. J. Am. Soc. Hortic. Sci. 2009, 134, 281–288. [Google Scholar] [CrossRef]
- Stamova, B.S.; Chetelat, R.T. Inheritance and Genetic Mapping of Cucumber Mosaic Virus Resistance Introgressed from Lycopersicon chilense into Tomato. Theor. Appl. Genet. 2000, 101, 527–537. [Google Scholar] [CrossRef]
- Martínez, J.-P.; Antúnez, A.; Pertuzé, R.; Acosta, M.D.P.; Palma, X.; Fuentes, L.; Ayala, A.; Araya, H.; Lutts, S. Effects of Saline Water on Water Status, Yield and Fruit Quality of Wild (Solanum chilense) and Domesticated (Solanum lycopersicum Var. Cerasiforme) Tomatoes. Exp. Agric. 2012, 48, 573–586. [Google Scholar] [CrossRef]
- Bolarín, M.C.; Pérez-Alfocea, F.; Cano, E.A.; Estañ, M.T.; Caro, M. Growth, Fruit Yield, and Ion Concentration in Tomato Genotypes after Pre- and Post-Emergence Salt Treatments. J. Am. Soc. Hortic. Sci. 1993, 118, 655–660. [Google Scholar] [CrossRef]
- Tapia, G.; Méndez, J.; Inostroza, L. Different Combinations of Morpho-Physiological Traits Are Responsible for Tolerance to Drought in Wild Tomatoes Solanum chilense and Solanum peruvianum. Plant Biol. 2016, 18, 406–416. [Google Scholar] [CrossRef]
- Samineni, S.; Siddique, K.H.M.; Gaur, P.M.; Colmer, T.D. Salt Sensitivity of the Vegetative and Reproductive Stages in Chickpea (Cicer arietinum L.): Podding Is a Particularly Sensitive Stage. Environ. Exp. Bot. 2011, 71, 260–268. [Google Scholar] [CrossRef]
- Romero-Aranda, M.R.; González-Fernández, P.; Pérez-Tienda, J.R.; López-Diaz, M.R.; Espinosa, J.; Granum, E.; Traverso, J.Á.; Pineda, B.; Garcia-Sogo, B.; Moreno, V.; et al. Na+ Transporter HKT1;2 Reduces Flower Na+ Content and Considerably Mitigates the Decline in Tomato Fruit Yields under Saline Conditions. Plant Physiol. Biochem. 2020, 154, 341–352. [Google Scholar] [CrossRef] [PubMed]
- Martínez, J.P.; Fuentes, R.; Farías, K.; Lizana, C.; Alfaro, J.F.; Fuentes, L.; Calabrese, N.; Bigot, S.; Quinet, M.; Lutts, S. Effects of Salt Stress on Fruit Antioxidant Capacity of Wild (Solanum chilense) and Domesticated (Solanum lycopersicum Var. Cerasiforme) Tomatoes. Agronomy 2020, 10, 1481. [Google Scholar] [CrossRef]
- Delesalle, V.A.; Mazer, S.J. Nutrient Levels and Salinity Affect Gender and Floral Traits in the Autogamous Spergularia marina. Int. J. Plant Sci. 1996, 157, 621–631. [Google Scholar] [CrossRef]
- White, A.C.; Colmer, T.D.; Cawthray, G.R.; Hanley, M.E. Variable Response of Three Trifolium repens Ecotypes to Soil Flooding by Seawater. Ann. Bot. 2014, 114, 347–355. [Google Scholar] [CrossRef]
- Ghanem, M.E.; van Elteren, J.; Albacete, A.; Quinet, M.; Martínez-Andújar, C.; Kinet, J.-M.; Pérez-Alfocea, F.; Lutts, S. Impact of Salinity on Early Reproductive Physiology of Tomato (Solanum lycopersicum) in Relation to a Heterogeneous Distribution of Toxic Ions in Flower Organs. Funct. Plant Biol. 2009, 36, 125. [Google Scholar] [CrossRef]
- Liu, H.; Wang, C.; Chen, H.; Zhou, B. Genome-Wide Transcriptome Analysis Reveals the Molecular Mechanism of High Temperature-Induced Floral Abortion in Litchi chinensis. BMC Genom. 2019, 20, 127. [Google Scholar] [CrossRef]
- Shabala, S. Learning from Halophytes: Physiological Basis and Strategies to Improve Abiotic Stress Tolerance in Crops. Ann. Bot. 2013, 112, 1209–1221. [Google Scholar] [CrossRef]
- Wu, H. Plant Salt Tolerance and Na+ Sensing and Transport. Crop J. 2018, 6, 215–225. [Google Scholar] [CrossRef]
- Wang, Z.; Hong, Y.; Zhu, G.; Li, Y.; Niu, Q.; Yao, J.; Hua, K.; Bai, J.; Zhu, Y.; Shi, H.; et al. Loss of Salt Tolerance during Tomato Domestication Conferred by Variation in a Na+/K+ Transporter. EMBO J. 2020, 39, e103256. [Google Scholar] [CrossRef]
- Assaha, D.V.M.; Ueda, A.; Saneoka, H.; Al-Yahyai, R.; Yaish, M.W. The Role of Na+ and K+ Transporters in Salt Stress Adaptation in Glycophytes. Front. Physiol. 2017, 8, 509. [Google Scholar] [CrossRef] [PubMed]
- Basu, S.; Kumar, A.; Benazir, I.; Kumar, G. Reassessing the Role of Ion Homeostasis for Improving Salinity Tolerance in Crop Plants. Physiol. Plant. 2020, 174, 502–519. [Google Scholar] [CrossRef]
- Asins, M.J.; Raga, V.; Roca, D.; Belver, A.; Carbonell, E.A. Genetic Dissection of Tomato Rootstock Effects on Scion Traits under Moderate Salinity. Theor. Appl. Genet. 2015, 128, 667–679. [Google Scholar] [CrossRef] [PubMed]
- McCubbin, T.; Bassil, E.; Zhang, S.; Blumwald, E. Vacuolar Na+/H+ NHX-Type Antiporters Are Required for Cellular K+ Homeostasis, Microtubule Organization and Directional Root Growth. Plants 2014, 3, 409–426. [Google Scholar] [CrossRef] [PubMed]
- Bassil, E.; Zhang, S.; Gong, H.; Tajima, H.; Blumwald, E. Cation Specificity of Vacuolar NHX-Type Cation/H+ Antiporters. Plant Physiol. 2019, 179, 616–629. [Google Scholar] [CrossRef] [PubMed]
- Rubio, F.; Fon, M.; Ródenas, R.; Nieves-Cordones, M.; Alemán, F.; Rivero, R.M.; Martínez, V. A Low K+ Signal Is Required for Functional High-Affinity K+ Uptake through HAK5 Transporters. Physiol. Plant. 2014, 152, 558–570. [Google Scholar] [CrossRef]
- Deeken, R.; Geiger, D.; Fromm, J.; Koroleva, O.; Ache, P.; Langenfeld-Heyser, R.; Sauer, N.; May, S.; Hedrich, R. Loss of the AKT2/3 Potassium Channel Affects Sugar Loading into the Phloem of Arabidopsis. Planta 2002, 216, 334–344. [Google Scholar] [CrossRef]
- Maathuis, F.J.M. The Role of Monovalent Cation Transporters in Plant Responses to Salinity. J. Exp. Bot. 2006, 57, 1137–1147. [Google Scholar] [CrossRef]
- Quinet, M.; Kinet, J.-M. Transition to Flowering and Morphogenesis of Reproductive Structures in Tomato. Int. J. Plant Dev. Biol. 2007, 1, 64–74. [Google Scholar]
- Soyk, S.; Müller, N.A.; Park, S.J.; Schmalenbach, I.; Jiang, K.; Hayama, R.; Zhang, L.; Van Eck, J.; Jiménez-Gómez, J.M.; Lippman, Z.B. Variation in the Flowering Gene SELF PRUNING 5G Promotes Day-Neutrality and Early Yield in Tomato. Nat. Genet. 2017, 49, 162–168. [Google Scholar] [CrossRef]
- Welty, N.; Radovich, C.; Meulia, T.; van der Knaap, E. Inflorescence Development in Two Tomato Species. Can. J. Bot. 2007, 85, 111–118. [Google Scholar] [CrossRef][Green Version]
- Aref, F.; Rad, H.E. Physiological Characterization of Rice under Salinity Stress during Vegetative and Reproductive Stages. Indian J. Sci. Technol. 2012, 5, 10. [Google Scholar] [CrossRef]
- Lozano, R.; Angosto, T.; Gómez, P.; Payán, C.; Capel, J.; Huijser, P.; Salinas, J.; Martínez-Zapater, J.M. Tomato Flower Abnormalities Induced by Low Temperatures Are Associated with Changes of Expression of MADS-Box Genes. Plant Physiol. 1998, 117, 91–100. [Google Scholar] [CrossRef] [PubMed]
- Giorno, F.; Wolters-Arts, M.; Mariani, C.; Rieu, I. Ensuring Reproduction at High Temperatures: The Heat Stress Response during Anther and Pollen Development. Plants 2013, 2, 489–506. [Google Scholar] [CrossRef]
- Stanton, M.L.; Preston, R.E. Ecological Consequences and Phenotypic Correlates of Petal Size Variation in Wild Radish, Raphanus sativus (Brassicaceae). Am. J. Bot. 1988, 75, 528–539. [Google Scholar] [CrossRef]
- Descamps, C.; Boubnan, N.; Jacquemart, A.-L.; Quinet, M. Growing and Flowering in a Changing Climate: Effects of Higher Temperatures and Drought Stress on the Bee-Pollinated Species Impatiens glandulifera Royle. Plants 2021, 10, 988. [Google Scholar] [CrossRef]
- Descamps, C.; Quinet, M.; Baijot, A.; Jacquemart, A.-L. Temperature and Water Stress Affect Plant-Pollinator Interactions in Borago officinalis (Boraginaceae). Ecol. Evol. 2018, 8, 3443–3456. [Google Scholar] [CrossRef]
- Zhang, Z.; Hu, M.; Xu, W.; Wang, Y.; Huang, K.; Zhang, C.; Wen, J. Understanding the Molecular Mechanism of Anther Development under Abiotic Stresses. Plant Mol. Biol. 2021, 105, 1–10. [Google Scholar] [CrossRef]
- Xu, J.; Wolters-Arts, M.; Mariani, C.; Huber, H.; Rieu, I. Heat Stress Affects Vegetative and Reproductive Performance and Trait Correlations in Tomato (Solanum lycopersicum). Euphytica 2017, 213, 156. [Google Scholar] [CrossRef]
- Pan, C.; Yang, D.; Zhao, X.; Jiao, C.; Yan, Y.; Lamin-Samu, A.T.; Wang, Q.; Xu, X.; Fei, Z.; Lu, G. Tomato Stigma Exsertion Induced by High Temperature Is Associated with the Jasmonate Signalling Pathway. Plant Cell Environ. 2019, 42, 1205–1221. [Google Scholar] [CrossRef]
- Baby, T.; Collins, C.; Tyerman, S.D.; Gilliham, M. Salinity Negatively Affects Pollen Tube Growth and Fruit Set in Grapevines and Is Not Mitigated by Silicon. Am. J. Enol. Vitic. 2016, 67, 218–228. [Google Scholar] [CrossRef]
- Herrera, C.M. Post-Floral Perianth Functionality: Contribution of Persistent Sepals to Seed Development in Helleborus foetidus (Ranunculaceae). Am. J. Bot. 2005, 92, 1486–1491. [Google Scholar] [CrossRef] [PubMed]
- Hetherington, S.E.; Smillie, R.M.; Davies, W.J. Photosynthetic Activities of Vegetative and Fruiting Tissues of Tomato. J. Exp. Bot. 1998, 49, 1173–1181. [Google Scholar] [CrossRef]
- Lytovchenko, A.; Eickmeier, I.; Pons, C.; Osorio, S.; Szecowka, M.; Lehmberg, K.; Arrivault, S.; Tohge, T.; Pineda, B.; Anton, M.T.; et al. Tomato Fruit Photosynthesis Is Seemingly Unimportant in Primary Metabolism and Ripening but Plays a Considerable Role in Seed Development. Plant Physiol. 2011, 157, 1650–1663. [Google Scholar] [CrossRef] [PubMed]
- El-Mogy, M.M.; Garchery, C.; Stevens, R. Irrigation with Salt Water Affects Growth, Yield, Fruit Quality, Storability and Marker-Gene Expression in Cherry Tomato. Acta Agric. Scand. Sect. B Soil Plant Sci. 2018, 68, 727–737. [Google Scholar] [CrossRef]
- Karapanos, I.C.; Mahmood, S.; Thanopoulos, C. Fruit Set in Solanaceous Vegetable Crops as Affected by Floral and Environmental Factors. Eur. J. Plant Sci. Biotechnol. 2008, 1, 88–105. [Google Scholar]
- Khatun, S.; Flowers, T.J. Effects of Salinity on Seed Set in Rice. Plant Cell Environ. 1995, 18, 61–67. [Google Scholar] [CrossRef]
- An, D.; Chen, J.-G.; Gao, Y.-Q.; Li, X.; Chao, Z.-F.; Chen, Z.-R.; Li, Q.-Q.; Han, M.-L.; Wang, Y.-L.; Wang, Y.-F.; et al. AtHKT1 Drives Adaptation of Arabidopsis thaliana to Salinity by Reducing Floral Sodium Content. PLoS Genet. 2017, 13, e1007086. [Google Scholar] [CrossRef]
- Vromman, D.; Lutts, S.; Lefèvre, I.; Somer, L.; De Vreese, O.; Šlejkovec, Z.; Quinet, M. Effects of Simultaneous Arsenic and Iron Toxicities on Rice (Oryza sativa L.) Development, Yield-Related Parameters and As and Fe Accumulation in Relation to As Speciation in the Grains. Plant Soil 2013, 371, 199–217. [Google Scholar] [CrossRef]
- Han, R.; Quinet, M.; André, E.; van Elteren, J.T.; Destrebecq, F.; Vogel-Mikuš, K.; Cui, G.; Debeljak, M.; Lefèvre, I.; Lutts, S. Accumulation and Distribution of Zn in the Shoots and Reproductive Structures of the Halophyte Plant Species Kosteletzkya virginica as a Function of Salinity. Planta 2013, 238, 441–457. [Google Scholar] [CrossRef]
- Gharbi, E.; Martínez, J.-P.; Benahmed, H.; Lepoint, G.; Vanpee, B.; Quinet, M.; Lutts, S. Inhibition of Ethylene Synthesis Reduces Salt-Tolerance in Tomato Wild Relative Species Solanum chilense. J. Plant Physiol. 2017, 210, 24–37. [Google Scholar] [CrossRef] [PubMed]
- Bacha, H.; Tekaya, M.; Drine, S.; Guasmi, F.; Touil, L.; Enneb, H.; Triki, T.; Cheour, F.; Ferchichi, A. Impact of Salt Stress on Morpho-Physiological and Biochemical Parameters of Solanum lycopersicum Cv. Microtom Leaves. S. Afr. J. Bot. 2017, 108, 364–369. [Google Scholar] [CrossRef]
- Müller, F.; Xu, J.; Kristensen, L.; Wolters-Arts, M.; de Groot, P.F.M.; Jansma, S.Y.; Mariani, C.; Park, S.; Rieu, I. High-Temperature-Induced Defects in Tomato (Solanum lycopersicum) Anther and Pollen Development Are Associated with Reduced Expression of B-Class Floral Patterning Genes. PLoS ONE 2016, 11, e0167614. [Google Scholar] [CrossRef]
- Bassil, E.; Tajima, H.; Liang, Y.-C.; Ohto, M.; Ushijima, K.; Nakano, R.; Esumi, T.; Coku, A.; Belmonte, M.; Blumwald, E. The Arabidopsis Na+/H+ Antiporters NHX1 and NHX2 Control Vacuolar PH and K+ Homeostasis to Regulate Growth, Flower Development, and Reproduction. Plant Cell 2011, 23, 3482–3497. [Google Scholar] [CrossRef]
- Gharbi, E.; Martínez, J.-P.; Benahmed, H.; Hichri, I.; Dobrev, P.I.; Motyka, V.; Quinet, M.; Lutts, S. Phytohormone Profiling in Relation to Osmotic Adjustment in NaCl-Treated Plants of the Halophyte Tomato Wild Relative Species Solanum chilense Comparatively to the Cultivated Glycophyte Solanum lycopersicum. Plant Sci. 2017, 258, 77–89. [Google Scholar] [CrossRef]
- Wakeel, A.; Farooq, M.; Qadir, M.; Schubert, S. Potassium Substitution by Sodium in Plants. Crit. Rev. Plant Sci. 2011, 30, 401–413. [Google Scholar] [CrossRef]
- Hu, W.; Coomer, T.D.; Loka, D.A.; Oosterhuis, D.M.; Zhou, Z. Potassium Deficiency Affects the Carbon-Nitrogen Balance in Cotton Leaves. Plant Physiol. Biochem. 2017, 115, 408–417. [Google Scholar] [CrossRef]
- Rehman, S.; Yun, S.J. Developmental Regulation of K Accumulation in Pollen, Anthers, and Papillae: Are Anther Dehiscence, Papillae Hydration, and Pollen Swelling Leading to Pollination and Fertilization in Barley (Hordeum vulgare L.) Regulated by Changes in K Concentration? J. Exp. Bot. 2006, 57, 1315–1321. [Google Scholar] [CrossRef]
- Chen, Y.; Ma, J.; Miller, A.J.; Luo, B.; Wang, M.; Zhu, Z.; Ouwerkerk, P.B.F. OsCHX14 Is Involved in the K+ Homeostasis in Rice (Oryza sativa) Flowers. Plant Cell Physiol. 2016, 57, 1530–1543. [Google Scholar] [CrossRef]
- Mel, V.C.; Bado, V.B.; Ndiaye, S.; Djaman, K.; Aissata Bama Nati, D.; Manneh, B.; Futakuchi, K. Predicting Rice Yield under Salinity Stress Using K/Na Ratio Variable in Plant Tissue. Commun. Soil Sci. Plant Anal. 2019, 50, 1321–1329. [Google Scholar] [CrossRef]
- Albaladejo, I.; Meco, V.; Plasencia, F.; Flores, F.B.; Bolarin, M.C.; Egea, I. Unravelling the Strategies Used by the Wild Tomato Species Solanum pennellii to Confront Salt Stress: From Leaf Anatomical Adaptations to Molecular Responses. Environ. Exp. Bot. 2017, 135, 1–12. [Google Scholar] [CrossRef]
- Nieves-Cordones, M.; Al Shiblawi, F.R.; Sentenac, H. Roles and Transport of Sodium and Potassium in Plants. In The Alkali Metal Ions: Their Role for Life; Sigel, A., Sigel, H., Sigel, R.K.O., Eds.; Springer International Publishing: Cham, Switzerland, 2016; Volume 16, pp. 291–324. ISBN 978-3-319-21755-0. [Google Scholar]
- Li, J.; Huang, Y.; Tan, H.; Yang, X.; Tian, L.; Luan, S.; Chen, L.; Li, D. An Endoplasmic Reticulum Magnesium Transporter Is Essential for Pollen Development in Arabidopsis. Plant Sci. 2015, 231, 212–220. [Google Scholar] [CrossRef] [PubMed]
- Cakmak, I.; Kirkby, E.A. Role of Magnesium in Carbon Partitioning and Alleviating Photooxidative Damage. Physiol. Plant. 2008, 133, 692–704. [Google Scholar] [CrossRef] [PubMed]
- Steinhorst, L.; Kudla, J. Calcium—A Central Regulator of Pollen Germination and Tube Growth. Biochim. Biophys. Acta BBA Mol. Cell Res. 2013, 1833, 1573–1581. [Google Scholar] [CrossRef]
- Hocking, B.; Tyerman, S.D.; Burton, R.A.; Gilliham, M. Fruit Calcium: Transport and Physiology. Front. Plant Sci. 2016, 7, 569. [Google Scholar] [CrossRef]
- Ishitani, M.; Liu, J.; Halfter, U.; Kim, C.-S.; Shi, W.; Zhu, J.-K. SOS3 Function in Plant Salt Tolerance Requires N-Myristoylation and Calcium Binding. Plant Cell 2000, 12, 1667–1677. [Google Scholar] [CrossRef]
- Belver, A.; Olías, R.; Huertas, R.; Rodríguez-Rosales, M.P. Involvement of SlSOS2 in Tomato Salt Tolerance. Bioengineered 2012, 3, 298–302. [Google Scholar] [CrossRef]
- Li, D.; Ma, N.-N.; Wang, J.-R.; Yang, D.-Y.; Zhao, S.-J.; Meng, Q.-W. Overexpression of Tomato Enhancer of SOS3-1 (LeENH1) in Tobacco Enhanced Salinity Tolerance by Excluding Na+ from the Cytosol. Plant Physiol. Biochem. 2013, 70, 150–158. [Google Scholar] [CrossRef]
- Ji, H.; Pardo, J.M.; Batelli, G.; Van Oosten, M.J.; Bressan, R.A.; Li, X. The Salt Overly Sensitive (SOS) Pathway: Established and Emerging Roles. Mol. Plant 2013, 6, 275–286. [Google Scholar] [CrossRef]
- Álvarez-Aragón, R.; Haro, R.; Benito, B.; Rodríguez-Navarro, A. Salt Intolerance in Arabidopsis: Shoot and Root Sodium Toxicity, and Inhibition by Sodium-plus-Potassium Overaccumulation. Planta 2016, 243, 97–114. [Google Scholar] [CrossRef]
- Almeida, D.M.; Oliveira, M.M.; Saibo, N.J.M. Regulation of Na+ and K+ Homeostasis in Plants: Towards Improved Salt Stress Tolerance in Crop Plants. Genet. Mol. Biol. 2017, 40, 326–345. [Google Scholar] [CrossRef]
- Shi, H.; Lee, B.; Wu, S.-J.; Zhu, J.-K. Overexpression of a Plasma Membrane Na+/H+ Antiporter Gene Improves Salt Tolerance in Arabidopsis thaliana. Nat. Biotechnol. 2003, 21, 81–85. [Google Scholar] [CrossRef]
- Huertas, R.; Olías, R.; Eljakaoui, Z.; Gálvez, F.J.; Li, J.; De Morales, P.A.; Belver, A.; Rodríguez-Rosales, M.P. Overexpression of SlSOS2 (SlCIPK24) Confers Salt Tolerance to Transgenic Tomato: SlSOS2 and Tomato Salt Tolerance. Plant Cell Environ. 2012, 35, 1467–1482. [Google Scholar] [CrossRef]
- Batelli, G.; Verslues, P.E.; Agius, F.; Qiu, Q.; Fujii, H.; Pan, S.; Schumaker, K.S.; Grillo, S.; Zhu, J.-K. SOS2 Promotes Salt Tolerance in Part by Interacting with the Vacuolar H+-ATPase and Upregulating Its Transport Activity. Mol. Cell. Biol. 2007, 27, 7781–7790. [Google Scholar] [CrossRef] [PubMed]
- Ariga, H.; Katori, T.; Yoshihara, R.; Hase, Y.; Nozawa, S.; Narumi, I.; Iuchi, S.; Kobayashi, M.; Tezuka, K.; Sakata, Y.; et al. Arabidopsis Sos1 Mutant in a Salt-Tolerant Accession Revealed an Importance of Salt Acclimation Ability in Plant Salt Tolerance. Plant Signal. Behav. 2013, 8, e24779. [Google Scholar] [CrossRef] [PubMed]
- Leidi, E.O.; Barragán, V.; Rubio, L.; El-Hamdaoui, A.; Ruiz, M.T.; Cubero, B.; Fernández, J.A.; Bressan, R.A.; Hasegawa, P.M.; Quintero, F.J.; et al. The AtNHX1 Exchanger Mediates Potassium Compartmentation in Vacuoles of Transgenic Tomato. Plant J. 2010, 61, 495–506. [Google Scholar] [CrossRef] [PubMed]
- Gálvez, F.J.; Baghour, M.; Hao, G.; Cagnac, O.; Rodríguez-Rosales, M.P.; Venema, K. Expression of LeNHX Isoforms in Response to Salt Stress in Salt Sensitive and Salt Tolerant Tomato Species. Plant Physiol. Biochem. 2012, 51, 109–115. [Google Scholar] [CrossRef]
- Villalta, I.; Reina-Sánchez, A.; Bolarín, M.C.; Cuartero, J.; Belver, A.; Venema, K.; Carbonell, E.A.; Asins, M.J. Genetic Analysis of Na+ and K+ Concentrations in Leaf and Stem as Physiological Components of Salt Tolerance in Tomato. Theor. Appl. Genet. 2008, 116, 869–880. [Google Scholar] [CrossRef]
- Almeida, P.; de Boer, G.-J.; de Boer, A.H. Differences in Shoot Na+ Accumulation between Two Tomato Species Are Due to Differences in Ion Affinity of HKT1;2. J. Plant Physiol. 2014, 171, 438–447. [Google Scholar] [CrossRef]
- Suzuki, K.; Yamaji, N.; Costa, A.; Okuma, E.; Kobayashi, N.I.; Kashiwagi, T.; Katsuhara, M.; Wang, C.; Tanoi, K.; Murata, Y.; et al. OsHKT1;4-Mediated Na+ Transport in Stems Contributes to Na+ Exclusion from Leaf Blades of Rice at the Reproductive Growth Stage upon Salt Stress. BMC Plant Biol. 2016, 16, 22. [Google Scholar] [CrossRef]
- Deeken, R.; Sanders, C.; Ache, P.; Hedrich, R. Developmental and Light-Dependent Regulation of a Phloem-Localised K+ Channel of Arabidopsis thaliana: Regulation of Akt2/3-MRNA Expression. Plant J. 2000, 23, 285–290. [Google Scholar] [CrossRef] [PubMed]
- Zouine, M.; Maza, E.; Djari, A.; Lauvernier, M.; Frasse, P.; Smouni, A.; Pirrello, J.; Bouzayen, M. TomExpress, a Unified Tomato RNA-Seq Platform for Visualization of Expression Data, Clustering and Correlation Networks. Plant J. 2017, 92, 727–735. [Google Scholar] [CrossRef] [PubMed]
- Liu, J.; Liu, J.; Liu, J.; Cui, M.; Huang, Y.; Tian, Y.; Chen, A.; Xu, G. The Potassium Transporter SlHAK10 Is Involved in Mycorrhizal Potassium Uptake. Plant Physiol. 2019, 180, 465–479. [Google Scholar] [CrossRef]
- Jin, Y.; Jing, W.; Zhang, Q.; Zhang, W. Cyclic Nucleotide Gated Channel 10 Negatively Regulates Salt Tolerance by Mediating Na+ Transport in Arabidopsis. J. Plant Res. 2015, 128, 211–220. [Google Scholar] [CrossRef] [PubMed]
- Dafni, A.; Maués, M.M. A Rapid and Simple Procedure to Determine Stigma Receptivity. Sex. Plant Reprod. 1998, 11, 177–180. [Google Scholar] [CrossRef]
- Alexander, M.P. Differential Staining of Aborted and Nonaborted Pollen. Stain Technol. 1969, 44, 117–122. [Google Scholar] [CrossRef]
- Ayenan, M.A.T.; Danquah, A.; Ampomah-Dwamena, C.; Hanson, P.; Asante, I.K.; Danquah, E.Y. Optimizing Pollencounter for High Throughput Phenotyping of Pollen Quality in Tomatoes. MethodsX 2020, 7, 100977. [Google Scholar] [CrossRef]
- van Acker, T.; Van Malderen, S.J.M.; Van Helden, T.; Stremtan, C.; Šala, M.; van Elteren, J.T.; Vanhaecke, F. Analytical Figures of Merit of a Low-Dispersion Aerosol Transport System for High-Throughput LA-ICP-MS Analysis. J. Anal. At. Spectrom. 2021, 36, 1201–1209. [Google Scholar] [CrossRef]
- van Elteren, J.T.; Šelih, V.S.; Šala, M. Insights into the Selection of 2D LA-ICP-MS (Multi)Elemental Mapping Conditions. J. Anal. At. Spectrom. 2019, 34, 1919–1931. [Google Scholar] [CrossRef]
- Schindelin, J.; Arganda-Carreras, I.; Frise, E.; Kaynig, V.; Longair, M.; Pietzsch, T.; Preibisch, S.; Rueden, C.; Saalfeld, S.; Schmid, B.; et al. Fiji: An Open-Source Platform for Biological-Image Analysis. Nat. Methods 2012, 9, 676–682. [Google Scholar] [CrossRef]
- Olías, R.; Eljakaoui, Z.; Li, J.; De Morales, P.A.; Marín-Manzano, M.C.; Pardo, J.M.; Belver, A. The Plasma Membrane Na+/H+ Antiporter SOS1 Is Essential for Salt Tolerance in Tomato and Affects the Partitioning of Na+ between Plant Organs. Plant Cell Environ. 2009, 32, 904–916. [Google Scholar] [CrossRef] [PubMed]
- Asins, M.J.; Villalta, I.; Aly, M.M.; Olías, R.; Álvarez De Morales, P.; Huertas, R.; Li, J.; Jaime-Pérez, N.; Haro, R.; Raga, V.; et al. Two Closely Linked Tomato HKT Coding Genes Are Positional Candidates for the Major Tomato QTL Involved in Na+/K+ Homeostasis: HKT Genes Likely to Underlie a Major Tomato QTL. Plant Cell Environ. 2013, 36, 1171–1191. [Google Scholar] [CrossRef] [PubMed]
- Jaime-Pérez, N.; Pineda, B.; García-Sogo, B.; Atares, A.; Athman, A.; Byrt, C.S.; Olías, R.; Asins, M.J.; Gilliham, M.; Moreno, V.; et al. The Sodium Transporter Encoded by the HKT1;2 Gene Modulates Sodium/Potassium Homeostasis in Tomato Shoots under Salinity. Plant Cell Environ. 2017, 40, 658–671. [Google Scholar] [CrossRef]
- Untergasser, A.; Nijveen, H.; Rao, X.; Bisseling, T.; Geurts, R.; Leunissen, J.A.M. Primer3Plus, an Enhanced Web Interface to Primer3. Nucleic Acids Res. 2007, 35, W71–W74. [Google Scholar] [CrossRef]
- Leelatanawit, R.; Saetung, T.; Phuengwas, S.; Karoonuthaisiri, N.; Devahastin, S. Selection of Reference Genes for Quantitative Real-Time PCR in Postharvest Tomatoes (Lycopersicon esculentum) Treated by Continuous Low-Voltage Direct Current Electricity to Increase Secondary Metabolites. Int. J. Food Sci. Technol. 2017, 52, 1942–1950. [Google Scholar] [CrossRef]


Publisher’s Note: MDPI stays neutral with regard to jurisdictional claims in published maps and institutional affiliations. |
© 2022 by the authors. Licensee MDPI, Basel, Switzerland. This article is an open access article distributed under the terms and conditions of the Creative Commons Attribution (CC BY) license (https://creativecommons.org/licenses/by/4.0/).