
The Relevance of Discovering and Recovering the Biodiversity of Apulian Almond Germplasm by Means of Molecular and Phenotypic Markers

 ,
,  , ,
, ,  and
and
Abstract
1. Introduction
2. Results and Discussion
2.1. SSR Polymorphism

| SSR Locus | Size | Na | Ne | Ho | He | F | I | PIC | Nu |
|---|---|---|---|---|---|---|---|---|---|
| BPPCT001 | 101–159 | 21.0 | 5.627 | 0.408 | 0.822 | 0.504 | 2.197 | 0.805 | 0.3486 |
| BPPCT007 | 119–159 | 15.0 | 6.704 | 0.754 | 0.851 | 0.114 | 2.091 | 0.834 | 0.0573 |
| BPPCT010 | 122–162 | 18.0 | 8.193 | 0.832 | 0.878 | 0.052 | 2.336 | 0.866 | 0.0229 |
| BPPCT014 | 178–198 | 5.0 | 2.236 | 0.556 | 0.553 | −0.006 | 0.926 | 0.453 | −0.0060 |
| BPPCT025 | 149–197 | 22.0 | 6.095 | 0.780 | 0.836 | 0.067 | 2.226 | 0.820 | 0.0338 |
| CPDCT025 | 156–198 | 14.0 | 4.576 | 0.747 | 0.781 | 0.044 | 1.954 | 0.764 | 0.0192 |
| CPDCT042 | 160–222 | 21.0 | 7.227 | 0.819 | 0.862 | 0.049 | 2.319 | 0.849 | 0.0262 |
| CPDCT045 | 126–176 | 20.0 | 11.001 | 0.935 | 0.909 | −0.028 | 2.608 | 0.902 | −0.0154 |
| CPPCT006 | 172–206 | 18.0 | 8.385 | 0.860 | 0.881 | 0.023 | 2.367 | 0.870 | 0.0108 |
| CPPCT033 | 127–165 | 13.0 | 4.575 | 0.766 | 0.781 | 0.019 | 1.814 | 0.750 | 0.0069 |
| CPSCT012 | 140–186 | 17.0 | 3.495 | 0.572 | 0.714 | 0.198 | 1.835 | 0.699 | 0.1181 |
| CPSCT018 | 145–177 | 14.0 | 7.086 | 0.472 | 0.859 | 0.451 | 2.169 | 0.843 | 0.2918 |
| EPPCU5176 | 106–134 | 16.0 | 4.168 | 0.746 | 0.760 | 0.019 | 1.838 | 0.730 | 0.0075 |
| PCHGMS1 | 180–222 | 14.0 | 7.067 | 0.797 | 0.859 | 0.072 | 2.135 | 0.843 | 0.0364 |
| UDP96003 | 87–137 | 14.0 | 3.488 | 0.713 | 0.713 | 0.000 | 1.678 | 0.681 | −0.0011 |
| UDP96005 | 126–196 | 22.0 | 6.535 | 0.759 | 0.847 | 0.103 | 2.337 | 0.835 | 0.0581 |
| UDP98409 | 120–170 | 19.0 | 3.553 | 0.335 | 0.719 | 0.534 | 1.930 | 0.706 | 0.3725 |
| UDP98412 | 94–134 | 15.0 | 6.231 | 0.376 | 0.840 | 0.552 | 2.177 | 0.824 | 0.3803 |
| Mean value | - | 16.5 | 6.105 | 0.711 | 0.807 | 0.116 | 2.052 | 0.783 | 0.0709 |
| Genotypes with LRM = 0.5 | ||
|---|---|---|
| Mollesca di Ruvo | Stilla | 0.50 |
| Mollesca di Ruvo | Troito | 0.50 |
| Stilla | Troito | 0.50 |
| Mollesca di Ruvo | Tuono | 0.50 |
| Stilla | Tuono | 0.50 |
| Troito | Tuono | 0.50 |
| Genotypes with 0.4 < LRM < 0.5 | ||
| Bianchetta | Lunghina | 0.49 |
| Del lago | Rachele tenera | 0.48 |
| Riviezzo Grosso | Riviezzo Piccolo | 0.47 |
| San Giuseppe_2 | Troia | 0.46 |
| Mollesca di Ruvo | Mollese grossa_2 | 0.45 |
| Mollese grossa_2 | Stilla | 0.45 |
| Mollese grossa_2 | Troito | 0.45 |
| Mollese grossa_2 | Tuono | 0.45 |
| Bianchetta | Secolare Cotogni | 0.45 |
| Ficanera | Mollese di canneto | 0.44 |
| Ciavea | San Michele strada | 0.44 |
| Chino | Rachele tenera | 0.44 |
| Don Carlo | San Michele strada | 0.44 |
| Lunghina | Secolare Cotogni | 0.44 |
| Montranese | Zin Zin | 0.43 |
| Pilella | Scquicciarina | 0.43 |
| Chino | Del lago | 0.43 |
| Gianfreda | Riviezzo Grosso | 0.42 |
| Mollesca di Ruvo | Piangente | 0.42 |
| Piangente | Stilla | 0.42 |
| Piangente | Troito | 0.42 |
| Piangente | Tuono | 0.42 |
| Pettolecchia | Strappasacco | 0.42 |
| Gianfreda | Riviezzo Piccolo | 0.41 |
| Portone Gioia | San Michele strada | 0.41 |
| Ciavea | Zin Zin | 0.41 |
| Ferrante | Sciddiata Nisi | 0.40 |
2.2. Genetic Characterization

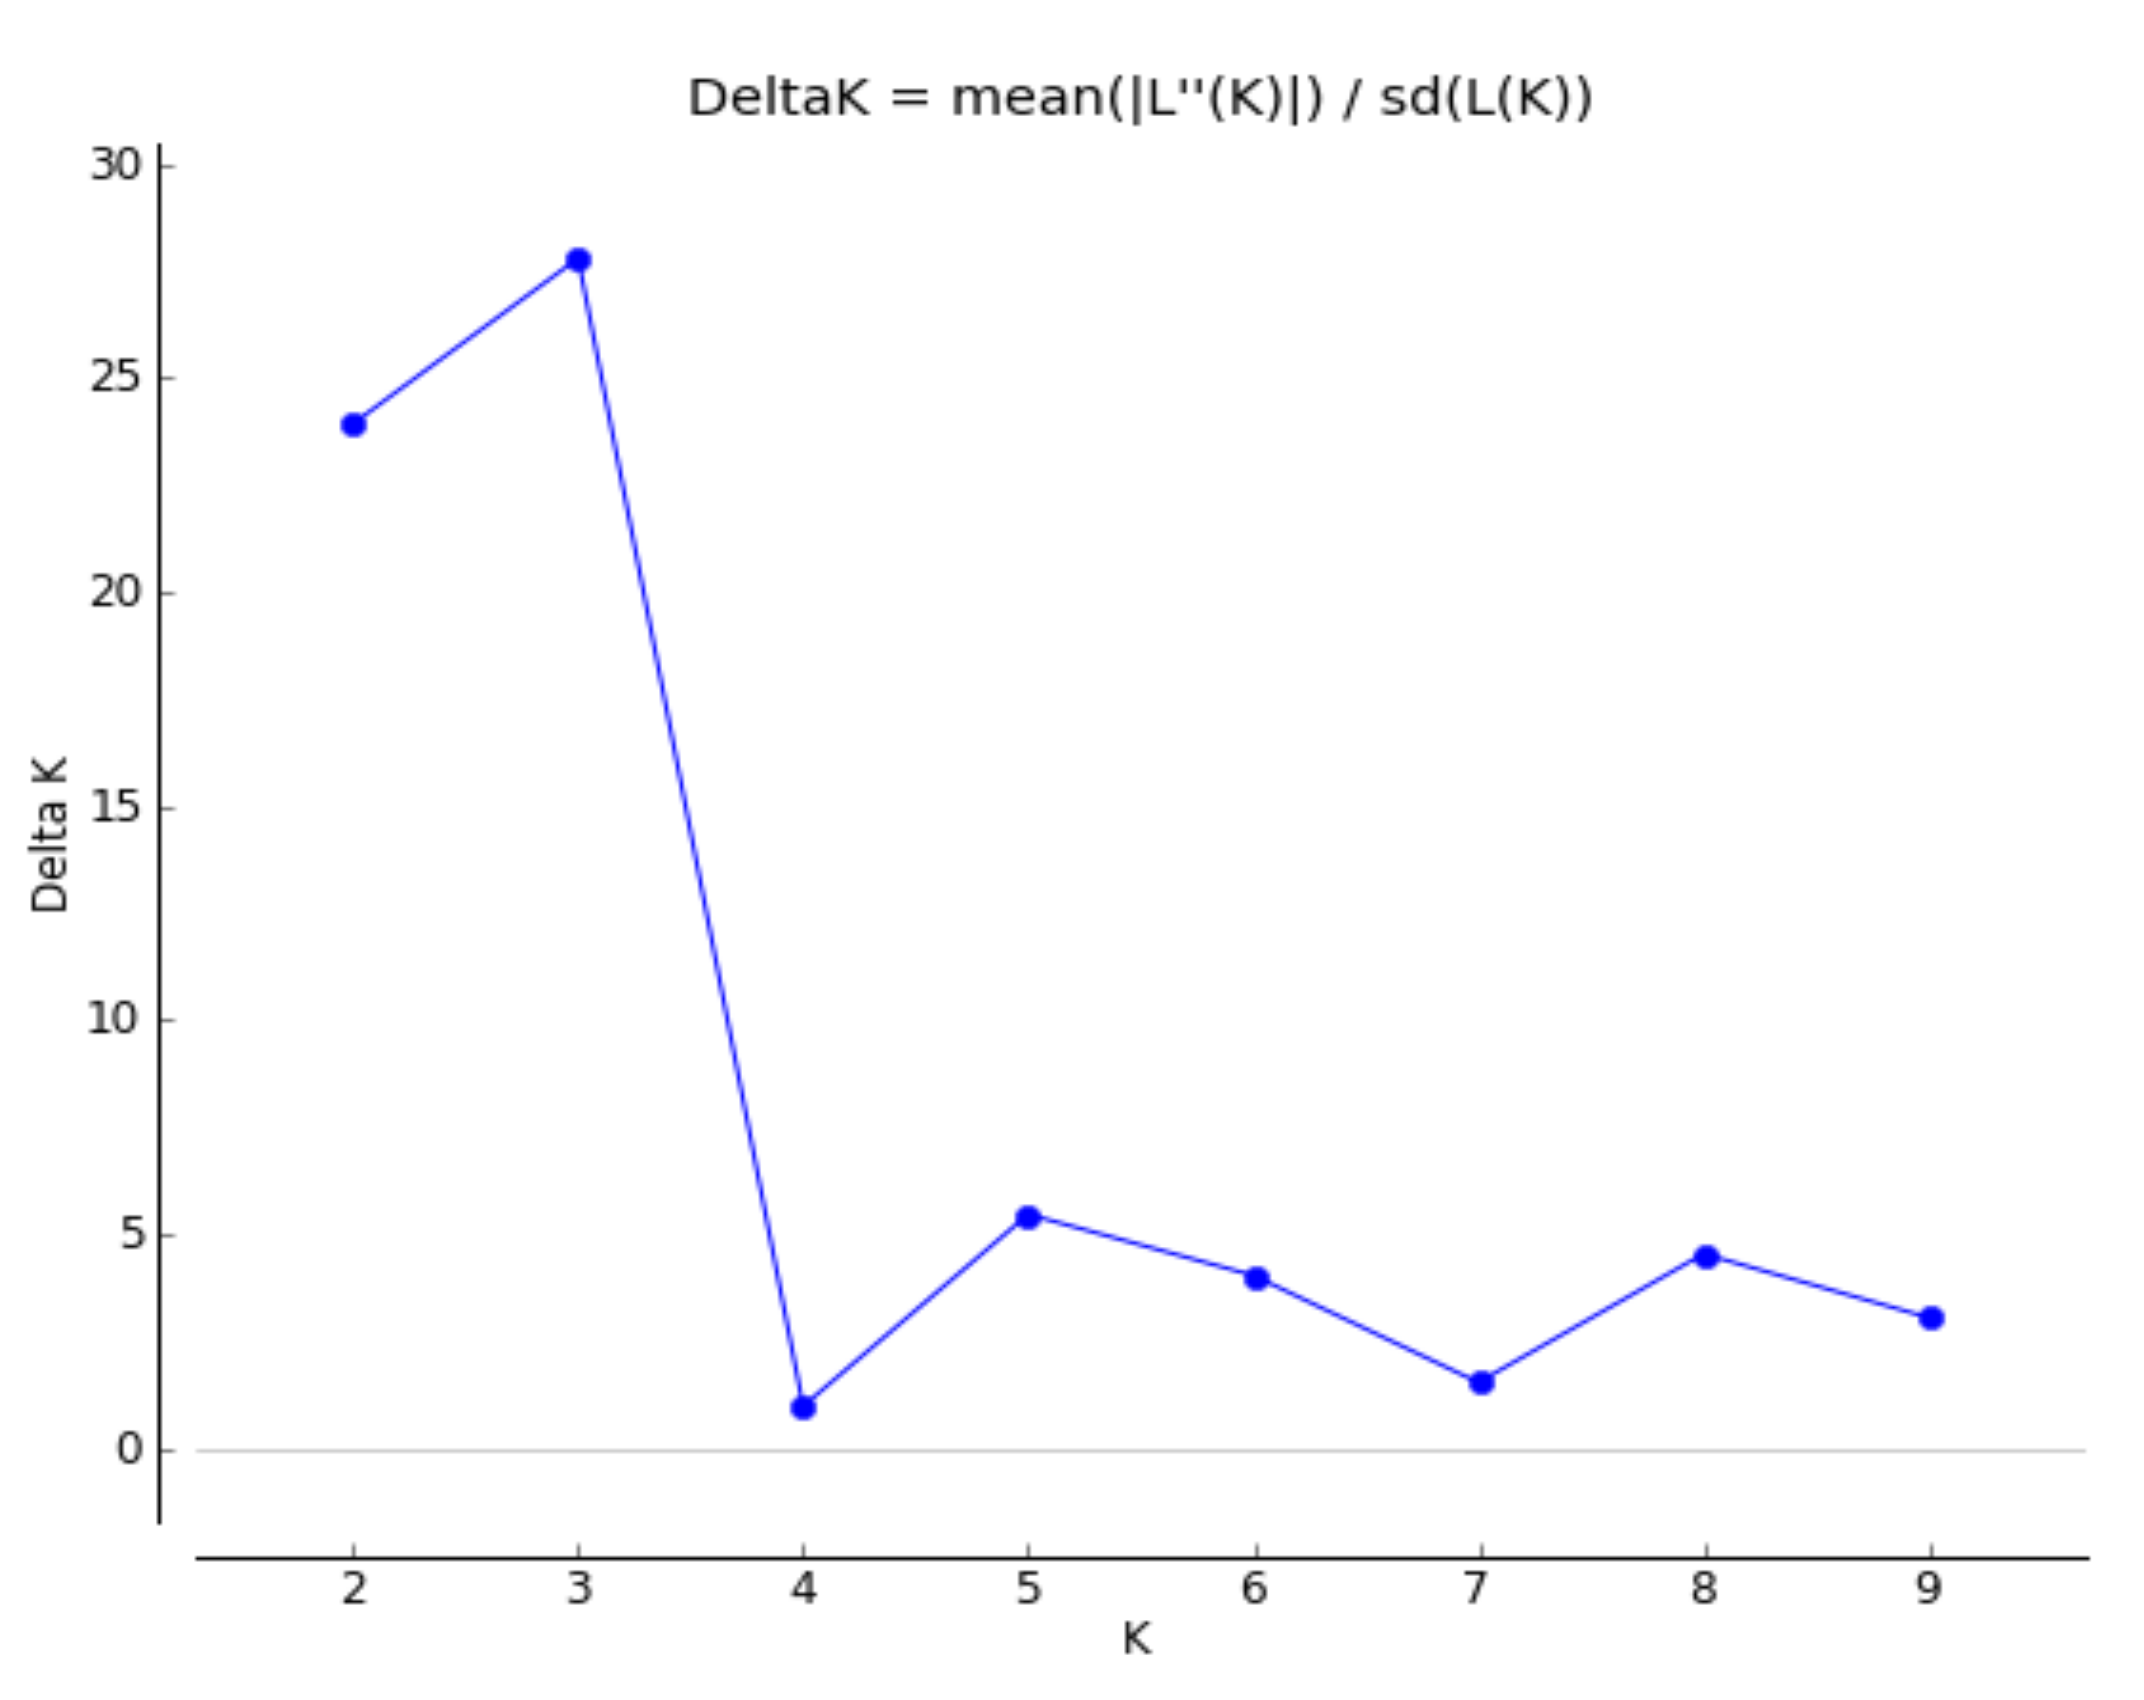
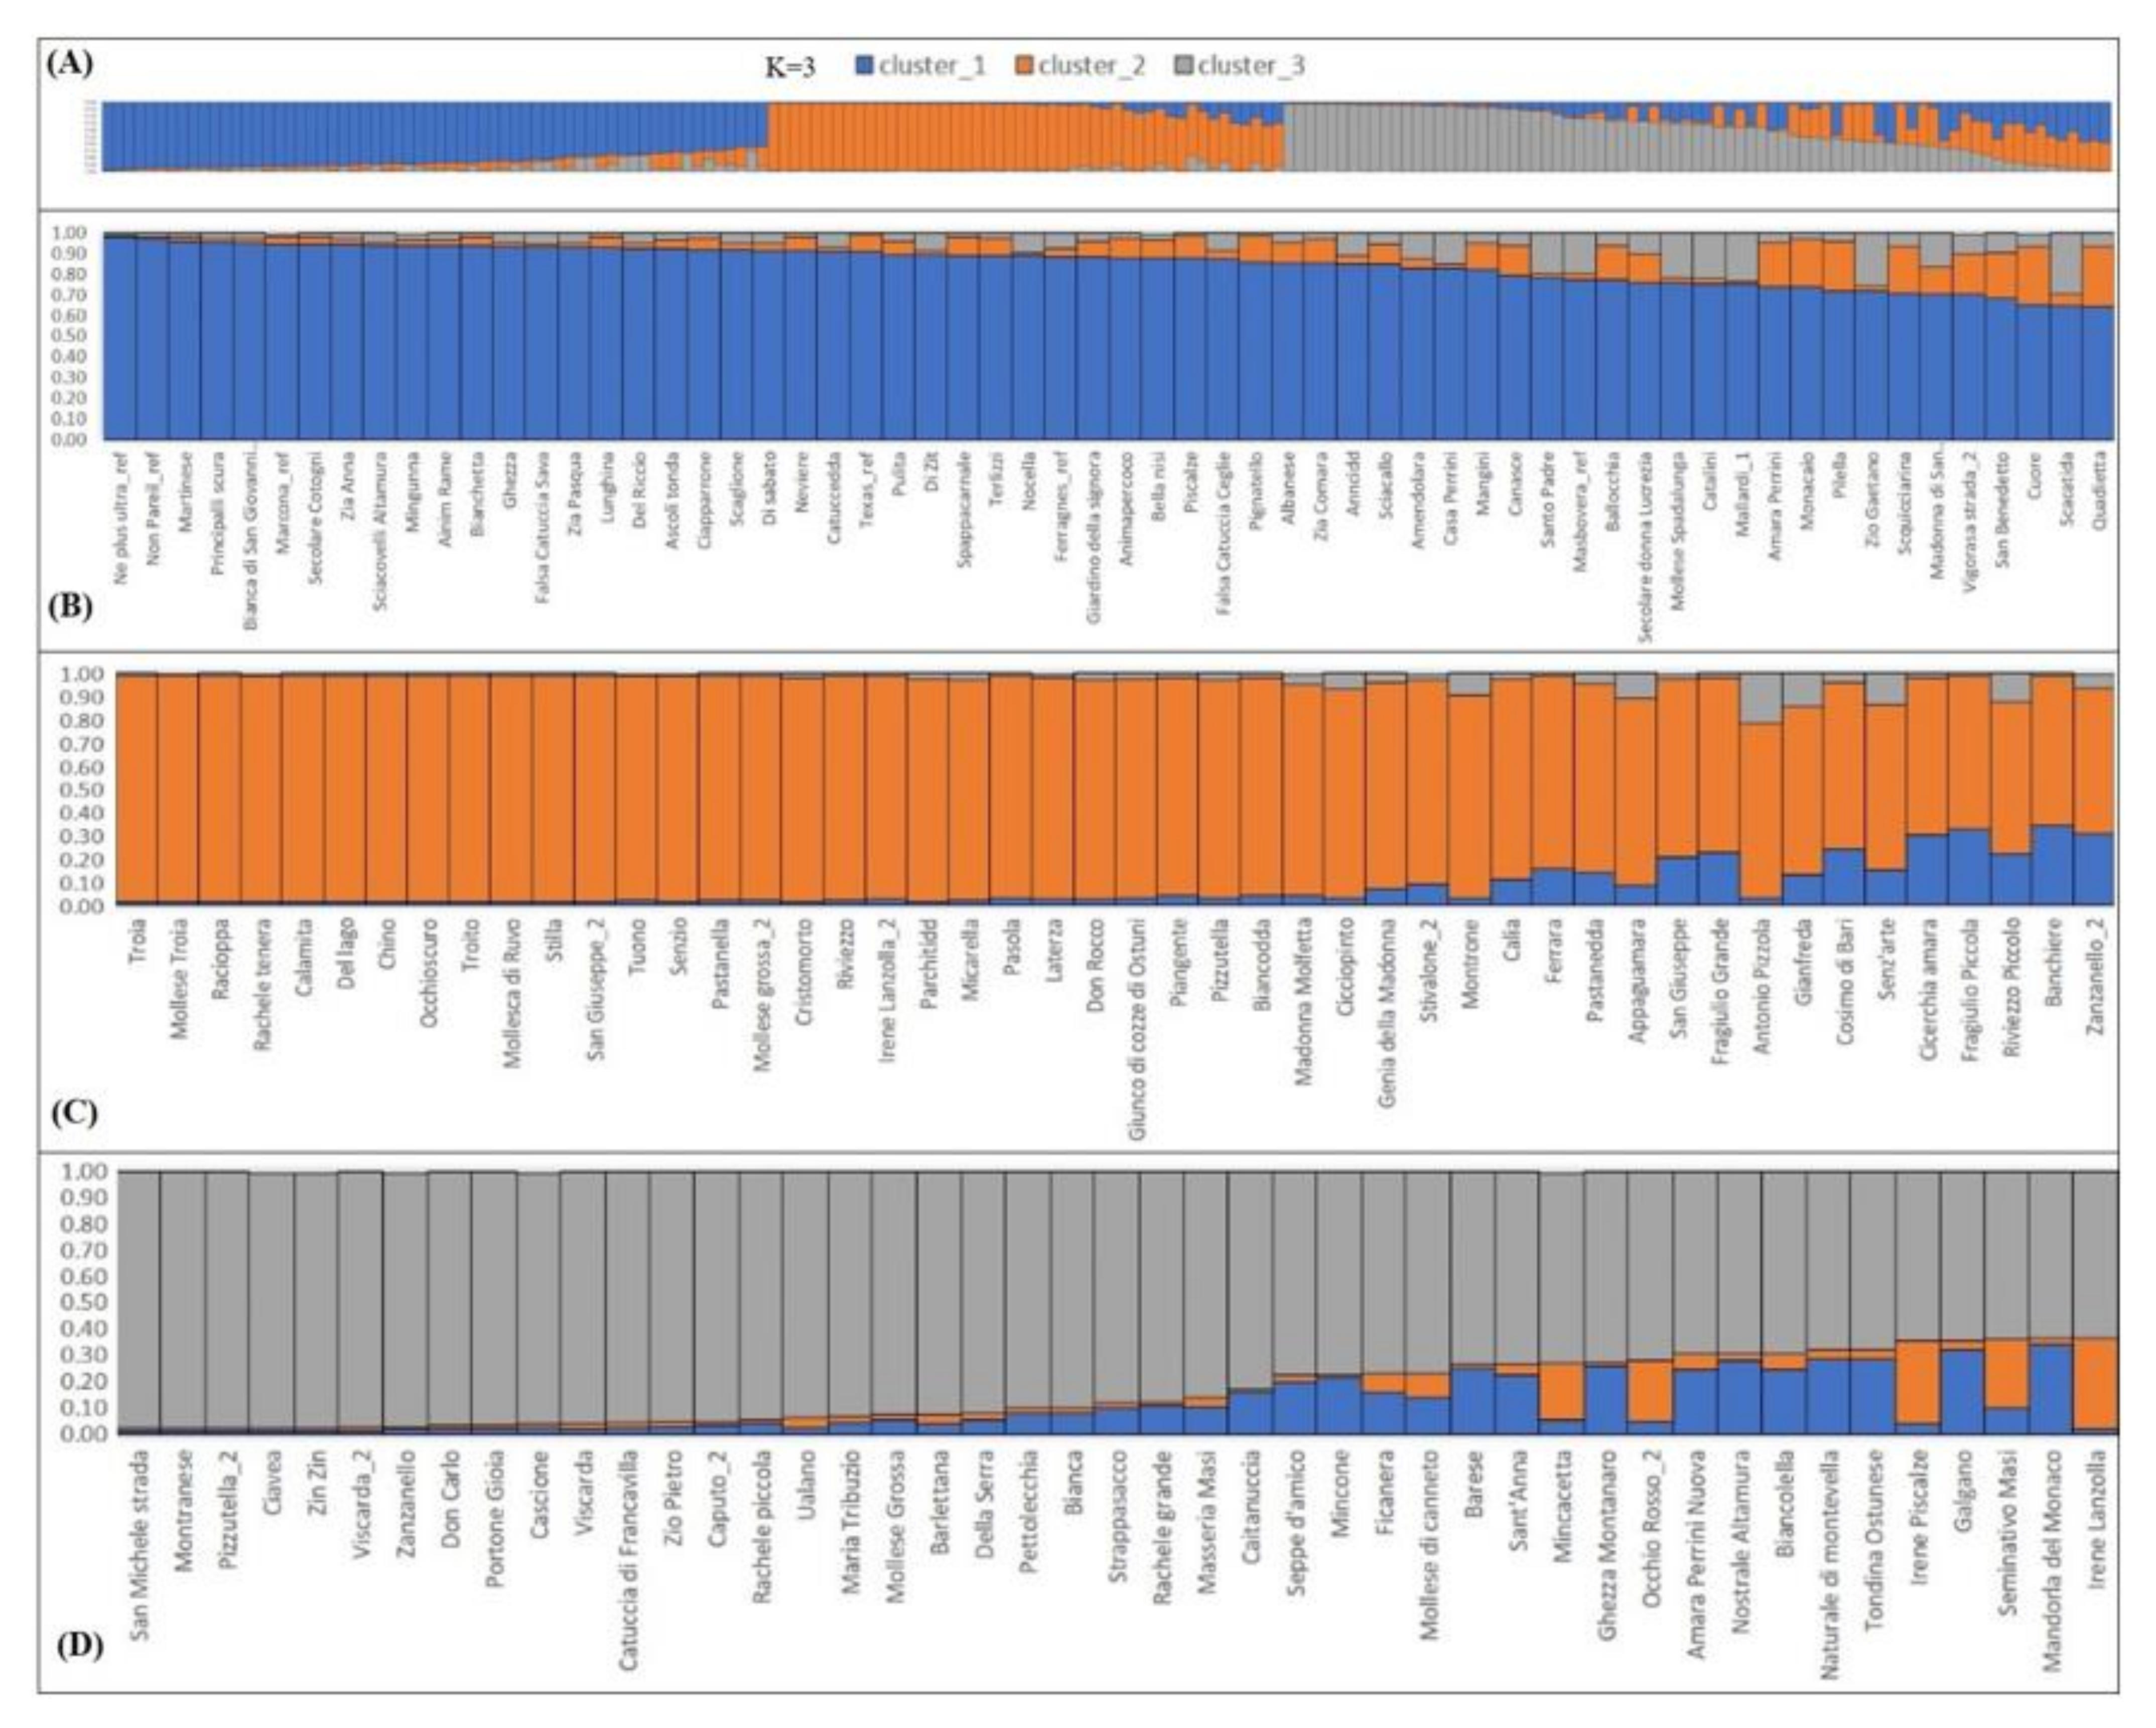
2.3. Population Structure


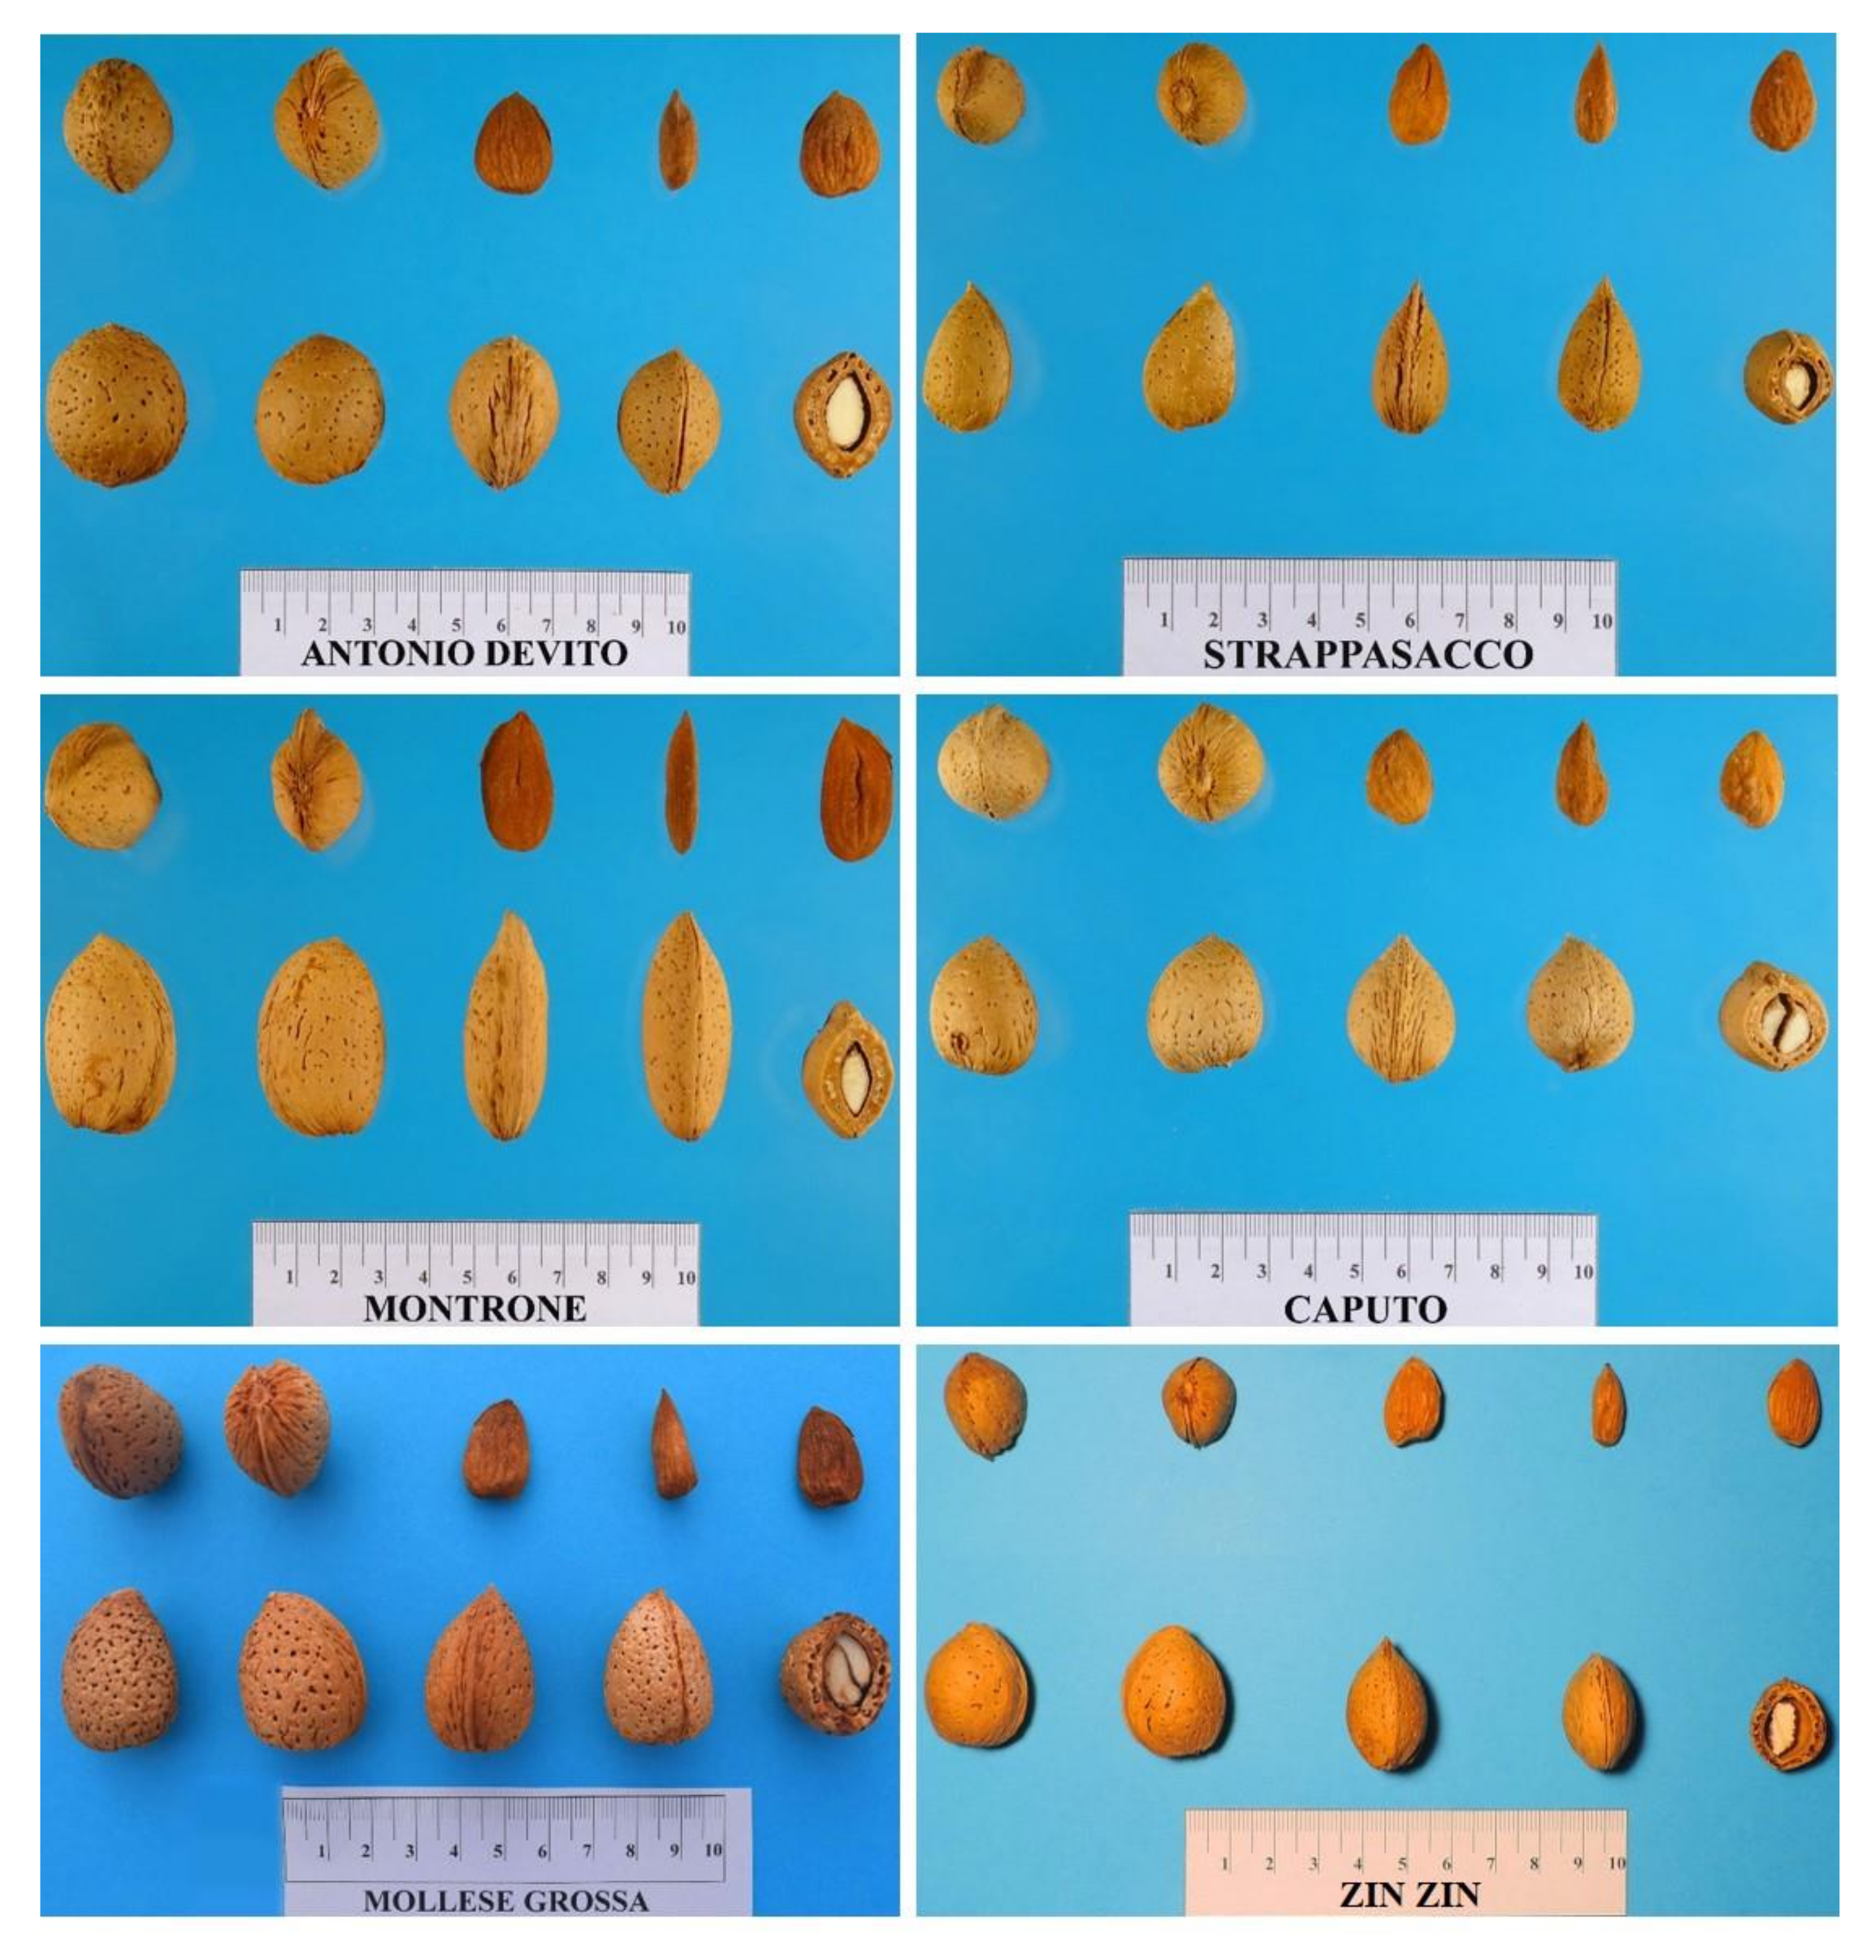
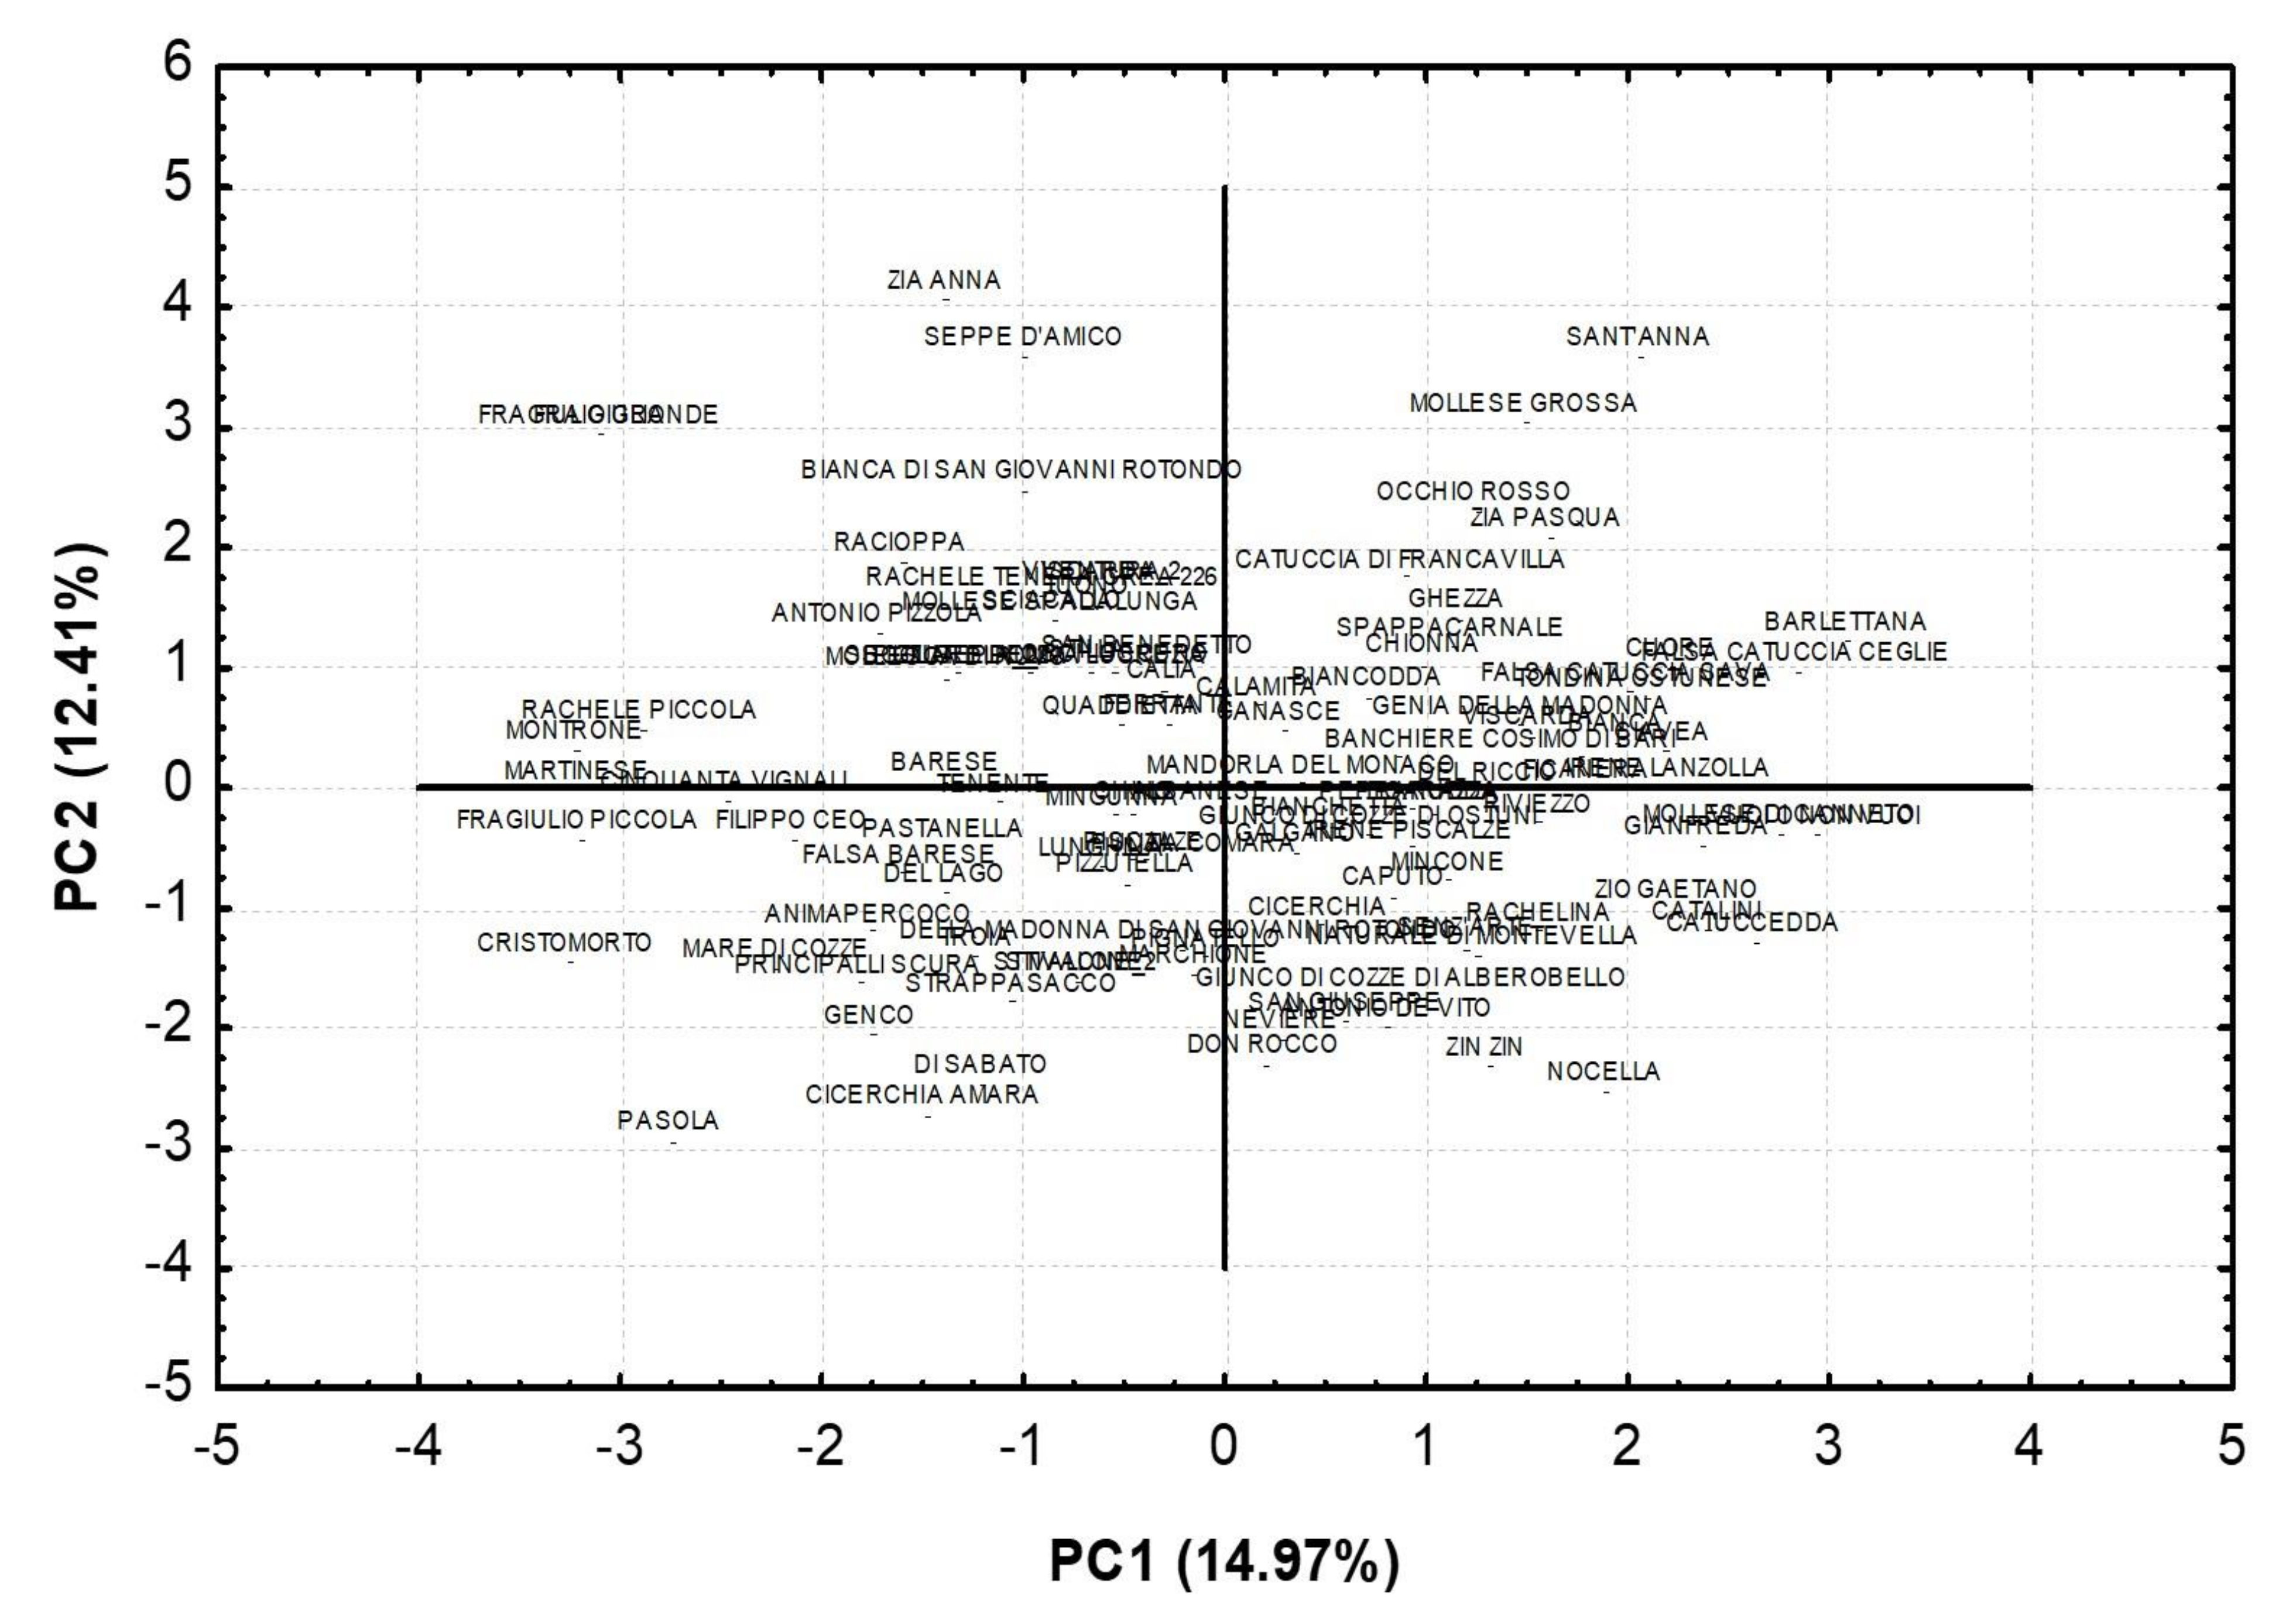
2.4. Phenotypic Characterization
| Trait | Mean | Expression Level | Minimum | Maximum | Coefficient of Variation (CV %) |
|---|---|---|---|---|---|
| Tree habit | 5.11 | medium | 1.00 | 9.00 | 38.35 |
| Tree vigor | 6.05 | medium-strong | 1.00 | 9.00 | 25.40 |
| Color of petals | 1.27 | white | 1.00 | 3.00 | 43.85 |
| Leaf blade color | 5.50 | green | 3.00 | 7.00 | 22.78 |
| Nut size | 4.82 | medium | 1.00 | 9.00 | 33.69 |
| Nut shape (side view) | 2.59 | round-oblong | 1.00 | 4.00 | 42.80 |
| Nutshell color intensity | 4.45 | light-medium | 1.00 | 9.00 | 38.62 |
| Nutshell incision (pores) | 2.27 | medium porous | 1.00 | 4.00 | 33.24 |
| Nut ventral suture | 1.73 | firmly closed | 1.00 | 5.00 | 89.70 |
| Nutshell softness | 2.93 | hard | 1.00 | 7.00 | 45.49 |
| Kernel shape | 1.98 | elliptic | 1.00 | 3.00 | 22.76 |
| Kernel size | 4.58 | medium | 1.00 | 7.00 | 35.21 |
| Kernel tegument color intensity | 5.27 | medium | 3.00 | 7.00 | 20.78 |
| Kernel taste | 3.18 | sweet | 3.00 | 7.00 | 26.41 |
| Percentage of double kernels | 4.50 | low-medium | 3.00 | 7.00 | 33.72 |
| Flowering time | 4.96 | intermediate | 3.00 | 7.00 | 30.03 |
| Ripening time | 5.42 | intermediate | 1.00 | 9.00 | 28.87 |


| Traits | PC1 | PC2 | PC3 | PC4 |
|---|---|---|---|---|
| Tree habit | 0.09 | −0.13 | −0.50 | 0.07 |
| Tree vigor | −0.09 | −0.07 | 0.22 | 0.61 |
| Color of petals | −0.35 | −0.47 | 0.30 | −0.25 |
| Leaf blade color | 0.31 | −0.07 | −0.25 | −0.26 |
| Nut size | −0.63 | 0.49 | −0.25 | 0.16 |
| Nut shape (side view) | −0.73 | 0.08 | −0.20 | 0.06 |
| Nutshell color intensity | −0.43 | −0.27 | 0.44 | −0.05 |
| Nutshell incision (pores) | −0.33 | 0.26 | 0.16 | −0.09 |
| Nut ventral suture | −0.21 | 0.50 | 0.29 | −0.23 |
| Nutshell softness | 0.30 | 0.54 | −0.10 | −0.41 |
| Kernel shape | −0.50 | −0.05 | −0.40 | −0.25 |
| Kernel size | −0.23 | 0.61 | −0.24 | 0.43 |
| Kernel tegument color intensity | −0.35 | 0.25 | 0.49 | 0.15 |
| Kernel taste | −0.16 | −0.27 | 0.33 | 0.05 |
| Percentage of double kernels | 0.56 | 0.31 | 0.08 | 0.38 |
| Flowering time | −0.41 | −0.29 | −0.47 | −0.07 |
| Ripening time | −0.02 | −0.49 | −0.26 | 0.52 |
| % of Variance | 14.97 | 12.41 | 10.14 | 8.56 |


3. Materials and Methods
3.1. Plant Material
3.2. DNA Extraction and SSR Analysis
| SSR Locus | Type | Species * | Almond LG * | Motif | Ta | Reference |
|---|---|---|---|---|---|---|
| BPPCT001 | SSR | P. persica | 2 | (GA)27 | 57 | [53] |
| BPPCT007 | SSR | P. persica | 3 | (AG)22(CG)2(AG)4 | 57 | [53] |
| BPPCT010 | SSR | P. persica | 4 | (AG)4GG(AG)10 | 57 | [53] |
| BPPCT014 | SSR | P. persica | 5 | (AG)23 | 57 | [53] |
| BPPCT025 | SSR | P. persica | 6 | (GA)29 | 57 | [53] |
| CPDCT025 | SSR | P. dulcis | 3 | (CT)10 | 62 | [54] |
| CPDCT042 | SSR | P. dulcis | 1 | (GA)27 | 62 | [55] |
| CPDCT045 | SSR | P. dulcis | 4 | (GA)16 | 62 | [55] |
| CPPCT006 | SSR | P. persica | 8 | (CT)16 | 59 | [56] |
| CPPCT033 | SSR | P. persica | 7 | (CT)16 | 50 | [56] |
| CPSCT012 | SSR | P. salicina | 6 | GA | 62 | [54] |
| CPSCT018 | SSR | P. salicina | 8 | (CA)5(CT)20 | 52 | [54] |
| EPPCU5176 | EST-SSR | P. persica | 7 | - | 55 | [57] |
| PCHGMS1 | SSR | P. persica | 2 | (AC)12(AT)6 | 60 | [58] |
| UDP96003 | SSR | P. persica | 4 | (CT)11(CA)28 | 57 | [59] |
| UDP96005 | SSR | P. persica | 1 | (AC)16TG(CT)2CA(CT)11 | 57 | [59] |
| UDP98409 | SSR | P. persica | 8 | (AG)19 | 57 | [59] |
| UDP98412 | SSR | P. persica | 6 | (AG)28 | 57 | [60] |
3.3. Genetic Diversity and Population Structure Analysis
3.4. Phenotypic Characterization
| TRAIT | |
|---|---|
| TREE | Habit |
| Vigor | |
| LEAF | Blade color |
| FLOWER | Petal color |
| NUT | Size |
| Shape (side view) | |
| Shell color intensity | |
| Shell softness | |
| Shell incision (pores) | |
| Ventral suture | |
| KERNEL | Size |
| Shape | |
| Taste | |
| Tegument color intensity | |
| Percentage of double kernels | |
| PHENOLOGY | Flowering time |
| Ripening time | |
3.5. Statistical Analysis
4. Conclusions
Author Contributions
Funding
Institutional Review Board Statement
Informed Consent Statement
Data Availability Statement
Acknowledgments
Conflicts of Interest
References
- Gradziel, T.M. Origin and dissemination of almond. Hort. Rev. 2011, 38, 23–81. [Google Scholar] [CrossRef]
- Kester, D.E.; Gradziel, T.M.; Grasselly, C. Almonds (Prunus). In Genetic Resources of Temperate Fruit and Nut Crops; Moore, J.N., Ballington, J.R., Eds.; ISHS: Korbeek-Lo, Belgium, 1991; pp. 701–758. [Google Scholar]
- FAOSTAT. Available online: www.fao.org/faostat/en/#data/QC (accessed on 9 December 2017).
- ISTAT. Available online: http://dati.istat.it/Index.aspx (accessed on 1 December 2019).
- Socias i Company, R.; Kodad, O.; Alonso, J.M.; Gradziel, T.M. Almond quality: A breeding perspective. Hortic. Rev. 2008, 34, 197–238. [Google Scholar] [CrossRef]
- Jenkins, D.J.; Kendall, C.W.; Marchie, A.; Parker, T.L.; Connelly, P.W.; Qian, W.; Haight, J.S.; Faulkner, D.; Vidgen, E.; Lapsley, K.G.; et al. Dose response of almonds on coronary heart disease risk factors: Blood lipids, oxidized low-density lipoproteins, lipoprotein (a), homocysteine, and pulmonary nitric oxide: A randomized, controlled, crossover trial. Circulation 2002, 106, 1327–1332. [Google Scholar] [CrossRef] [PubMed]
- Hyson, D.A.; Schneeman, B.O.; Davis, P.A. Almonds and almond oil have similar effects on plasma lipids and LDL oxidation in healthy men and women. J. Nutr. 2002, 132, 703–707. [Google Scholar] [CrossRef] [PubMed]
- Ahmad, Z. The uses and properties of almond oil. Complement. Ther. Clin. Pract. 2010, 16, 10–12. [Google Scholar] [CrossRef] [PubMed]
- De Giorgio, D.; Leo, L.; Zacheo, G.; Lamascese, N. Evaluation of 52 almond (Prunus amygdalus Batsch) cultivars from the Apulia region in Southern Italy. J. Hortic. Sci. Biotechnol. 2007, 82, 541–546. [Google Scholar] [CrossRef]
- Moleas, C. Situazione della mandorlicoltura nel bacino del mediterraneo e confronto con la mandorlicoltura californiana. Cracker 1990, 2, 43–44. [Google Scholar]
- Godini, A. Attuali conoscenze sull’autofertilità nel mandorlo. Frutticoltura 1996, 1, 70–75. [Google Scholar]
- Almeida, R.P.P.; Purcell, A.H. Biological traits of Xylella fastidiosa strains from grapes and almonds. Appl. Environ. Microbiol. 2003, 69, 7447–7452. [Google Scholar] [CrossRef]
- Alberghina, O. Attitudine produttiva di 31 cultivar di mandorlo su 2 portinnesti in un ambiente del litorale ionico siciliano. Frutticoltura 1992, 54, 69–74. [Google Scholar]
- Bounous, G.; Paglietta, R.; Peano, C. Collection and evaluation of almond germplasm in Piemonte. Acta Hortic. 1994, 373, 119–124. [Google Scholar] [CrossRef]
- De Giorgio, D.; Stelluti, M. Evaluation of germplasm collection of almond (Prunus amygdalus Batsch) through a multivariate analysis. Agric. Med. 1995, 125, 341–353. [Google Scholar] [CrossRef]
- De Giorgio, D.; Stelluti, M.; Macchia, M.; Lanza, F. Phenological and production data on 205 almond tree cultivars during sixteen years of cropping. Agric. Ricerca 1996, 162, 3–54. [Google Scholar]
- De Giorgio, D.; Polignano, G.B. Evaluating the biodiversity of almond cultivars from germplasm collection field in Southern Italy. Sustain. Global Farm 2001, 56, 305–311. [Google Scholar]
- Barbera, G.; Monte, M.; Sottile, F. The almond “Museo Vivente F. Monastra”: From genetic resources rescue to germplasm collection. Opt. Medit. 2005, 63, 79–84. [Google Scholar]
- Wünsch, A.; Hormaza, J.I. Cultivar identification and genetic fingerprinting of temperate fruit tree species using DNA markers. Euphytica 2002, 125, 59–67. [Google Scholar] [CrossRef]
- Bartolozzi, F.; Warburton, M.L.; Arulsekar, S.; Gradziel, T.M. Genetic characterization among California almond cultivars and breeding lines detected by randomly amplified polymorphic DNA (RAPD) analysis. J. Am. Soc. Hort. Sci. 1998, 123, 381–387. [Google Scholar] [CrossRef]
- Shiran, B.; Amirbakhtiar, N.; Kiani, S.; Mohammmadi, S.; Sayed-Tabatabaei, B.E.; Moradi, H. Molecular characterization and genetic relationship among almond cultivars assessed by RAPD and SSR markers. Sci. Hortic. 2007, 111, 280–292. [Google Scholar] [CrossRef]
- Sorkheh, K.; Shiran, B.; Gradziel, T.M.; Epperson, B.K.; Martínez-Gómez, P.; Asadi, E. Amplified fragment length polymorphism as a tool for molecular characterization of almond germplasm: Genetic diversity among cultivated genotypes and related wild species of almond, and its relationships with agronomic traits. Euphytica 2007, 156, 327–344. [Google Scholar] [CrossRef]
- Wu, S.B.; Wirthensohn, M.G.; Hunt, P.; Gibson, J.P.; Sedgley, M. High resolution melting analysis of almond SNPs derived from ESTs. Theor. Appl. Genet. 2008, 118, 1–14. [Google Scholar] [CrossRef]
- Pavan, S.; Delvento, C.; Mazzeo, R.; Ricciardi, F.; Losciale, P.; Gaeta, L.; D’Agostino, N.; Taranto, F.; Sánchez-Pérez, R.; Ricciardi, L.; et al. Almond diversity and homozygosity define structure, kinship, inbreeding, and linkage disequilibrium in cultivated germplasm, and reveal genomic associations with nut and seed weight. Hortic. Res. 2021, 8, 15. [Google Scholar] [CrossRef] [PubMed]
- Agarwal, M.; Neeta, S.; Harish, P. Advances in molecular marker techniques and their applications in plant sciences. Plant Cell Rep. 2008, 27, 617–631. [Google Scholar] [CrossRef] [PubMed]
- Kalia, R.K.; Rai, M.K.; Kalia, S.; Singh, R.; Dhawan, A.K. Microsatellite markers: An overview of the recent progress in plants. Euphytica 2011, 177, 309–334. [Google Scholar] [CrossRef]
- Xu, Y.; Ma, R.; Xie, H.; Liu, J.; Cao, M. Development of SSR markers for the phylogenetic analysis of almond trees from China and the Mediterranean region. Genome 2004, 47, 1091–1104. [Google Scholar] [CrossRef]
- Xie, H.; Sui, Y.; Chang, F.; Xu, Y.; Ma, R. SSR allelic variation in almond (Prunus dulcis Mill.). Theor. Appl. Genet. 2006, 112, 366–372. [Google Scholar] [CrossRef] [PubMed]
- Fernandez i Martì, A.; Alonso, J.M.; Espiau, M.T.; Rubio-Cabetas, M.J.; Socias i Company, R. Genetic diversity in Spanish and foreign almond germplasm assessed by molecular characterization with Simple Sequence Repeats. J. Amer. Soc. Hort. Sci. 2009, 134, 535–542. [Google Scholar] [CrossRef]
- Gouta, H.; Ksia, E.; Buhner, T.; Moreno, M.; Zarrouk, M.; Mliki, A.; Gogorcena, Y. Assessment of genetic diversity and relatedness among Tunisian almond germplasm using SSR markers. Hereditas 2010, 147, 283–292. [Google Scholar] [CrossRef] [PubMed]
- Zeinalabedini, M.; Khayam-Nekoui, M.; Grigorian, V.; Gradziel, T.M.; Martínez-Gómez, P. The origin and dissemination of the cultivated almond as determined by nuclear and chloroplast SSR marker analysis. Sci. Hortic. 2010, 125, 593–601. [Google Scholar] [CrossRef]
- Pérez-Campos, S.I.; Cutanda-Pérez, M.C.; Montero-Riquelme, F.J.; Botella-Miralles, O. Comparative analysis of autochthonous almond (Prunus amigdalus Bastch) material and commercial varieties in the Castilla-La Mancha Region (Spain). Sci. Hortic. 2011, 129, 421–425. [Google Scholar] [CrossRef]
- Rahemi, A.; Fatahi, R.; Ebadi, A.; Taghavi, T.; Hassani, D.; Gradziel, T.; Folta, K.; Chaparro, J. Genetic diversity of some wild almonds and related Prunus species revealed by SSR and EST-SSR molecular markers. Plant Syst. Evol. 2012, 298, 173–192. [Google Scholar] [CrossRef]
- El Hamzaoui, A.; Oukabli, A.; Charafia, J.; Moumni, M. Moroccan almond is a distinct gene pool as revealed by SSR. Sci. Hortic. 2013, 154, 37–44. [Google Scholar] [CrossRef]
- Distefano, G.; Caruso, M.; La Malfa, S.; Ferrante, T.; Del Signore, B.; Gentile, A.; Sottile, F. Genetic diversity and relationships among Italian and foreign almond germplasm as revealed by microsatellite marker. Sci. Hortic. 2013, 162, 305–312. [Google Scholar] [CrossRef]
- Fernandez i Martì, A.; Font i Forcada, C.; Kamali, K.; Rubio-Cabetas, M.J.; Wirthensohn, M.; Socias i Company, R. Molecular analyses of evolution and population structure in a worldwide almond [Prunus dulcis (Mill.) D.A. Webbsyn. P. amygdalus Batsch] pool assessed by microsatellite markers. Genet. Resour. Crop Evol. 2015, 62, 205–219. [Google Scholar] [CrossRef]
- Kadkhodaei, S.; Elahy, M.; Nekouei, M.K.; Imani, A.; Shahnazari, M.; Mardi, M.; Javanmard, A.; Ariff, A.B. A panel of cultivate specific marker based on polymorphisms at microsatellite markers for Iranian cultivated almonds (Prunus dulcis). Aust. J. Crop Sci. 2010, 4, 730–736. [Google Scholar]
- Botstein, D.; White, R.L.; Skolnick, M.; Davis, R.W. Construction of genetic linkage map in man using restriction fragment length polymorphisms. Am. J. Hum. Genet. 1980, 32, 314–331. [Google Scholar] [PubMed]
- Halász, J.; Kodad, O.; Galiba, G.M.; Skola, I.; Ercisli, S.; Ledbetter, C.A.; Hegedűs, A. Genetic variability is preserved among strongly differentiated and geographically diverse almond germplasm: An assessment by simple sequence repeat markers. Tree Genet. Genomes 2019, 15, 12. [Google Scholar] [CrossRef]
- Sànchez-Pérez, R.; Ballester, J.; Dicenta, F.; Arus, P.; Martìnez-Gόmez, P. Comparison of SSR polymorphisms using automated capillary sequencers, and polyacrylamide and agarose gel electrophoresis: Implications for the assessment of genetic diversity and relatedness in almond. Sci. Hortic. 2006, 108, 310–316. [Google Scholar] [CrossRef]
- Martínez-Gómez, P.; Arulsekar, S.; Potter, D.; Gradziel, T.M. An extended interspecific gene pool available to peach and almond breeding as characterized using simple sequence repeat (SSR) markers. Euphytica 2003, 131, 313–322. [Google Scholar] [CrossRef]
- Muzzalupo, I.; Vendramin, G.G.; Chiappetta, A. Genetic biodiversity of Italian olives (Olea europaea) germplasm analyzed by SSR markers. Sci. World J. 2014, 2014, 12. [Google Scholar] [CrossRef]
- Di Rienzo, V.; Sion, S.; Taranto, F.; D’Agostino, N.; Montemurro, C.; Fanelli, V.; Sabetta, W.; Boucheffa, S.; Tamendjari, A.; Pasqualone, A.; et al. Genetic flow among olive populations within the Mediterranean basin. PeerJ 2018, 6, e5260. [Google Scholar] [CrossRef]
- Marchese, A.; Bošković, R.I.; Martínez-García, P.J.; Tobutt, K.R. The origin of the self-compatible almond ‘Supernova’. Plant Breed. 2008, 127, 105–107. [Google Scholar] [CrossRef]
- Alegrè, S.; Miarnau, X.; Vargas, F. Productive potential of six almond cultivars under regulated deficit irrigation. Options Mediterr. 2010, 94, 267–271. [Google Scholar]
- Socias i Company, R.; Gradziel, T.M. Almonds: Botany, Production and Uses; CABI: Wallingford, UK, 2017. [Google Scholar]
- Rapposelli, E.; Rigoldi, M.P.; Satta, D.; Delpiano, D.; Secci, S.; Porceddu, A. Genetic, phenotypic, and commercial characterization of an almond collection from Sardinia. Plants 2018, 7, 86. [Google Scholar] [CrossRef]
- Rigoldi, M.P.; Rapposelli, E.; De Giorgio, D.; Resta, P.; Porceddu, A. Genetic diversity in two Italian almond collections. Electron. J. Biotechnol. 2015, 18, 40–45. [Google Scholar] [CrossRef]
- Delplancke, M.; Alvarez, N.; Benoit, L.; Espíndola, A.; Joly, H.I.; Neuenschwander, S.; Arrigo, N. Evolutionary history of almond tree domestication in the Mediterranean basin. Mol. Ecol. 2013, 22, 1092–1104. [Google Scholar] [CrossRef]
- Evanno, G.; Regnaut, S.; Goudet, J. Detecting the number of clusters of individuals using the software STRUCTURE: A simulation study. Mol. Ecol. 2005, 14, 2611–2620. [Google Scholar] [CrossRef]
- Pritchard, J.K.; Stephens, M.; Donnelly, P. Inference of population structure using multilocus genotype data. Genetics 2000, 155, 945–959. [Google Scholar] [CrossRef]
- Spadoni, A.; Sion, S.; Gadaleta, S.; Savoia, M.A.; Piarulli, L.; Fanelli, V.; Di Rienzo, V.; Taranto, F.; Miazzi, M.M.; Montemurro, C.; et al. A simple and rapid method for genomic DNA extraction and microsatellite analysis in tree plants. J. Agric. Sci. Tech. 2019, 21, 1215–1226. Available online: http://jast.modares.ac.ir/article-23-13213-en.html (accessed on 7 November 2019).
- Dirlewanger, E.; Cosson, P.; Tavaud, M.; Aranzana, M.J.; Poizat, C.; Zanetto, A.; Arus, P.; Laigret, F. Development of microsatellite markers in peach [Prunus persica (L.) Batsch.] and their use in genetic diversity analysis in peach and sweet cherry (Prunus avium L.). Theor. Appl. Genet. 2002, 105, 127–138. [Google Scholar] [CrossRef]
- Mnejja, M.; Garcia-Mas, M.; Howad, W.; Badenes, M.L.; Arús, P. Simple sequence repeat (SSR) markers of Japanese plum (Prunus salicina Lindl.) are highly polymorphic and transferable to peach and almond. Mol. Ecol. 2004, 4, 163–166. [Google Scholar] [CrossRef]
- Mnejja, M.; Garcia-Mas, J.; Howad, W.; Arús, P. Development and transportability across Prunus species of 42 polymorphic almond microsatellites. Mol. Ecol. 2005, 5, 531–535. [Google Scholar] [CrossRef]
- Aranzana, M.J.; Garcia-Mas, J.; Carbó, J.; Arús, P. Development and variability analysis of microsatellite markers in peach. Plant Breed. 2002, 121, 87–92. [Google Scholar] [CrossRef]
- Howad, W.; Yamamoto, T.; Dirlewanger, E.; Testolin, R.; Cosson, P.; Cipriani, G.; Monforte, A.J.; Georgi, L.; Abbott, A.G.; Arús, P. Mapping with a few plants: Using selective mapping for microsatellite saturation of the Prunus reference map. Genetics 2005, 171, 1305–1309. [Google Scholar] [CrossRef]
- Sosinski, B.; Gannavarapu, M.; Hager, L.D.; Beck, L.E.; King, G.J.; Ryder, C.D.; Rajapakse, S.; Baird, W.V.; Ballard, R.E.; Abbott, A.G. Characterization of microsatellite markers in peach [Prunus persica (L.) Batsch]. Theor. Appl. Genet. 2000, 101, 421–428. [Google Scholar] [CrossRef]
- Cipriani, G.; Lot, G.; Huang, W.G.; Marrazzo, M.T.; Peterlunger, E.; Testolin, R. AG/GT and AG/CT microsatellite repeats in peach [Prunus persica (L) Batsch]: Isolation, characterization and cross-species amplification in Prunus. Theor. Appl. Genet. 1999, 99, 65–72. [Google Scholar] [CrossRef]
- Testolin, R.; Marrazzo, T.; Cipriani, G.; Quarta, R.; Verde, I.; Dettori, M.T.; Sansavini, S. Microsatellite DNA in peach (Prunus persica L. Batsch) and its use in fingerprinting and testing the genetic origin of cultivars. Genome 2000, 43, 512–520. [Google Scholar] [CrossRef]
- Peakall, R.; Smouse, P.E. GENALEX 6: Genetic analysis in Excel. Population genetic software for teaching and research. Mol. Ecol. Notes 2006, 6, 288–295. [Google Scholar] [CrossRef]
- Shannon, C.E.; Weaver, W. A mathematical theory of communication. Bell Syst. Tech. J. 1948, 27, 379–423. [Google Scholar] [CrossRef]
- Wright, S. The genetical structure of populations. Ann. Eugen. 1951, 15, 323–354. [Google Scholar] [CrossRef]
- Kalinowski, S.T. Counting alleles with rarefaction: Private alleles and hierarchical sampling designs. Conserv. Genet. 2004, 5, 539–543. [Google Scholar] [CrossRef]
- Lynch, M.; Ritland, K. Estimation of pairwise relatedness with molecular markers. Genetics 1999, 152, 1753–1766. [Google Scholar] [CrossRef]
- Saitou, N.; Nei, M. The Neighbor-Joining method: A new method for reconstructing phylogenetic trees. Mol. Biol. Evol. 1987, 4, 406–425. [Google Scholar]
- Felsenstein, J. Confidence limits on phylogenies: An approach using the bootstrap. Evolution 1985, 39, 783–791. [Google Scholar] [CrossRef]
- Earl, D.A.; Vonholdt, B. Structure Harverest: A website and program for visualizing STRUCTURE output and implementing the Evanno method. Conserv. Genet. Resour. 2012, 4, 359–361. [Google Scholar] [CrossRef]
- STATISTICA, Logiciel D’analyse de Données, 7.1.th ed.; StatSoft Inc.: Tulsa, OK, USA, 2005; Available online: www.statsoft.fr (accessed on 23 October 2021).
Publisher’s Note: MDPI stays neutral with regard to jurisdictional claims in published maps and institutional affiliations. |
© 2022 by the authors. Licensee MDPI, Basel, Switzerland. This article is an open access article distributed under the terms and conditions of the Creative Commons Attribution (CC BY) license (https://creativecommons.org/licenses/by/4.0/).
Share and Cite
Savoia, M.A.; Del Faro, L.; Venerito, P.; Gaeta, L.; Palasciano, M.; Montemurro, C.; Sabetta, W. The Relevance of Discovering and Recovering the Biodiversity of Apulian Almond Germplasm by Means of Molecular and Phenotypic Markers. Plants 2022, 11, 574. https://doi.org/10.3390/plants11040574
Savoia MA, Del Faro L, Venerito P, Gaeta L, Palasciano M, Montemurro C, Sabetta W. The Relevance of Discovering and Recovering the Biodiversity of Apulian Almond Germplasm by Means of Molecular and Phenotypic Markers. Plants. 2022; 11(4):574. https://doi.org/10.3390/plants11040574
Chicago/Turabian StyleSavoia, Michele Antonio, Loredana Del Faro, Pasquale Venerito, Liliana Gaeta, Marino Palasciano, Cinzia Montemurro, and Wilma Sabetta. 2022. "The Relevance of Discovering and Recovering the Biodiversity of Apulian Almond Germplasm by Means of Molecular and Phenotypic Markers" Plants 11, no. 4: 574. https://doi.org/10.3390/plants11040574
APA StyleSavoia, M. A., Del Faro, L., Venerito, P., Gaeta, L., Palasciano, M., Montemurro, C., & Sabetta, W. (2022). The Relevance of Discovering and Recovering the Biodiversity of Apulian Almond Germplasm by Means of Molecular and Phenotypic Markers. Plants, 11(4), 574. https://doi.org/10.3390/plants11040574