Abstract
Genome-wide single nucleotide polymorphism (SNP) markers were obtained by genotyping-by-sequencing (GBS) technology to study the genetic relationships, population structure, gene flow and selective sweeps during species differentiation of Picea wilsonii, P. neoveitchii and P. likiangensis from a genome-wide perspective. We used P. jezoensis and P. pungens as outgroups, and three evolutionary branches were obtained: P. likiangensis was located on one branch, two P. wilsonii populations were grouped onto a second branch, and two P. neoveitchii populations were grouped onto a third branch. The relationship of P. wilsonii with P. likiangensis was closer than that with P. neoveitchii. ABBA-BABA analysis revealed that the gene flow between P. neoveitchii and P. wilsonii was greater than that between P. neoveitchii and P. likiangensis. Compared with the background population of P. neoveitchii, the genes that were selected in the P. wilsonii population were mainly related to plant stress resistance, stomatal regulation, plant morphology and flowering. The genes selected in the P. likiangensis population were mainly related to plant stress resistance, leaf morphology and flowering. Selective sweeps were beneficial for improving the adaptability of spruce species to different habitats as well as to accelerate species differentiation. The frequent gene flow between spruce species makes their evolutionary relationships complicated. Insight into gene flow and selection pressure in spruce species will help us further understand their phylogenetic relationships and provide a scientific basis for their introduction, domestication and genetic improvement.
1. Introduction
Spruce (Picea) is an important component of coniferous forests in the Northern Hemisphere and is widely distributed there [1]. Most conifers have a long generation time, a large population size [2,3,4], weak interspecific reproductive isolation [5] and slow molecular evolution [6,7]. Picea experienced rapid differentiation during the two periods of Qinghai-Tibet Plateau uplift in the Pliocene and the Quaternary glacial climate oscillation [8], and the frequent interspecific gene flow and reticulate evolution within the genus [9] have further complicated interspecific evolutionary relationships. Gene flow refers to the process by which genes move spatially from one location or group to another [10]. Species differentiation can occur despite gene flow [11]; that is, there is continuous gene flow between species with near or sympatric distributions, and new species are generated through differential selection [12,13]. For conifers with long generation times, it can take a long time from the start of differentiation to the cessation of gene flow. It has been suggested that gene flow between different species continues to decrease over time when species are under isolation or selection pressure [14]. Therefore, clarification of gene flow and selection pressure between spruce species is important for further understanding the phylogeny of Picea.
Asia, with 24 of the 35 species of spruce [1,15], is one of the hotspots of spruce diversity. Among these species, P. wilsonii, P. neoveitchii and P. likiangensis are endemic to China. P. wilsonii and P. neoveitchii are distributed in Central and Western China, whereas P. likiangensis is distributed in areas with relatively high altitudes in Southwest China. Although P. likiangensis and P. neoveitchii are heterogeneously distributed, P. wilsonii has an overlapping distribution with P. neoveitchii and neighbouring distribution with P. likiangensis, which provides an opportunity for gene flow between the three species. A phylogenetic tree based on chloroplast DNA (cpDNA) sequences [16] and comprehensive cpDNA sequences, mitochondrial DNA (mtDNA) sequences and nuclear gene fragments [17] showed that P. wilsonii and P. neoveitchii were all clustered in a clade but were not sister species, while the genetic relationship between P. wilsonii and P. likiangensis was closer than that between P. wilsonii and P. neoveitchii [18]. P. wilsonii and P. neoveitchii differentiated earlier, approximately 16 million years ago (mya) [19], while P. wilsonii and P. likiangensis differentiated later, at approximately 6.3 mya [20]. Zou et al. [19] hypothesised that P. morrisonicola recently diverged from P. wilsonii and that there was continuous gene flow based on 18 gene fragments from the chloroplast, mitochondrial and nuclear genomes, while there was also continuous mtDNA gene flow from P. neoveitchii to P. wilsonii. Wang et al. [21] investigated the degree and direction of gene interpenetration among three spruce species in their sympatric distribution area based on cpDNA, mtDNA and nuclear gene fragments and showed that mtDNA, which has the lowest amount of gene flow, has the highest degree of introgression, with little or no introgression of nuclear genes, usually from native to invasive species. Molecular markers, which are subject to high interspecific gene flow, may be protected from introgression [22] and thus are theoretically more suitable for species identification [23].
However, molecular markers based on cytoplasmic genes or nuclear gene fragments contain limited genetic information, and the large genomes of Picea make resequencing too costly. Therefore, P. pungens and P. jezoensis were used as outgroups in this study. P. wilsonii, P. neoveitchii and the close relative P. likiangensis [18] were selected as the experimental materials. Genome-wide single nucleotide polymorphism (SNP) markers were obtained by genotyping-by-sequencing (GBS) technology to study the gene flow among the three spruce species and the genes under selection during species differentiation. To explain the phylogenetic relationships of these three species from the perspective of the whole genome, we revealed the function of the selected genes during species differentiation and provided a scientific basis for the introduction of Picea.
2. Results
2.1. Sequencing and Variant Discovery
The raw image data files obtained from GBS were transformed into raw sequences by base identification analysis. Sixty Picea samples were sequenced to obtain a total of 328.24 Gb of raw data, and the amount of clean data generated after removing the low-quality sequences was 317.10 Gb, with an average data volume of 5.28 Gb per sample. The quality of the sequenced bases was high (Q20 ≥ 97.83%, Q30 ≥ 93.32%), the GC content with a mean of 39.55% was distributed normally, and the average alignment rate between the population samples and the P. abies reference genome was 96.43%, indicating that the four spruce species were highly similar to P. abies. A total of 9,162,074 SNP loci were obtained after detection by GATK ver. 4.2.2.0 software (McKenna, MA, USA). After filtering under the conditions of a minor allele frequency (MAF) > 0.01 and maximum missing rate < 0.5, a total of 1,710,226 high-quality SNP loci were obtained for population analysis.
2.2. Phylogenetic and Population Structure Analyses
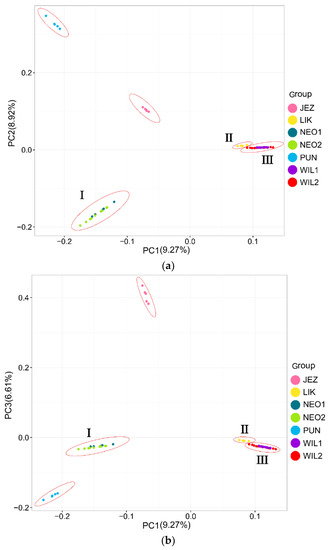
In the phylogenetic tree constructed by the maximum likelihood (ML) method and using P. jezoensis and P. pungens as outgroups, shown in Figure 1, the 50 Picea individuals clustered into three main taxa (I–III). Among them, Group I consisted of two P. neoveitchii populations collected from Gansu and Shaanxi, Group II consisted of P. likiangensis from Yunnan, and Group III consisted of two P. wilsonii groups from Shanxi and Hubei. Admixture ver. 1.3.0 software (Alexander, CA, USA) was used to further evaluate the population structure with different K values (Figure 1). According to the cross-validation (CV) error values presented in Figure 2, the CV error was smaller when K = 2–7, indicating more reasonable results with 2–7 subgroups. When K = 2, two populations of P. wilsonii were separated from the other populations, while P. likiangensis had two genetic components. When K = 3, two populations of P. neoveitchii were separated from the P. jezoensis and P. pungens components to form a new component, and the population of P. likiangensis was composed of the P. wilsonii component and the P. jezoensis and P. pungens components. When K = 4, two populations of P. wilsonii were separated to form two new components. The population of P. likiangensis was composed of the component of P. wilsonii from Shanxi and the component of P. jezoensis and P. pungens. When K = 5, P. likiangensis separated to form a new component, and some individuals of P. wilsonii from Hubei clustered into one component with P. wilsonii from Shanxi, and the population structure was more consistent with the groups depicted in the phylogenetic tree. When K = 6, P. jezoensis and P. pungens were separated, and some individuals of P. wilsonii from Hubei, which had previously been clustered as a component with P. wilsonii from Shanxi, were clustered as a component with P. likiangensis. When K = 7, P. wilsonii from Shanxi separated to form two components, while some individuals of P. wilsonii from Hubei that had clustered with P. likiangensis into one component separated to form a new component, and the remaining individuals of P. wilsonii from Hubei clustered with some of those from Shanxi into one component. Therefore, P. wilsonii is more closely related to P. likiangensis than to P. neoveitchii, and there is some differentiation between P. wilsonii from Hubei and Shanxi, while there is less of a difference between the two populations of P. neoveitchii. To further analyse the population structure, principal component analysis (PCA) was used to reveal the relationships among the 60 spruce samples. As shown in Figure 3, because of the complex genetic background of the natural spruce populations and the large amount of variation, the three principal components explained little variation, but PCA also revealed three main groups: group I was P. neoveitchii, group II was P. likiangensis and group III was P. wilsonii. This is consistent with the grouping from the phylogenetic tree and population structure analysis, further validating the topology of the phylogenetic tree.
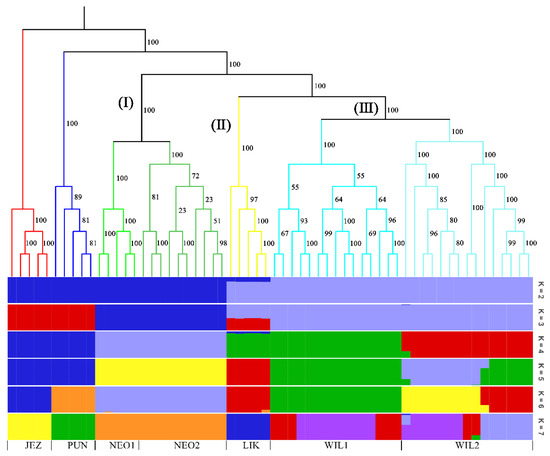
Figure 1.
Maximum likelihood tree and structure analysis histogram of five spruce species based on SNP markers. JEZ, P. jezoensis; PUN, P. pungens; NEO1, P. neoveitchii from Gansu; NEO2, P. neoveitchii from Shaanxi; LIK, P. likiangensis; WIL1, P. wilsonii from Shanxi; WIL2, P. wilsonii from Hubei. The colors in the upper part of the figure represent different groups and the colors in the lower part of the figure represent different genetic components.
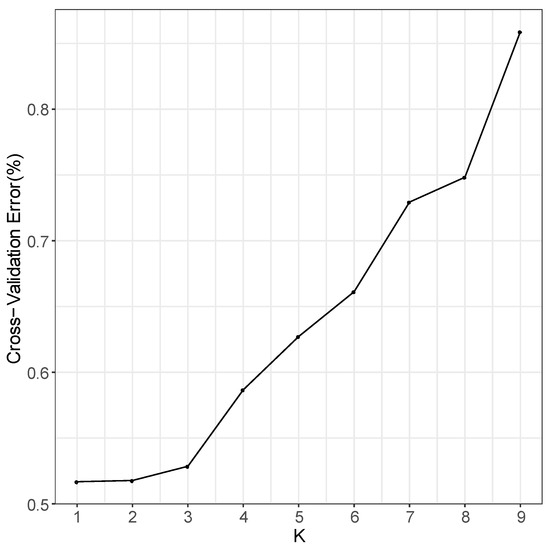
Figure 2.
Cross-validation error value.
2.3. Gene Flow between Populations
Based on the tree topology shown in Figure 4, gene flow between species was further revealed using the ABBA-BABA test. When P. neoveitchii was the ancestral group and P. wilsonii and P. likiangensis were sister species, the ABBA-BABA test showed a significant positive value (D = 0.030, Z score > 3) (Table 1). A total of 6833 alleles were shared between P. neoveitchii and P. wilsonii, while 6438 alleles were shared between P. neoveitchii and P. likiangensis. Thus, there was unequal gene flow between P. neoveitchii and the two sister species. The gene flow rate between P. neoveitchii and P. wilsonii was greater than that between P. neoveitchii and P. likiangensis; that is, there was significant gene flow between P. wilsonii and P. neoveitchii.
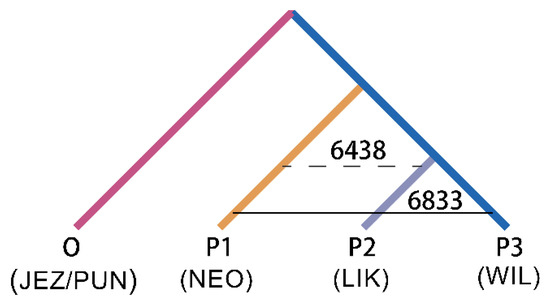
Figure 4.
ABBA-BABA test tree model of five spruce species. NEO, P. neoveitchii from Gansu and Shaanxi; WIL1, P. wilsonii from Shanxi and Hubei; others are the same as in Figure 1.

Table 1.
ABBA-BABA test of five spruce species.
2.4. Selective Sweeps Increased Genetic Differentiation between P. wilsonii, P. likiangensis and P. neoveitchii
Selective sweep analysis mainly detects the genes under selection in a population and further reveals the adaptive mechanism of population evolution. In this study, two populations of P. neoveitchii were used as background group A and two populations of P. wilsonii and P. likiangensis were used as test groups B and C, respectively. Nucleotide diversity (π) and population genetic difference (Fst) were used in combination to identify regions where selective sweeps occurred during species differentiation. A total of 948 selected genes were identified in different subgroups in comparison with the P. neoveitchii background group, with a total of 326 genes between P. wilsonii and P. neoveitchii and 622 genes between P. likiangensis and P. neoveitchii (Tables S1 and S2).
As shown in Figure 5, the criteria for defining selective sweeps in P. wilsonii, using P. neoveitchii as the background group, were Fst(B) ≥ 0.77 and π(B) ≤ 4.33 × 10⁻⁵ (−lgπ(B) ≥ 4.36). Based on GO enrichment analysis, it was clear that the molecular functions of the selected genes were mainly concentrated in protein binding, nucleic acid binding, DNA-binding transcription factor activity and methyltransferase activity (Figure 6; Table S3). Pathway analysis was performed on the selected genes, and hypergeometric tests were applied to identify pathways that were significantly enriched among the genes detected in P. wilsonii compared to those in the entire genome of the background population of P. neoveitchii. Figure 7 shows that the pathways mainly related to lysine degradation, limonene and pinene degradation, and arginine and proline metabolism. Among the selected genes, genes associated with plant disease resistance (e.g., BSK5 and ERECTA) and environmental stress (e.g., ABCC2, CESA6, CUL, UPF3, VIR and ZIF1) were identified, which may be associated with the wide distribution and environmental adaptability of P. wilsonii. Two genes associated with plant morphology (Sb09 and SRL1), three genes associated with plant stomatal regulation (KIN10, NPF4.6 and SCRM2) and six genes associated with flowering (AIL5, AP2, NAP1, NPF8.3, PRMT6 and ubp13) were also identified within the selected regions. This suggests that the functions of the target genes subject to selection between P. wilsonii and P. neoveitchii were mainly plant stress tolerance, stomatal regulation and flowering.
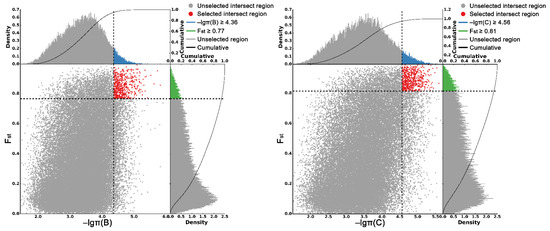
Figure 5.
Genomic regions with selective sweep in P. wilsonii and P. likiangensis. B, P. wilsonii; C, P. likiangensis.
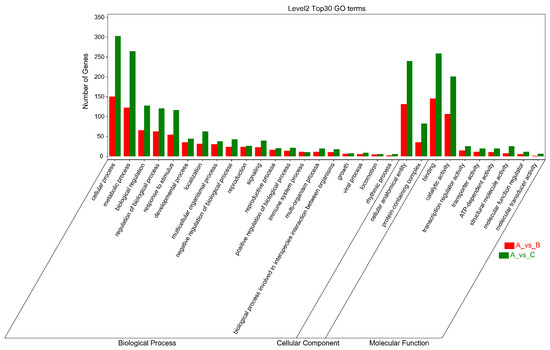
Figure 6.
Cluster map for GO enrichment analysis of selected genes. A, P. neoveitchi; B, P. wilsonii; C, P. likiangensis.
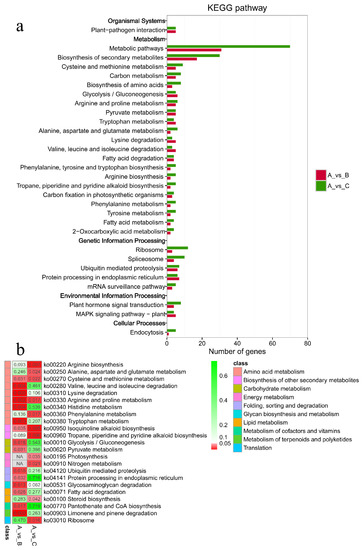
Figure 7.
KEGG enrichment analysis of selected genes. (a) Hot map for significance of pathway. (b) Number of genes for pathway. A, P. neoveitchii; B, P. wilsonii; C, P. likiangensis.
P. likiangensis was subjected to selective sweep analysis in comparison with the background group of P. neoveitchii, with the criteria being Fst(C) ≥ 0.81 and π(C) ≤ 2.75 × 10⁻⁵ (−lgπ(C) ≥ 4.56) (Figure 5). GO enrichment analysis (Figure 6; Table S4) and pathway analysis (Figure 7) of the selected genes revealed that their molecular functions were mainly in protein binding, nucleic acid binding, DNA binding and RNA binding. The pathways were mainly concentrated in isoquinoline alkaloid biosynthesis, tropane, piperidine and pyridine alkaloid biosynthesis, arginine biosynthesis, and ribosomes. Three genes associated with flowering time (ubp13, CRY1 and sc35) were found in selected areas of P. likiangensis in contrast to P. neoveitchii, which may be related to the adaptation of P. likiangensis to high-altitude environments. There were also 13 genes related to plant stress resistance (RAV1, KPNB1, GT2, SRG1, NAC100, SGS3, AG1, EXLA2, ERECTA, CESA6, CYP86A2, GR and CYP74A) in the selected region, indicating that P. likiangensis and P. neoveitchii were highly divergent in terms of plant stress tolerance. In addition, a gene related to leaf morphology, SRL1, and two genes associated with phosphorus regulation, ALMT5 and WRKY42, were identified.
3. Discussion
3.1. Phylogeny and Gene Flow Characteristics
Recent radiative divergence and frequent interspecific introgression of Picea complicated the phylogenetic relationships within the genus. The Bayesian phylogenetic tree of Picea based on chloroplast, mitochondrial and nuclear gene fragments showed that P. likiangensis and P. neoveitchii evolved from a common ancestor, and their relationship was closer than that of either of them with P. wilsonii [17]. In contrast, an ML phylogenetic tree based on the whole genome and PCA in our study showed that P. likiangensis was more closely related to P. wilsonii than to the other species, which was consistent with the results of the phylogenetic tree constructed by Feng et al. [18] based on nuclear gene transcriptome data. Through the study of SNP site variation differentiation of nrDNA and pollen morphological variation, a natural hybrid between P. likiangensis and P. wilsonii, P. purpurea, was found [24,25]. Specifically, a Bayesian computing (ABC) method was used to detect the variation in nrDNA sequences, and it was found that P. purpurea was a natural hybrid of P. likiangensis and P. wilsonii, with 69% of its genetic components from P. likiangensis and 31% from P. wilsonii [24]. A study of pollen morphology revealed that the surface texture of the pollen of P. purpurea was consistent with that of P. likiangensis, and the morphologies of pollen sacs and pollen bodies were similar to those of P. wilsonii, so it was also presumed to be a hybrid of P. likiangensis and P. wilsonii [25]. However, a study based on nuclear gene transcriptome data suggested that P. purpurea was not a hybrid and found that P. brachytyla var. brachytyla may be a variety of hybrid origin. Part of its genetic composition is attributable to P. wilsonii, and the other part is closely related to P. likiangensis, P. brachytyla var. complanata and P. farreri [9]. These results further indicated that P. likiangensis was closely related to P. wilsonii, and there was frequent gene exchange between them. The cpDNA of Picea was paternally inherited, its mtDNA was maternally inherited and their DNA variation was more easily lost compared to that of nrDNA, while species-specific mutations accumulated at a faster rate, which tended to distort the true interspecific relationships. The genetic information contained in a single or multiple nuclear gene fragments is limited, and the study of Shen et al. [9] suggested that at least 600 nuclear genes were required to resolve the interspecific relationships of Picea. The small number of nuclear genes makes it difficult to fully and truly reflect the evolutionary information of species [26]. Our study better reflects the evolutionary relationships between the three species at the genome-wide level.
Although the divergence between P. neoveitchii and P. wilsonii occurred early, there was continuous mitochondrial gene introgression and little gene introgression [19] due to the overlapping distribution areas of P. wilsonii and P. neoveitchii in their natural environment. Moreover, there was some degree of nuclear gene introgression but less introgression in the chloroplast genome [21]. However, the genome-wide ABBA-BABA analysis performed in our study showed that the gene flow rate between P. wilsonii and P. neoveitchii was greater than that between P. likiangensis and P. neoveitchii, and there was also significant gene flow between P. wilsonii and P. likiangensis. Previous studies used nuclear gene fragments to analyse gene flow between P. wilsonii and P. neoveitchii [19], making it difficult to fully reflect the true extent of gene flow in the nuclear genome.
3.2. Selective Sweeps Contributing to Adaptation in Picea
Selective sweeps usually result in a reduction in the diversity of the locus and associated gene regions, and they facilitate the adaptation of species to their environment. Although the number of species in Picea is relatively small, the genus is distributed from a temperate continental climate at 23° N to a cold temperate climate at 53° N and alpine or subalpine landforms. Selective sweep analysis could reveal key gene regions associated with differentiation among species in Picea, furthering our understanding of spruce environmental adaptation mechanisms. In our study, P. neoveitchii was used as the background population, and the genes selectively swept from the background population in P. wilsonii and P. likiangensis were mainly associated with plant stress resistance, flowering and leaf morphology. In Arabidopsis thaliana, AIL5 is involved in the regulation of inflorescence development in coordination with auxin [27], ubp13 is involved in the biological clock and photoperiodic flowering regulation [28], CESA6 is important for salt stress tolerance [29] and ERECTA controls developmental processes and disease resistance [30]. NAP1 plays an important role in the flowering process of Phyllostachys edulis [31]. The population of P. neoveitchii is sparse, narrowly distributed and extremely strict in its habitat requirements. It is scattered in forests or rock crevices at 1300–2000 m [32], while P. wilsonii has strong adaptability and is widely distributed and P. likiangensis is distributed in the alpine zone of acidic mountain brown forest soil at an altitude of 2500–3800 metres [15]. P. neoveitchii has stricter requirements for site conditions than P. wilsonii and P. likiangensis. Therefore, the genes selected in P. wilsonii and P. likiangensis were mainly genes that improve plant stress resistance. At the same time, due to differences in distribution range and region, phenology also differs among these species, and the genes that control plant development and photoperiod are under selection. This is similar to research results for Juglans sigillata and J. regia; Li et al. [33] also found genes related to flowering time in the selective sweep region of J. sigillata and J. regia. In addition, a gene related to leaf morphology, SRL1, was also identified, and needle leaf morphology is an important morphological indicator to distinguish spruce species. The leaves of P. neoveitchii and P. wilsonii are quadrangular; the leaves of P. likiangensis are flat quadrangular [15]. The needles of P. neoveitchii are larger than those of both P. wilsonii and P. likiangensis, the smaller needles help P. wilsonii and P. likiangensis to adapt to higher latitudes or higher altitudes. Two genes related to phosphorus regulation were found in the selected area of P. likiangensis, which may be because the natural population of P. likiangensis grows in acidic mountain brown forest soil, where the content of unstable total phosphorus in the humus is high [34] and phosphorus is easily lost through leaching. For adaptation to the local environment, the functions of genes related to phosphorus regulation in P. likiangensis are enhanced and differentiated. Among the genes under differential selection between P. wilsonii and P. neoveitchii, genes related to stomatal regulation and a gene related to plant height, Sb09, were also found. Each opening and closing of the stomata affect the transpiration, photosynthesis, and respiration of the plant. When the stomata of the plant are opened, transpiration becomes stronger, thereby protecting the plant from UV damage. The variation in stomatal regulation of P. wilsonii has also further enhanced its adaptability to the external environment, thus giving it a wider distribution than those of P. likiangensis and P. neoveitchii. In addition, P. wilsonii also has a taller plant height than P. neoveitchii, which allows P. wilsonii to receive more light and become the dominant species in the community. With the uplift of the Tibetan Plateau and the oscillation of the Quaternary glaciation, the environmental adaptation of spruce species was enhanced through the selective sweep of rapidly fixed favourable mutant genes under the pressure of environmental change and thus promoted the differentiation of species within the genus.
4. Materials and Methods
4.1. Sample Collection and DNA Extraction
Needle material was collected from a set of 60 Picea samples, including 15 trees of P. wilsonii from Hubei and Shanxi, 10 trees of P. neoveitchii from Shaanxi, 5 trees of P. neoveitchii from Gansu, 5 trees of P. likiangensis from Yunnan, 5 trees of P. jezoensis from Heilongjiang (Figure 8, Table S5) and 5 trees of P. pungens introduced from America. Samples were taken from trees at least 100 m apart in each population, and needles were dried directly with silica gel. The latitude, longitude and altitude of each sampling location were recorded using an eTrex GIS monitor (Garmin, Germany).
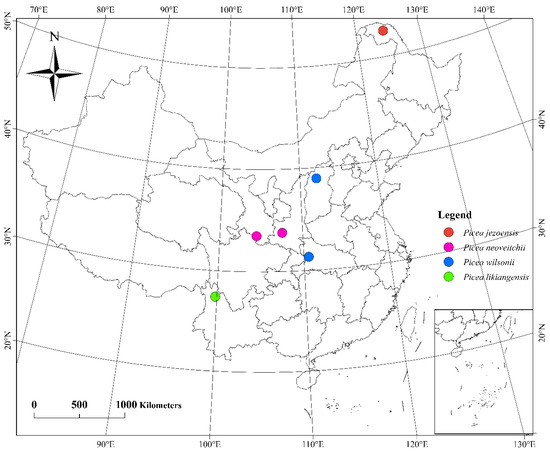
Figure 8.
Sampling site map of 55 Picea plants in China.
Silica-dried needles were used for DNA isolation with a modified cetyltrimethylammonium bromide (CTAB) extraction method [35]. A Nanodrop-1000 spectrophotometer (Nanodrop, MA, USA) was used to measure DNA purity (OD260/OD280), and 1% agarose gel electrophoresis was used to test DNA purity and integrity.
4.2. GBS and SNP Analysis
GBS was performed as described by Poland et al. [36,37] at Genedenovo Bioinformatics Technology Co., Ltd., Guangzhou, China. A total of 1.5 μg DNA from each sample was digested with EcoRI and NiaIII restriction enzymes in 96-well plates. The two ends of the digested DNA fragments were ligated with adapters using T4 DNA ligase, and then each sample was amplified. The 400–600 bp DNA fragments were isolated by electrophoresis for purification and sequenced on a HiSeq4000 instrument (Illumina, CA, USA).
For calling SNPs, raw data were processed to obtain clean data through the fastp application [38]. Adapter sequences and abnormal nucleotide bases at the 5′ terminus were removed from the raw data. Moreover, the low-quality ends of the reads were removed, including reads with ≥10% identified nucleotides (N) and reads with >50% bases having Phred quality scores of ≤10(S6). The remaining clean data were mapped to the European spruce reference genome using the Burrows—Wheeler Aligner (BWA) program ver. 0.7.8-r455 (Li, Cambridge, UK) with the command ‘mem-t4-k32-M’ [39]. After alignment, SNP calling on a population scale was performed using a Bayesian approach as implemented in the package GATK [40]. SNPs were filtered using GATK’s Variant Components with percent standards (Window, 4–filter “QD < 2.0 | | FS > 60.0 | | MQ < 40.0”, -G_filter “GQ < 20”). The resulting SNPs were then further filtered through VCFtools v.0.1.11 (Danecek, Cambridge, UK) [41], and only high-quality SNPs (MAF ≥ 0.01, maximum missing rate ≤ 0.5) were kept for phylogenetic analysis.
4.3. Phylogenetic, Population Structure and Principal Component Analyses
To reconstruct the phylogenetic relationships among species, a phylogenetic tree of 60 samples was constructed based on the SNP dataset using the ML method by IQTree v1.6.10 (Nguyen, Vienna, Austria) [42]. Bootstrap values were calculated 1000 times, and the GTR + I + G model was selected. The tree file was imported into the Interactive Tree of Life (ITOL) (https://itol.embl.de/itol.cgi (accessed on 30 August 2022)), which is an online tool for the display, annotation and management of phylogenetic trees.
Population structure cluster analysis based on ADMIXTURE ver. 1.3.0 software (Alexander, CA, USA) [43] was used for samples of Picea with K values ranging from 2 to 7. PLINK ver. 1.90 software (Purcell, MA, USA) [44] was used to convert the data file, and cross-validation was applied to explore convergence and determine the optimum number of clusters. The genetic component coefficient (Q) of each material in each subgroup was used to construct the population genetic structure matrix.
PCA was also used to evaluate the genetic structure of the spruce populations. The PCA of the SNPs was performed using the smartpca program in EIGENSOFT v5.0 (Patterson, MA, USA) [45], and the PCA distribution map was drawn by R ver. 4.2.1 software (Robert and Ross, Auckland, New Zealand).
4.4. Gene Flow and Introgression
To detect gene introgression among P. wilsonii, P. neoveitchii and P. likiangensis, we performed the ABBA-BABA test. The ABBA-BABA test, also known as the D-test, is used to detect whether the genetic composition of a population is affected by interspecific gene flow [46]. For the combination (((P1, P2), P3), outgroup) in the ABBA-BABA test, if the value of the D-test is positive, it means that P1 has the outgroup allele and P2 and P3 share the derived allele. The gene flow between P2 and P3 is greater than that between P1 and P3, that is, the ABBA pattern. If the D-test value is negative, it indicates that P1 and P3 share a derived allele, P2 has an outgroup allele and the gene flow between P1 and P3 is greater than that between P2 and P3, that is, the BABA pattern. Under the null hypothesis of incomplete lineage sorting (D = 0), the numbers of ABBA and BABA loci are expected to be equal. In this study, to avoid the effect of linkage disequilibrium between loci on ABBA-BABA detection, we first used PLINK ver. 1.90 software (Purcell, MA, USA) [44] to filter high-quality SNPs (indep-pairwise50 10 0.1). Then, we designated P. pungens and P. jezoensis as outgroups, P. neoveitchii as P1, P. likiangensis as P2 and P. wilsonii as P3 based on a phylogenetic tree constructed from genome-wide SNPs. A D-test analysis was performed using the Dtrios command of the Dsuite ver. 0.5-r44 software (Malinsky, Basel, Switzerland) package, calculated as D = (nABBA − nBABA)/(nABBA + nBABA) where nABBA is the total number of ABBA patterns and nBABA is the total number of BABA patterns [47]. To test for significance of the D-test, we used jackknife to calculate the z-score; when the absolute value of the z-score was greater than 3, the result was considered significant [46,48].
4.5. Genome-Wide Scan for Selection
The purpose of selective sweep analysis is to determine the selected region in the target population to further identify the selected genes and explain the species differentiation mechanism underlying population evolution at the genome-wide level. Selected regions are not only chromosomal regions with low genetic diversity but also regions with high rates of genetic differentiation among populations. Therefore, in this study, the selective scan region was determined by calculating population nucleotide diversity (π) and population genetic differentiation (Fst) with VCFtools v.0.1.11 (Danecek, Cambridge, UK) [41]. Based on the results of Fst and π at the top 5% threshold, significant regions were screened, and genes within the significant regions were extracted for pathway enrichment analysis. Pathway analysis based on the KEGG database can provide insight into the biological functions of genes and help screen genes enriched in metabolic pathways or signal transduction pathways.
5. Conclusions
In this study, we employed GBS technology to obtain genome-wide SNP markers and study the phylogenetic relationships, population structure, interspecific gene flow and selection pressure of P. wilsonii, P. neoveitchii and P. likiangensis. We found that P. wilsonii and P. likiangensis clustered onto one branch in the phylogenetic tree, and PCA also clustered them into one group, indicating that P. wilsonii and P. likiangensis are more closely related than the other pairs of species. Further ABBA-BABA analysis revealed that the gene flow rate between P. wilsonii and P. neoveitchii was greater than that between P. likiangensis and P. neoveitchii, probably because of the homozygous distribution of these two species. In the background population of P. neoveitchii, the genes that were selected in P. wilsonii were mainly related to plant stress resistance, stomatal regulation, plant morphology and flowering, while the genes selected in P. likiangensis were mainly related to plant stress resistance, leaf morphology and flowering time. The key functional genes under differential selection among spruce species were involved in improving species resistance, promoting flowering and fruiting ability, facilitating adaptation to different habitats, and continually enhancing the reproduction of breeding to advance evolution.
Supplementary Materials
The following supporting information can be downloaded at: https://www.mdpi.com/article/10.3390/plants11212993/s1, Table S1: Selected genes between P. wilsonii and P. neoveitchii; Table S2: Selected genes between P. likiangensis and P. neoveitchii; Table S3: GO enrichment (molecular function) analysis of selected genes between P. wilsonii and P. neoveitchii; Table S4: GO enrichment (molecular function) analysis of selected genes between P. likiangensis and P. neoveitchii; Table S5: Geographic information of the Picea populations in the study; Table S6: Statistics of nucleobase information before and after filtering.
Author Contributions
Conceptualization, Y.L., Z.J. (Zirui Jia) and Z.J. (Zeping Jiang); Data curation, Z.J. (Zirui Jia) and Z.J. (Zeping Jiang); Formal analysis, Y.L. and Y.W.; Funding acquisition, Z.J. (Zirui Jia) and S.A.; Investigation, S.A., Y.L., Y.W. and J.W.; Project administration, Z.J. (Zirui Jia); Resources, S.A., Y.L., Y.W. and J.W.; Software, Y.L., Y.W., W.N. and C.T.; Supervision, Z.J. (Zirui Jia) and Z.J. (Zeping Jiang); Writing—original draft, Y.L.; Writing—review & editing, Y.L., Z.J. (Zirui Jia), Z.J. (Zeping Jiang), A.Q. and E.C. All authors have read and agreed to the published version of the manuscript.
Funding
This research was funded by “Study of Phylogeography and Quaternary glacial refuge in Picea koraiensis (31500540)” funding by the National Natural Science Foundation of China, and “Research on genetic structure evaluation of germplasm resources and breeding technology in Picea neoveitchii” funding by the Gansu provincial financial innovation project.
Data Availability Statement
The raw sequencing data generated from this study have been deposited in NCBI SRA (https://www.ncbi.nlm.nih.gov/sra (accessed on 3 September 2022)) under the accession number PRJNA876367.
Acknowledgments
We thank Genedenovo Bioinformatics Technology Co., Ltd. for technical support on sequencing.
Conflicts of Interest
The authors declare no conflict of interest.
References
- Farjon, A. World Checklist and Bibliography of Conifers, 2nd ed.; Royal Botanic Gardens, Kew: London, UK, 2001; ISBN 978-1-84246-025-2. [Google Scholar]
- Schuster, W.S.F.; Mitton, J.B. Paternity and gene dispersal in limber pine(Pinus flexilis James). Heredity 2000, 84, 348–361. [Google Scholar] [CrossRef] [PubMed]
- Brown, G.R.; Gill, G.P.; Kuntz, R.J.; Langley, C.H.; Neale, D.B. Nucleotide diversity and linkage disequilibrium in loblolly pine. Proc. Natl. Acad. Sci. USA 2004, 101, 15255–15260. [Google Scholar] [CrossRef]
- Syring, J.; Farrell, K.; Businský, R.; Cronn, R.; Liston, A. Widespread genealogical nonmonophyly in species of Pinus subgenus strobus. Syst. Biol. 2007, 56, 163–181. [Google Scholar] [CrossRef] [PubMed]
- Ledig, F.T.; Hodgskiss, P.D.; Krutovskii, K.V.; Neale, D.B.; Eguiluz-Piedra, T. Relationships among the spruces(Picea, Pinaceae) of southwestern North America. Syst. Bot. 2004, 29, 275–295. [Google Scholar] [CrossRef]
- De La Torre, A.R.; Li, Z.; Van de Peer, Y.; Ingvarsson, P.K. Contrasting rates of molecular evolution and patterns of selection among gymnosperms and flowering plants. Mol. Biol. Evol. 2017, 34, 1363–1377. [Google Scholar] [CrossRef]
- Ran, J.-H.; Shen, T.-T.; Wang, M.-M.; Wang, X.-Q. Phylogenomics resolves the deep phylogeny of seed plants and indicates partial convergent or homoplastic evolution between Gnetales and angiosperms. Proc. R. Soc. B 2018, 285, 20181012. [Google Scholar] [CrossRef]
- Ran, J.-H.; Shen, T.-T.; Liu, W.-J.; Wang, P.-P.; Wang, X.-Q. Mitochondrial introgression and complex biogeographic history of the genus Picea. Mol. Phylogenet. Evol. 2015, 93, 63–76. [Google Scholar] [CrossRef]
- Shen, T.-T.; Ran, J.-H.; Wang, X.-Q. Phylogenomics disentangles the evolutionary history of spruces(Picea) in the Qinghai-Tibetan Plateau: Implications for the design of population genetic studies and species delimitation of conifers. Mol. Phylogenet. Evol. 2019, 141, 106612. [Google Scholar] [CrossRef]
- Morjan, C.L.; Rieseberg, L.H. How species evolve collectively: Implications of gene flow and selection for the spread of advantageous alleles. Mol. Ecol. 2004, 13, 1341–1356. [Google Scholar] [CrossRef]
- Abbott, R.; Albach, D.; Ansell, S.; Arntzen, J.W.; Baird, S.J.E.; Bierne, N.; Boughman, J.; Brelsford, A.; Buerkle, C.A.; Buggs, R.; et al. Hybridization and speciation. J. Evol. Biol. 2013, 26, 229–246. [Google Scholar] [CrossRef]
- Coyne, J.A.; Orr, H.A. Speciation; W. H. Freeman: New York, NY, USA, 2004; ISBN 978-0-87893-091-3. [Google Scholar]
- Lomolino, M.V.; Riddle, B.R.; Brown, J.H. Biogeography, 3rd ed.; Sinauer Associates: Sunderland, MA, USA, 2006; ISBN 978-0-87893-062-3. [Google Scholar]
- Owens, G.L.; Rieseberg, L.H. Hybrid incompatibility is acquired faster in annual than in perennial species of sunflower and tarweed: Brief communication. Evolution 2014, 68, 893–900. [Google Scholar] [CrossRef] [PubMed]
- Fu, L.; Mill, R.R. Pinaceae. In Flora of China; Wu, Z.-Y., Raven, P.H., Eds.; Science Press: Beijing, China, 1999; ISBN 978-0-915279-70-8. [Google Scholar]
- Bouillé, M.; Senneville, S.; Bousquet, J. Discordant mtDNA and cpDNA phylogenies indicate geographic speciation and reticulation as driving factors for the diversification of the genus Picea. Tree Genet. Genomes 2011, 7, 469–484. [Google Scholar] [CrossRef]
- Lockwood, J.D.; Aleksić, J.M.; Zou, J.; Wang, J.; Liu, J.; Renner, S.S. A new phylogeny for the genus Picea from plastid, mitochondrial, and nuclear sequences. Mol. Phylogenet. Evol. 2013, 69, 717–727. [Google Scholar] [CrossRef] [PubMed]
- Feng, S.; Ru, D.; Sun, Y.; Mao, K.; Milne, R.; Liu, J. Trans-lineage polymorphism and nonbifurcating diversification of the genus Picea. New Phytol. 2019, 222, 576–587. [Google Scholar] [CrossRef]
- Zou, J.; Sun, Y.; Li, L.; Wang, G.; Yue, W.; Lu, Z.; Wang, Q.; Liu, J. Population genetic evidence for speciation pattern and gene flow between Picea wilsonii, P. morrisonicola and P. neoveitchii. Ann. Bot. 2013, 112, 1829–1844. [Google Scholar] [CrossRef]
- Li, L.; Sun, Y.; Zou, J.; Yue, W.; Wang, X.; Liu, J. Origin and speciation of Picea schrenkiana and Picea smithiana in the center Asian highlands and Himalayas. Plant Mol. Biol. Rep. 2015, 33, 661–672. [Google Scholar] [CrossRef]
- Wang, X.; Lu, J.; Yue, W.; Li, L.; Zou, J.; Li, X.; He, X.; Duan, B.; Liu, J. Determining the extent and direction of introgression between three spruce species based on molecular markers from three genomes with different rates of gene flow. Plant Syst. Evol. 2016, 302, 691–701. [Google Scholar] [CrossRef]
- Nybom, H. Comparison of different nuclear DNA markers for estimating intraspecific genetic diversity in plants: DNA-markers and plant genetic diversity. Mol. Ecol. 2004, 13, 1143–1155. [Google Scholar] [CrossRef]
- Du, F.; Xu, F. Gene flow dependent introgression and species delimitation. Plant Divers. Resour. 2012, 34, 257–262. [Google Scholar] [CrossRef]
- Sun, Y.; Abbott, R.J.; Li, L.; Li, L.; Zou, J.; Liu, J. Evolutionary history of purple cone spruce (Picea purpurea) in the Qinghai-Tibet Plateau: Homoploid hybrid origin and Pleistocene expansion. Mol. Ecol. 2014, 23, 343–359. [Google Scholar] [CrossRef]
- Jia, Z.R.; Wang, J.H.; Zhang, S.G. Pollen morphology and its phylogenetic implications in the genus Picea. Plant Syst. Evol. 2014, 300, 461–473. [Google Scholar] [CrossRef]
- Springer, M.S.; Gatesy, J. The gene tree delusion. Mol. Phylogenet. Evol. 2016, 94, 1–33. [Google Scholar] [CrossRef] [PubMed]
- Krizek, B.A. Auxin regulation of Arabidopsis flower development involves members of the AINTEGUMENTA-LIKE/PLETHORA(AIL/PLT) family. J. Exp. Bot. 2011, 62, 3311–3319. [Google Scholar] [CrossRef] [PubMed]
- Cui, X.; Lu, F.; Li, Y.; Xue, Y.; Kang, Y.; Zhang, S.; Qiu, Q.; Cui, X.; Zheng, S.; Liu, B.; et al. Ubiquitin-specific proteases UBP12 and UBP13 act in circadian clock and photoperiodic flowering regulation in Arabidopsis. Plant Physiol. 2013, 162, 897–906. [Google Scholar] [CrossRef] [PubMed]
- Zhang, S.-S.; Sun, L.; Dong, X.; Lu, S.-J.; Tian, W.; Liu, J.-X. Cellulose synthesis genes CESA6 and CSI1 are important for salt stress tolerance in Arabidopsis: Cellulose synthesis is important for salt stress tolerance. J. Integr. Plant Biol. 2016, 58, 623–626. [Google Scholar] [CrossRef]
- Takahashi, T.; Shibuya, H.; Ishikawa, A. ERECTA contributes to non-host resistance to Magnaporthe oryzae in Arabidopsis. Biosci. Biotechnol. Biochem. 2016, 80, 1390–1392. [Google Scholar] [CrossRef]
- Zhang, Y.; Zhang, J.; Yang, D.; Jin, Y.; Liu, X.; Zhang, Z.; Gu, L.; Zhang, H. Genome-wide identification of NAP1 and function analysis in Moso bamboo (Phyllostachys edulis). Int. J. Mol. Sci. 2022, 23, 6491. [Google Scholar] [CrossRef]
- Qi, R.; Guo, X.; Zhao, Y.; Wei, H.-L.; Yang, F. Species diversity characteristics of the community of rare and endangered Picea neoveitchii in the Bailongjiang river. J. Northwest For. Univ. 2017, 32, 161–164. [Google Scholar] [CrossRef]
- Ji, F.; Ma, Q.; Zhang, W.; Liu, J.; Feng, Y.; Zhao, P.; Song, X.; Chen, J.; Zhang, J.; Wei, X.; et al. A genome variation map provides insights into the genetics of walnut adaptation and agronomic traits. Genome Biol. 2021, 22, 300. [Google Scholar] [CrossRef]
- Sun, Y.-H.; Li, C.; Zhang, J. Enzymatically labile phosphorus forms in humin from forest soils. Eurasian Soil Sci. 2020, 53, 1110–1118. [Google Scholar] [CrossRef]
- Tel-zur, N.; Abbo, S.; Myslabodski, D.; Mizrahi, Y. Modified CTAB procedure for DNA isolation from epiphytic cacti of the genera Hylocereus and Selenicereus (Cactaceae). Plant Mol. Biol. Rep. 1999, 17, 249–254. [Google Scholar] [CrossRef]
- Poland, J.; Endelman, J.; Dawson, J.; Rutkoski, J.; Wu, S.; Manes, Y.; Dreisigacker, S.; Crossa, J.; Sánchez-Villeda, H.; Sorrells, M.; et al. Genomic selection in wheat breeding using Genotyping-by-Sequencing. Plant Genome 2012, 5, 103–113. [Google Scholar] [CrossRef]
- Poland, J.A.; Brown, P.J.; Sorrells, M.E.; Jannink, J.-L. Development of high-density genetic maps for barley and wheat using a novel two-enzyme Genotyping-by-Sequencing approach. PLoS ONE 2012, 7, e32253. [Google Scholar] [CrossRef] [PubMed]
- Chen, S.-F.; Zhou, Y.-Q.; Chen, Y.-R.; Gu, J. Fastp: An ultra-fast all-in-one FASTQ preprocessor. Bioinformatics 2018, 34, i884–i890. [Google Scholar] [CrossRef] [PubMed]
- Li, H.; Durbin, R. Fast and accurate short read alignment with Burrows-Wheeler transform. Bioinformatics 2009, 25, 1754–1760. [Google Scholar] [CrossRef] [PubMed]
- McKenna, A.; Hanna, M.; Banks, E.; Sivachenko, A.; Cibulskis, K.; Kernytsky, A.; Garimella, K.; Altshuler, D.; Gabriel, S.; Daly, M.; et al. The Genome Analysis Toolkit: A MapReduce framework for analyzing next-generation DNA sequencing data. Genome Res. 2010, 20, 1297–1303. [Google Scholar] [CrossRef] [PubMed]
- Danecek, P.; Auton, A.; Abecasis, G.; Albers, C.A.; Banks, E.; DePristo, M.A.; Handsaker, R.E.; Lunter, G.; Marth, G.T.; Sherry, S.T.; et al. The variant call format and VCFtools. Bioinformatics 2011, 27, 2156–2158. [Google Scholar] [CrossRef]
- Nguyen, L.T.; Schmidt, H.A.; von Haeseler, A.; Minh, B.Q. IQ-TREE: A fast and effective stochastic algorithm for estimating maximum-likelihood phylogenies. Mol. Biol. Evol. 2015, 32, 268–274. [Google Scholar] [CrossRef]
- Alexander, D.H.; Novembre, J.; Lange, K. Fast model-based estimation of ancestry in unrelated individuals. Genome Res. 2009, 19, 1655–1664. [Google Scholar] [CrossRef]
- Purcell, S.; Neale, B.; Todd-Brown, K.; Thomas, L.; Ferreira, M.A.R.; Bender, D.; Maller, J.; Sklar, P.; de Bakker, P.I.W.; Daly, M.J.; et al. PLINK: A tool set for whole-genome association and population-based linkage analyses. Am. J. Hum. Genet. 2007, 81, 559–575. [Google Scholar] [CrossRef]
- Patterson, N.; Price, A.L.; Reich, D. Population structure and eigenanalysis. PLoS Genet. 2006, 2, e190. [Google Scholar] [CrossRef] [PubMed]
- Durand, E.Y.; Patterson, N.; Reich, D.; Slatkin, M. Testing for ancient admixture between closely related populations. Mol. Biol. Evol. 2011, 28, 2239–2252. [Google Scholar] [CrossRef] [PubMed]
- Malinsky, M.; Matschiner, M.; Svardal, H. Dsuite-Fast D-statistics and related admixture evidence from VCF files. Mol. Ecol. Resour. 2021, 21, 584–595. [Google Scholar] [CrossRef] [PubMed]
- Novikova, P.Y.; Hohmann, N.; Nizhynska, V.; Tsuchimatsu, T.; Ali, J.; Muir, G.; Guggisberg, A.; Paape, T.; Schmid, K.; Fedorenko, O.M.; et al. Sequencing of the genus Arabidopsis identifies a complex history of nonbifurcating speciation and abundant trans-specific polymorphism. Nat. Genet. 2016, 48, 1077–1082. [Google Scholar] [CrossRef]


Publisher’s Note: MDPI stays neutral with regard to jurisdictional claims in published maps and institutional affiliations. |
© 2022 by the authors. Licensee MDPI, Basel, Switzerland. This article is an open access article distributed under the terms and conditions of the Creative Commons Attribution (CC BY) license (https://creativecommons.org/licenses/by/4.0/).