
New Genomic Regions Identified for Resistance to Spot Blotch and Terminal Heat Stress in an Interspecific Population of Triticum aestivum and T. spelta

 ,
, 
Abstract
1. Introduction
2. Results
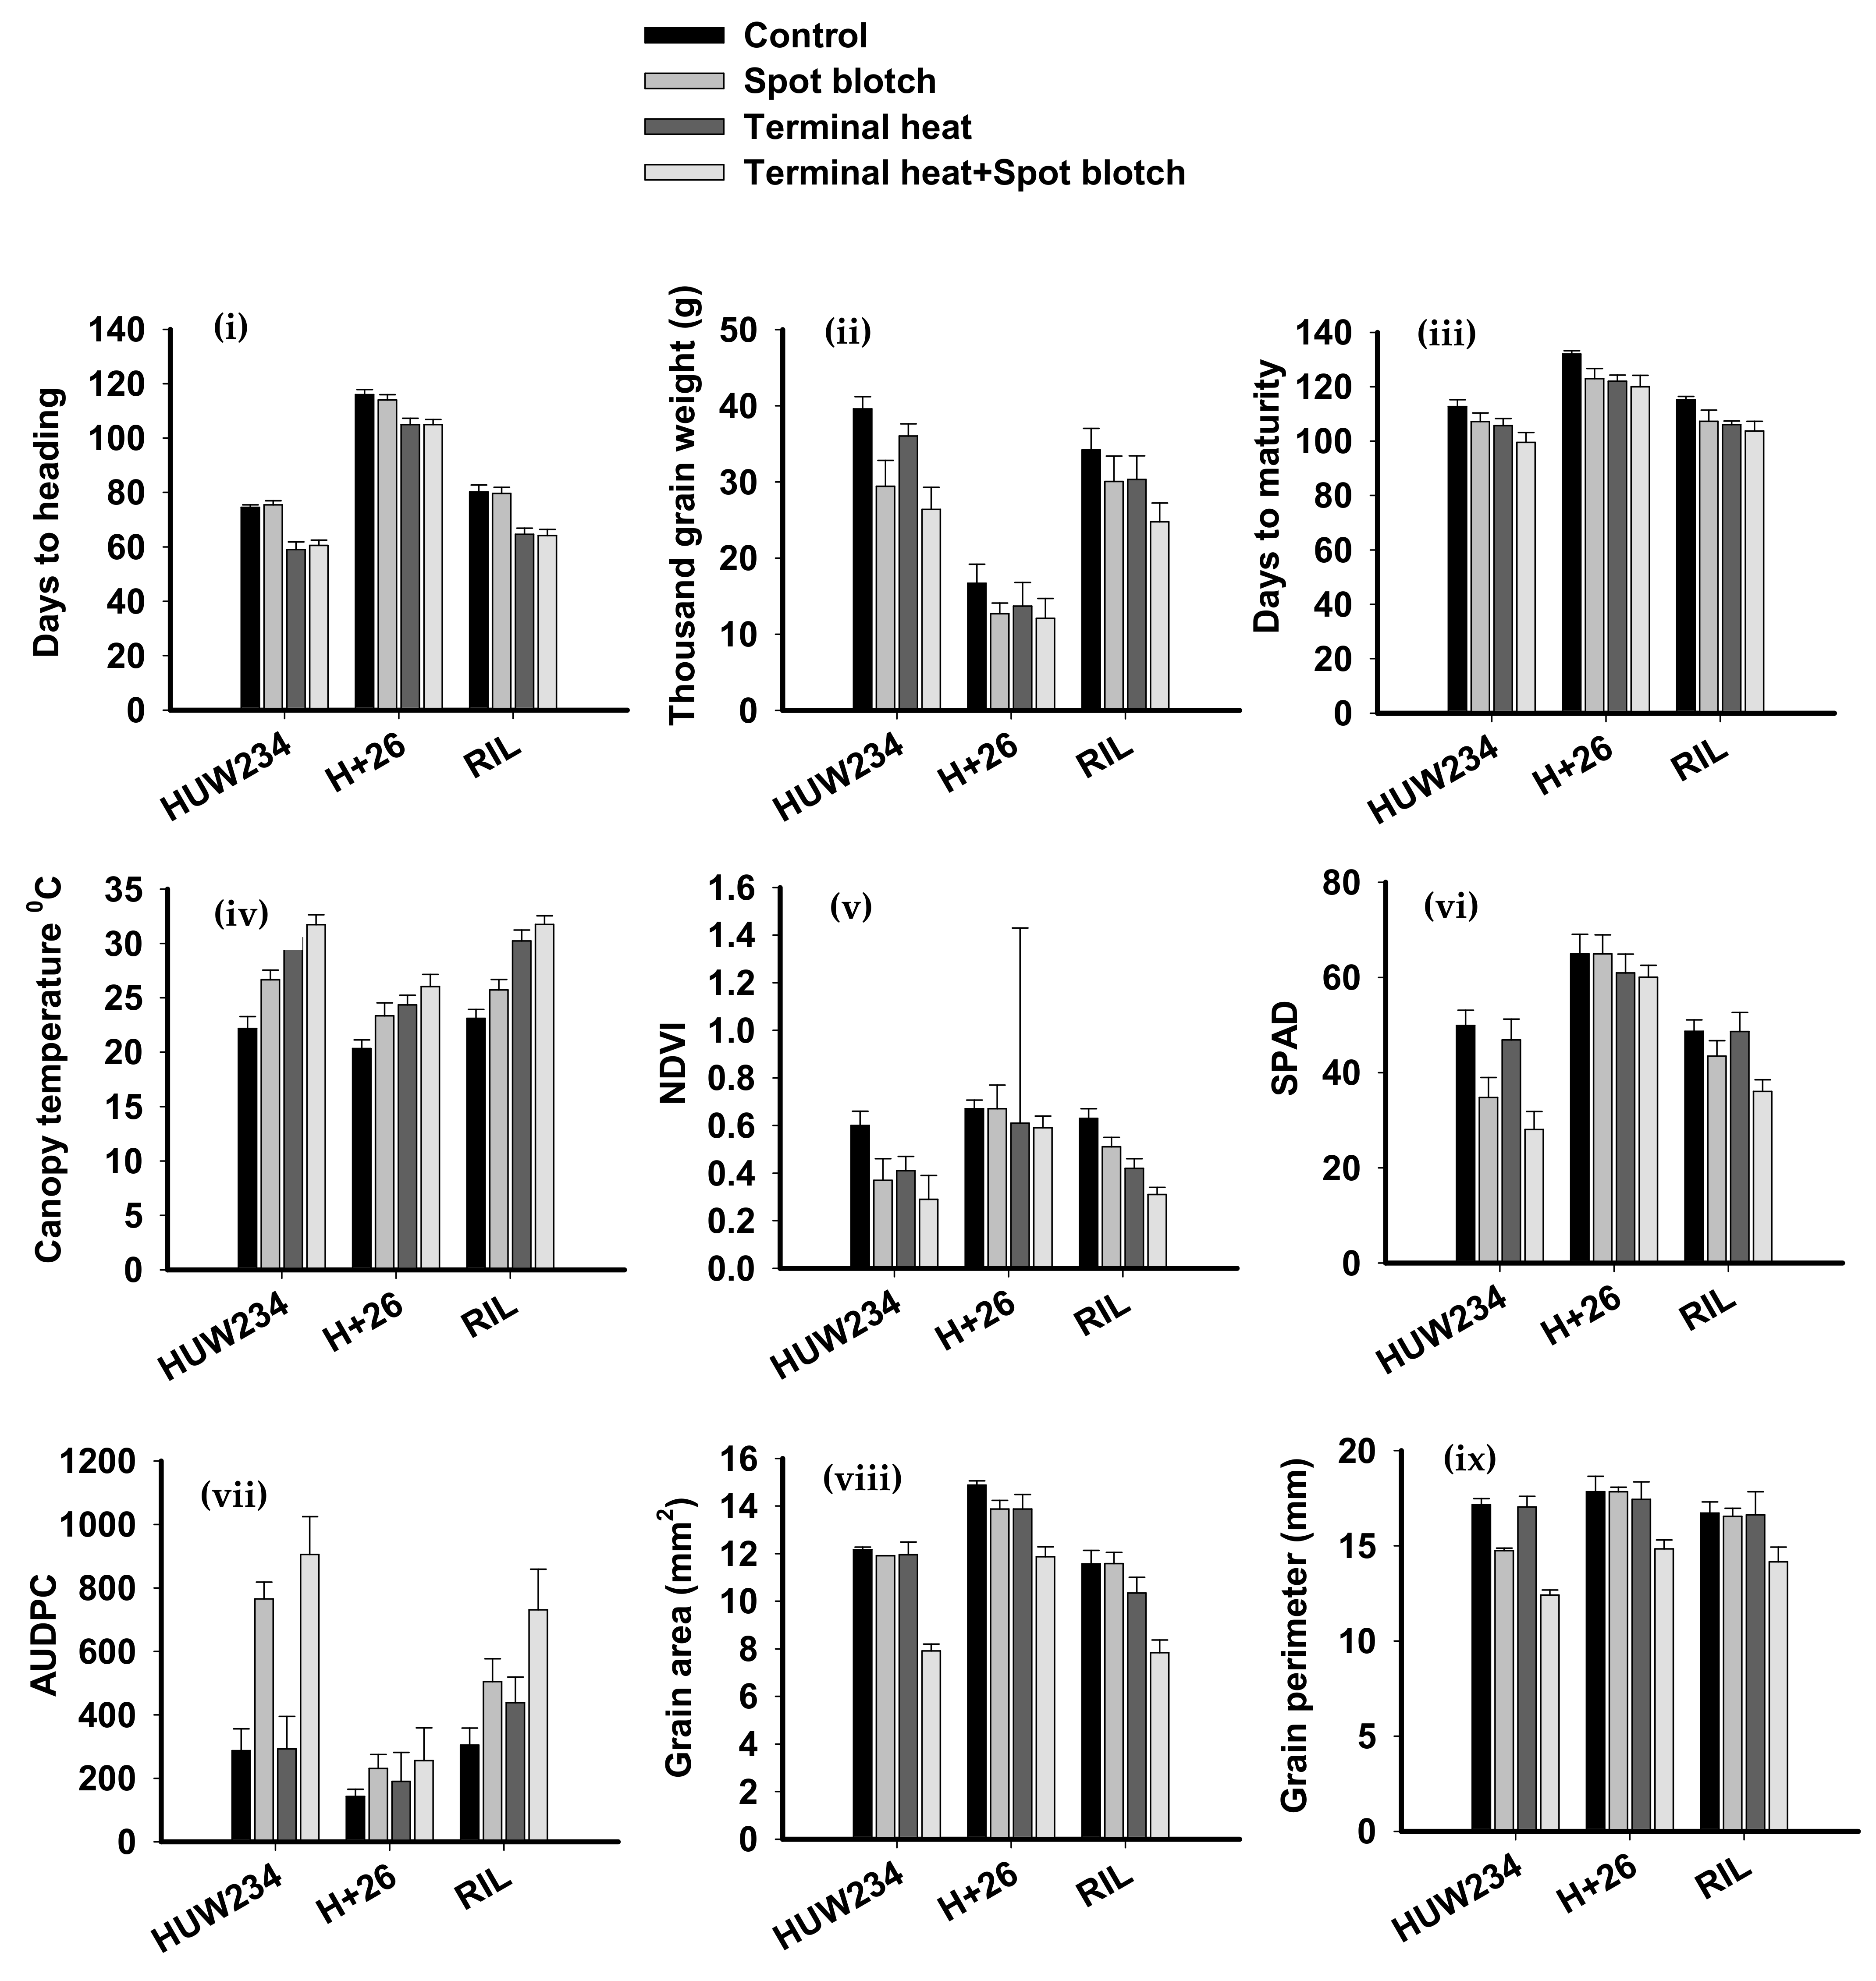
2.1. Descriptive Statistics for Quantitative Traits Indicate Reductions in Yield Contributing Traits Due to the Combined Stress of SB and Terminal Heat
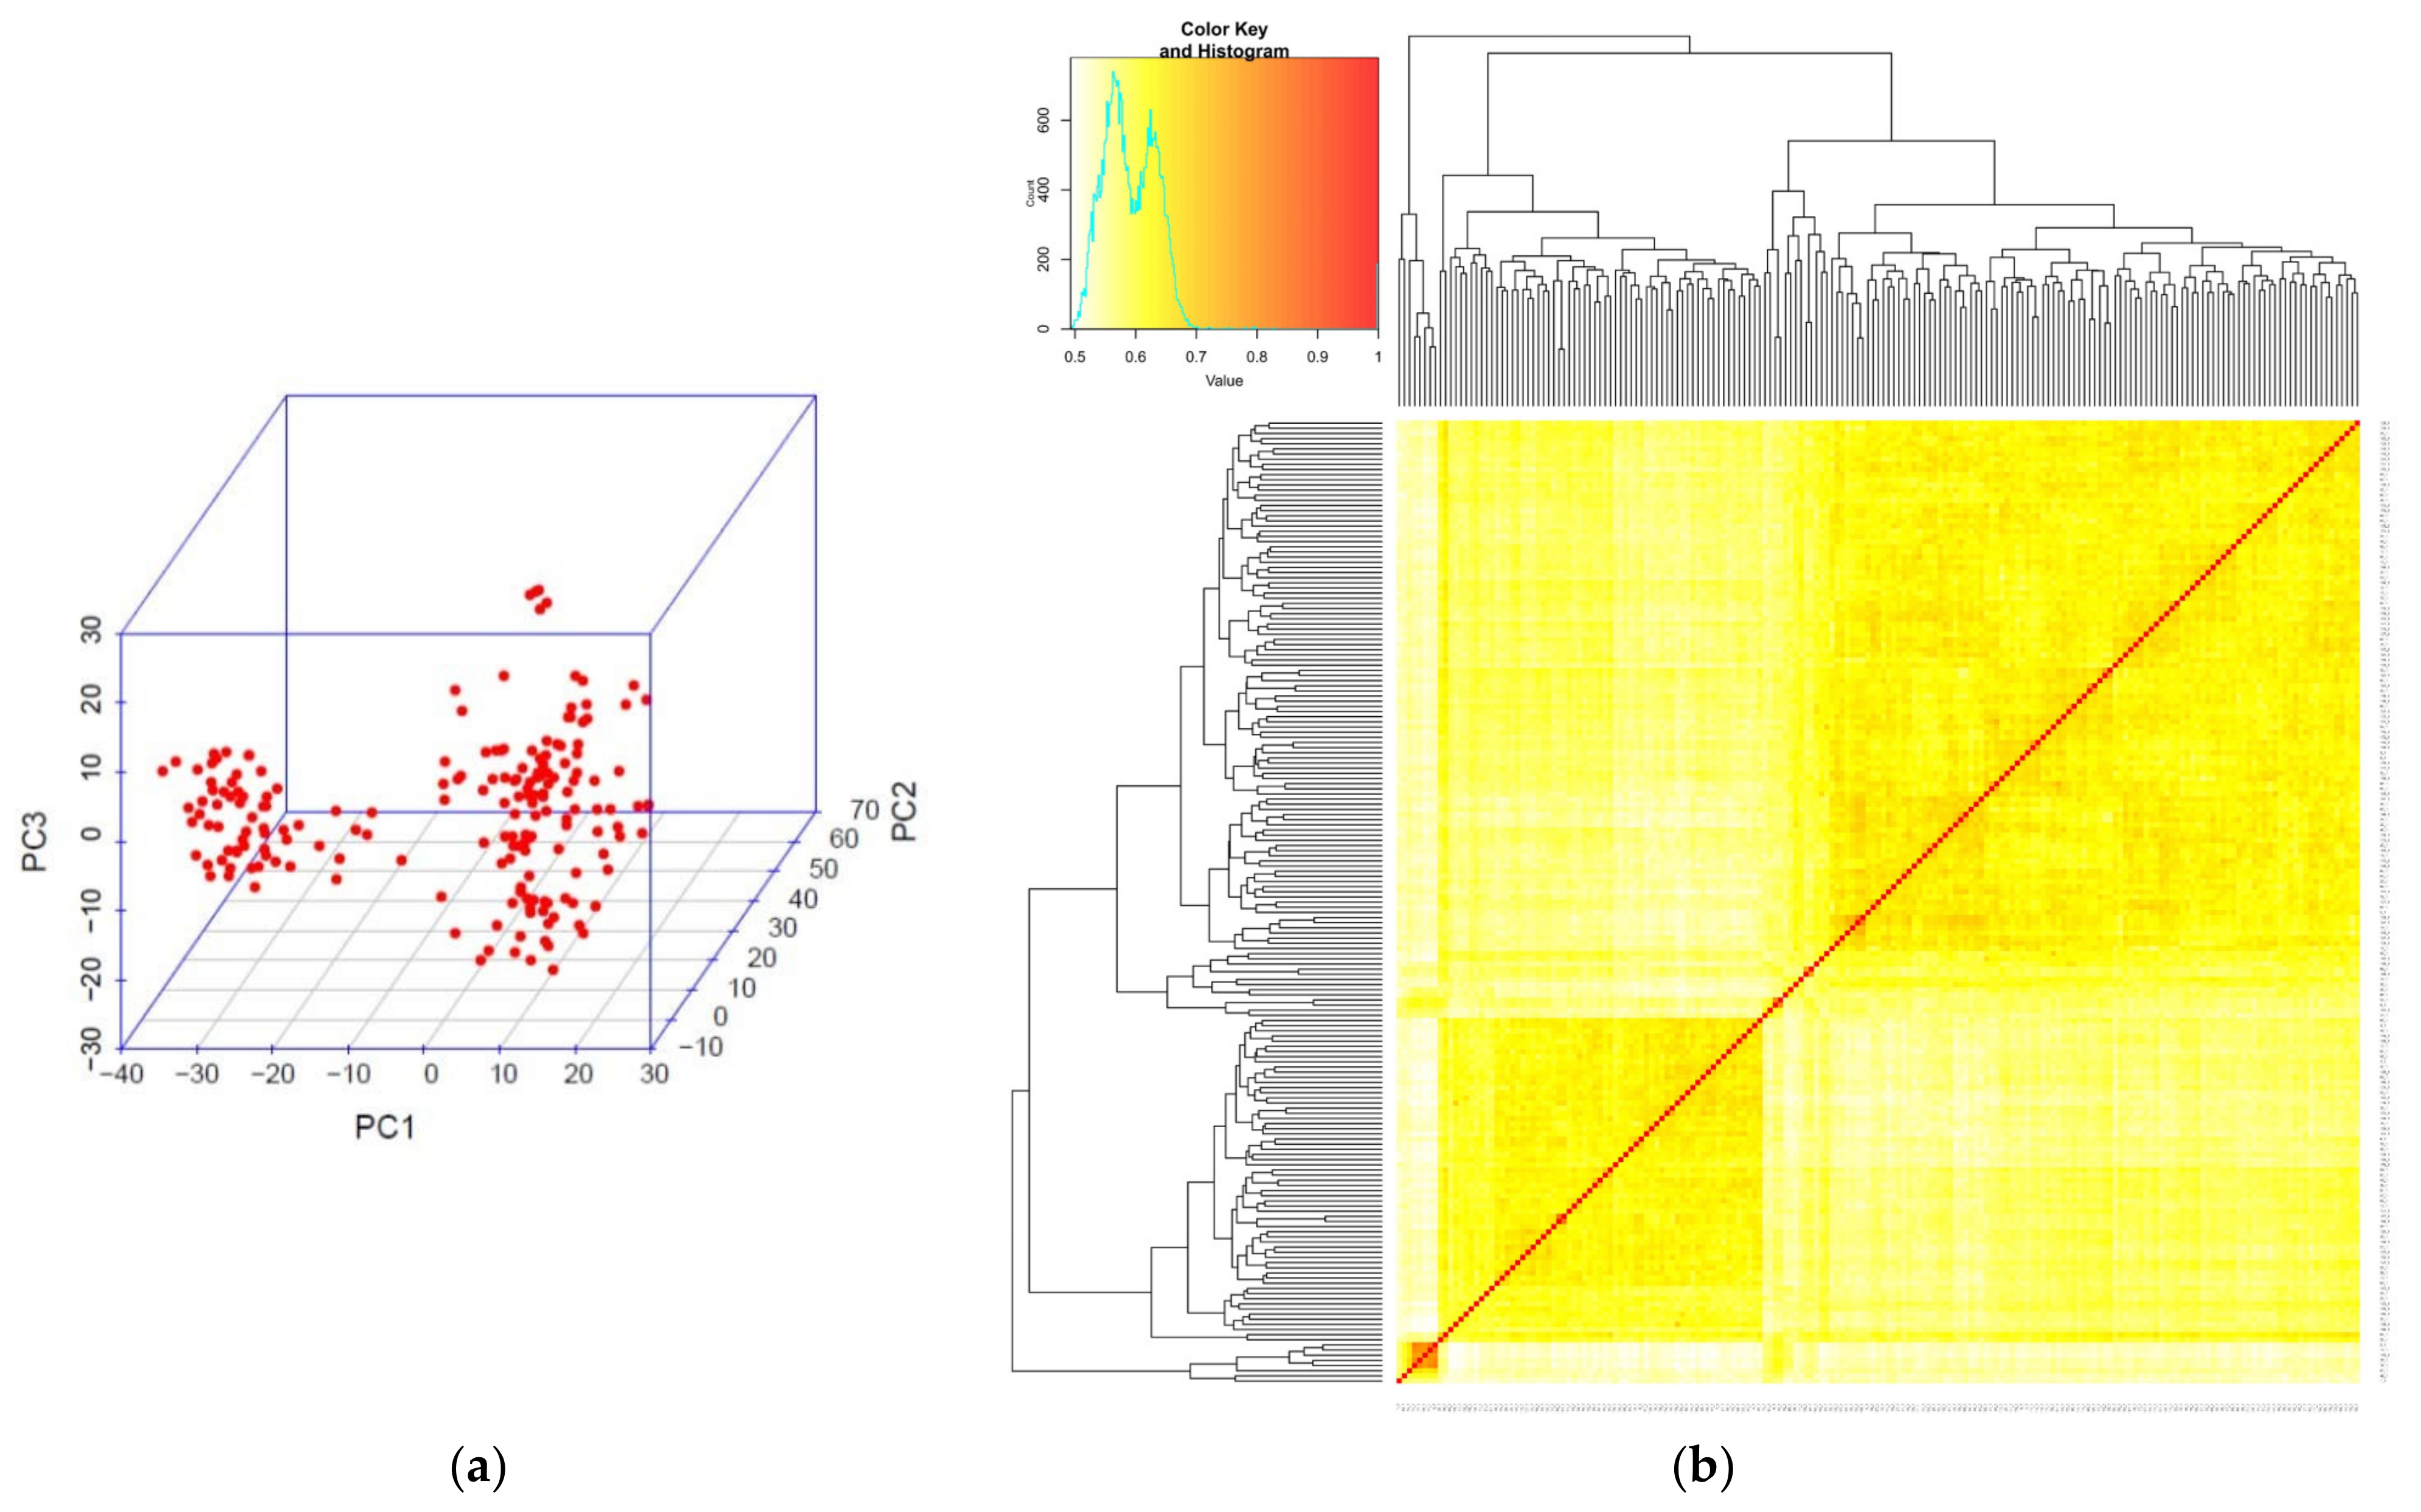
2.2. Diversity and Population Structure Analysis by SNP and DArT Markers
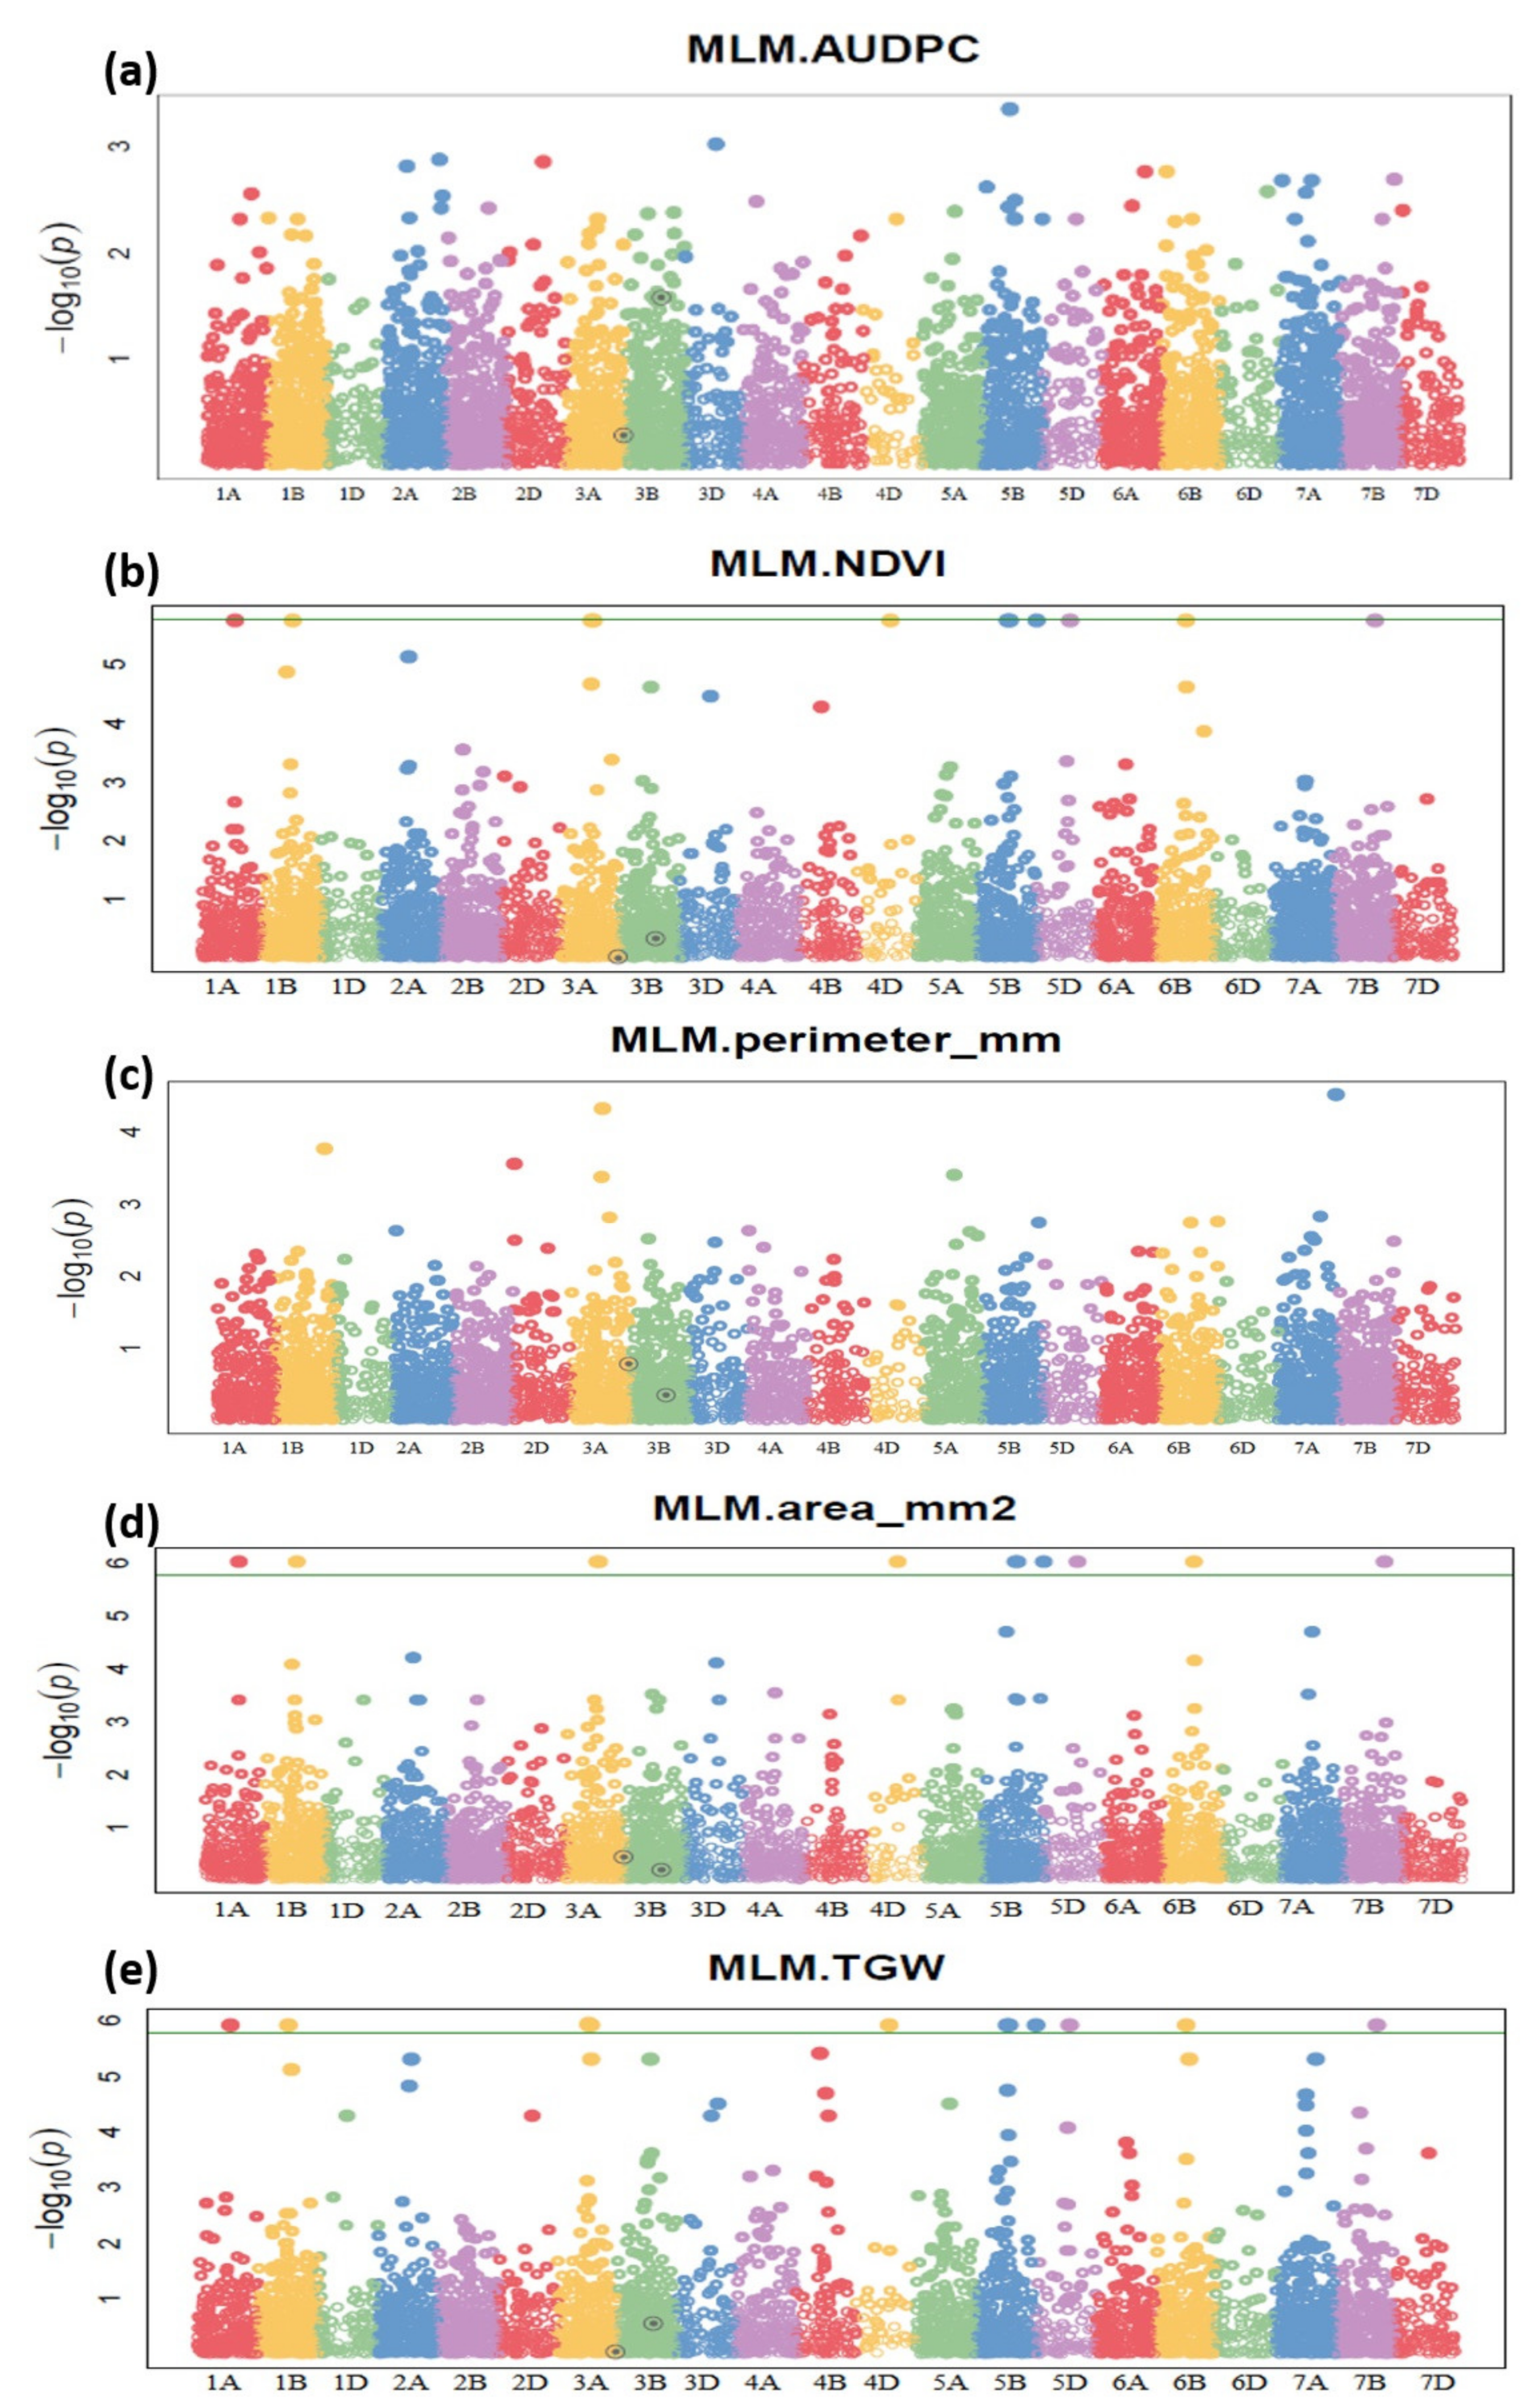
2.3. Marker Trait Analysis Identifies the Unique SNP and Candidate Genes for Terminal Heat Stress and Spot Blotch Resistance
3. Discussion
4. Materials and Methods
4.1. Plant Material, Experimental Design, and Layout of the Experiment
4.2. Pathogen Isolate and Inoculations
4.3. Phenotyping for the Assessment of Spot Blotch and Terminal Heat Stress
4.3.1. Assessment of Disease Components
4.3.2. Estimation of Chlorophyll Content by Soil Plant Analysis Development (SPAD)
4.3.3. Canopy Temperature (CT)
4.3.4. Normalized Difference Vegetative Index (NDVI)
4.3.5. Phenological Traits
4.3.6. Grain Scan for Measurement of Grain Area and Perimeter
4.4. Genetic Analysis of Spot Blotch and Heat Stress Associated with Phenotypic Traits
4.4.1. Genotyping
4.4.2. Population Structure Analysis
4.4.3. Genome-Wide Marker–Trait Association Analysis
4.4.4. In-Silico Analysis
4.5. Statistical Analysis
5. Conclusions
Supplementary Materials
Author Contributions
Funding
Data Availability Statement
Acknowledgments
Conflicts of Interest
References
- Pandey, A.K.; Mishra, V.K.; Chand, R.; Navathe, S.; Budhlakoti, N.; Srinivasa, J.; Sharma, S.; Joshi, A.K. Crosses with spelt improve tolerance of South Asian spring wheat to spot blotch, terminal heat stress, and their combination. Sci. Rep. 2021, 11, 6017. [Google Scholar] [CrossRef] [PubMed]
- Singh, P.K.; Zhang, Y.; He, X.; Singh, R.P.; Chand, R.; Mishra, V.K.; Malaker, P.K.; Mostofa, A.R.; Mokhlesur, M.A.; Rahman, M.R.R.; et al. Development and characterization of the 4th CSISA-spot blotch nursery of bread wheat. Eur. J. Plant Pathol. 2015, 143, 595–605. [Google Scholar] [CrossRef]
- Joshi, A.K.; Kumari, M.; Singh, V.P.; Reddy, C.M.; Kumar, S.; Rane, J.; Chand, R. Stay green trait: Variation, inheritance and its association with spot blotch resistance in spring wheat (Triticum aestivum L.). Euphytica 2007, 153, 59–71. [Google Scholar] [CrossRef]
- Gupta, P.K.; Chand, R.; Vasistha, N.K.; Pandey, S.P.; Kumar, U.; Mishra, V.K.; Joshi, A.K. Spot blotch disease of wheat: The current status of research on genetics and breeding. Plant Pathol. 2018, 67, 508–531. [Google Scholar] [CrossRef]
- Regmi, A.P.; Ladha, J.K.; Pasuquin, E.M.; Pathak, H.; Hobbs, P.R.; Shrestha, L.L.; Gharti, D.B.; Duveiller, E. The role of potassium in sustaining yields in a long-term rice-wheat experiment in the Indo-Gangetic plains of Nepal. Biol. Fertil. Soils 2002, 36, 240–247. [Google Scholar] [CrossRef]
- Sharma, R.C.; Duveiller, E. Spot blotch continues to cause substantial grain yield reductions under resource-limited farming conditions. J. Phytopathol. 2006, 154, 482–488. [Google Scholar] [CrossRef]
- Duveiller, E.; Kandel, Y.R.; Sharma, R.C.; Shrestha, S.M. Epidemiology of foliar blights (spot blotch and tan spot) of wheat in the plains bordering the Himalayas. Phytopathology 2005, 95, 248–256. [Google Scholar] [CrossRef]
- Joshi, A.K.; Mishra, B.; Chatrath, R.; Ortiz-Ferrara, G.; Singh, R.P. Wheat improvement in India: Present status, emerging challenges and future prospects. Euphytica 2007, 157, 431–446. [Google Scholar] [CrossRef]
- Crespo-Herrera, L.A.; Crossa, J.; Huerta-Espino, J.; Mondal, S.; Velu, G.; Juliana, P.; Vargas, M.; Pérez-Rodríguez, P.; Joshi, A.K.; Braun, H.J.; et al. Target Population of Environments for Wheat Breeding in India: Definition, Prediction and Genetic Gains. Front. Plant Sci. 2021, 12, 638520. [Google Scholar] [CrossRef]
- Kumar, S.; Röder, M.S.; Singh, R.P.; Kumar, S.; Chand, R.; Joshi, A.K.; Kumar, U. Mapping of spot blotch disease resistance using NDVI as a substitute to visual observation in wheat (Triticum aestivum L.). Mol. Breed. 2016, 36, 95. [Google Scholar] [CrossRef]
- Hazratkulova, S.; Sharma, R.C.; Alikulov, S.; Islomov, S.; Yuldashev, T.; Ziyaev, Z.; Khalikulov, Z.; Ziyadullaev, Z.; Turok, J. Analysis of genotypic variation for normalized difference vegetation index and its relationship with grain yield in winter wheat under terminal heat stress. Plant Breed. 2012, 131, 716–721. [Google Scholar] [CrossRef]
- Liu, C.; Sukumaran, S.; Claverie, E.; Sansaloni, C.; Dreisigacker, S.; Reynolds, M. Genetic dissection of heat and drought stress QTLs in phenology-controlled synthetic derived recombinant inbred lines in spring wheat. Mol. Breed. 2019, 39, 34. [Google Scholar] [CrossRef]
- Yan, L.; Liang, F.; Xu, H.; Zhang, X.; Zhai, H.; Sun, Q.; Ni, Z. Identification of QTL for Grain Size and Shape on the D Genome of Natural and Synthetic Allohexaploid Wheats with Near-Identical AABB Genomes. Front. Plant Sci. 2017, 8, 1705. [Google Scholar] [CrossRef]
- Kumari, S.; Jaiswal, V.; Mishra, V.K.; Paliwal, R.; Balyan, H.S.; Gupta, P.K. QTL mapping for some grain traits in bread wheat (Triticum aestivum L.). Physiol. Mol. Biol. Plants 2018, 24, 909–920. [Google Scholar] [CrossRef]
- Joshi, A.K.; Ortiz-Ferrara, G.; Crossa, J. Associations of environments in South Asia based on spot blotch disease of wheat caused by Bipolaris sorokiniana. Crop Sci. 2007, 47, 1071–1081. [Google Scholar] [CrossRef]
- Rosyara, U.R.; Subedi, S.; Sharma, R.C.; Duveiller, E. Spot blotch and terminal heat stress tolerance in south Asian spring wheat genotypes. Acta Agron. Hung. 2009, 57, 425–435. [Google Scholar] [CrossRef]
- Rosyara, U.R.; Vromman, D.; Duveiller, E. Canopy temperature depression as an indication of correlative measure of spot blotch resistance and heat stress tolerance in spring wheat. J. Plant Pathol. 2008, 90, 103–107. [Google Scholar]
- Sukumaran, S.; Reynolds, M.P.; Sansaloni, C. Genome-wide association analyses identify QTL hotspots for yield and component traits in durum wheat grown under yield potential, drought, and heat stress environments. Front. Plant Sci. 2018, 9, 81. [Google Scholar] [CrossRef]
- Chaurasia, S.; Joshi, A.K.; Dhari, R.; Chand, R. Resistance to foliar blight of wheat: A search. Genet. Resour. Crop Evol. 1999, 46, 469–475. [Google Scholar] [CrossRef]
- Feng, B.; Liu, P.; Li, G.; Dong, S.T.; Wang, F.H.; Kong, L.A.; Zhang, J.W. Effect of heat stress on the photosynthetic characteristics in flag leaves at the grain-filling stage of different heat-resistant winter wheat varieties. J. Agron. Crop Sci. 2014, 200, 143–155. [Google Scholar] [CrossRef]
- Paliwal, R.; Röder, M.S.; Kumar, U.; Srivastava, J.P.; Joshi, A.K. QTL mapping of terminal heat tolerance in hexaploid wheat (T. aestivum L.). Theor. Appl. Genet. 2012, 125, 561–575. [Google Scholar] [CrossRef] [PubMed]
- Pask, A.; Reynolds, M.; Sharma, I.; Chatrath, R.; Singh, G.P.; Sohu, V.S.; Balasubramaniam, A. The CSISA wheat phenotyping network. In Proceedings of the International Workshop of the Wheat Yield Consortium, Cd. Obregon, Mexico, 5–7 March 2013; CIMMYT: Texcoco, Mexico, 2013; pp. 70–72. [Google Scholar]
- Pask, A.; Joshi, A.K.; Manès, Y.; Sharma, I.; Chatrath, R.; Singh, G.P.; Mishra, V.K. A wheat phenotyping network to incorporate physiological traits for climate change in South Asia. Field Crops Res. 2014, 168, 156–167. [Google Scholar] [CrossRef]
- Asseng, S.; Foster, I.A.N.; Turner, N.C. The impact of temperature variability on wheat yields. Glob. Chang. Biol. 2011, 17, 997–1012. [Google Scholar] [CrossRef]
- Rehman, H.U.; Tariq, A.; Ashraf, I.; Ahmed, M.; Muscolo, A.; Basra, S.M.A.; Reynolds, M. Evaluation of physiological and morphological traits for improving spring wheat adaptation to terminal heat stress. Plants 2021, 10, 455. [Google Scholar] [CrossRef] [PubMed]
- Okamoto, Y.; Nguyen, A.T.; Yoshioka, M. Identification of quantitative trait loci controlling grain size and shape in the D genome of synthetic hexaploid wheat lines. Breed. Sci. 2013, 63, 423–429. [Google Scholar] [CrossRef] [PubMed]
- Williams, K.; Sorrells, M.E. Three-dimensional seed size and shape QTL in hexaploid wheat (Triticum aestivum L.) populations. Crop Sci. 2014, 54, 98–110. [Google Scholar] [CrossRef]
- Martin, G.B.; Bogdanove, A.J.; Sessa, G. Understanding the functions of plant disease resistance proteins. Annu. Rev. Plant Biol. 2003, 54, 23–61. [Google Scholar] [CrossRef]
- Rairdan, G.J.; Collier, S.M.; Sacco, M.A.; Baldwin, T.T.; Boettrich, T.; Moffett, P. The coiled-coil and nucleotide-binding domains of the potato Rx disease resistance protein function in pathogen recognition and signalling. Plant Cell 2008, 20, 739–751. [Google Scholar] [CrossRef]
- Hiraga, S.; Sasaki, K.; Ito, H.; Ohashi, Y.; Matsui, H. A large family of class III plant peroxidases. Plant Cell Physiol. 2001, 42, 462–468. [Google Scholar] [CrossRef]
- Peng, Y.; Zhang, J.; Cao, G.; Xie, Y.; Liu, X.; Lu, M.; Wang, G. Overexpression of a PLDα1 gene from Setaria italica enhances the sensitivity of Arabidopsis to abscisic acid and improves its drought tolerance. Plant Cell Rep. 2010, 29, 793–802. [Google Scholar] [CrossRef]
- Niño, M.; Kim, J.; Lee, H.J.; Abdula, S.E.; Nou, I.S.; Cho, Y.G. Key roles of cysteine protease in different plant pathosystem. Plant Breed. Biotech. 2014, 2, 97–109. [Google Scholar] [CrossRef]
- Ayana, G.T.; Ali, S.; Sidhu, J.S.; Gonzalez-Hernandez, J.L.; Turnipseed, B.; Sehgal, S.K. Genome-wide association study for spot blotch resistance in hard winter wheat. Front. Plant Sci. 2018, 9, 926. [Google Scholar] [CrossRef]
- Maldonado-Bonilla, L.D.; Eschen-Lippold, L.; Gago-Zachert, S.; Tabassum, N.; Bauer, N.; Scheel, D.; Lee, J. The arabidopsis tandem zinc finger 9 protein binds RNA and mediates pathogen-associated molecular pattern triggered immune responses. Plant Cell Physiol. 2013, 55, 412–425. [Google Scholar] [CrossRef]
- Thomas, E.L.; Van der Hoorn, R.A.L. Ten prominent host proteases in plant-pathogen interactions. Int. J. Mol. Sci. 2018, 19, 639–653. [Google Scholar] [CrossRef]
- Kim, H.S.; Delaney, T.P. Arabidopsis SON1 is an F-box protein that regulates a novel induced defense response independent of both salicylic acid and systemic acquired resistance. Plant Cell 2002, 14, 1469–1482. [Google Scholar] [CrossRef]
- Calderón-Villalobos, L.I.A.; Nill, C.; Marrocco, K.; Kretsch, T.; Schwechheimer, C. The evolutionarily conserved Arabidopsis thaliana F-box protein AtFBP7 is required for efficient translation during temperature stress. Gene 2007, 392, 106–116. [Google Scholar] [CrossRef]
- Sadanandom, A.; Bailey, M.; Ewan, R.; Lee, J.; Nelis, S. The ubiquitin-proteasome system: Central modifier of plant signalling. New Phytol. 2012, 196, 13–28. [Google Scholar] [CrossRef]
- Üstün, S.; Sheikh, A.; Gimenez-Ibanez, S.; Jones, A.; Ntoukakis, V.; Börnke, F. The proteasome acts as a hub for plant immunity and is targeted by Pseudomonas type III effectors. Plant Physiol. 2016, 172, 1941–1958. [Google Scholar] [CrossRef]
- Kaur, J.; Kaur, J.; Dhillon, G.S.; Kaur, H.; Singh, J.; Bala, R.; Srivastava, P.; Kaur, S.; Sharma, A.; Chhuneja, P. Characterization and mapping of spot blotch in Triticum durum-Aegilops speltoides Introgression Lines Using SNP Markers. Front. Plant Sci. 2021, 12, 650400. [Google Scholar] [CrossRef]
- Tomar, V.; Singh, D.; Singh, R.P.; Poland, J.; Joshi, A.K.; Dhillon, G.S.; Singh, P.K.; Kumar, S.; Rahman, M.M.; Tiwari, B.S.; et al. New QTLs for spot blotch disease resistance in wheat (Triticum aestivum L.) using genome-wide association mapping. Front. Genet. 2020, 11, 1740. [Google Scholar] [CrossRef]
- Roy, C.; Gahtyari, N.C.; He, X.; Mishra, V.K.; Chand, R.; Joshi, A.K.; Singh, P.K. Dissecting quantitative trait loci for spot blotch resistance in South Asia using two wheat recombinant inbred line populations. Front. Plant Sci. 2021, 12, 641324. [Google Scholar] [CrossRef] [PubMed]
- Gahtyari, N.C.; Roy, C.; He, X.; Roy, K.K.; Reza, M.M.A.; Hakim, M.A.; Malaker, P.K.; Joshi, A.K.; Singh, P.K. Identification of QTLs for spot blotch resistance in two bi-parental mapping populations of wheat. Plants 2021, 10, 973. [Google Scholar] [CrossRef] [PubMed]
- Juliana, P.; He, X.; Poland, J.; Shrestha, S.; Joshi, A.K.; Huerta-Espino, J.; Govindan, V.; Crespo-Herrera, L.A.; Mondal, S.; Kumar, U.; et al. Genome-wide association mapping indicates quantitative genetic control of spot blotch resistance in bread wheat and the favorable effects of some spot blotch loci on grain yield. Front. Plant Sci. 2022, 13, 835095. [Google Scholar] [CrossRef] [PubMed]
- Tiwari, C.; Wallwork, H.; Kumar, U.; Dhari, R.; Arun, B.; Mishra, V.K.; Joshi, A.K. Molecular mapping of high-temperature tolerance in bread wheat adapted to the Eastern Gangetic Plain region of India. Field Crops Res. 2013, 154, 201–210. [Google Scholar] [CrossRef]
- Zadoks, J.C.; Chang, T.T.; Konzak, C.F. A Decimal Code for the Growth Stages of Cereals. Weed Res. 1974, 14, 415–421. [Google Scholar] [CrossRef]
- Chand, R.; Yadav, O.P.; Bashyal, B.M.; Prasad, L.C.; Joshi, A.K. Technique for the maintenance of heterokaryotic isolates of Bipolaris sorokiniana. Indian Phytopathol. 2013, 66, 61–65. [Google Scholar]
- Saari, E.E.; Prescott, J.M. A scale for appraising the foliar intensity of wheat diseases. Plant Dis. Rep. 1975, 59, 377–380. [Google Scholar]
- Eyal, Z.; Scharen, A.L.; Prescott, J.M.; Van Ginkel, M. The Septoria Disease of Wheat: Concepts and Methods of Disease Management; CIMMYT: Texcoco, Mexico, 1987. [Google Scholar]
- Shaner, G.; Finney, R.E. The effect of nitrogen fertilization on the expression of slow-mildewing resistance in Knox wheat. Phytopathology 1977, 67, 1051–1056. [Google Scholar] [CrossRef]
- Madden, L.V.; Hughes, G.; Bosch, F. The Study of Plant Disease Epidemics; American Phytopathological Society (APS Press): St. Paul, MN, USA, 2007. [Google Scholar]
- Schlemmer, M.R.; Francis, D.D.; Shanahan, J.F.; Schepers, J.S. Remotely measuring chlorophyll content in corn leaves with different nitrogen levels and relative water content. Agron. J. 2005, 97, 106–112. [Google Scholar] [CrossRef]
- Reynolds, M.; Manes, Y.; Rebetzke, G. Application of physiology in breeding for heat and drought stress. In Physiological Breeding I: Interdisciplinary Approaches to Improve Crop Adaptation; Reynolds, M.P., Pask, A.J.D., Mullan, D.M., Eds.; CIMMYT: Texcoco, Mexico, 2012; pp. 18–32. [Google Scholar]
- Whan, A.P.; Smith, A.B.; Cavanagh, C.R.; Ral, J.P.F.; Shaw, L.M.; Howitt, C.A.; Bischof, L. GrainScan: A low cost, fast method for grain size and colour measurements. Plant Methods 2014, 10, 23. [Google Scholar] [CrossRef]
- Srinivasan, J. Molecular Mapping and Development of Zinc and Iron Rich Wheat Lines Using Triticum aestivum and T. spelta Crosses. Ph.D. Thesis, Banaras Hindu University, Varanasi, India, 2013. [Google Scholar]
- Pritchard, J.K.; Stephens, M.; Rosenberg, N.A.; Donnelly, P. Association mapping in structured populations. Am. J. Hum. Genet. 2000, 67, 170181. [Google Scholar] [CrossRef]
- Evanno, G.; Regnaut, S.; Goudet, J. Detecting the number of clusters of individuals using the software STRUCTURE: A simulation study. Mol. Ecol. 2005, 14, 26112620. [Google Scholar] [CrossRef]
- Earl, D.A.; VonHoldt, B.M. STRUCTURE HARVESTER: A website and program for visualizing STRUCTURE output and implementing the Evanno method. Conserv. Genet. Resour. 2012, 4, 359–361. [Google Scholar] [CrossRef]
- Bradbury, P.J.; Zhang, Z.; Kroon, D.E.; Casstevens, T.M.; Ramdoss, Y.; Buckler, E.S. TASSEL: Software for association mapping of complex traits in diverse samples. Bioinformatics 2007, 23, 2633–2635. [Google Scholar] [CrossRef]
- Purcell, S.; Neale, B.; Todd-Brown, K.; Thomas, L.; Ferreira, M.A.; Bender, D.; Maller, J.; Sklar, P.; De Bakker, P.I.; Daly, M.J.; et al. PLINK: A tool set for whole-genome association and population-based linkage analyses. Am. J. Hum. Genet. 2007, 81, 559–575. [Google Scholar] [CrossRef]
- Perrier, X.; Flori, A.; Bonnot, F. Data analysis methods. In Genetic Diversity of Cultivated Tropical Plants; Hamon, P., Seguin, M., Perrier, X., Glaszmann, J.C., Eds.; Enfield, Science Publishers: Montpellier, France, 2003; pp. 43–76. [Google Scholar]
- Perrier, X.; Jacquemoud-Collet, J.P. DARwin Software. 2006. Available online: http://darwin.cirad.fr/ (accessed on 25 May 2022).
- Zhang, Z.; Ersoz, E.; Lai, C.; Todhunter, R.J.; Tiwari, H.K.; Gore, M.A. Mixed linear model approach adapted for genome-wide association studies. Nat. Genet. 2010, 42, 355–360. [Google Scholar] [CrossRef]
- Lipka, A.E.; Tian, F.; Wang, Q.; Peiffer, J.; Li, M.; Bradbury, P.J.; Gore, M.A.; Buckler, E.S.; Zhang, Z. GAPIT: Genome association and prediction integrated tool. Bioinformatics 2012, 28, 2397–2399. [Google Scholar] [CrossRef]
- SAS Institute Inc. SAS 9.1.3 Help and Documentation; SAS Institute Inc.: Cary, NC, USA, 2002–2004.


| Sr. No. | Phenotypic Trait | Control | Spot Blotch | Terminal Heat Stress | Spot Blotch + Terminal Heat Stress |
|---|---|---|---|---|---|
| 1 | Days to heading (days) | 90.23 ± 1.79 | 89.71 ± 1.92 | 76.2 ± 2.46 | 76.57 ± 2.01 |
| 2 | Thousand-grain weight (g) | 30.15 ± 2.32 | 24.06 ± 2.71 | 26.68 ± 2.6 | 21.07 ± 2.65 |
| 3 | Days to Maturity (days) | 119.95 ± 1.66 | 112.49 ± 3.65 | 111.26 ± 2.06 | 107.75 ± 3.82 |
| 4 | Canopy Temperature (°C) | 21.88 ± 0.9 | 25.24 ± 1.01 | 28.36 ± 0.91 | 29.84 ± 0.94 |
| 5 | NDVI | 0.63 ± 0.05 | 0.52 ± 0.08 | 0.48 ± 0.09 | 0.4 ± 0.06 |
| 6 | SPAD | 54.5 ± 3.24 | 47.7 ± 3.82 | 52.14 ± 4.11 | 41.37 ± 2.91 |
| 7 | AUDPC | 244.69 ± 48.09 | 500.28 ± 56.39 | 306.91 ± 91.36 | 630.62 ± 116.58 |
| 8 | Grain Area (mm2) | 12.87 ± 0.28 | 12.45 ± 0.42 | 12.05 ± 0.6 | 9.21 ± 0.41 |
| 9 | Grain Perimeter (mm) | 17.24 ± 0.57 | 16.37 ± 0.26 | 17.03 ± 0.89 | 13.8 ± 0.5 |
| Source | DF | Mean Sum of Squares | ||||||||
|---|---|---|---|---|---|---|---|---|---|---|
| DH | TKW | DM | CT | NDVI | SPAD | AUDPC | Grain Area | Grain Perimeter | ||
| Year | 2 | 36.71 * | 9301.43 * | 1515.34 * | 5085.82 * | 2.93 * | 1275.91 * | 19,890,523.95 * | 38,070.98 * | 32,605.08 * |
| Condition | 1 | 266,584.51 * | 23,293.19 * | 44,301.94 * | 47,917.63 * | 47.16 * | 15,318.28 * | 35,978,424.99 * | 6833.56 * | 1701.23 * |
| Treatment | 1 | 242.67 * | 25,999.75 * | 29,070.34 * | 4757.77 * | 15.16 * | 88,172.20 * | 67,495,554.29 * | 1716.54 * | 1928.05 * |
| RILs | 184 | 81.23 * | 116.31 * | 52.74 * | 6.082 * | 0.0094 * | 67.52 * | 80,137.94 * | 3.33 * | 5.78 * |
| Rep | 1 | 26.34 | 802.07 * | 19.6 | 118.02 * | 0.00011 | 962.57 * | 1,885,835.47 * | 1.29 | 40.88 * |
| Year × RILs | 368 | 1.55 | 21.63 * | 8.31 * | 2.13 * | 0.00345 * | 8.86 | 44,840.46 * | 0.632 * | 0.52 |
| Condition × RILs | 184 | 8.58 * | 18.05 * | 44.91 * | 4.26 * | 0.0051 * | 49.02 * | 24,927.34 * | 1.01 * | 3.12 * |
| Treatment × RILs | 184 | 36.72 * | 56.38 * | 48.92 * | 4.92 * | 0.00706 * | 56.99 * | 57,215.63 * | 2.08 * | 4.10 * |
| Year × Condition × Treatment × RILs | 1295 | 2.04 | 19.51 * | 21.52 * | 6.50 * | 0.0111 * | 80.076 * | 48,598.18 * | 5.20 * | 8.93 * |
| Sr | Markers | Genomic Location | Trait | Transcript ID | Description |
|---|---|---|---|---|---|
| 1 | 1058939|F|0 | 1A:530168043–530267926 | NDVI | TraesCS1A02G340000 | IPR027145: Periodic tryptophan protein 2, IPR020472: G-protein beta WD-40 repeat |
| TraesCS1A02G339900 | IPR003960: ATPase, AAA-type, conserved site, CDC48, IPR003338: N-terminal subdomain | ||||
| TraesCS1A02G339800 | IPR006852: Glycosyltransferases, MUCI70 | ||||
| TraesCS1A02G340100 | IPR027417: P-loop containing nucleoside triphosphate hydrolase, IPR018368: ClpA/B, conserved site 1 | ||||
| 2 | 1102573|F|0 | 1A:403359429–403388874 | NDVI | TraesCS1A02G230600 | Kinesin-like protein KIN-7N, IPR027417: P-loop containing nucleoside triphosphate hydrolase |
| 3 | 1125940|F|0 | 1A: 499801953–499801988 | Grain area, Days to heading, days to maturity, SPAD, Test weight (TGW), Canopy temperature | TraesCS1A02G309000 | A0A1D5RW30 IPR001611: Leucine-rich repeat IPR013210: Leucine-rich repeat-containing N-terminal, plant-type IPR032675: Leucine-rich repeat domain superfamily |
| TraesCS1A02G308800 | A0A341NPS0 IPR002048: EF-hand domain IPR011992: EF-hand domain pair IPR018247: EF-Hand 1, calcium-binding site IPR039030: Calmodulin | ||||
| TraesCS1A02G308900 | IPR032640: AMP-activated protein kinase, glycogen-binding domain | ||||
| 4 | 1241625|F|0 | 1B:687710001–687804688 | Grain perimeter | TraesCS1B02G480300 | IPR013210: Leucine-rich repeat-containing N-terminal, plant-type, IPR017441: Protein kinase, ATP binding site |
| TraesCS1B02G480100 | IPR012337: Ribonuclease H-like superfamily, IPR014811: Argonaute, linker 1 domain | ||||
| TraesCS1B02G480400 | IPR045877: RNA-binding protein ZFP36-like, IPR000571: Zinc finger, CCCH-type | ||||
| TraesCS1B02G480200 | IPR003388: Reticulon-like protein B12 | ||||
| 5 | 1395486|F|0 | 1B:315459354–315462324 | Grain Area, Days to heading, days to maturity, SPAD, Test weight (TGW), Canopy temperature | TraesCS1B02G174800 | A0A341PBP3 IPR001210: Ribosomal protein S17e IPR036401: Ribosomal protein S17e-like superfamily |
| TraesCS1B02G174900 | A0A1D5SGD8 IPR001107: Band 7 domain IPR027705: Flotillin family IPR036013: Band 7/SPFH domain superfamily | ||||
| 6 | 3064765|F|0 | 1B:683455649–683585555 | NDVI | TraesCS1B02G474800 | IPR044798, Chromatin modification-related protein EAF1A/B |
| TraesCS1B02G475200 | IPR032675: Leucine-rich repeat domain | ||||
| TraesCS1B02G475400 | IPR004907, ATPase, V1 complex, subunit C | ||||
| 7 | 1077356|F|0 | 2A:617631545–617741244 | Days to heading, Days to maturity | TraesCS2A02G375100 | IPR004182: GRAM domain, GEM-like protein |
| TraesCS2A02G374800 | IPR030847: Mitochondrial glycine transporter Hem25/SLC25A38 | ||||
| 8 | 2281188|F|0 | 2A:42147190–42231485 | AUDPC | TraesCS2A02G088800 | IPR000719: Protein kinase domain IPR001245: Serine-threonine/tyrosine-protein kinase, catalytic domain |
| TraesCS2A02G088900 | IPR042449: Ubiquitin-activating enzyme E1, inactive adenylation domain, subdomain 1 THIF-type NAD/FAD-binding (IPR000594) | ||||
| 9 | 1039495|F|0 | 2A:703378875–703411784 | AUDPC | TraesCS2A02G454500 | IPR013088, Zinc finger, NHR/GATA-type |
| TraesCS2A02G454600 | IPR044533, FCS-Like Zinc finger 1/2/3 | ||||
| 10 | 2253029|F|0 | 2A:718816359–718988414 | NDVI | TraesCS2A02G482000 | CASP-like protein, IPR006702: Casparian strip membrane protein |
| TraesCS2A02G482100 | IPR001509, NAD-dependent epimerase/dehydratase | ||||
| TraesCS2A02G482400 | IPR044661, Mediator of RNA polymerase II transcription subunit 15a/b/c-like | ||||
| TraesCS2A02G482700 | IPR029063: S-adenosyl-L-methionine-dependent methyltransferase | ||||
| 11 | 3028841|F|0 | 2D:648337989–648380136 | AUDPC | TraesCS2D02G594900 | F-box domain-containing protein-related |
| TraesCS2D02G594800 | IPR000504: RNA recognition motif, IPR012677: Nucleotide-binding alpha-beta plait domain | ||||
| TraesCS2D02G594700 | RING-type E3 ubiquitin transferase, IPR013083: Zinc finger | ||||
| 12 | 1019339|F|0 | 2D:625109256–625163527 | Grain perimeter | TraesCS2D02G549600 | IPR027417: P-loop containing nucleoside triphosphate hydrolase, IPR042197: Apoptotic protease-activating factors, helical domain |
| TraesCS2D02G549700 | IPR032675: Leucine-rich repeat domain superfamily, IPR044974: Disease resistance protein, plants | ||||
| 13 | 983670|F|0 | 3A:640746667–640773225 | Days to heading, Days to maturity | TraesCS3A02G392900 | IPR000109: Proton-dependent oligopeptide transporter, IPR018456: PTR2 family proton/oligopeptide symporter, conserved site |
| TraesCS3A02G393000 | IPR029058: Alpha/Beta hydrolase fold, IPR002168: Lipase, GDXG, putative histidine active site | ||||
| 14 | 3064641|F|0 | 3A:13351697–13418670 | Grain perimeter | TraesCS3A02G025000 | IPR023213: Chloramphenicol acetyltransferase-like domain |
| TraesCS3A02G025300 | Zinc finger FYVE domain-containing protein, IPR035669: GDSL lipase/esterase-like, plant | ||||
| TraesCS3A02G025200 | E3 ubiquitin-protein ligase, IPR013083: Zinc finger, RING/FYVE/PHD-type | ||||
| 15 | 2256281|F|0 | 3A: 512307520–512555787 | Grain area, Days to heading, days to maturity, SPAD, Test weight (TGW), Canopy temperature | TraesCS3A02G284100 | Hexosyltransferase |
| TraesCS3A02G283600 | Peptidase S8 propeptide/proteinase inhibitor | ||||
| TraesCS3A02G283700 | IPR007608: Senescence regulator S40 | ||||
| TraesCS3A02G283900 | IPR013857: NADH: ubiquinone oxidoreductase intermediate-associated protein 30 | ||||
| TraesCS3A02G284100 | Hexosyltransferase IPR002495: Glycosyl transferase, family 8 IPR029044: Nucleotide-diphospho-sugar transferases IPR029993: Plant galacturonosyltransferase GAUT | ||||
| TraesCS3A02G284200 | Protodermal factor 1 | ||||
| 16 | 980238|F|0 | 3A:638969536–639257641 | Grain Area, Days to heading, days to maturity, SPAD, Test weight (TGW), Canopy temperature | TraesCS3A02G390800 | tetratrico peptide repeat region (TPR) |
| TraesCS3A02G390900 | IPR007234:Vps53-like, N-terminal IPR039766: Vacuolar protein sorting-associated protein 53 | ||||
| TraesCS3A02G391000 | IPR025993: Ceramide glucosyltransferase IPR029044: Nucleotide-diphospho-sugar transferases | ||||
| TraesCS3A02G391100 | IPR029768: Fructose-bisphosphate aldolase class-I active site | ||||
| TraesCS3A02G391400 | IPR017907: Zinc finger, RING-type, conserved site | ||||
| 17 | 2275693|F|0 | 3A:647604415–647821505 | Days to heading, Days to maturity, Test weight | TraesCS3A02G402100 | IPR011009: Protein kinase-like domain, IPR036426: Bulb-type lectin domain |
| TraesCS3A02G402200 | IPR001763: Rhodanese-like domain | ||||
| TraesCS3A02G402300 | AS2, IPR004883: Lateral organ boundaries, LOB | ||||
| 18 | 976829|F|0 | 3B:672380580–672583235 | Days to heading, Days to maturity | TraesCS3B02G433400 | A0A077S6B7: BTB/POZ and TAZ domain-containing protein 3 |
| TraesCS3B02G433500 | IPR018247: EF-Hand 1, calcium-binding site | ||||
| TraesCS3B02G433600 | IPR001245: Serine-threonine/tyrosine-protein kinase, catalytic domain, IPR000719: Protein kinase domain, IPR008271: Serine/threonine-protein kinase, active site | ||||
| TraesCS3B02G433900 | IPR013210: Leucine-rich repeat-containing N-terminal, plant-type | ||||
| 19 | 1088945|F|0 | 3D:436639761–436684217 | AUDPC | TraesCS3D02G323600 | IPR032675: Leucine-rich repeat domain, IPR044997 F-box protein, plant |
| TraesCS3D02G323700 | DNA-(apurinic or apyrimidinic site) lyase, IPR005135: Endonuclease/exonuclease/phosphatase | ||||
| TraesCS3D02G323800 | FK506-binding-like protein (PTHR34567) | ||||
| 20 | 1034888|F|0 | 4A:597665575–598072618 | Canopy temperature | TraesCS4A02G298500 | IPR036410: Heat shock protein DnaJ, cysteine-rich domain |
| TraesCS4A02G298600 | IPR002068: Alpha crystallin/Hsp20 domain IPR008978:HSP20-like chaperone | ||||
| TraesCS4A02G299400 | IPR002347: Short-chain dehydrogenase/reductase, IPR036291: NAD(P)-binding domain | ||||
| TraesCS4A02G298700 | IPR013215: Cobalamin-independent methionine synthase MetE, | ||||
| 21 | 1050819|F|0 | 4D:46589710–46738670 | Grain area, Days to heading, days to maturity, SPAD, Test weight | TraesCS4D02G071900 | IPR044837 B3 domain-containing protein REM16-like, IPR015300 DNA-binding pseudo barrel domain superfamily |
| TraesCS4D02G072000 | IPR001461: Aspartic peptidase A1, IPR034161: Pepsin-like domain, plant | ||||
| 22 | 1088359|F|0 | 5A:503866360–503955851 | Grain perimeter | TraesCS5A02G295400 | IPR017736: Glycoside hydrolase, family 1, beta-glucosidase |
| TraesCS5A02G295800 | IPR003527: Mitogen-activated protein (MAP) kinase, conserved site IPR008271: Serine/threonine-protein kinase, active site | ||||
| 23 | 1029767|F|0 | 5A:615146872–615353569 | NDVI | TraesCS5A02G431100 | IPR007275: YTH domain |
| TraesCS5A02G431600 | Casein kinase I, photoperiodic control of flowering time, long-day repression, IPR008271: Serine/threonine-protein kinase, active site | ||||
| TraesCS5A02G431500 | IPR032675: Leucine-rich repeat domain superfamily | ||||
| TraesCS5A02G431300 | IPR001810: F-box domain IPR032675: Leucine-rich repeat domain | ||||
| 24 | 1045022|F|0 | 5A:691658614–691905149 | NDVI | TraesCS5A02G534500 | Flavin-containing monooxygenase, IPR036188: FAD/NAD(P)-binding domain superfamily |
| TraesCS5A02G534800 | IPR001810: F-box domain | ||||
| TraesCS5A02G534900 | IPR042101: Signal recognition particle SRP54, IPR027417:P-loop containing nucleoside triphosphate hydrolase | ||||
| TraesCS5A02G534200 | IPR039605: AT-hook motif nuclear-localized protein | ||||
| 25 | 3064380|F|0 | 5A:27509863–27509903 | NDVI | TraesCS5A02G042600LC | NA |
| TraesCS5A02G042700LC | NA | ||||
| 26 | 1126383|F|0 | 5B:568398994–568517930 | Days to heading, Days to maturity, SPAD, Test weight, Grain area | TraesCS5B02G389200 | IPR002885: Pentatricopeptide repeat IPR011990: Tetratricopeptide-like helical domain |
| TraesCS5B02G389300 | EDA15, R022192: Mitochondrial degradosome RNA helicase subunit, C-terminal domain | ||||
| TraesCS5B02G389400 | IPR044593, FCS-Like Zinc finger 8/MARD1 | ||||
| 27 | 3064429|F|0 | 5B:596900954–596988713 | AUDPC | TraesCS5B02G421900 | IPR044991, Tetraspani, plant, auxin-activated signalling pathway |
| TraesCS5B02G421100 | IPR044659, Protein PELPK-like, Proline-rich protein 10, At5g09530 | ||||
| 28 | 1029559|F|0 | 5B:281567207–281859354 | Grain area, Days to heading, days to maturity, SPAD, Test weight (TGW) | TraesCS5B02G152400 | IPR018247: EF-Hand 1, calcium-binding site IPR039647: EF-hand domain pair protein CML-like |
| TraesCS5B02G152100 | IPR029962 Trichome birefringence-like family | ||||
| TraesCS5B02G152300 | IPR000547: Clathrin, heavy chain/VPS, 7-fold repeat IPR011990: Tetratricopeptide-like helical domain | ||||
| TraesCS5B02G152200 | IPR014014: RNA helicase, DEAD-box type, Q motif IPR027417:P-loop containing nucleoside triphosphate hydrolase | ||||
| TraesCS5B02G152500 | Ribosome assembly factor mrt4 IPR040637: 60S ribosomal protein L10P, insertion domain | ||||
| TraesCS5B02G152600 | IPR017932 Glutamine amidotransferase type 2 domain | ||||
| TraesCS2D02G534800 | IPR008271: Serine/threonine-protein kinase, active site | ||||
| 29 | 1020582|F|0 | 5B:609824667–609977091 | Grain area, Days to heading, Days to maturity, SPAD, Test weight (TGW) | TraesCS5B02G435300 | IPR002213: UDP-glucuronosyl/UDP-glucosyltransferase |
| TraesCS5B02G435600 | IPR043325: Alpha-Amylase Inhibitors (AAI), Lipid Transfer (LT) and Seed Storage (SS) Protein | ||||
| 30 | 987983|F|0 | 5D:104592141–104634865 | Days to heading, Days to maturity, SPAD, Grain area | TraesCS5D02G095300 | IPR001611: Leucine-rich repeat IPR008271: Serine/threonine-protein kinase, active site, IPR000719: Protein kinase domain |
| TraesCS5D02G095400 | IPR002171: Ribosomal protein L2 IPR008991: Translation protein SH3-like domain | ||||
| 31 | 2266275|F|0 | 6B:708055234–708286758 | Days to heading, Days to maturity | TraesCS6B02G448700 | IPR035896: AN1-like Zinc finger |
| TraesCS6B02G447800 | IPR044974, Disease resistance protein, plants IPR038005: Virus X resistance protein-like, coiled-coil domain | ||||
| 32 | 987210|F|0 | 6B:5683365–5845027 | Days to heading, Days to maturity | TraesCS6B02G008700 | IPR044814: Terpene cyclases, class 1, plant |
| TraesCS6B02G008900 | IPR008271: Serine/threonine-protein kinase, active site, IPR017441: Protein kinase IPR032675: Leucine-rich repeat domain | ||||
| TraesCS6B02G008800 | IPR001232: S-phase kinase-associated protein 1-like | ||||
| TraesCS6B02G009105 | IPR001881: EGF-like calcium-binding domain IPR008271: Serine/threonine-protein kinase, active site IPR011009: Protein kinase-like domain superfamily IPR018097: EGF-like calcium-binding, conserved site IPR025287: Wall-associated receptor kinase, galacturonan-binding domain | ||||
| 33 | 995480|F|0 | 6B:80769409–81048854 | NDVI | TraesCS6B02G102800 | IPR001810: F-box domain |
| TraesCS6B02G102900 | IPR008176: Defensin, plant, Amylase inhibitor-like protein | ||||
| TraesCS6B02G103200 | IPR006813: Glycosyl transferase, family 17 | ||||
| 34 | 1021511|F|0 | 7A:83081610–83137614 | Days to heading, Days to maturity | TraesCS7A02G129000 | IPR003311: AUX/IAA protein |
| 35 | 2280866|F|0 | 7A:4249205–4264215 | Grain perimeter | TraesCS7A02G009600 | IPR023296, Glycosyl hydrolase, five-bladed beta-propellor domain |
| 36 | 2278379|F|0 | 7B:134493827–134645674 | Days to heading, Days to maturity | TraesCS7B02G115900 | IPR032799: Xylanase inhibitor, IPR001461: Aspartic peptidase A1 family |
| TraesCS7B02G116200 | PTHR31989: NAC domain- containing protein 82 | ||||
| 37 | 1079395|F|0 | 7B:666498423–666698769 | NDVI | TraesCS7B02G399800 | IPR022991: Ribosomal protein L30e, conserved site |
| TraesCS7B02G400300 | IPR023213: Chloramphenicol acetyltransferase-like domain |
| Year | Environment | Treatment | Population |
|---|---|---|---|
| 2015–2018 Cropping seasons November to April | EN1: Timely sown (last week of November) | Treatment 1: Control (no pathogen inoculation, protected using fungicide) | 185 RILs + Parents (2 replications) |
| Treatment 2: Spot blotch (inoculation by spot blotch pathogen, no protection by fungicide) | 185 RILs + Parents (2 replications) | ||
| EN2: Late sown (last week of December) | Treatment 3: Terminal Heat stress (no pathogen inoculated/protected using fungicide) | 185 RILs + Parents (2 replications) | |
| Treatment 4: Spot blotch + terminal heat stress (inoculation by spot blotch pathogen no protection by the fungicide) | 185 RILs + Parents (2 replications) |
Publisher’s Note: MDPI stays neutral with regard to jurisdictional claims in published maps and institutional affiliations. |
© 2022 by the authors. Licensee MDPI, Basel, Switzerland. This article is an open access article distributed under the terms and conditions of the Creative Commons Attribution (CC BY) license (https://creativecommons.org/licenses/by/4.0/).
Share and Cite
Navathe, S.; Pandey, A.K.; Sharma, S.; Chand, R.; Mishra, V.K.; Kumar, D.; Jaiswal, S.; Iquebal, M.A.; Govindan, V.; Joshi, A.K.; et al. New Genomic Regions Identified for Resistance to Spot Blotch and Terminal Heat Stress in an Interspecific Population of Triticum aestivum and T. spelta. Plants 2022, 11, 2987. https://doi.org/10.3390/plants11212987
Navathe S, Pandey AK, Sharma S, Chand R, Mishra VK, Kumar D, Jaiswal S, Iquebal MA, Govindan V, Joshi AK, et al. New Genomic Regions Identified for Resistance to Spot Blotch and Terminal Heat Stress in an Interspecific Population of Triticum aestivum and T. spelta. Plants. 2022; 11(21):2987. https://doi.org/10.3390/plants11212987
Chicago/Turabian StyleNavathe, Sudhir, Ajeet Kumar Pandey, Sandeep Sharma, Ramesh Chand, Vinod Kumar Mishra, Dinesh Kumar, Sarika Jaiswal, Mir Asif Iquebal, Velu Govindan, Arun Kumar Joshi, and et al. 2022. "New Genomic Regions Identified for Resistance to Spot Blotch and Terminal Heat Stress in an Interspecific Population of Triticum aestivum and T. spelta" Plants 11, no. 21: 2987. https://doi.org/10.3390/plants11212987
APA StyleNavathe, S., Pandey, A. K., Sharma, S., Chand, R., Mishra, V. K., Kumar, D., Jaiswal, S., Iquebal, M. A., Govindan, V., Joshi, A. K., & Singh, P. K. (2022). New Genomic Regions Identified for Resistance to Spot Blotch and Terminal Heat Stress in an Interspecific Population of Triticum aestivum and T. spelta. Plants, 11(21), 2987. https://doi.org/10.3390/plants11212987