Abstract
Even though the site index is a popular method for describing forest productivity, its use is limited in uneven-aged multispecies forests. Accordingly, the site form (SF) is an alternative measure of productivity to the site index based on the tree height–diameter relationship. Our study aims to evaluate SF as a measure of productivity in the temperate uneven-aged multispecies forests of Durango, Mexico, applying three methods to estimate SF: (i) as the mean height of dominant trees at a reference diameter (SFH-D); (ii) as the expected mean height of dominant trees at a reference mean diameter (SFMH-MD), and (iii) as the expected height at a reference diameter for a given site (SFh-dbh). We assess the effectiveness of the SF based on two hypotheses: (i) the SF correlates to the total volume production, and (ii) the SF is independent of stand density. The SFH-D and the SFh-dbh showed a high correlation with productivity. However, they also did so with density. Contrary to this, the SFMH-MD had a weak correlation with density and productivity. We conclude that the SF is a suitable approach to describe site quality. Nonetheless, its effectiveness as a site quality indicator may be affected according to the method used.
1. Introduction
Many decisions aimed at sustainable forest management are based on the assessment of site quality as an indicator of productivity [1,2]. Despite the terms productivity and quality often being used interchangeably to describe the land’s ability to grow trees, they are not synonymous. The former is a quantitative measure of a site’s potential to produce plant biomass. Conversely, the latter is a descriptive measure of site productivity estimated by indirect methods such as the relationship between the height of dominant trees (H; m) and their age [3].
Among the site quality approaches, the site index (SI) is the most popular method used to describe productivity through the H–age relationship. It is therefore frequently used in even-aged stands [4]. The use of the SI is substantiated by the assumptions of a positive relationship between the stand height and volume production [5] and the independence of H from stand density [6]. However, the use of the H–age relationship in uneven-aged multispecies forests has been disputed owing to the age heterogeneity [7] and the lack of distinct growth rings in some tree species, preventing the use of the SI in such instances.
An alternative measure of productivity, based on the relationship between the diameter of dominant trees (D; m) and H, was proposed by Flury in 1929 [8,9] and named site form (SF) by Vanclay and Henry in 1988 [10] to avoid confusion with the SI. In addition to this, the SF has also been called the site productivity index [11]. It has been successfully used as an indicator of productivity in uneven-aged stands [12] and has delivered meaningful results in even-aged forests [13]. Nonetheless, the main feature of SF is its capacity to describe site quality in uneven-aged multispecies forests [14].
The assessment of the usefulness of the SF as a measure of productivity has been carried out through different methods. For instance, the SF as the average H at a specific reference D (SFH-D) [10], as the expected mean H (MH) at a reference mean D (MD) (SFMH-MD) [12,13], and as the tree height (h) at a reference diameter at breast height (dbh) estimated using a specific h-dbh model for a given site plot (SFh-dbh) [14]. Nevertheless, there is no documentation about their comparison, and the results therefore may vary despite being based on the same assumption.
Even though dominant trees are widely used to describe site quality, a universal definition has not emerged to define them. A common approach is to select the dominant trees based on the h or the dbh. Hence, dominance is generally expressed by the 100 tallest or the 100 thickest trees [15] per hectare and selecting a particular definition of dominant trees often relies on how easy it is to measure the required information. However, the number of trees and the method of choosing the dominant trees affect the estimates [16] and thus their effectiveness as a measure of site quality.
Multispecies forests have received increasing scientific and policy attention driven by the hypothesis that forests with a high number of species have an increased productivity and a greater capacity to adapt to climate change impacts [17,18]. Likewise, concerns with regards to the conservation of biodiversity and ensuring the forest’s long-term productivity have incentivized the testing of alternative forest management approaches in uneven-aged stands [19]. However, a high number of tree species complicates selecting one single species as an indicator of productivity [20]. Hence, the SF has been evaluated using the dominant trees, regardless of species, thereby enhancing its practical application [21].
The objective of this study was to evaluate the SF as a measure of productivity for uneven-aged multispecies stands in the temperate forests of Durango, Mexico, using the SFH-D, SFMH-MD and SFh-dbh methods. For those methods that required defining the dominant trees, we evaluated them using the 100 tallest and the 100 thickest trees per hectare, regardless of species. The assessment of SF as a measure of productivity was based on two hypotheses: (i) the SF correlates to the total volume production regardless of the stand species composition, and (ii) the SF is independent of stand density.
2. Results
2.1. H-D, MH-MD and h-dbh Model Fitting
Table 1 gives the estimated parameters and the corresponding goodness-of-fit statistics of the models evaluated. The H-D and MH-MD models explain about 98 percent of the total variance, and their parameters were significant at the five percent level. Therefore, both approaches are suitable for estimating the H or the MH at a specific D or MD. On the other hand, the h-dbh model presented a lower average coefficient of determination (R2) and a higher average root mean square error (RMSE). We attributed this result to the high variability of the h and dbh data pairs in each plot, contrary to the H-D and MH-MD models, which only include dominant trees.

Table 1.
Parameter estimates and goodness-of-fit statistics.
2.2. Reference Diameter Selection
The H-D and MH-MD models showed a slight reduction of relative error in predictions (RE) at a reference diameter equal to or higher than 40 cm. Similarly, the h-dbh model showed a lower RE value at a dbh of 40 cm (Figure 1) but also presented an increment for trees with a dbh larger than 50 cm, which may be attributed to the lack of trees of this size. We therefore selected a reference diameter of 40 cm for the assessment of the SF for all methods evaluated.
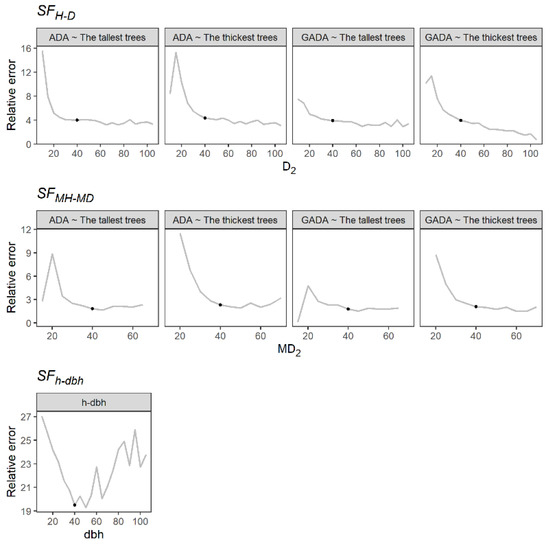
Figure 1.
Relative error in height predictions at different reference diameters. The black point indicates the selected reference diameter.
All the predicted curves overlapped well in the paired data sets of H-D, MH-MD and h-dbh and can thus describe the different patterns of H, MH and h growth (Figure 2). Nonetheless, the main drawback of H-D and MH-MD models is that they require measures from permanent plots. Conversely, the h-dbh model may be adjusted using temporal forest inventory plots.
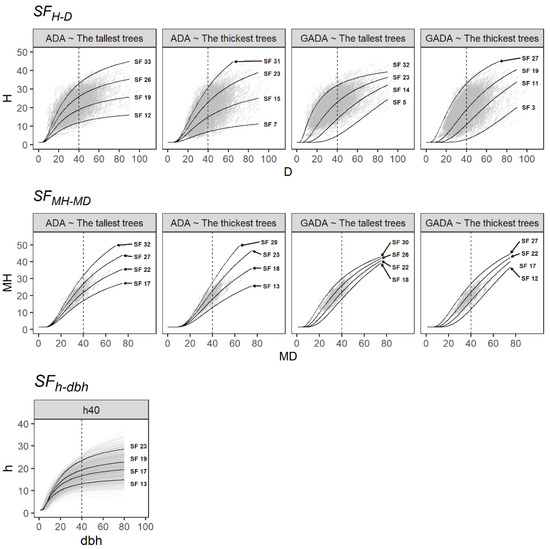
Figure 2.
Site form curves based on the H-D, MH-MD and h-dbh models derived from the SF methods evaluated. The dash line indicates the reference diameter.
2.3. Evaluation of SF as a Site Quality Indicator
The SFH-D and SFh-dbh were positively and significantly correlated with periodic annual increment (PAI; m3 ha−1 year−1), showing Pearson correlation coefficients ranging from 0.2 to 0.7, i.e., from a weak to a strong correlation (Figure 3). In addition, the SFH-D showed a higher correlation using the tallest trees as dominants. Similarly, the use of the Schumacher algebraic difference approach (ADA) model showed a better result than the Schumacher generalized ADA (GADA) model. Hence, the PAI correlates better with the SF using models that predict a steady growth of H or MH and different maximum H or MH values, which seems logical owing to the variation in species mixture. On the other hand, the SFMH-MD showed a low correlation with the PAI. Therefore, estimating forest productivity using the MH or MD in temperate uneven-aged multispecies forests could lead to undesirable results because of the heterogeneity of tree sizes.
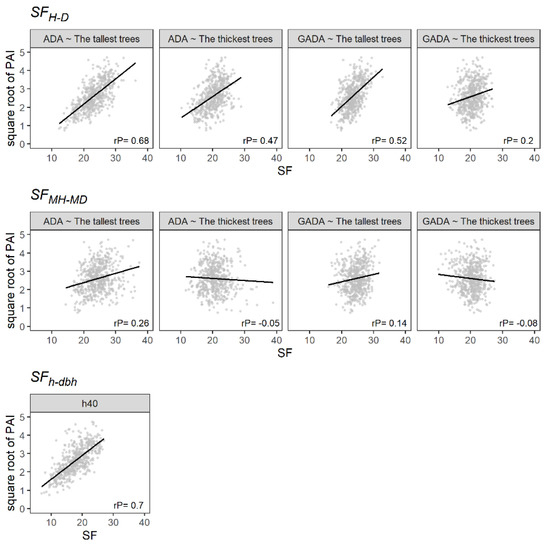
Figure 3.
The relationship between the SF and the square root of the PAI (m3 ha−1 year−1). The black line illustrates the linear regression, and rP is the Pearson correlation.
Table 2 shows the Pearson correlation between SF and productivity through four levels of species mixture defined by the proportion of conifers. The SFH-D and SFh-dbh correlated with the PAI in stands dominated by broadleaf species, where many of these lack distinguishable growth rings that prevent the use of the SI. Besides this, both methods also showed a good performance in all stand mixture levels evaluated. Contrarily, the SFMH-MD estimated using the 100 tallest trees had a higher correlation in stands dominated by coniferous or broadleaf tree species but not in mixed stands.
Table 2.
Pearson correlation between each SF evaluated and the square root of the PAI by stand mixture levels.
Table 3 provides the estimated parameters, with the R2 and the RMSE of the linear regression analysis (Figure 3). The SFMH-MD presented the lowest capacity to predict PAI, showing R2 values not higher than 0.08. On the other hand, the SFH-D showed a better performance using the 100 tallest trees and the ADA based on the Schumacher model. Furthermore, it presented a homogeneous distribution of the residuals (Figure 4). Similarly, the SFh-dbh showed a high capability to predict PAI, with an R2 of 0.49. However, the residuals did not follow a normal distribution (Figure 4).
Table 3.
Linear regression analysis per each SF evaluated.
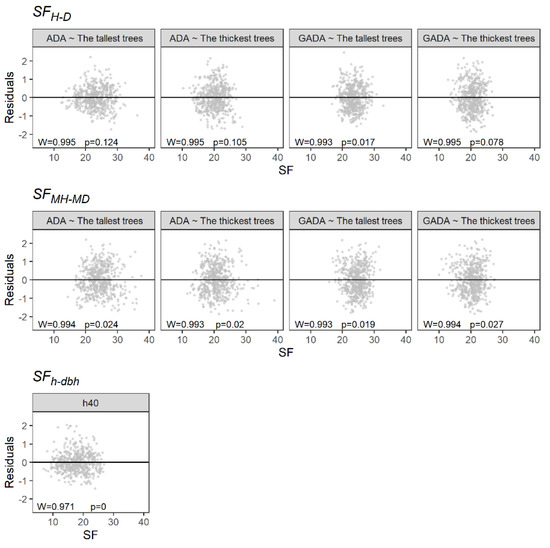
Figure 4.
Residual plot of the linear regression analyses. W is the Shapiro–Wilk test, and p is the p value.
Figure 5 shows that the SFMH-MD method had the lowest correlation with Reineke’s stand density index (SDI). Contrary to this, SFH-D and SFh-dbh were positively correlated in most of the cases evaluated. Therefore, the estimates of the SF based on individual trees could correlate to the SDI owing to the effect of density on the stem form. Nonetheless, the SFH-D estimated using the 100 thickest trees showed a low correlation. This result may be attributed to the definition of the thickest trees containing a higher number of shade-tolerant species (e.g., trees of Quercus, Arbutus and Juniperus) that can live under closed canopies during the juvenile and adult stages [22].
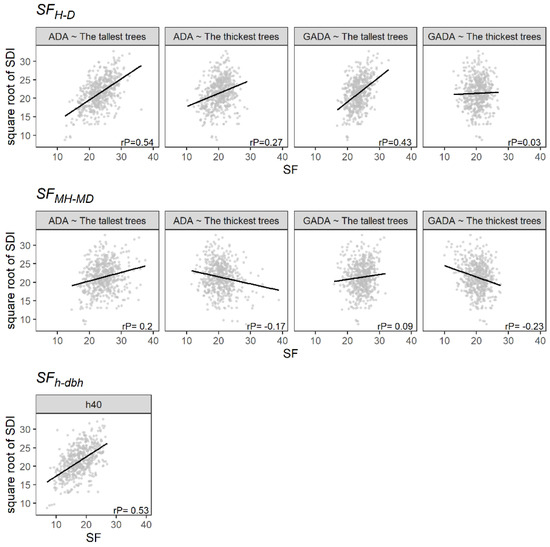
Figure 5.
The relationship between the SF and the square root of the Reineke’s stand density index (SDI). The black line illustrates the linear regression, and rP is the Pearson correlation.
3. Discussion
All evaluated methods showed a different response despite being based on the same assumption of the h-dbh relationship as an indicator of productivity. Therefore, the effectiveness of the SF as a site quality indicator may be affected according to the method, the model, and the specific data set used. Sharma, Amateis and Burkhart [16] reached a similar conclusion by evaluating the performance of seven definitions of H for fitting SI models and concluded that the estimation of the SI using the trees that have always been dominant or codominant over the life of the stand is more precise than the other definitions evaluated. Similarly, the present study shows that the definition of dominant trees may affect the usefulness of SF as a measure of productivity, thus producing unexpected results.
The results show that the 100 tallest trees per hectare exhibit a higher correlation with the PAI than the 100 thickest trees per hectare. Similarly, Vargas-Larreta et al. [23] concluded that the maximum h is a viable estimator of above-ground biomass (Mg ha−1) in temperate forests in Durango, Mexico. In addition, Pretzsch, Forrester and Bauhus [24] documented the effect of taller species on the growth of the shorter ones by the competition for soil resources and early acquisition of light. Therefore, the h of the thickest trees may show a low correlation with the PAI and thus might be a non-significant variable [25] or have a negative effect [26] on the prediction of forest productivity.
The high number of tree species in forests complicates the selection of one species or a group of them as an indicator of productivity [20]. Therefore, the assessment of the SF has been carried out by using all trees or the dominant ones to describe site quality as it allows estimating SF for different site conditions [14,21]. In addition, some studies have reported that the relationship between h and dbh varies by forest condition, as it is an adaptive or a passive response to the environment [27,28]. Therefore, the estimation of the SF considering all species may capture the variability of growth patterns of H, MH or h among tree species and thus site conditions. Nonetheless, this approach may only describe whole stand productivity and cannot be used to estimate the growth potential of a specific species.
The ADA based on the Schumacher model had a higher correlation than GADA with the PAI. Likewise, Fu et al. [12] used ADA to test the SFMH-MD in two natural uneven-aged forests of Larix Olgensis Henry and Quercus Mongolica Fisch in northeastern China, which showed correlation coefficients of 0.55 and 0.79. On the other hand, Molina-Valero et al. [13] reported a correlation of 0.71 in Pinus radiata D. Don even-aged stands in the north of Spain using GADA to test the SFMH-MD. Therefore, the effectiveness of the SF may vary based on the model used and the type of forest evaluated. Nonetheless, Shen et al. [29] concluded that SFMH-MD was less effective than the SI for estimating site productivity on Larix olgensis plantations. Hence, the SI may be a better measure of site productivity in planted forests where the stand age is known [11].
The volume production in multispecies forests is a response that depends on site conditions, structural attributes, species composition, forest density and the interaction between these factors [30,31,32]. Hence, it could be expected that the regression analysis does not show a R2 higher than 0.49. Similarly, an alternative index to the SI for irregular stands, developed by Berrill and O’Hara [33], expressed 32 percent of the variance of stand volume increment. Nonetheless, this index showed a better performance than the SI and a significant effect on the increment of individual trees. Likewise, the SFh-dbh and the SFH-D, estimated by the Schumacher GADA model and the 100 tallest trees, may be used in combination with other variables to describe the forest productivity in stands where the SI cannot be estimated or is not a significant variable to predict the stand volume increment.
Our study shows that most of the SF evaluated correlated positively with the SDI, especially for the SFH-D and the SFh-dbh. However, some studies have found that the estimation of the SI is affected by stand density, thus questioning the assumption of independence [34,35,36]. Asthon and Kelty [15] also documented that very high or low density may influence the h growth of species, conditions that were sampled in the current study that may therefore increase the correlation between the SF and the SDI. In addition, the h-dbh ratio (calculated by dividing the h by the dbh) has been described as a measure related to the stand density that increases in closed spaces [37,38,39], affecting dominant and codominant trees [40,41]. Therefore, stand density may influence the estimation of the SF. In addition, other studies have found that SF correlates positively to stand basal area [10,14,20], a measure commonly used to describe stand density.
On the other hand, alternative approaches describe forest yield based on stand density. For instance, the hypotheses of Wiedermann [42], Assmann [43] and Mar:Moller [44] assume a correlation between volume growth and stand basal area. These hypotheses suggest that timber production is constant until the stand reaches its maximum density, a pattern evaluated in several studies carried out in Mexican temperate forests [25,45,46]. Therefore, the correlation between the SDI and the SF seems logical, as both correlate with timber production. In addition, stand density has also been used as a measure of forest productivity in uneven-aged stands as an alternative to the SI [33].
Even though there are several SI models developed for Mexican forests [47,48,49], their evaluations focus on the predictions of H and not on their capability to describe stand productivity. Therefore, their application may lead to low accuracy on stand yield predictions, likely due to the mixture of species and age classes that complicate the application of the SI [4]. On the other hand, the SFh-dbh and the SFH-D, estimated by the Schumacher GADA model and the 100 tallest trees, were positively correlated to the PAI on different stand mixtures. In addition to this, the SF requires h and dbh measurements, which are variables available from routine inventories and compatible with existing forest inventory data [12]. Therefore, this highlights its applicability as an indicator of quality in uneven-aged multispecies forests in Durango, Mexico.
4. Materials and Methods
The dataset used in this study derives from a network of 423 permanent plots established by the Universidad Juárez del Estado de Durango [50]. These plots cover a great variety of stands, with different levels of density and productivity in Durango’s temperate forests, where the predominant stand condition is uneven-aged pine-oak communities [51]. The location of the permanent plots is given in Figure 6.
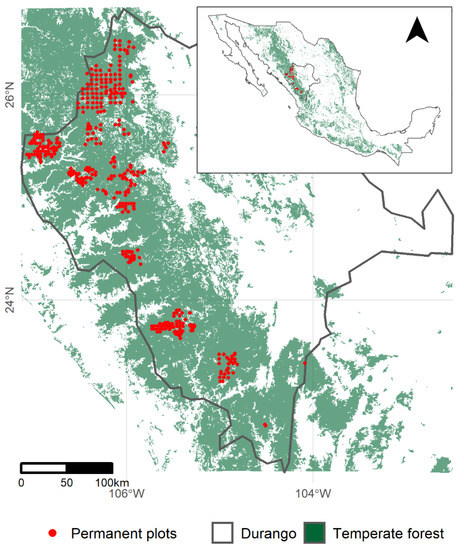
Figure 6.
Location of the 423 permanent plots.
The 423 plots were established in 2007 and re-measured in 2012. Of these, a total of 107 were measured a third time in 2017. Each plot covers an area of 2500 m2 (50 m × 50 m). Within these plots, all trees with a dbh equal to or larger than 7.5 cm were measured. The dbh was measured by caliper and the h by digital hypsometer (Vertex IV). The scientific name, the height to the living crown (m), and the azimuth (degrees) and distance (m) from the center of the plot were also recorded.
A total of 73 tree species were sampled: 34 Quercus, 19 other broadleaf species, 15 Pinus and five other coniferous species. Pinus was the most prominent genus according to the importance value index (the sum of the relative values of the number of individuals, basal area and frequency per species), making up approximately 50 percent of the total value. Additionally, the plots showed a right-skewed distribution for the dbh and the h, most of which were made up by small-size individuals. Table 4 shows a summary of the permanent plots used in this study.
Table 4.
Summary statistics of the 423 plots used in this study.
4.1. H-D, MH-MD and h-dbh Models
To select a suitable base model for evaluating the SF, we fitted several models commonly used in studies of the SI (Bertalanffy-Richards, Hossfeld, Korf, Schumacher). Among them, the Schumacher model [52] showed the best fit for our data. Therefore, we selected the Schumacher function as a base model to develop the H-D, MH-MD and h-dbh models. This model has been used in various studies carried out in Mexican temperate forests that evaluated site productivity or individual tree growth [45,53,54]. The mathematical formulation of the Schumacher model is given below:
where β0 and β1 are the regression parameters.
We used Equation (1) to build the specific nonlinear h-dbh models for each plot as a basis for estimating the SFh-dbh. These specific h-dbh models were fitted using the nls function of R [55]. On the other hand, we adjusted the H-D and MH-MD models using the ADA [56] and the GADA [57] based on the Schumacher model. These approaches describe the development of H or MH by a set of H-D or MH-MD curves, allowing for the classification of the stand according to the Eichhorn rule. The mathematical formulations of ADA and GADA based on the Schumacher model are given below:
Schumacher ADA,
and Schumacher GADA [58],
where , , , and are the H, MH, D, and MD at time n, and β0 and β1 are the regression parameters.
We fitted Equations (2) and (3) using the 100 thickest and the 100 tallest trees per hectare as the definitions of dominant trees. Both definitions included only re-measured live trees during the whole study period and did not distinguish among species. Mohamed et al. [21] used a similar definition of dominant trees to develop H-D curves using the tallest trees, regardless of species, allowing for the comparison of stands with different species compositions.
We used a nonlinear mixed effects modeling approach for the development of the H-D and MH-MD models, simultaneously considering global parameters for the whole population (fixed-effects) and specific parameters for each tree or plot (random effects). As well as this, the autocorrelation was corrected using an autoregressive structure (AR1). We used the function nlme of the NLME package [59] of R [55] to fit the H-D and MH-MD models.
Two goodness-of-fit statistics of H-D and MH-MD models were estimated: the adjusted coefficient of determination,
and the root mean square error,
where , , and are the observed, predicted, and mean values of the dependent variable, respectively; n is the total number of observations, and p is the number of parameters used to fit the models. R2 indicates the proportion of the variance of the dependent variable explained by the model, while RMSE indicates the precision of the estimates. We estimated the statistics of the h-dbh model as the average of the R2 and the RMSE of the specific h-dbh models.
4.2. Reference Diameter Selection
Do et al. [14] suggested that the reference diameter should be a diameter commonly found in the forest, not too small so as to increase the difference among stands and provide higher accuracy to predict H, MH or h. Therefore, we defined the reference D, MD and dbh through a graphical analysis of the evolution of the RE (Equation (6)) at different diameters, an approach that allows for the identification of the reference diameters with higher accuracy predictions.
where all variables are as previously defined.
In addition to this, we carried out a graphical analysis of the expected H and MH at a specific reference diameter overlaid on the H-D and MH-MD data pairs to evaluate the performance of the models. The curves derived from the h-dbh model were developed based on the methodology proposed by Do et al. [14], which requires grouping the plots into SFh-dbh classes and building a h-dbh model for each SFh-dbh class.
4.3. Evaluation of SF as a Site Quality Indicator
A total of nine SF measures were estimated for each plot and inventory period: four SFH-D, four SFMH-MD and one SFh-dbh. The SFH-D and the SFMH-MD were estimated four times as we evaluated two definitions of dominant trees and two models.
Timber volume was calculated using specific volume equations for each species and region [60]. These estimate the volume of stems and branches, thus adding up to the total tree volume:
where , , and are specific parameters by species and region [60]. Subsequently, the individual tree volume increment was estimated by taking the differences in volume between measurements and dividing this by the length of the period (five years). Lastly, it was extrapolated to one hectare and summed at the plot level, resulting in the PAI.
We defined Reineke’s index [61],
as a measure of density to assess the relationship between the SF and stand density. This index assumes a maximum number of trees that may coexist in a stand according to the number of trees per hectare (N) and the quadratic mean diameter (Dq, cm), thus describing stand density as a function of the maximum density achievable and these two variables.
We evaluated the SF-productivity relationship using Pearson’s correlation test between the SF and the PAI. This evaluation was also conducted for four stand mixture levels, defined by the relative proportion of coniferous species’ individuals. Additionally, we evaluated the performance of the SF as a measure of productivity through linear regression analysis. Lastly, we tested the independence of the SF from stand density using Pearson’s correlation test.
5. Conclusions
The SF may be used to estimate the productive potential of stands with different tree species and size classes. It is therefore not possible to reject the hypothesis of the correlation between SF and volume production. This study presents evidence that the SFh-dbh and the SFH-D, estimated by the Schumacher GADA model and the 100 tallest trees per hectare, are suitable approaches to describe the site productivity potential of temperate uneven-aged multispecies forests in Durango, Mexico. Nonetheless, the SF correlated positively with the SDI in most of the cases evaluated, likely due to the effect of density on the h-dbh ratio and thus rejecting the hypothesis of the independence of SF from stand density.
Author Contributions
Conceptualization, J.R.P.-M. and U.D.-A.; formal analysis, J.R.P.-M.; writing—original draft preparation, J.R.P.-M.; writing—review and editing, C.P., K.H., J.J.C.-R., U.D.-A. and K.v.G.; supervision C.P. and K.H.; project administration, J.J.C.-R.; funding acquisition, J.J.C.-R. All authors have read and agreed to the published version of the manuscript.
Funding
This research was funded by The National Forestry Commission of Mexico and the Mexican National Council for Science and Technology (CONAFOR-CONACYT-115900).
Institutional Review Board Statement
Not applicable.
Informed Consent Statement
Not applicable.
Data Availability Statement
Not applicable.
Acknowledgments
We gratefully acknowledge the support of the German Academic Exchange Service (DAAD). We would also like to thank Caitriona Brady Halmschlag for the language editing of the manuscript. Lastly, we thank the reviewers and the editor for their valuable assistance.
Conflicts of Interest
The authors declare no conflict of interest.
References
- Blanco, M.M.E.; Hoppus, M.; Lister, A.; Westfall, J.A. Is there a better metric than site to indicate the productivity of forested land? In Proceedings of the Eighth Annual Forest Inventory and Analysis Symposium, Monterey, CA, USA, 16–19 October 2006; McRoberts, R.E., Reams, G.A., Van Deusen, P.C., McWilliams, W.H., Eds.; U.S. Department of Agriculture, Forest Service: Washington, DC, USA, 2006; pp. 355–362. [Google Scholar]
- Bontemps, J.D.; Bouriaud, O. Predictive approaches to forest site productivity: Recent trends, challenges, and future perspectives. Forestry 2014, 87, 109–128. [Google Scholar] [CrossRef]
- Skovsgaard, J.P.; Vanclay, J.K. Forest site productivity: A review of spatial and temporal variability in natural site conditions. Forestry 2013, 86, 305–315. [Google Scholar] [CrossRef]
- del Río, M.; Pretzsch, H.; Alberdi, I.; Bielak, K.; Bravo, F.; Brunner, A.; Condés, S.; Ducey, M.J.; Fonseca, T.; von Lüpke, N.; et al. Characterization of the structure, dynamics, and productivity of mixed-species stands: A review and perspectives. Eur. J. For. Res. 2015, 135, 23–49. [Google Scholar] [CrossRef]
- Eichhorn, F. Beziehungen zwischen Bestandshöhe und Bestandsmasse. Allg. Forst. Jagdztg. 1904, 80, 45–49. [Google Scholar]
- Burkhart, H.E.; Tomé, M. Modeling Forest Trees and Stands; Springer: Amsterdam, The Netherlands, 2012; p. 458. [Google Scholar]
- Huang, S.; Titus, S.J. An index of site productivity for uneven-aged or mixed-species stands. Can. J. For. Res. 1993, 23, 558–562. [Google Scholar] [CrossRef]
- Flury, P. Über den Aufbau des Plenterwaldes. Mitt. Der Schweiz. Cent. Für Das Vers. 1929, 15, 305–357. [Google Scholar]
- von Gadow, K.; Sánchez, O.S.; Álvarez, G.J.G. Estructura y Crecimiento del Bosque; Universidad de Santiago de Compostela: Lugo, Spain, 2007; p. 282. [Google Scholar]
- Vanclay, J.K.; Henry, N.B. Assessing site productivity of indigenous cypress pine forest in southern Queensland. Commonw. For. Rev. 1988, 67, 53–64. [Google Scholar]
- Wang, G.G. Is height of dominant trees at a reference diameter an adequate measure of site quality? For. Ecol. Manag. 1998, 112, 49–54. [Google Scholar] [CrossRef]
- Fu, L.; Lei, X.; Sharma, R.P.; Li, H.; Zhu, G.; Hong, L.; You, L.; Duan, G.; Guo, H.; Lei, Y.; et al. Comparing height-age and height-diameter modelling approaches for estimating site productivity of natural uneven-aged forests. Forestry 2018, 91, 419–433. [Google Scholar] [CrossRef]
- Molina-Valero, J.A.; Diéguez-Aranda, U.; Álvarez-González, J.G.; Castedo-Dorado, F.; Pérez-Cruzado, C. Assessing site form as an indicator of site quality in even-aged Pinus Radiata D. Don stands in north-western Spain. Ann. For. Sci. 2019, 76, 113. [Google Scholar] [CrossRef]
- Do, H.T.T.; Zimmer, H.C.; Vanclay, J.K.; Grant, J.C.; Trinh, B.N.; Nguyen, H.H.; Nichols, J.D. Site form classification– a practical tool for guiding site-specific tropical forest landscape restoration and management. Forestry 2021, 95, 261–273. [Google Scholar] [CrossRef]
- Asthon, M.S.; Kelty, M.J. The Practice of Silviculture Applied Forest Ecology; John Wiley & Sons Ltd.: Hoboken, NJ, USA, 2018; p. 758. [Google Scholar]
- Sharma, M.; Amateis, R.L.; Burkhart, H.E. Top height definition and its index determination in thinned and unthinned loblolly pine plantations. For. Ecol. Manag. 2002, 168, 163–175. [Google Scholar] [CrossRef]
- Kuuluvainen, T. Forest management and biodiversity conservation based on natural ecosystem dynamics in the northern Europe: The complexity challenge. Ambio 2009, 38, 309–315. [Google Scholar] [CrossRef] [PubMed]
- Liang, J.; Crowther, T.W.; Picard, N.; Wiser, S.; Zhou, M.; Alberti, G.; Schulze, E.D.; McGuire, A.D.; Bozzato, F.; Pretzsch, H.; et al. Positive biodiversity-productivity relationship predominant in global forests. Science 2016, 354, aaf8957. [Google Scholar] [CrossRef]
- Torres-Rojo, J.M.; Moreno-Sánchez, R.; Mendoza-Briseño, M.A. Sustainable forest management in Mexico. Curr. For. Rep. 2016, 2, 93–105. [Google Scholar] [CrossRef]
- Reich, R.M.; Bravo, V.A. New approach for modeling climatic data with applications in modeling tree species distributions in the states of Jalisco and Colima, Mexico. J. Arid. Environ. 2008, 72, 1343–1357. [Google Scholar] [CrossRef]
- Mohamed, A.; Reich, R.M.; Khosla, R.; Aguirre-Bravo, C.; Mendoza, B.M. Influence of climatic, topography and soil attributes on the spatial distribution of site productivity index of the species rich forests of Jalisco, Mexico. J. For. Res. 2014, 25, 87–95. [Google Scholar] [CrossRef]
- Alfaro, R.T.; Martínez-Vilalta, J.; Retana, J. Regeneration patterns in Mexican pine-oak forests. For. Ecosyst. 2019, 6, 50. [Google Scholar] [CrossRef]
- Vargas-Larreta, B.; López-Martínez, J.O.; González, E.J.; Corral-Rivas, J.J.; Hernández, F.J. Assessing above-ground biomass-functional diversity relationships in temperate forests in northern Mexico. For. Ecosyst. 2021, 8, 8. [Google Scholar] [CrossRef]
- Pretzsch, H.; Forrester, D.I.; Bauhus, J. Mixed-Species Forest, Ecology and Management; Springer: Berlin/Heidelberg, Germany, 2017; p. 653. [Google Scholar]
- Corral-Rivas, J.J.; Torres-Rojo, J.M.; Lujan-Soto, J.E.; Nava-Miranda, M.G.; Aguirre-Calderón, O.A.; von Gadow, K. Density and production in the natural forests of Durango/Mexico. Allg. Forst. Jagdztg. 2016, 187, 93–103. [Google Scholar]
- Navar, J. Modeling tree diversity, stand structure and productivity of northern temperate coniferous of Mexico. PeerJ 2019, 7, e7051. [Google Scholar] [CrossRef] [PubMed]
- Schmidt, M.; Kiviste, A.; von Gadow, K. A spatially explicit height-diameter model for Scots pine in Estonia. Eur. J. For. Res. 2011, 130, 303–315. [Google Scholar] [CrossRef]
- Temesgen, H.; Zhang, C.H.; Zhao, X.H. Modelling tree height-diameter relationships in multi-species and multi-layered forests: A large observational study from Northeast China. For. Ecol. Manag. 2014, 316, 78–89. [Google Scholar] [CrossRef]
- Shen, J.; Lei, X.; Lei, Y.; Li, Y. Comparison between site index and site form for site quality evaluation of Larix olgensis plantation. J. Beijing For. Univ. 2018, 40, 1–8. [Google Scholar]
- Kelty, M.J. Comparative productivity of monocultures and mixed species stands. In The Ecology and Silviculture of Mixed-Species Forests; Kelty, M.J., Larson, B.C., Oliver, C.D., Eds.; Kluwer Academic Publishers: Dordrecht, The Netherlands, 1992. [Google Scholar]
- Garber, S.M.; Maguire, D.A. Stand productivity and development in two mixed-species spacing trials in the Central Oregon Cascades. For. Sci. 2004, 50, 92–105. [Google Scholar]
- Jacob, M.; Leuschner, C.; Thomas, F.M. Productivity of temperate broad-leaved forest stands differing in tree species diversity. Ann. For. Sci. 2010, 67, 503. [Google Scholar] [CrossRef]
- Berrill, J.P.; O’Hara, K.L. Estimating site productivity in irregular stand structures by indexing the basal area or volume increment of the dominant species. Can. J. For. Res. 2014, 44, 92–100. [Google Scholar] [CrossRef]
- Antón-Fernández, C.; Burkhart, H.E.; Strub, M.; Amateis, R.L. Effects of initial spacing on height development of loblolly pine. For. Sci. 2011, 53, 201–211. [Google Scholar]
- Trouvé, R.; Bontemps, J.D.; Collet, C.; Seynave, I.; Lebourgeois, F. When do dendrometric rules fail? Insights from 20 years of experimental thinnings on sessile oak in the GIS Coop network. For. Ecol. Manag. 2019, 433, 276–286. [Google Scholar] [CrossRef]
- Toraño-Caicoya, A.; Pretzsch, H. Stand density biases the estimation of the site index especially on dry sites. Can. J. For. Res. 2020, 51, 1050–1064. [Google Scholar] [CrossRef]
- Peracca, G.G.; O’Hara, K.L. Effects of growing space on growth for 20-year-old giant sequoia, ponderosa pine and Douglas-fir in the Sierra Nevada. West. J. Appl. For. 2008, 23, 156–165. [Google Scholar] [CrossRef]
- Vospernik, S.; Monserud, R.A.; Sterba, H. Do individual-tree growth models correctly represent height:diameter ratios of Norway spruce and Scots pine? For. Ecol. Manag. 2010, 260, 1735–1753. [Google Scholar] [CrossRef] [PubMed]
- Ramalho, F.M.G.; Pimineta, E.M.; Goulart, C.P.; de Almeida, M.N.F.; Vidaurre, G.B.; Hein, P.R.G. Effect of stand density on longitudinal variation of wood and bark growth in fast-growing Eucalyptus plantations. iForest 2019, 12, 527–532. [Google Scholar] [CrossRef]
- Macfarlane, D.W.; Green, E.J.; Burkhart, H.E. Population density influences assessment and application of site index. Can. J. For. Res. 2000, 30, 1472–1475. [Google Scholar] [CrossRef]
- Nguyen, T.T.; Dinh, T.T.; Shen, H.L. Height-diameter relationship for Pinus koraiensis in Mengjiagang forest farm of northeast China using nonlinear regressions and artificial neural network models. J. For. Sci. 2019, 65, 134–143. [Google Scholar] [CrossRef]
- Wiedemann, E. Die Rotbuche 1931; M. & H. Schaper: Hannover, Germany, 1932; p. 191. [Google Scholar]
- Assmann, E. Grundflächen- und Volumzuwachs der Rotbuche bei verschiedenen Durchforstungsgraden. Forstwiss. Centralbl. 1950, 69, 256–286. [Google Scholar] [CrossRef]
- Moller, C.M. The effect of thinning, age, and site on foliage, increment, and loss of dry matter. J. For. 1947, 45, 393–404. [Google Scholar]
- Torres-Rojo, J.M. Exploring volume growth-density of mixed multiaged stands in northern Mexico. Agrociencia 2014, 48, 447–461. [Google Scholar]
- Padilla-Martínez, J.R.; Corral-Rivas, J.J.; Briseño-Reyes, J.; Paul, C.; López-Serrano, P.M.; von Gadow, K. Patterns of density and production in the community forests of the Sierra Madre Occidental, Mexico. Forests 2020, 11, 307. [Google Scholar] [CrossRef]
- Corral, R.J.J.; Álvarez, G.J.G.; Ruíz, G.A.A.; von Gadow, K. Compatible height and site index models for five pine species in El Salto, Durango (Mexico). For. Ecol. Manag. 2004, 2, 145–160. [Google Scholar] [CrossRef]
- Castillo, L.A.; Vargas-Larreta, B.; Corral, R.J.J.; Nájera, L.J.A.; Cruz, C.F.; Hernández, F.J. Modelo compatible altura- índice de sitio para cuatro especies de pino en Santiago Papasquiaro, Durango. Rev. Mex. Cienc. For. 2013, 4, 86–103. [Google Scholar]
- Quiñonez-Barraza, G.; De los Santos-Posadas, H.M.; Cruz-Cobos, F.; Velázquez-Martínez, A.; Ángeles-Pérez, G.; Ramírez-Valverde, G. Índice de sitio con polimorfismo complejo para masas forestales de Durango, México. Agrociencia 2015, 49, 439–454. [Google Scholar]
- Corral-Rivas, J.J.; Vargas-Larreta, B.; Wehenkel, C.; Aguirre-Calderón, O.A.; Crecente-Campo, F. Guía Para el Establecimiento, Seguimiento y Evaluación de Sitios Permanentes de Monitoreo de Paisajes Productivos Forestales; Fondo Sectorial para la Investigación, el Desarrollo y la Innovación Tecnológica Forestal: Distrito Federal, Mexico, 2013; p. 82. [Google Scholar]
- Silva-Flores, R.; Pérez-Verdín, G.; Wehenkel, C. Patterns of trees diversity in relation climatic factors on the Sierra Madre Occidental, Mexico. PLoS ONE 2014, 9, e105034. [Google Scholar] [CrossRef] [PubMed]
- Schumacher, F. A new growth curve and its application to timber yield studies. J. For. 1939, 37, 819–820. [Google Scholar]
- Martínez-Salvador, M.; Mata-Gonzalez, R.; Pinedo-Alvarez, A.; Morales-Nieta, C.R.; Prieto-Amparán, J.A.; Vázquez-Quintero, G.; Villareal-Guerrero, F. A spatial forestry productivity potential model for Pinus arizonica Engelm, a key timber species from Northwest Mexico. Sustainability 2019, 11, 829. [Google Scholar] [CrossRef]
- Hernández, J.F.; Meraz, A.J.C.; Vargas, L.B.; Nájera, L.J.A. Diameter, height, basal area and volume growth of three pine species from Chihuahua, Mexico. Rev. Mex. Cienc. For. 2020, 11, 120–143. [Google Scholar]
- R Core Team. R: A Language and Environment for Statistical Computing; R Foundation for Statistical Computing: Vienna, Austria, 2020; Available online: https://www.R-project.org (accessed on 8 September 2022).
- Bailey, R.L.; Clutter, J.L. Base-age invariant polymorphic site curves. For. Sci. 1974, 20, 155–159. [Google Scholar]
- Cieszewski, C.J.; Bailey, R.L. Generalized algebraic difference approach: Theory based derivation of dynamic site equations with polymorphism and variable asymptotes. For. Sci. 2000, 46, 116–126. [Google Scholar]
- Trim, K.R.; Coble, D.W.; Weng, Y.; Stovall, J.P.; Hung, I. A new site index model for intensively managed loblolly pine (Pinus taeda) plantations in the West Gulf Coastal Plain. For. Sci. 2020, 66, 2–13. [Google Scholar] [CrossRef]
- Pinheiro, J.; Bates, D.; DebRoy, S.; Sarkar, D.; R Core Team. nlme: Linear and Nonlinear Mixed Effects Models. 2020. Available online: https://CRAN.R-project.org/package=nlme (accessed on 8 September 2022).
- Simental-Cano, B.; López-Sánchez, C.A.; Wehenkel, C.; Vargas-Larreta, B.; Álvarez-González, J.G.; Corral-Rivas, J.J. Species-specific and regional volume models for 12 forest species in Durango, Mexico. Rchscfa 2016, 23, 155–171. [Google Scholar] [CrossRef]
- Reineke, L.H. Perfecting a stand-density index for even-aged forests. J. Agric. Res. 1933, 46, 627–638. [Google Scholar]
Publisher’s Note: MDPI stays neutral with regard to jurisdictional claims in published maps and institutional affiliations. |
© 2022 by the authors. Licensee MDPI, Basel, Switzerland. This article is an open access article distributed under the terms and conditions of the Creative Commons Attribution (CC BY) license (https://creativecommons.org/licenses/by/4.0/).