
Impacts of Different Light Spectra on CBD, CBDA and Terpene Concentrations in Relation to the Flower Positions of Different Cannabis Sativa L. Strains

 ,
,  ,
,
Abstract
1. Introduction

2. Materials and Methods
2.1. Experimental Setup
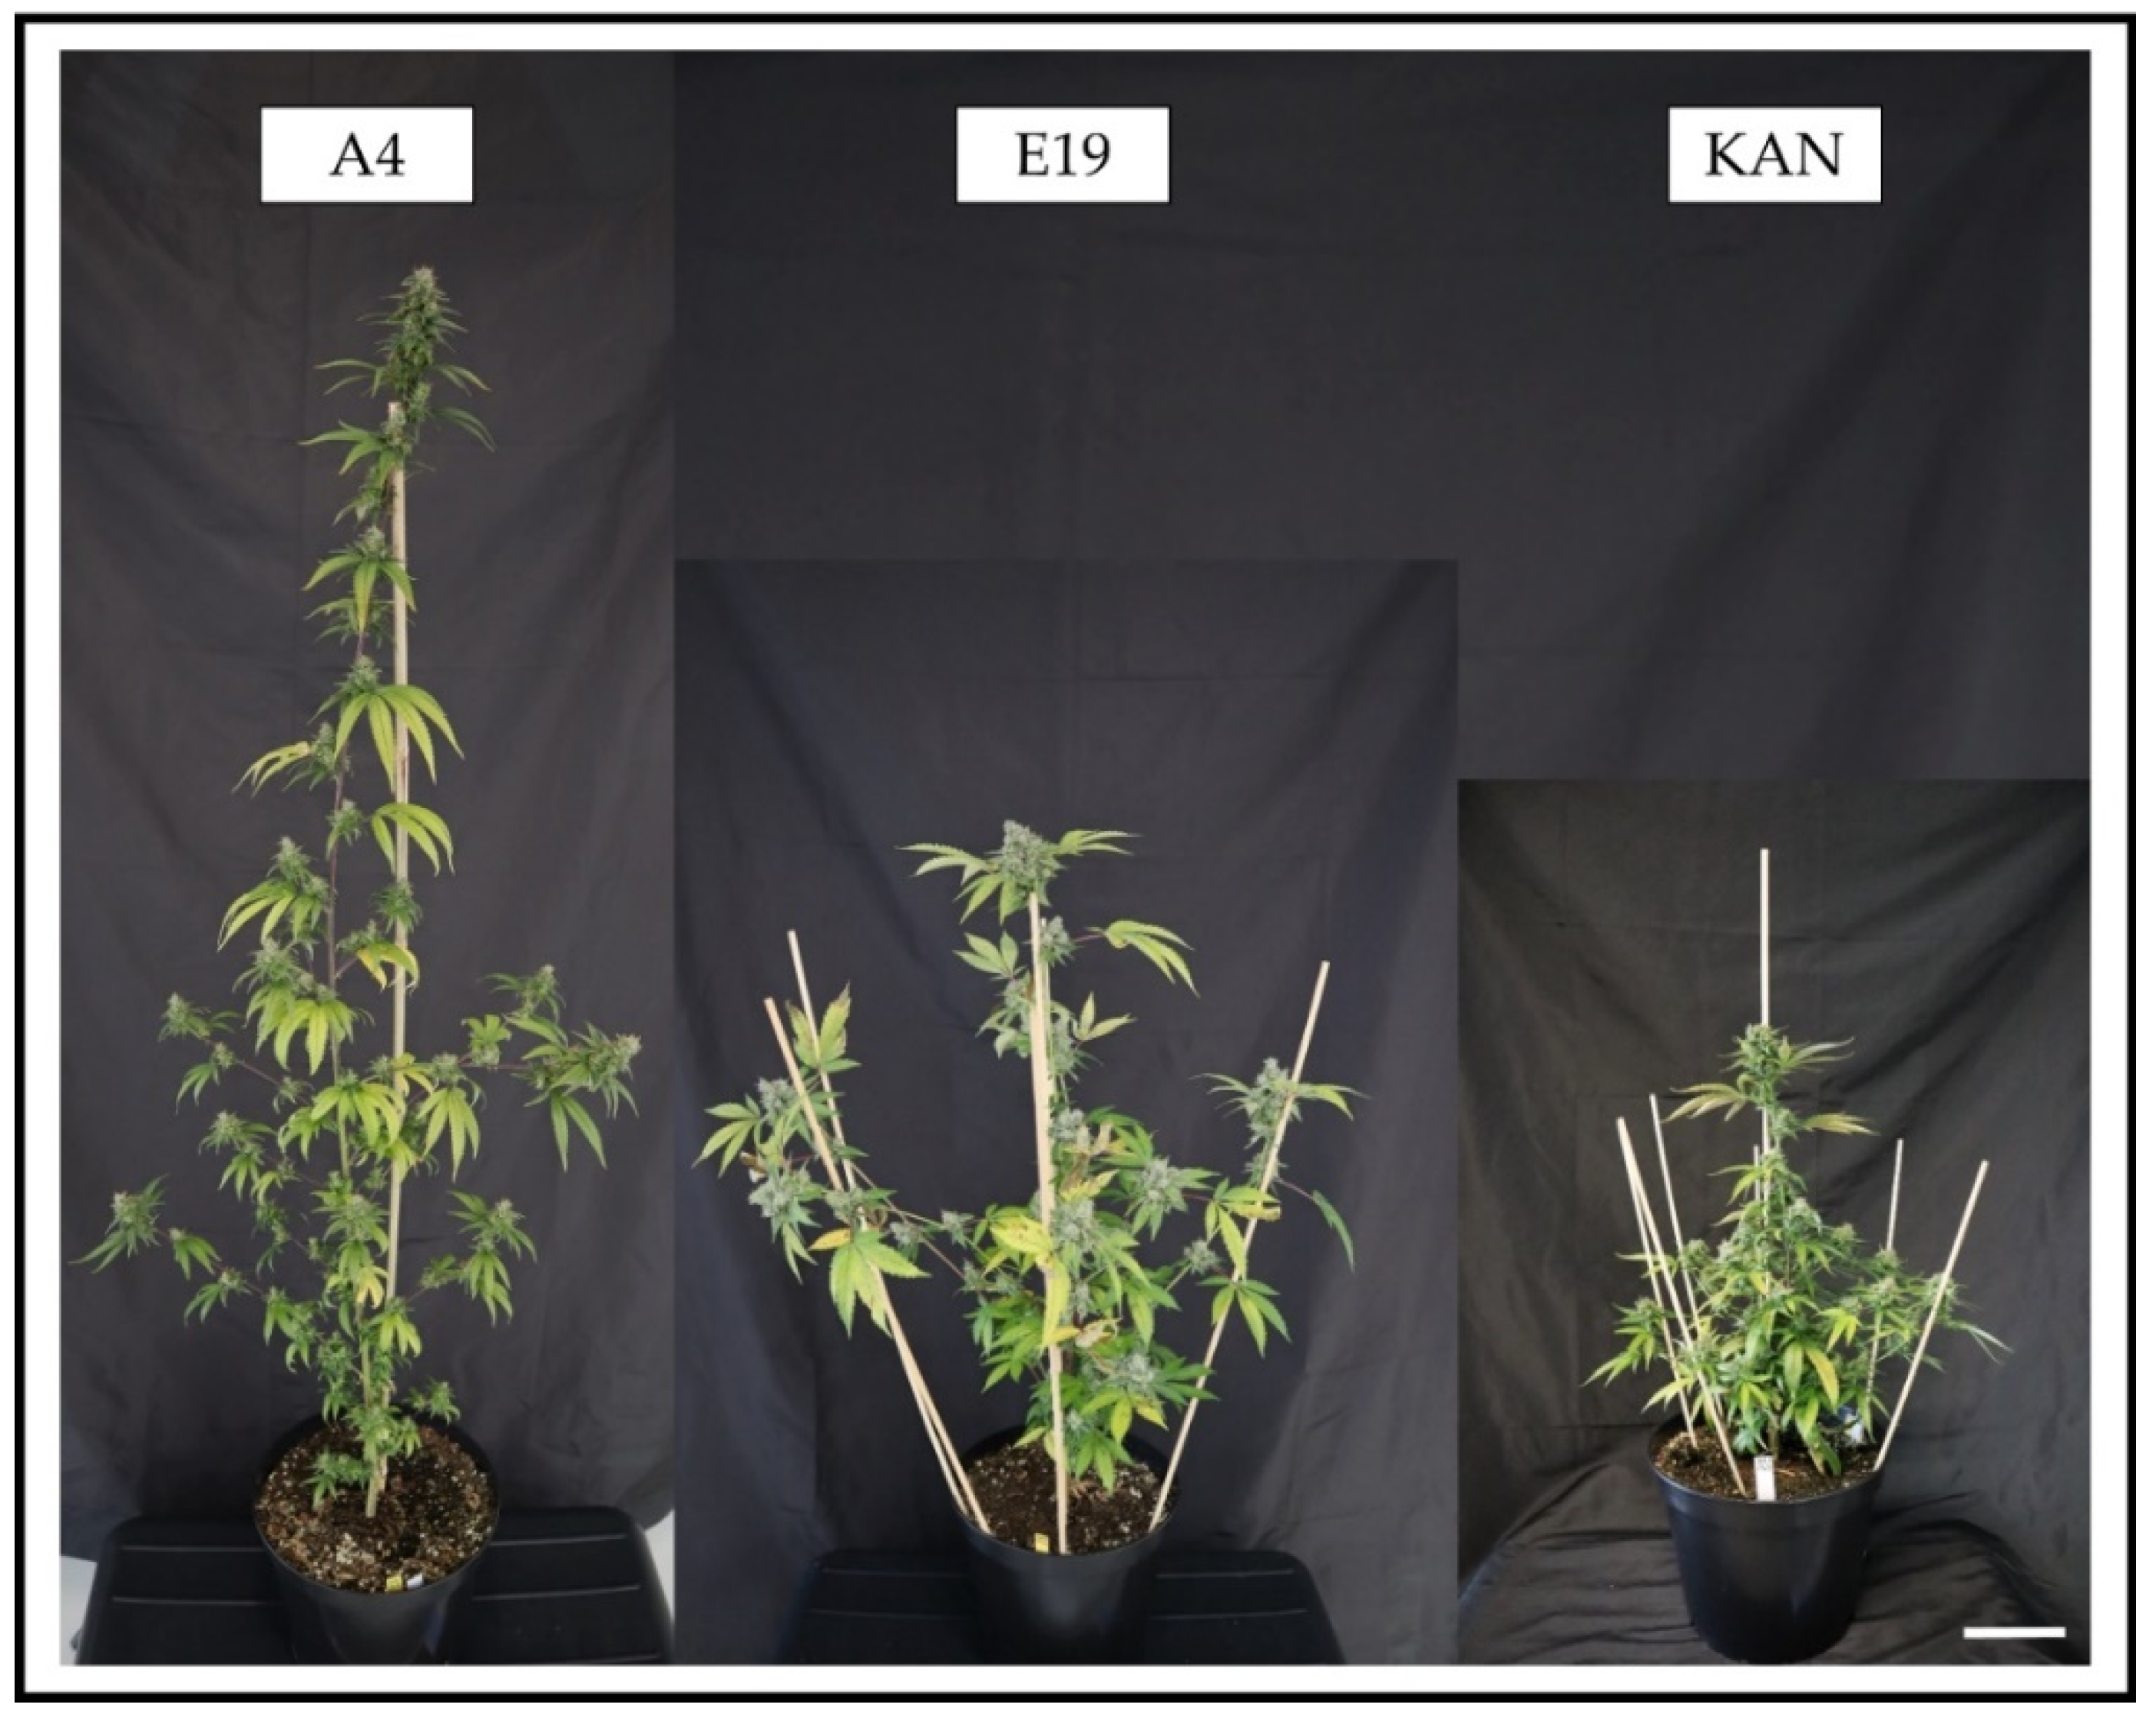
2.2. Plant Materials and Growing Conditions
2.3. Data Collection
2.3.1. Destructive Sampling
2.3.2. Photosynthetic Rate
2.4. Cannabinoid and Terpene Analysis
2.4.1. Terpene Analysis
2.4.2. Cannabinoid Analysis
2.5. Statistical Analysis
3. Results
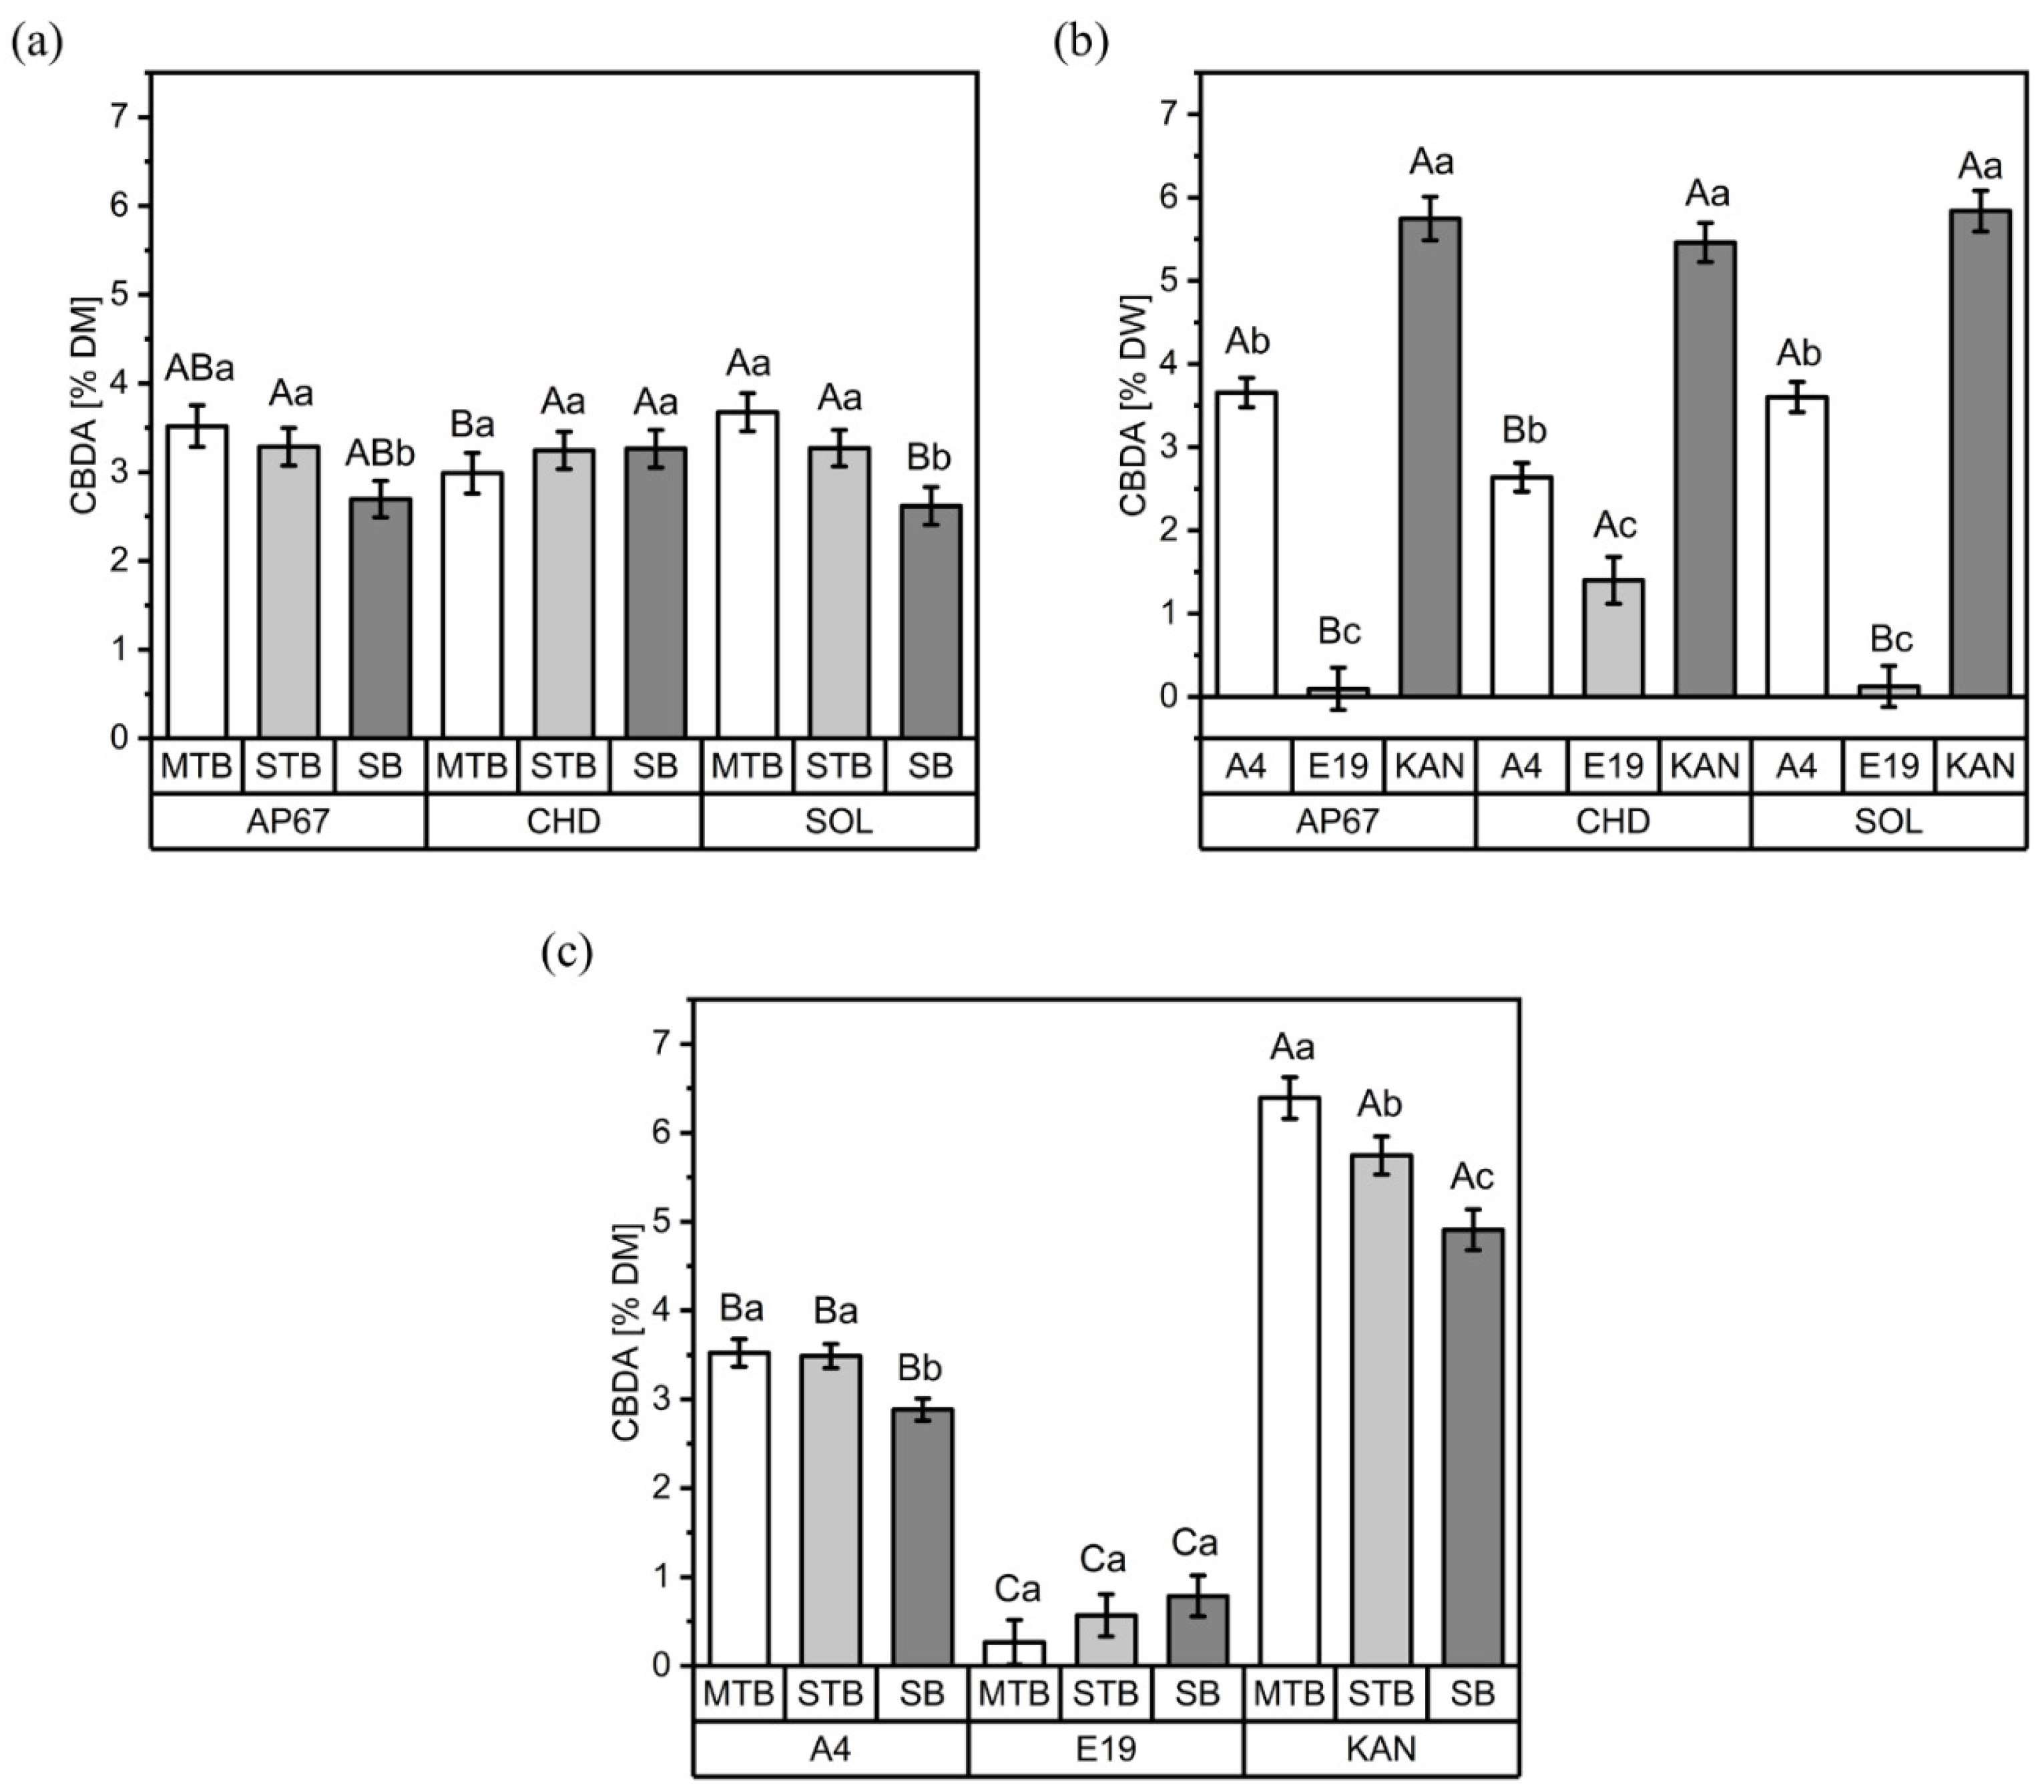
3.1. CBD and CBDA
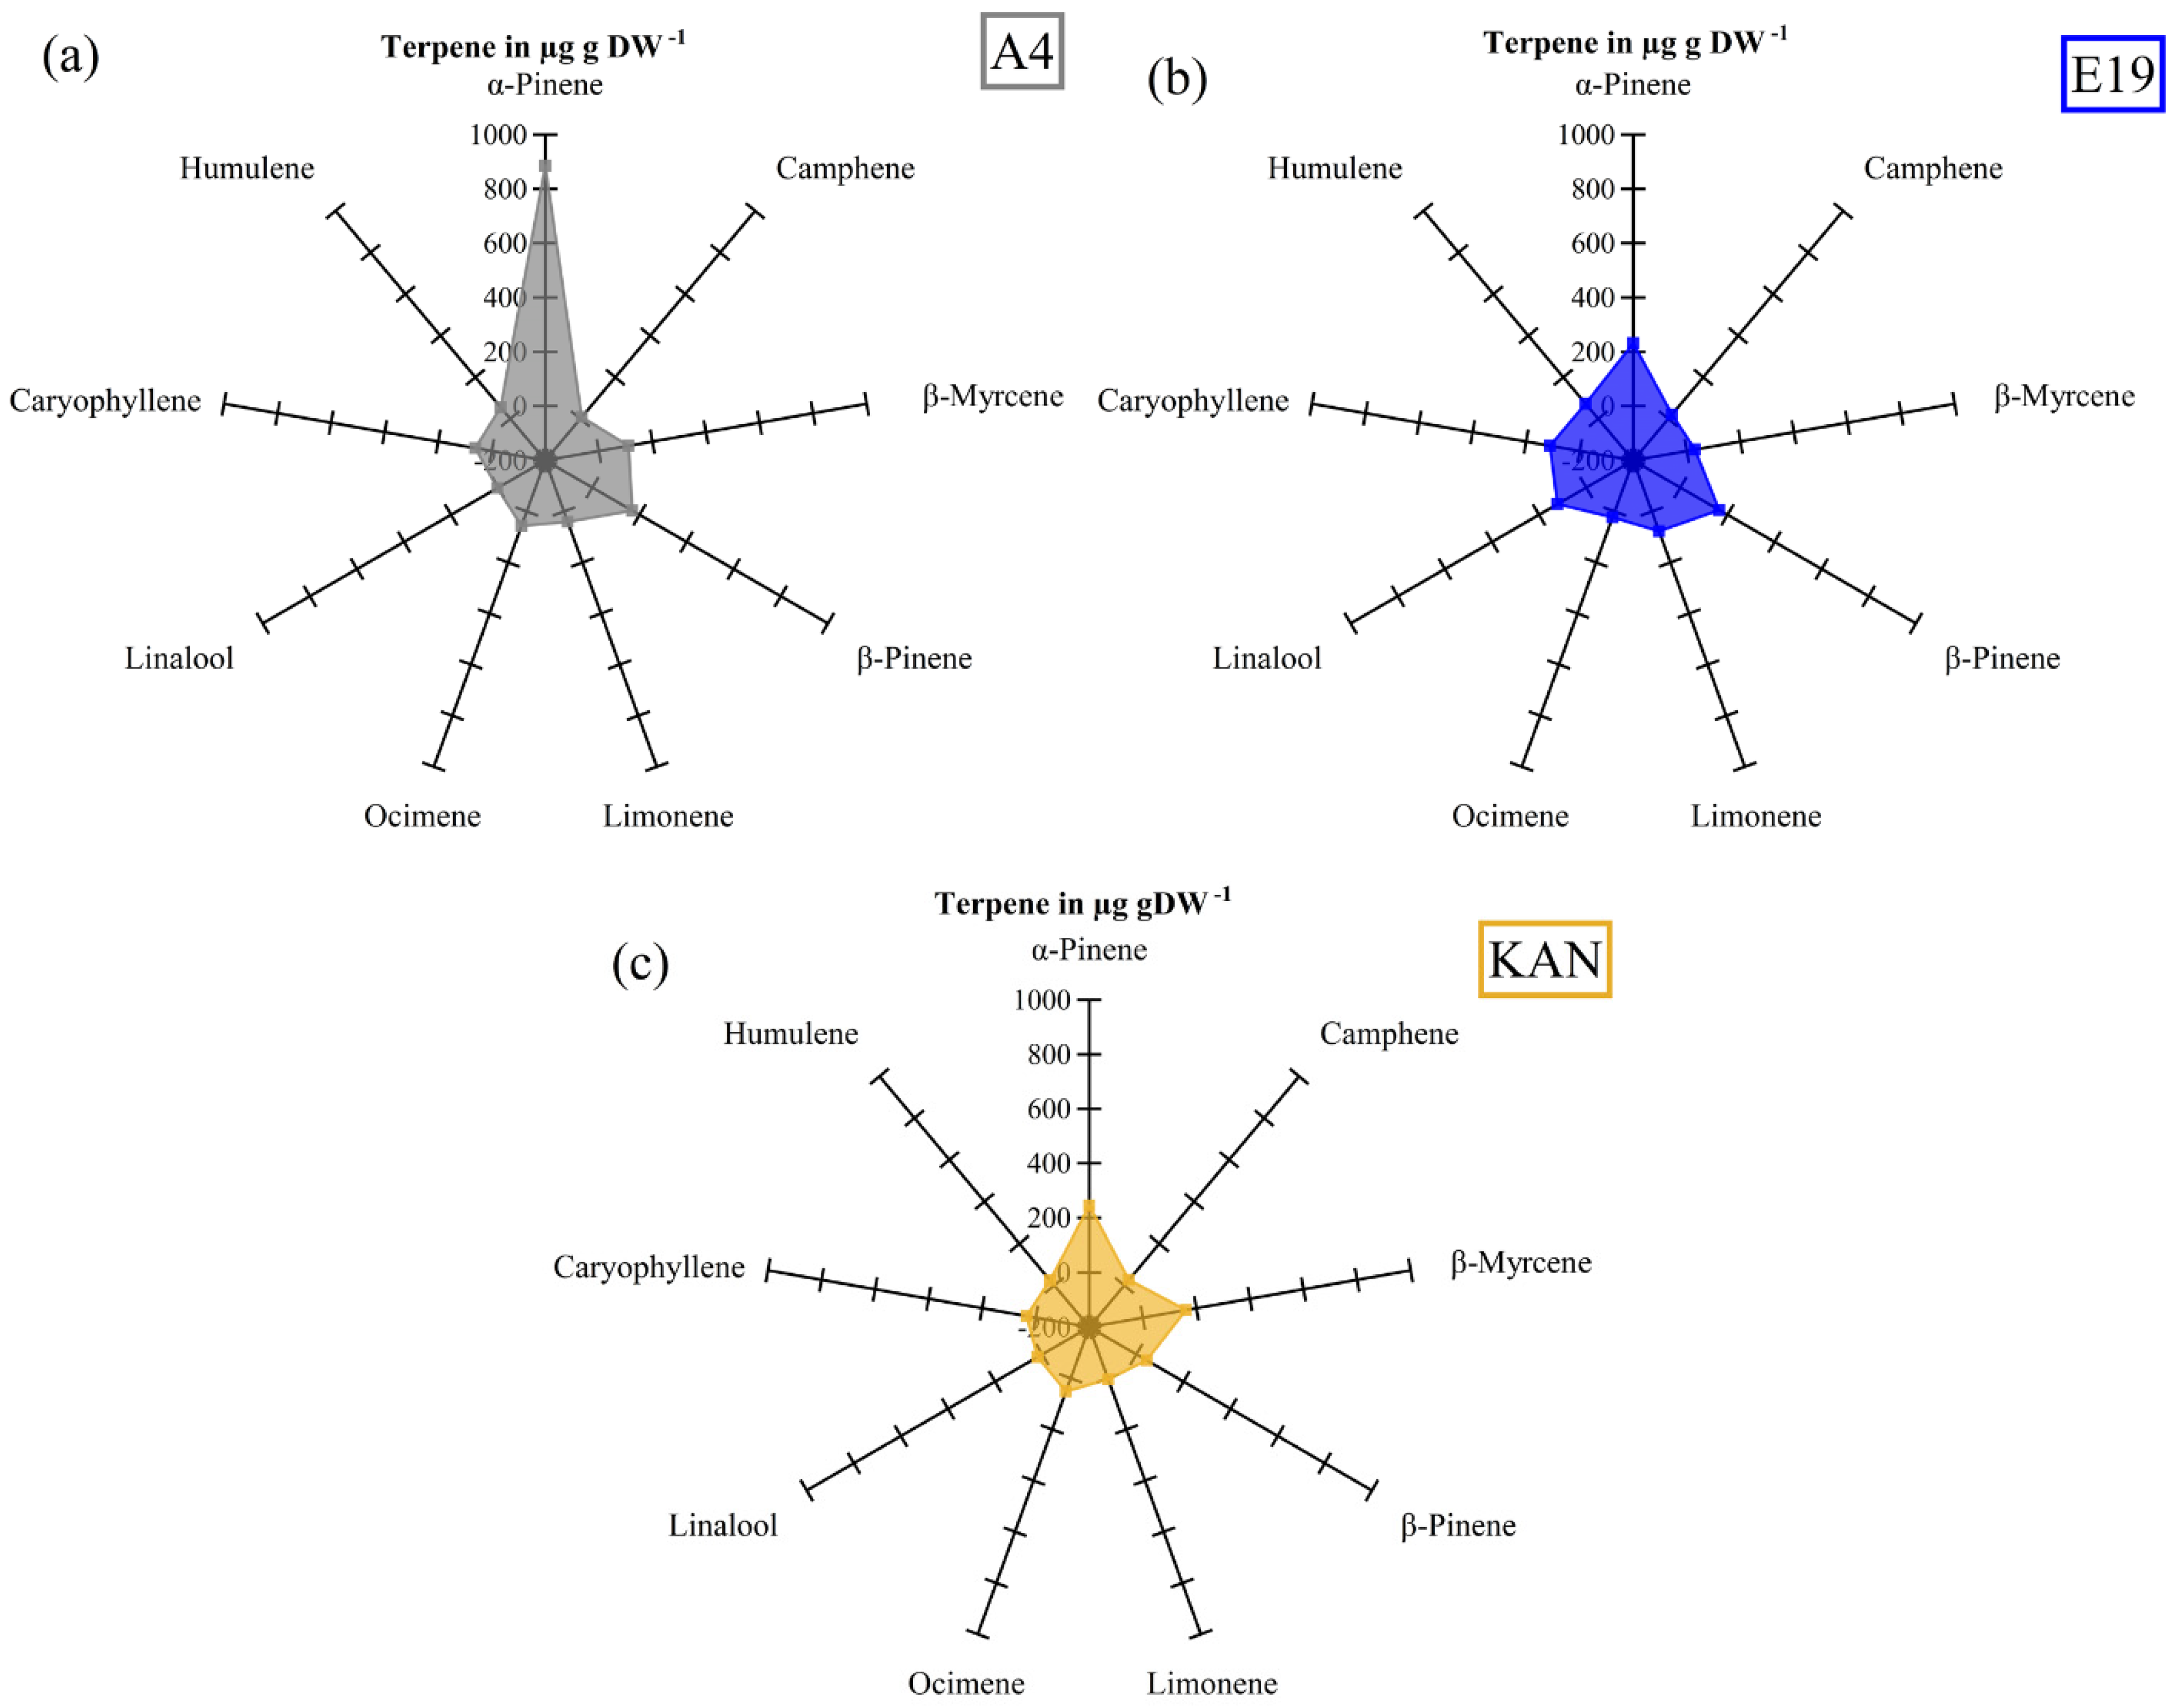
3.2. Terpenes
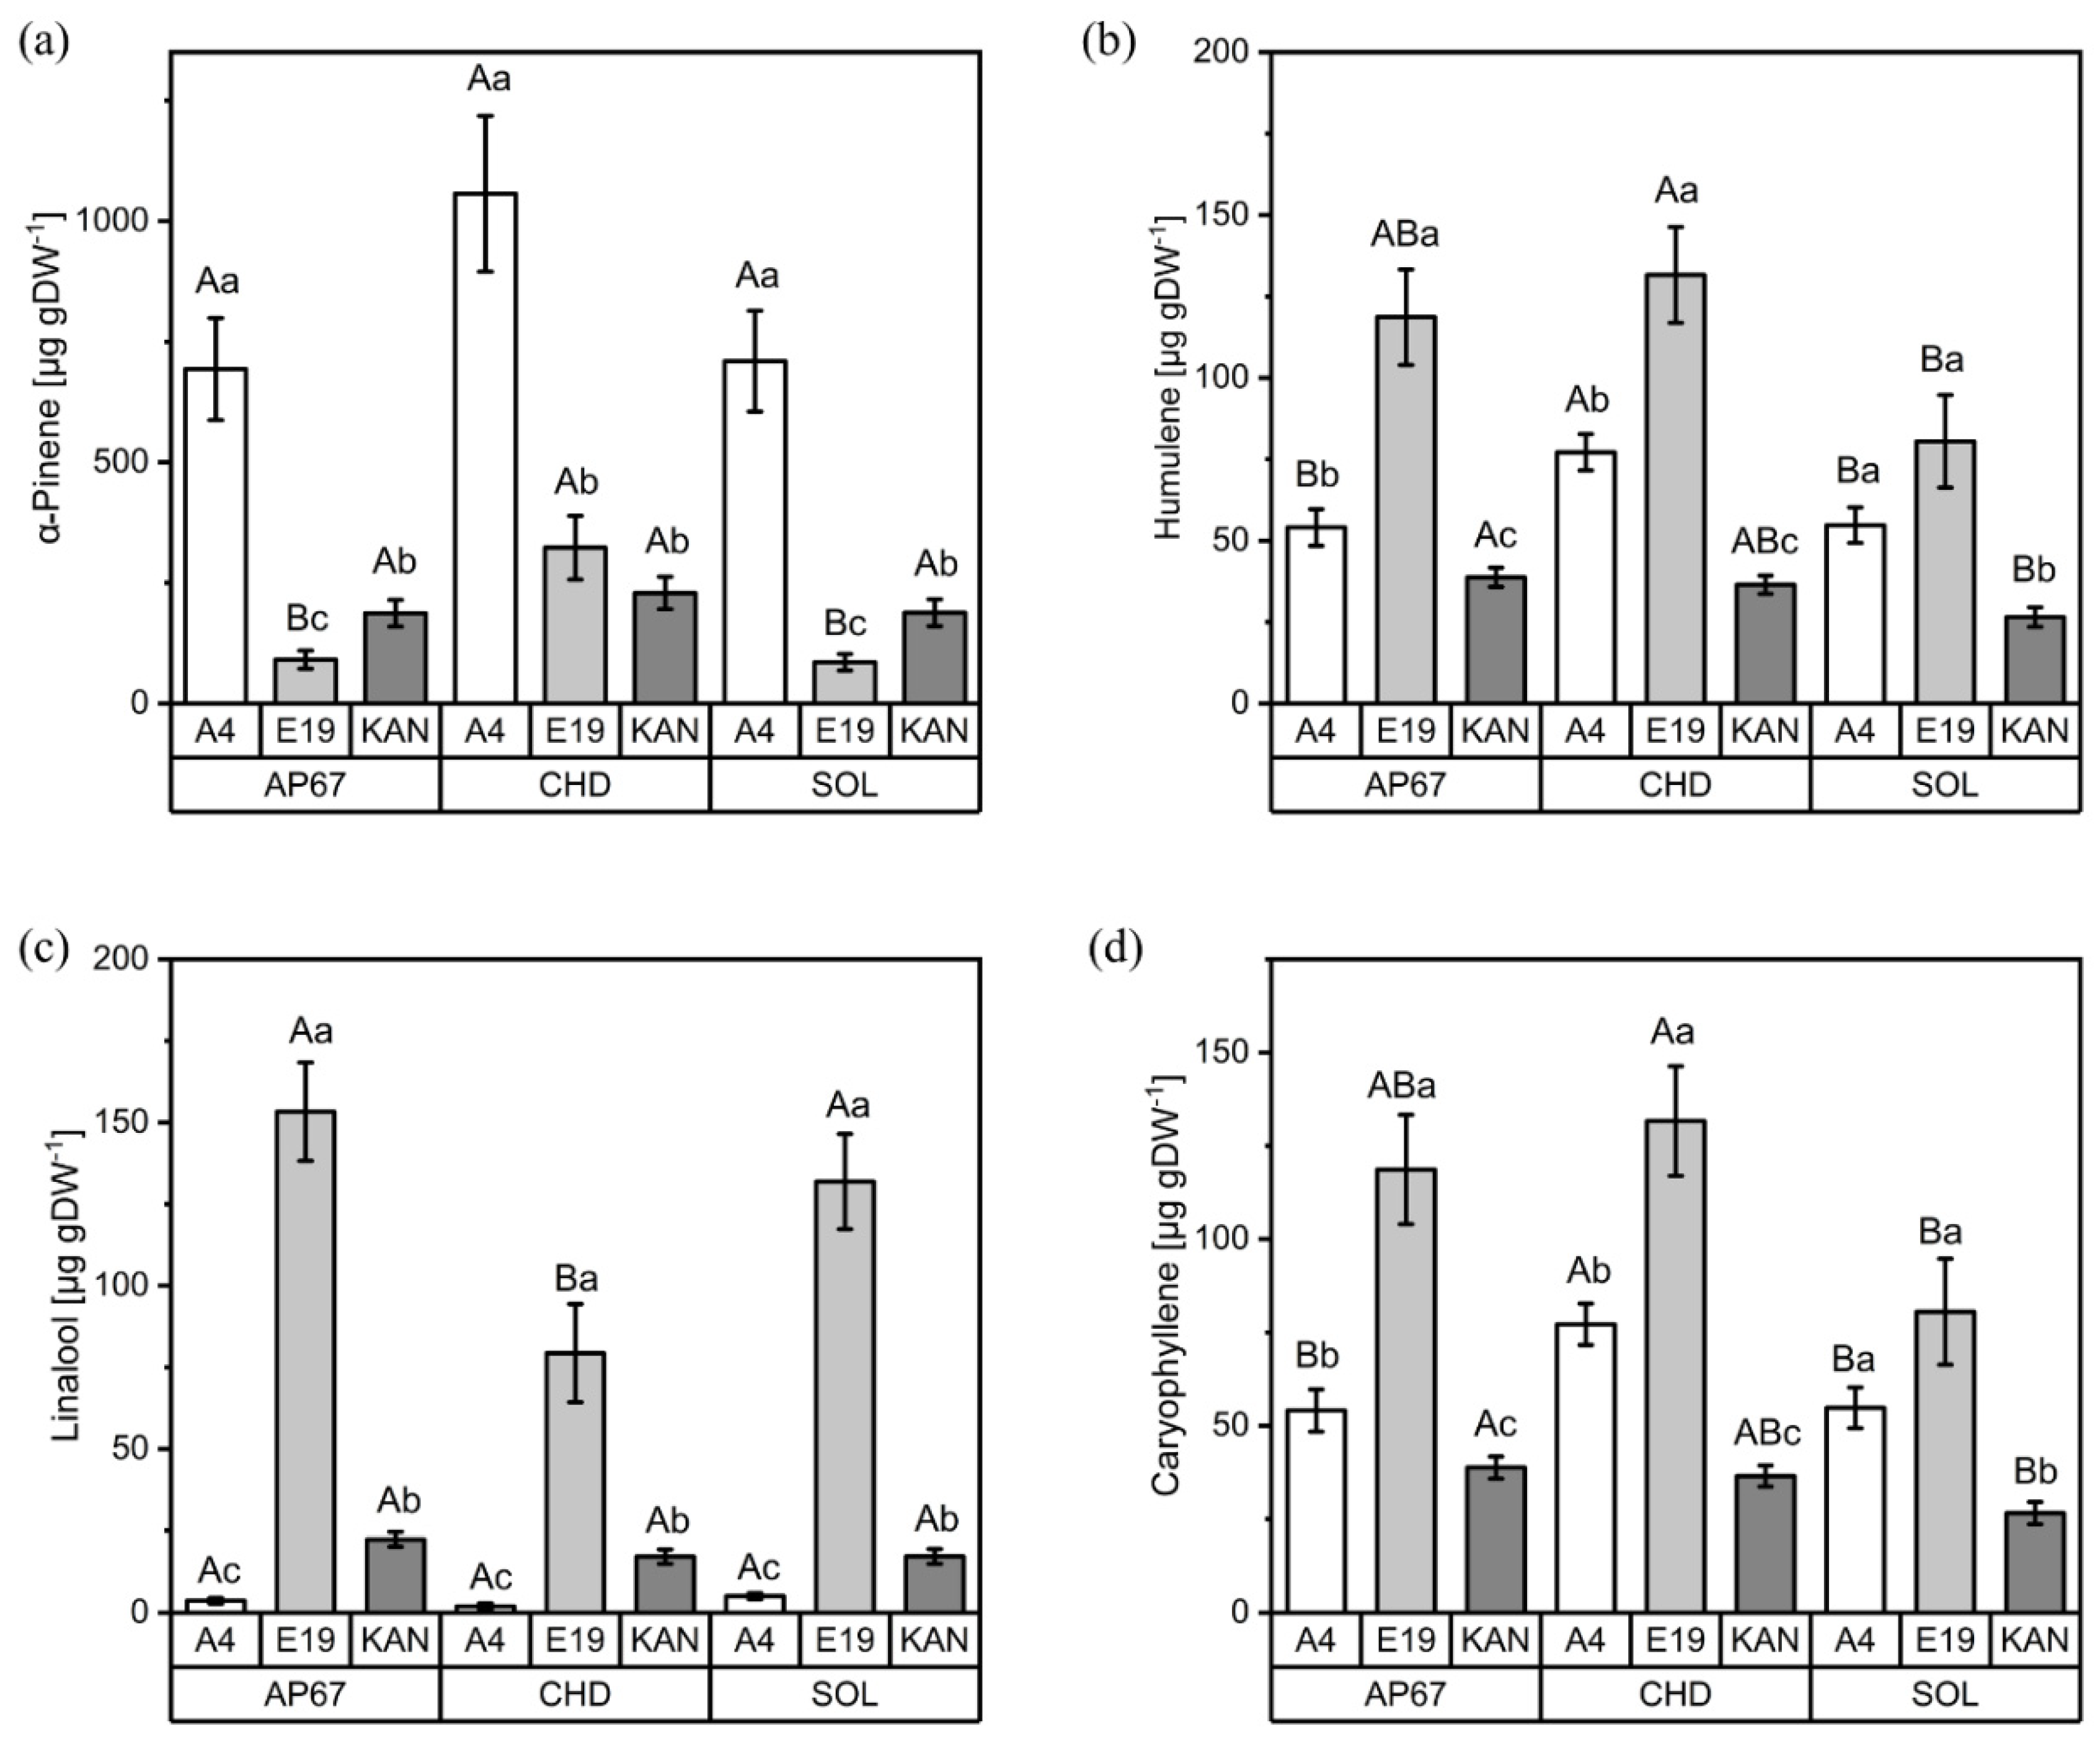
3.2.1. Interactions between Light Spectra and Strains
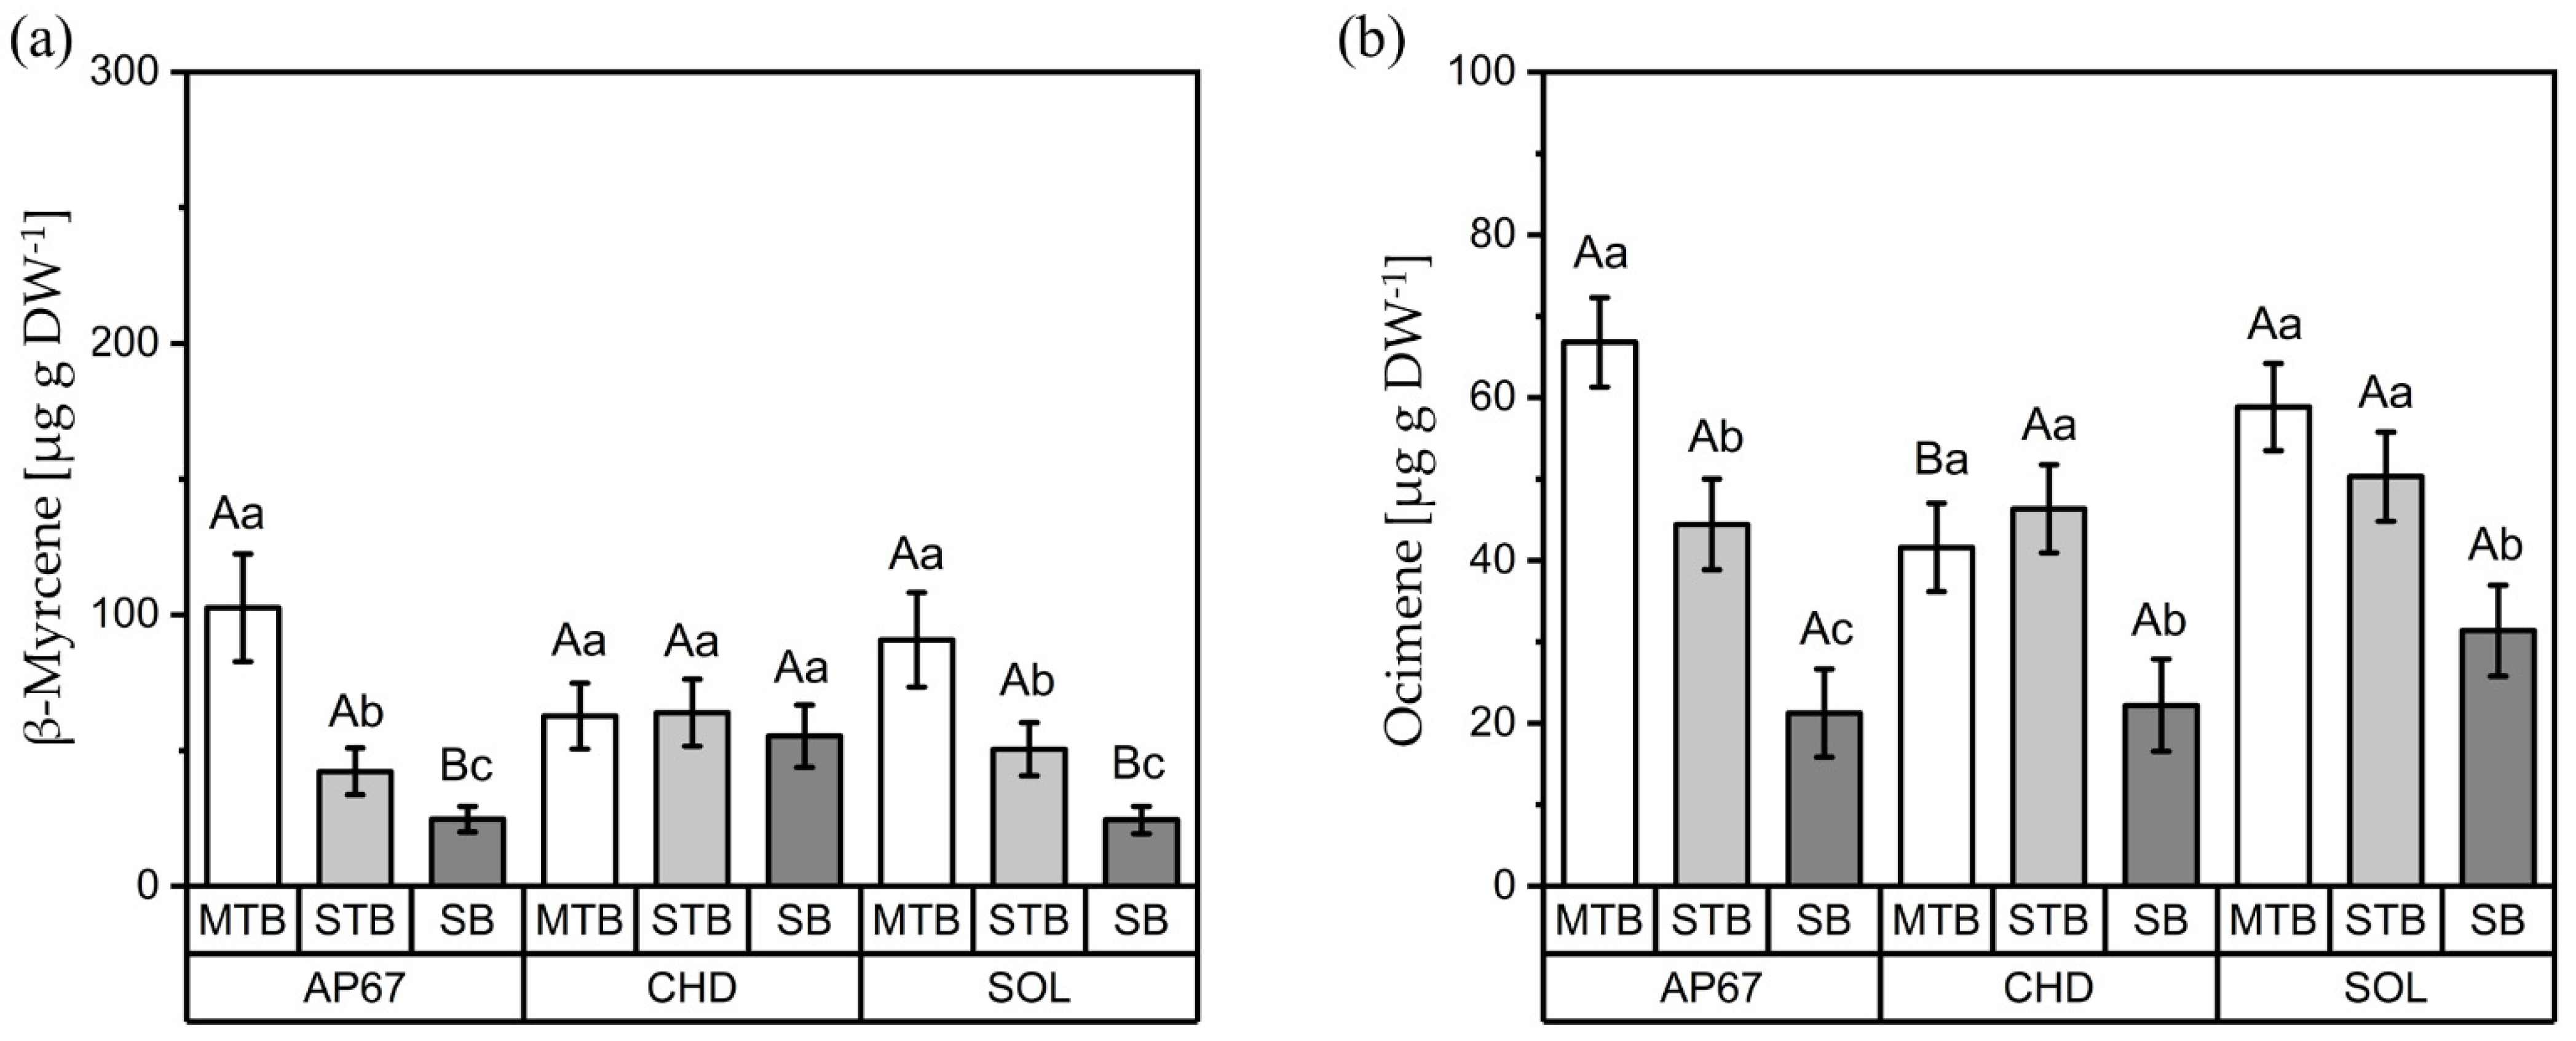
3.2.2. Interactions between Light Spectra and Flower Positions
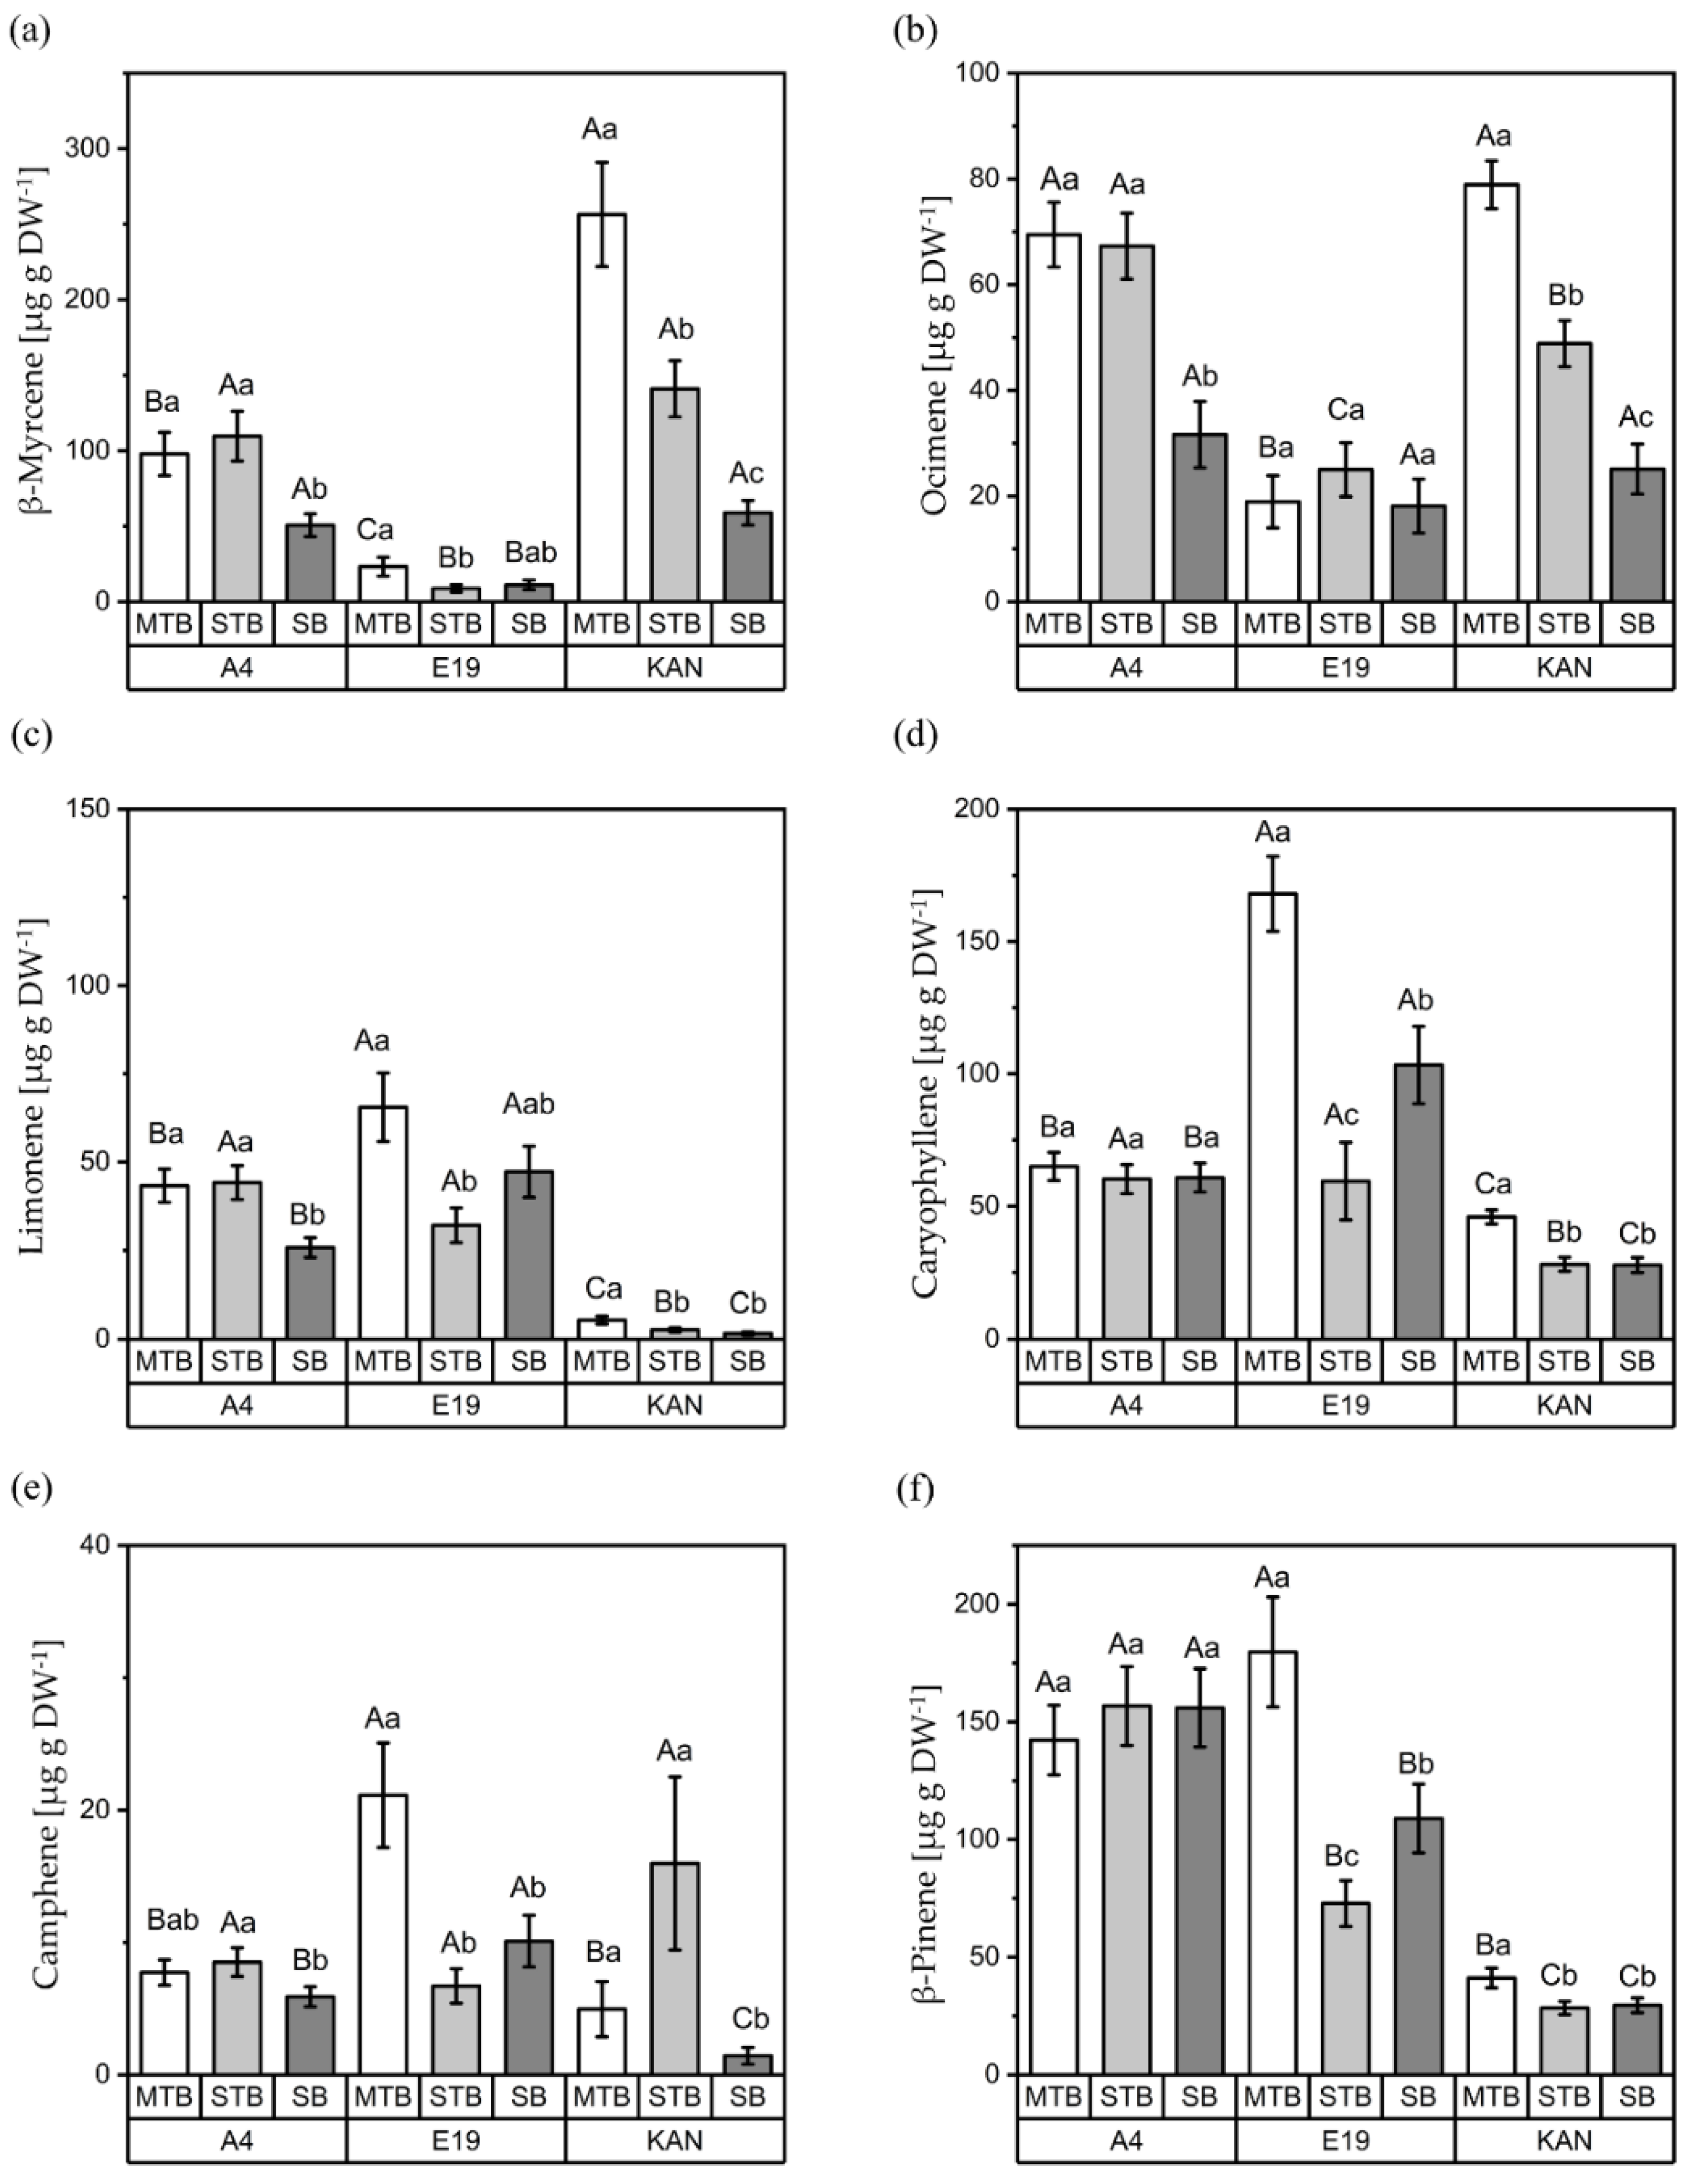
3.2.3. Interactions between Strains and Flower Positions
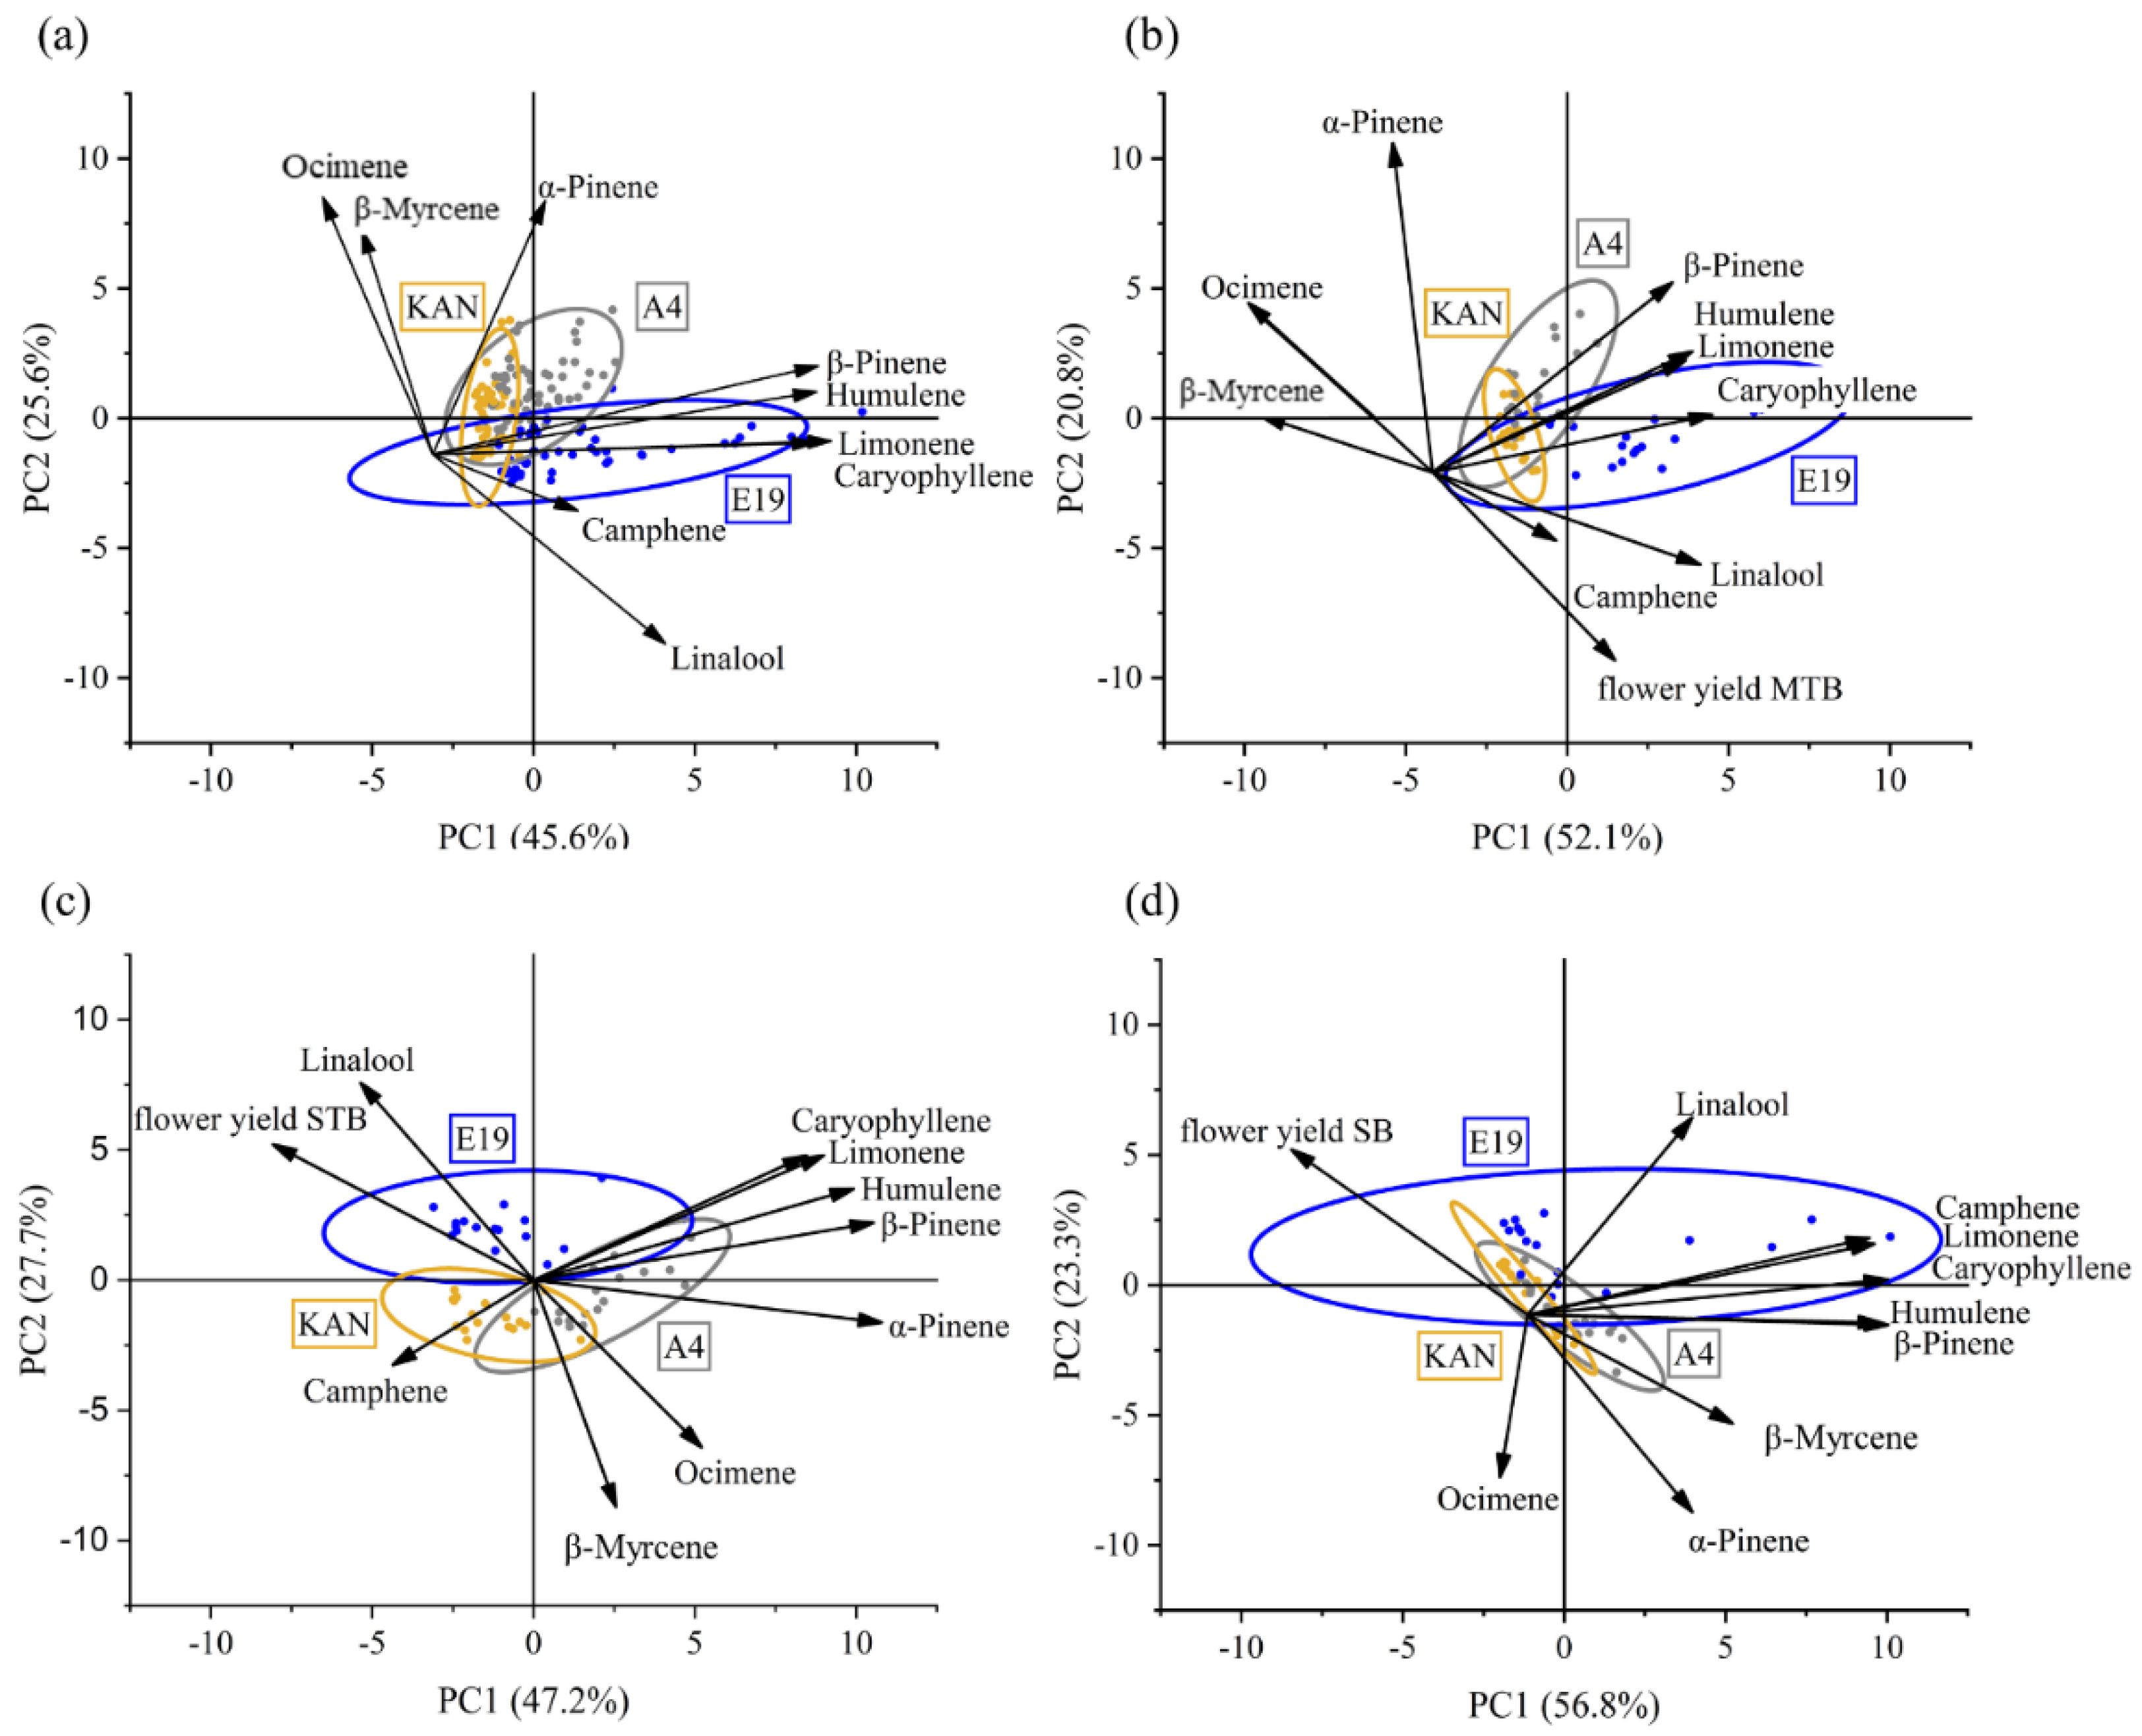
3.2.4. Principal Component Analysis
4. Discussion
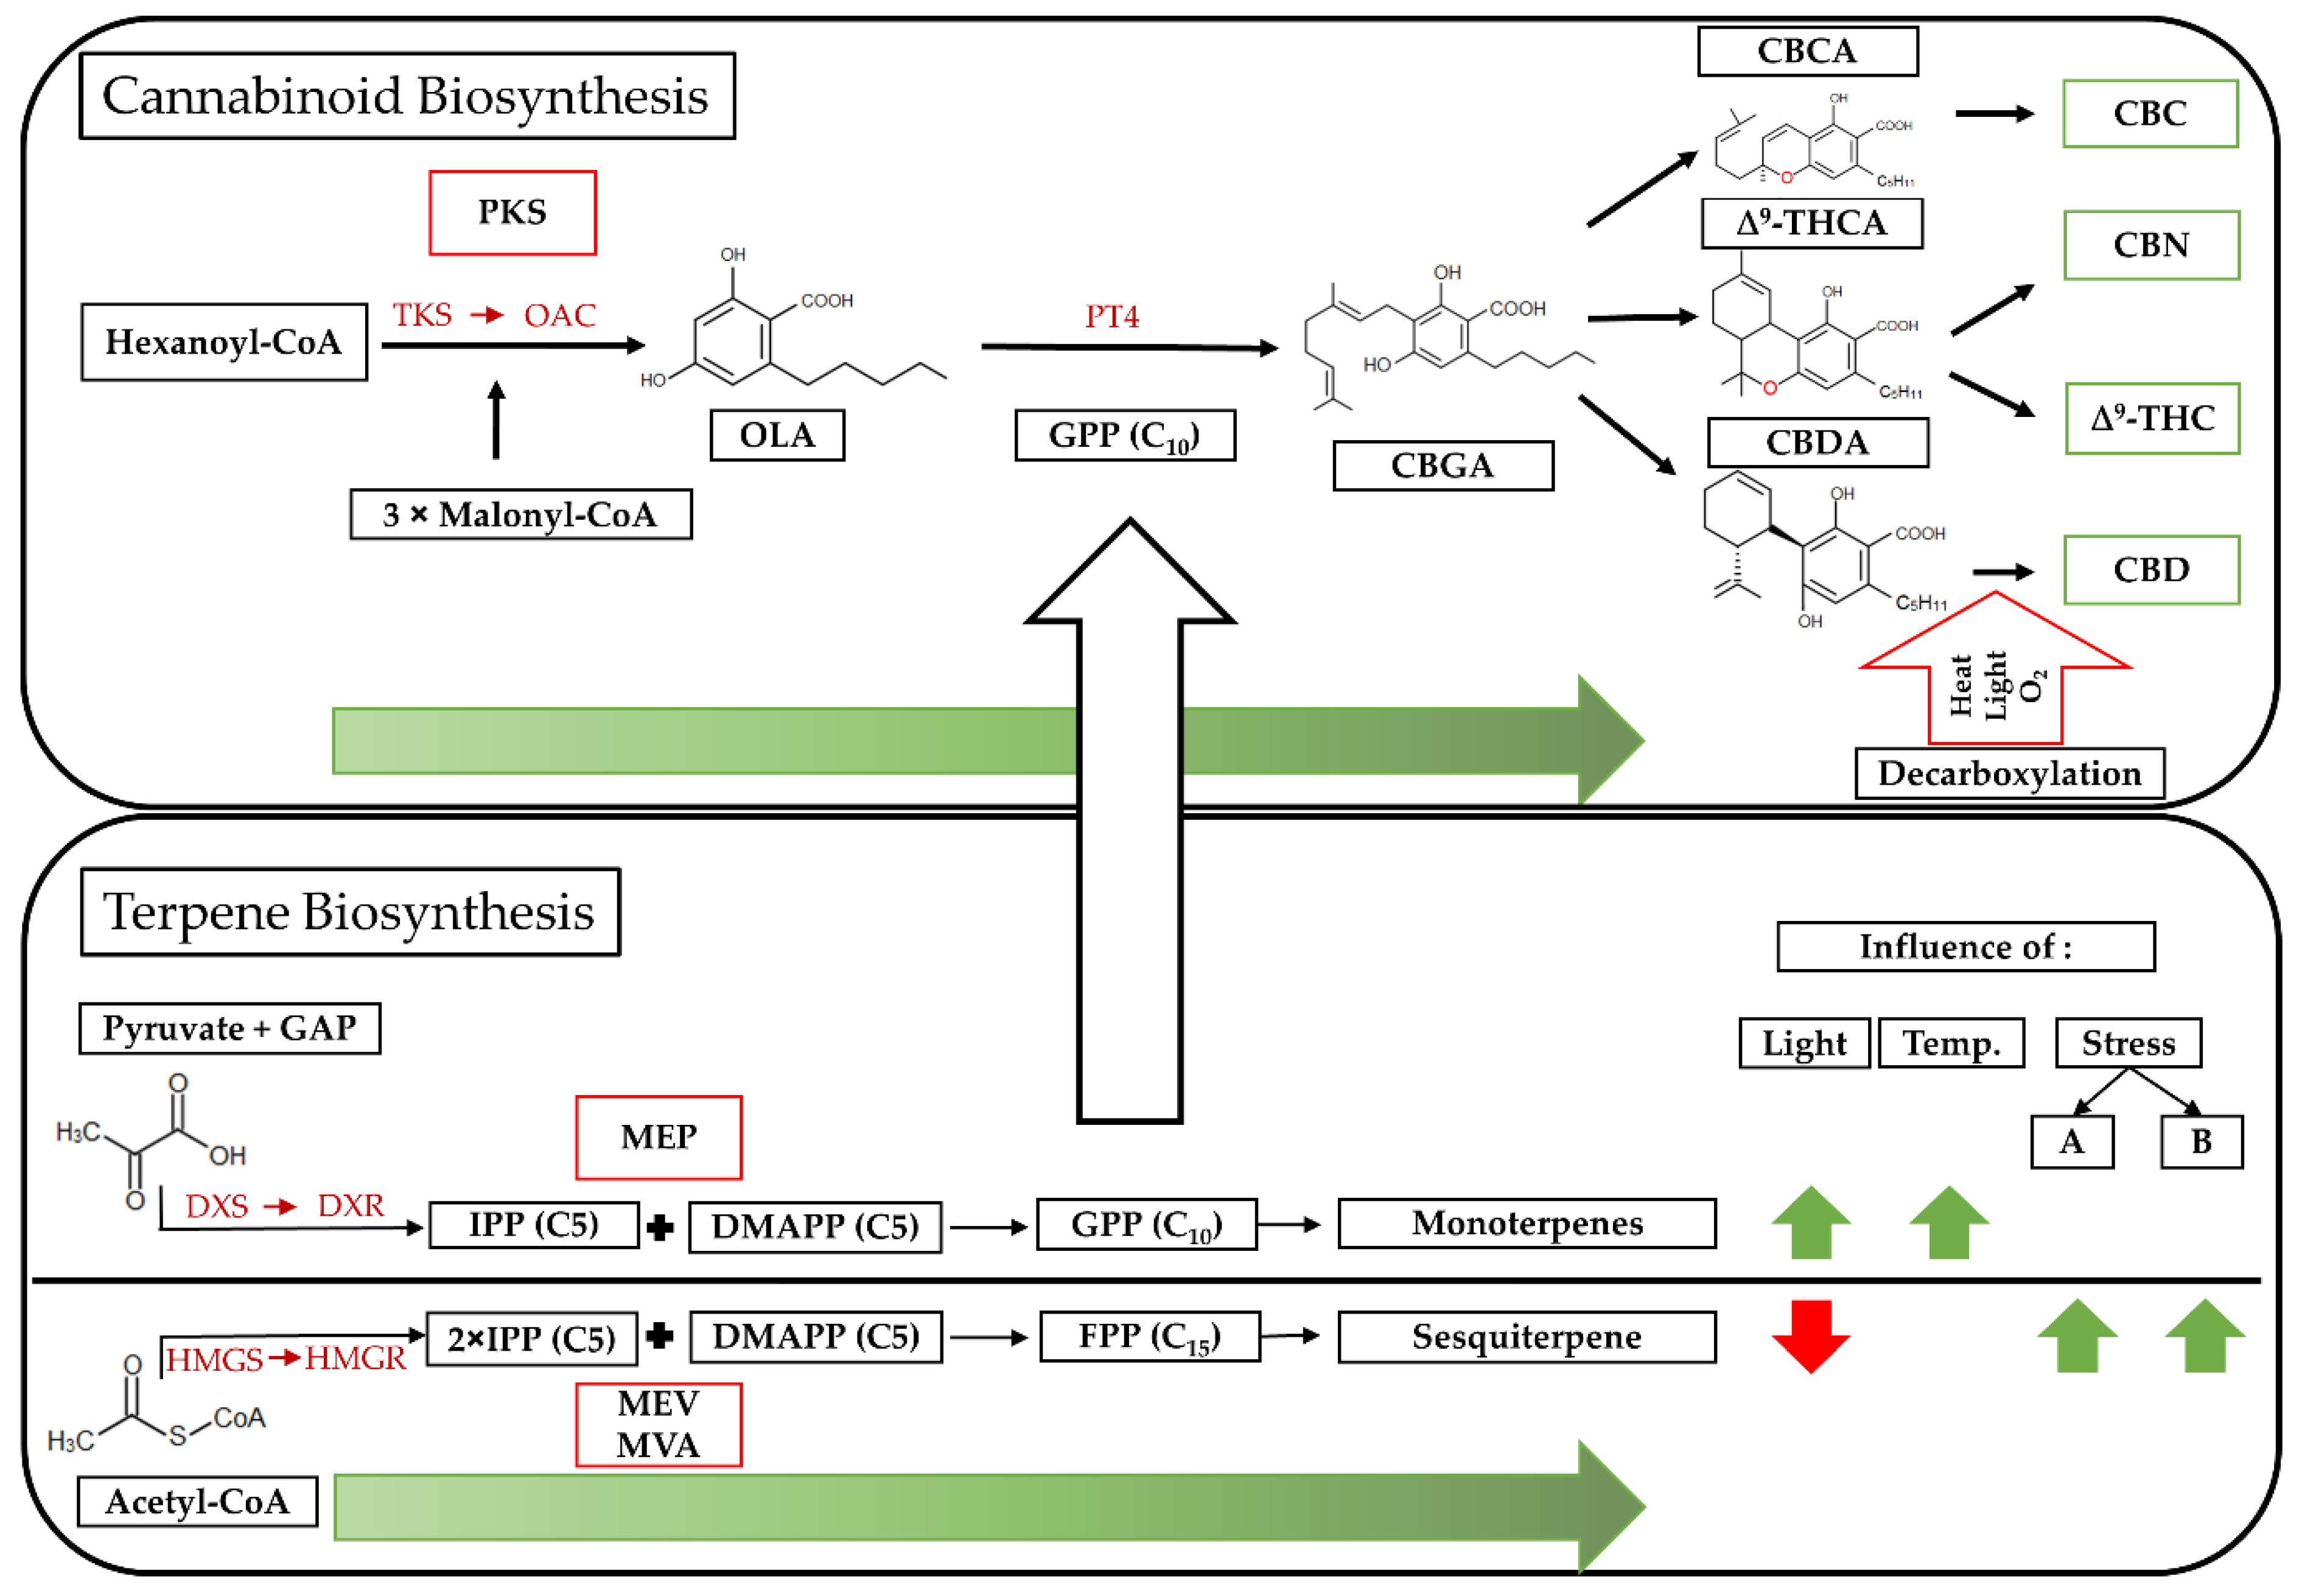
4.1. Secondary Metabolism in Cannabis sativa L.
4.2. Cannabis Strains and Flowers Positions
4.3. Light Affecting Yield
4.4. Yield Affecting CBDA and Terpene Concentration
4.5. Cannabinoids and Monoterpenes Modulated by R:FR Ratio
4.6. Light Research on Cannabis sativa L.
5. Conclusions
Author Contributions
Funding
Data Availability Statement
Acknowledgments
Conflicts of Interest
References
- Aliferis, K.A.; Bernard-Perron, D. Cannabinomics: Application of Metabolomics in Cannabis (Cannabis sativa L.) Research and Development. Front. Plant Sci. 2020, 11, 554. [Google Scholar] [CrossRef] [PubMed]
- Booth, J.K.; Bohlmann, J. Terpenes in Cannabis sativa—From plant genome to humans. Plant Sci. 2019, 284, 67–72. [Google Scholar] [CrossRef] [PubMed]
- Booth, J.K.; Yuen, M.M.S.; Jancsik, S.; Madilao, L.L.; Page, J.E.; Bohlmann, J. Terpene Synthases and Terpene Variation in Cannabis sativa. Plant Physiol. 2020, 184, 130–147. [Google Scholar] [CrossRef] [PubMed]
- Zager, J.J.; Lange, I.; Srividya, N.; Smith, A.; Lange, B.M. Gene Networks Underlying Cannabinoid and Terpenoid Accumulation in Cannabis. Plant Physiol. 2019, 180, 1877–1897. [Google Scholar] [CrossRef] [PubMed]
- Rodriguez-Morrison, V.; Llewellyn, D.; Zheng, Y. Cannabis Yield, Potency, and Leaf Photosynthesis Respond Differently to Increasing Light Levels in an Indoor Environment. Front. Plant Sci. 2021, 12, 646020. [Google Scholar] [CrossRef]
- Saloner, A.; Bernstein, N. Nitrogen supply affects cannabinoid and terpenoid profile in medical cannabis (Cannabis sativa L.). Ind. Crop. Prod. 2021, 167, 113516. [Google Scholar] [CrossRef]
- Saloner, A.; Bernstein, N. Response of Medical Cannabis (Cannabis sativa L.) to Nitrogen Supply Under Long Photoperiod. Front. Plant Sci. 2020, 11, 572293. [Google Scholar] [CrossRef]
- Danziger, N.; Bernstein, N. Plant architecture manipulation increases cannabinoid standardization in ‘drug-type’ medical cannabis. Ind. Crop. Prod. 2021, 167, 113528. [Google Scholar] [CrossRef]
- Crispim Massuela, D.; Hartung, J.; Munz, S.; Erpenbach, F.; Graeff-Hönninger, S. Impact of Harvest Time and Pruning Technique on Total CBD Concentration and Yield of Medicinal Cannabis. Plants 2022, 11, 140. [Google Scholar] [CrossRef]
- Gagne, S.J.; Stout, J.M.; Liu, E.; Boubakir, Z.; Clark, S.M.; Page, J.E. Identification of olivetolic acid cyclase from Cannabis sativa reveals a unique catalytic route to plant polyketides. Proc. Natl. Acad. Sci. USA 2012, 109, 12811–12816. [Google Scholar] [CrossRef]
- Jin, D.; Dai, K.; Xie, Z.; Chen, J. Secondary Metabolites Profiled in Cannabis Inflorescences, Leaves, Stem Barks, and Roots for Medicinal Purposes. Sci. Rep. 2020, 10, 3309. [Google Scholar] [CrossRef] [PubMed]
- Booth, J.K.; Page, J.E.; Bohlmann, J. Terpene synthases from Cannabis sativa. PLoS ONE 2017, 12, e0173911. [Google Scholar] [CrossRef] [PubMed]
- Bouvier, F.; Rahier, A.; Camara, B. Biogenesis, molecular regulation and function of plant isoprenoids. Prog. Lipid Res. 2005, 44, 357–429. [Google Scholar] [CrossRef] [PubMed]
- Andre, C.M.; Hausman, J.-F.; Guerriero, G. Cannabis sativa: The Plant of the Thousand and One Molecules. Front. Plant Sci. 2016, 7, 19. [Google Scholar] [CrossRef] [PubMed]
- Flores-Sanchez, I.J.; Verpoorte, R. Secondary metabolism in cannabis. Phytochem. Rev. 2008, 7, 615–639. [Google Scholar] [CrossRef]
- Fellermeier, M.; Zenk, M.H. Prenylation of olivetolate by a hemp transferase yields cannabigerolic acid, the precursor of tetrahydrocannabinol. FEBS Lett. 1998, 427, 283–285. [Google Scholar] [CrossRef]
- Luo, X.; Reiter, M.A.; d’Espaux, L.; Wong, J.; Denby, C.M.; Lechner, A.; Zhang, Y.; Grzybowski, A.T.; Harth, S.; Lin, W.; et al. Complete biosynthesis of cannabinoids and their unnatural analogues in yeast. Nature 2019, 567, 123–126. [Google Scholar] [CrossRef]
- Vranová, E.; Coman, D.; Gruissem, W. Network analysis of the MVA and MEP pathways for isoprenoid synthesis. Annu. Rev. Plant Biol. 2013, 64, 665–700. [Google Scholar] [CrossRef]
- Ghassemian, M.; Lutes, J.; Tepperman, J.M.; Chang, H.-S.; Zhu, T.; Wang, X.; Quail, P.H.; Lange, B.M. Integrative analysis of transcript and metabolite profiling data sets to evaluate the regulation of biochemical pathways during photomorphogenesis. Arch. Biochem. Biophys. 2006, 448, 45–59. [Google Scholar] [CrossRef]
- Soto, G.; Stritzler, M.; Lisi, C.; Alleva, K.; Pagano, M.E.; Ardila, F.; Mozzicafreddo, M.; Cuccioloni, M.; Angeletti, M.; Ayub, N.D. Acetoacetyl-CoA thiolase regulates the mevalonate pathway during abiotic stress adaptation. J. Exp. Bot. 2011, 62, 5699–5711. [Google Scholar] [CrossRef]
- Rodriguez-Concepcion; Gruissem. Arachidonic acid alters tomato HMG expression and fruit growth and induces 3-hydroxy-3-methylglutaryl coenzyme A reductase-independent lycopene accumulation. Plant Physiol. 1999, 119, 41–48. [Google Scholar] [CrossRef] [PubMed][Green Version]
- Mongélard, G.; Seemann, M.; Boisson, A.-M.; Rohmer, M.; Bligny, R.; Rivasseau, C. Measurement of carbon flux through the MEP pathway for isoprenoid synthesis by (31)P-NMR spectroscopy after specific inhibition of 2-C-methyl-d-erythritol 2,4-cyclodiphosphate reductase. Effect of light and temperature. Plant Cell Environ. 2011, 34, 1241–1247. [Google Scholar] [CrossRef] [PubMed]
- Srinath, M.; Shailaja, A.; Bindu, B.B.V.; Giri, C.C. Comparative analysis of biomass, ethrel elicitation, light induced differential MVA/MEP pathway gene expression and andrographolide production in adventitious root cultures of Andrographis paniculata (Burm. F.) Nees. Plant Cell Tissue Organ Cult. 2022, 149, 335–349. [Google Scholar] [CrossRef]
- Desaulniers Brousseau, V.; Wu, B.-S.; MacPherson, S.; Morello, V.; Lefsrud, M. Cannabinoids and Terpenes: How Production of Photo-Protectants Can Be Manipulated to Enhance Cannabis sativa L. Phytochemistry. Front. Plant Sci. 2021, 12, 620021. [Google Scholar] [CrossRef] [PubMed]
- Tholl, D. Biosynthesis and biological functions of terpenoids in plants. Adv. Biochem. Eng. Biotechnol. 2015, 148, 63–106. [Google Scholar] [CrossRef]
- Chen, F.; Tholl, D.; Bohlmann, J.; Pichersky, E. The family of terpene synthases in plants: A mid-size family of genes for specialized metabolism that is highly diversified throughout the kingdom. Plant J. 2011, 66, 212–229. [Google Scholar] [CrossRef]
- Karunanithi, P.S.; Zerbe, P. Terpene Synthases as Metabolic Gatekeepers in the Evolution of Plant Terpenoid Chemical Diversity. Front. Plant Sci. 2019, 10, 1166. [Google Scholar] [CrossRef]
- Michael, R.; Ranjan, A.; Kumar, R.S.; Pathak, P.K.; Trivedi, P.K. Light-regulated expression of terpene synthase gene, AtTPS03, is controlled by the bZIP transcription factor, HY5, in Arabidopsis thaliana. Biochem. Biophys. Res. Commun. 2020, 529, 437–443. [Google Scholar] [CrossRef]
- Kawoosa, T.; Singh, H.; Kumar, A.; Sharma, S.K.; Devi, K.; Dutt, S.; Vats, S.K.; Sharma, M.; Ahuja, P.S.; Kumar, S. Light and temperature regulated terpene biosynthesis: Hepatoprotective monoterpene picroside accumulation in Picrorhiza kurrooa. Funct Integr. Genom. 2010, 10, 393–404. [Google Scholar] [CrossRef]
- Klepzig, K.D.; Kruger, E.L.; Smalley, E.B.; Raffa, K.F. Effects of biotic and abiotic stress on induced accumulation of terpenes and phenolics in red pines inoculated with bark beetle-vectored fungus. J. Chem. Ecol. 1995, 21, 601–626. [Google Scholar] [CrossRef]
- Aizpurua-Olaizola, O.; Soydaner, U.; Öztürk, E.; Schibano, D.; Simsir, Y.; Navarro, P.; Etxebarria, N.; Usobiaga, A. Evolution of the Cannabinoid and Terpene Content during the Growth of Cannabis sativa Plants from Different Chemotypes. J. Nat. Prod. 2016, 79, 324–331. [Google Scholar] [CrossRef] [PubMed]
- Knudsen, J.T.; Eriksson, R.; Gershenzon, J.; Ståhl, B. Diversity and Distribution of Floral Scent. Bot. Rev. 2006, 72, 1. [Google Scholar] [CrossRef]
- Figueiredo, A.C.; Barroso, J.G.; Pedro, L.G.; Scheffer, J.J.C. Factors affecting secondary metabolite production in plants: Volatile components and essential oils. Flavour Fragr. J. 2008, 23, 213–226. [Google Scholar] [CrossRef]
- Kleine, S.; Müller, C. Intraspecific plant chemical diversity and its relation to herbivory. Oecologia 2011, 166, 175–186. [Google Scholar] [CrossRef] [PubMed]
- Casal, J.J. Photoreceptor Signaling Networks in Plant Responses to Shade. Annu. Rev. Plant Biol. 2013, 64, 403–427. [Google Scholar] [CrossRef] [PubMed]
- Reichel, P.; Munz, S.; Hartung, J.; Präger, A.; Kotiranta, S.; Burgel, L.; Schober, T.; Graeff-Hönninger, S. Impact of Three Different Light Spectra on the Yield, Morphology and Growth Trajectory of Three Different Cannabis sativa L. Strains. Plants 2021, 10, 1866. [Google Scholar] [CrossRef] [PubMed]
- Eichhorn Bilodeau, S.; Wu, B.-S.; Rufyikiri, A.-S.; MacPherson, S.; Lefsrud, M. An Update on Plant Photobiology and Implications for Cannabis Production. Front. Plant Sci. 2019, 10, 296. [Google Scholar] [CrossRef]
- McCree, K.J. The action spectrum, absorptance and quantum yield of photosynthesis in crop plants. Agric. Meteorol. 1971, 9, 191–216. [Google Scholar] [CrossRef]
- Magagnini, G.; Grassi, G.; Kotiranta, S. The Effect of Light Spectrum on the Morphology and Cannabinoid Content of Cannabis sativa L. Med. Cannabis Cannaboids 2018, 1, 19–27. [Google Scholar] [CrossRef]
- Westmoreland, F.M.; Kusuma, P.; Bugbee, B. Cannabis lighting: Decreasing blue photon fraction increases yield but efficacy is more important for cost effective production of cannabinoids. PLoS ONE 2021, 16, e0248988. [Google Scholar] [CrossRef]
- Hawley, D.; Graham, T.; Stasiak, M.; Dixon, M. Improving Cannabis Bud Quality and Yield with Subcanopy Lighting. HortScience 2018, 53, 1593–1599. [Google Scholar] [CrossRef]
- Namdar, D.; Charuvi, D.; Ajjampura, V.; Mazuz, M.; Ion, A.; Kamara, I.; Koltai, H. LED lighting affects the composition and biological activity of Cannabis sativa secondary metabolites. Ind. Crops Prod. 2019, 132, 177–185. [Google Scholar] [CrossRef]
- Shinomura, T.; Uchida, K.; Furuya, M. Elementary processes of photoperception by phytochrome A for high-irradiance response of hypocotyl elongation in Arabidopsis. Plant Physiol. 2000, 122, 147–156. [Google Scholar] [CrossRef]
- Mathews, S. Phytochrome-mediated development in land plants: Red light sensing evolves to meet the challenges of changing light environments. Mol. Ecol. 2006, 15, 3483–3503. [Google Scholar] [CrossRef] [PubMed]
- Endo, M.; Tanigawa, Y.; Murakami, T.; Araki, T.; Nagatani, A. PHYTOCHROME-DEPENDENT LATE-FLOWERING accelerates flowering through physical interactions with phytochrome B and CONSTANS. Proc. Natl. Acad. Sci. USA 2013, 110, 18017–18022. [Google Scholar] [CrossRef]
- Llorente, B.; D’Andrea, L.; Ruiz-Sola, M.A.; Botterweg, E.; Pulido, P.; Andilla, J.; Loza-Alvarez, P.; Rodriguez-Concepcion, M. Tomato fruit carotenoid biosynthesis is adjusted to actual ripening progression by a light-dependent mechanism. Plant J. 2016, 85, 107–119. [Google Scholar] [CrossRef]
- Chenge-Espinosa, M.; Cordoba, E.; Romero-Guido, C.; Toledo-Ortiz, G.; León, P. Shedding light on the methylerythritol phosphate (MEP)-pathway: Long hypocotyl 5 (HY5)/phytochrome-interacting factors (PIFs) transcription factors modulating key limiting steps. Plant J. 2018, 96, 828–841. [Google Scholar] [CrossRef]
- Burgel, L.; Hartung, J.; Graeff-Hönninger, S. Impact of Different Growing Substrates on Growth, Yield and Cannabinoid Content of Two Cannabis sativa L. Genotypes in a Pot Culture. Horticulturae 2020, 6, 62. [Google Scholar] [CrossRef]
- Hitz, T.; Graeff-Hönninger, S.; Munz, S. Modelling of Soybean (Glycine max (L.) Merr.) Response to Blue Light Intensity in Controlled Environments. Plants 2020, 9, 1757. [Google Scholar] [CrossRef]
- Honnold, R.; Kubas, R.; Macherone, A. Analysis of Terpenes in Cannabis Using the Agilent 7697A/7890B/5977B Headspace GC-MSD System; Agilent Application Notes; Agilent Technologies, Inc.: Santa Clara, CA, USA, 2017; 10p. [Google Scholar]
- Burgel, L.; Hartung, J.; Schibano, D.; Graeff-Hönninger, S. Impact of Different Phytohormones on Morphology, Yield and Cannabinoid Content of Cannabis sativa L. Plants 2020, 9, 725. [Google Scholar] [CrossRef]
- Piepho, H.P.; Buchse, A.; Emrich, K. A Hitchhiker’s Guide to Mixed Models for Randomized Experiments. J. Agron. Crop. Sci. 2003, 189, 310–322. [Google Scholar] [CrossRef]
- Hazekamp, A.; Fischedick, J.T. Cannabis—From cultivar to chemovar. Drug Test. Anal. 2012, 4, 660–667. [Google Scholar] [CrossRef] [PubMed]
- Hazekamp, A.; Tejkalová, K.; Papadimitriou, S. Cannabis: From Cultivar to Chemovar II—A Metabolomics Approach to Cannabis Classification. Cannabis Cannabinoid Res. 2016, 1, 202–215. [Google Scholar] [CrossRef]
- Reimann-Philipp, U.; Speck, M.; Orser, C.; Johnson, S.; Hilyard, A.; Turner, H.; Stokes, A.J.; Small-Howard, A.L. Cannabis Chemovar Nomenclature Misrepresents Chemical and Genetic Diversity; Survey of Variations in Chemical Profiles and Genetic Markers in Nevada Medical Cannabis Samples. Cannabis Cannabinoid Res. 2020, 5, 215–230. [Google Scholar] [CrossRef]
- Elzinga, S.; Fischedick, J.; Podkolinski, R.; Raber, J.C. Cannabinoids and Terpenes as Chemotaxonomic Markers in Cannabis. Nat. Prod. Chem. Res. 2015, 3, 181. [Google Scholar] [CrossRef]
- Suh, J.H.; Madden, R.T.; Sung, J.; Chambers, A.H.; Crane, J.; Wang, Y. Pathway-Based Metabolomics Analysis Reveals Biosynthesis of Key Flavor Compounds in Mango. J. Agric. Food Chem. 2021, 70, 10389–10399. [Google Scholar] [CrossRef] [PubMed]
- Hawkins, C.; Ginzburg, D.; Zhao, K.; Dwyer, W.; Xue, B.; Xu, A.; Rice, S.; Cole, B.; Paley, S.; Karp, P.; et al. Plant Metabolic Network 15: A resource of genome-wide metabolism databases for 126 plants and algae. J. Integr. Plant Biol. 2021, 63, 1888–1905. [Google Scholar] [CrossRef]
- Wang, M.; Carver, J.J.; Phelan, V.V.; Sanchez, L.M.; Garg, N.; Peng, Y.; Nguyen, D.D.; Watrous, J.; Kapono, C.A.; Luzzatto-Knaan, T.; et al. Sharing and community curation of mass spectrometry data with Global Natural Products Social Molecular Networking. Nat. Biotechnol. 2016, 34, 828–837. [Google Scholar] [CrossRef]
- Rodríguez-Concepción, M.; Boronat, A. Breaking new ground in the regulation of the early steps of plant isoprenoid biosynthesis. Curr. Opin. Plant Biol. 2015, 25, 17–22. [Google Scholar] [CrossRef]
- Phillips, M.A.; León, P.; Boronat, A.; Rodríguez-Concepción, M. The plastidial MEP pathway: Unified nomenclature and resources. Trends Plant Sci. 2008, 13, 619–623. [Google Scholar] [CrossRef]
- Darko, E.; Heydarizadeh, P.; Schoefs, B.; Sabzalian, M.R. Photosynthesis under artificial light: The shift in primary and secondary metabolism. Philos. Trans. R. Soc. B Biol. Sci. 2014, 369, 20130243. [Google Scholar] [CrossRef]
- Long, S.P.; Zhu, X.-G.; Naidu, S.L.; Ort, D.R. Can improvement in photosynthesis increase crop yields? Plant Cell Environ. 2006, 29, 315–330. [Google Scholar] [CrossRef] [PubMed]
- Janacek, S.H.; Trenkamp, S.; Palmer, B.; Brown, N.J.; Parsley, K.; Stanley, S.; Astley, H.M.; Rolfe, S.A.; Paul Quick, W.; Fernie, A.R.; et al. Photosynthesis in cells around veins of the C(3) plant Arabidopsis thaliana is important for both the shikimate pathway and leaf senescence as well as contributing to plant fitness. Plant J. 2009, 59, 329–343. [Google Scholar] [CrossRef] [PubMed]
- Wei, X.; Zhao, X.; Long, S.; Xiao, Q.; Guo, Y.; Qiu, C.; Qiu, H.; Wang, Y. Wavelengths of LED light affect the growth and cannabidiol content in Cannabis sativa L. Ind. Crops Prod. 2021, 165, 113433. [Google Scholar] [CrossRef]
- Islam, M.J.; Ryu, B.R.; Azad, M.O.K.; Rahman, M.H.; Cheong, E.J.; Lim, J.-D.; Lim, Y.-S. Cannabinoids Accumulation in Hemp (Cannabis sativa L.) Plants under LED Light Spectra and Their Discrete Role as a Stress Marker. Biology 2021, 10, 710. [Google Scholar] [CrossRef] [PubMed]
- Danziger, N.; Bernstein, N. Light matters: Effect of light spectra on cannabinoid profile and plant development of medical cannabis (Cannabis sativa L.). Ind. Crops Prod. 2021, 164, 113351. [Google Scholar] [CrossRef]


| Trait | Light Spectra | PPFD | PFD_Red (µmol m−2 s−1) | PFD_Far-Red | Photosynthetic Rate (µmol CO2 m−2 s−1) |
|---|---|---|---|---|---|
| A light spectra | AP67 | 400 | 250 | 70 | 10.23 ± 0.33 a |
| CHD | 400 | 179 | 82 | 10.44 ± 0.33 a | |
| SOL | 400 | 181 | 20 | 7.37 ± 0.33 b | |
| A R:FR | R | 400 | 400 | 0 | 7.44 ± 0.09 b |
| R:FR 2.8 | 400 | 400 | 140 | 8.22 ± 0.09 a | |
| R:FR 4 | 400 | 400 | 100 | 8.37 ± 0.09 a | |
| R:FR 13.5 | 400 | 400 | 30 | 7.64 ± 0.09 b | |
| p-values, light spectra | |||||
| 0.0049 | |||||
| p-values, R:FR | |||||
| 0.0011 | |||||
Publisher’s Note: MDPI stays neutral with regard to jurisdictional claims in published maps and institutional affiliations. |
© 2022 by the authors. Licensee MDPI, Basel, Switzerland. This article is an open access article distributed under the terms and conditions of the Creative Commons Attribution (CC BY) license (https://creativecommons.org/licenses/by/4.0/).
Share and Cite
Reichel, P.; Munz, S.; Hartung, J.; Kotiranta, S.; Graeff-Hönninger, S. Impacts of Different Light Spectra on CBD, CBDA and Terpene Concentrations in Relation to the Flower Positions of Different Cannabis Sativa L. Strains. Plants 2022, 11, 2695. https://doi.org/10.3390/plants11202695
Reichel P, Munz S, Hartung J, Kotiranta S, Graeff-Hönninger S. Impacts of Different Light Spectra on CBD, CBDA and Terpene Concentrations in Relation to the Flower Positions of Different Cannabis Sativa L. Strains. Plants. 2022; 11(20):2695. https://doi.org/10.3390/plants11202695
Chicago/Turabian StyleReichel, Philipp, Sebastian Munz, Jens Hartung, Stiina Kotiranta, and Simone Graeff-Hönninger. 2022. "Impacts of Different Light Spectra on CBD, CBDA and Terpene Concentrations in Relation to the Flower Positions of Different Cannabis Sativa L. Strains" Plants 11, no. 20: 2695. https://doi.org/10.3390/plants11202695
APA StyleReichel, P., Munz, S., Hartung, J., Kotiranta, S., & Graeff-Hönninger, S. (2022). Impacts of Different Light Spectra on CBD, CBDA and Terpene Concentrations in Relation to the Flower Positions of Different Cannabis Sativa L. Strains. Plants, 11(20), 2695. https://doi.org/10.3390/plants11202695