Article

Genome-Wide Analysis of Multiple Organellar RNA Editing Factor (MORF) Family in Kiwifruit (Actinidia chinensis) Reveals Its Roles in Chloroplast RNA Editing and Pathogens Stress

1
Key Laboratory of Plant Germplasm Enhancement and Specialty Agriculture, Wuhan Botanical Garden, Chinese Academy of Sciences, Wuhan 430074, China
2
Center of Economic Botany, Core Botanical Gardens, Chinese Academy of Sciences, Wuhan 430074, China
3
Wuhan Botanical Garden, University of Chinese Academy of Sciences, Beijing 100049, China
*
Authors to whom correspondence should be addressed.
Plants 2022, 11(2), 146; https://doi.org/10.3390/plants11020146
Submission received: 25 November 2021 / Revised: 31 December 2021 / Accepted: 4 January 2022 / Published: 6 January 2022
(This article belongs to the Special Issue Plant Molecular Cytogenetics)

Abstract

:
Kiwifruit (Actinidia chinensis) is well known for its high vitamin C content and good taste. Various diseases, especially bacterial canker, are a serious threat to the yield of kiwifruit. Multiple organellar RNA editing factor (MORF) genes are pivotal factors in the RNA editosome that mediates Cytosine-to-Uracil RNA editing, and they are also indispensable for the regulation of chloroplast development, plant growth, and response to stresses. Although the kiwifruit genome has been released, little is known about MORF genes in kiwifruit at the genome-wide level, especially those involved in the response to pathogens stress. In this study, we identified ten MORF genes in the kiwifruit genome. The genomic structures and chromosomal locations analysis indicated that all the MORF genes consisted of three conserved motifs, and they were distributed widely across the seven linkage groups and one contig of the kiwifruit genome. Based on the structural features of MORF proteins and the topology of the phylogenetic tree, the kiwifruit MORF gene family members were classified into six groups (Groups A–F). A synteny analysis indicated that two pairs of MORF genes were tandemly duplicated and five pairs of MORF genes were segmentally duplicated. Moreover, based on analysis of RNA-seq data from five tissues of kiwifruit, we found that both expressions of MORF genes and chloroplast RNA editing exhibited tissue-specific patterns. MORF2 and MORF9 were highly expressed in leaf and shoot, and may be responsible for chloroplast RNA editing, especially the ndhB genes. We also observed different MORF expression and chloroplast RNA editing profiles between resistant and susceptible kiwifruits after pathogen infection, indicating the roles of MORF genes in stress response by modulating the editing extend of mRNA. These results provide a solid foundation for further analyses of the functions and molecular evolution of MORF genes, in particular, for clarifying the resistance mechanisms in kiwifruits and breeding new cultivars with high resistance.

1. Introduction

Kiwifruit (Actinidia chinensis) is a perennial horticultural crop species, and has a relatively median genome [1]. Its richness in vitamin C, minerals, dietary fiber, and other nutrients provide health benefits, thus giving the fruit an enormous nutritional and economic value [2]. However, biotic and abiotic stresses can limit its growth. In particular, pathogen infection can drastically repress stomata and reduce the host photosynthetic activity [3]. From 2010 to 2012, 37% of orchards in New Zealand were infected by bacterial canker [4]. Pathogen stress is destructive and economically damaging for kiwifruit; thus, it is of great significance to study the stress resistance mechanism of kiwifruit.
RNA editing is a type of post-transcriptional modification that is mainly manifested as nucleotide insertion/deletion or conversion [3]. RNA editing occurs mainly in chloroplast and mitochondria of flowering plants, and converts 400–500 and 30–40 C-to-U (Cytosine-to-Uracil) editings in transcripts of mitochondria and chloroplasts, respectively [5]. There are a few U-to-C and A-to-I (Adenosine-to-Inosine) editings [6]. RNA editing plays an indispensable role in plant growth and development, including organelle biogenesis, adaptation to environmental changes, and signal transduction [7,8,9,10]. In our previous study, we found that the RNA editing events in grapes were reduced in response to heat stress [9].
RNA editing in the plant is mainly mediated by editing complexes involving multiple editing factors, including organelle RNA recognition motif-containing protein (ORRM), protoporphyrinogen IX oxidase (PPO), pentatricopeptide repeat (PPR), organelle zinc finger (OZ), and RNA editing factor interacting protein (RIP)/multiple organellar RNA editing factors (MORF) [7,11,12,13,14]. PPR proteins directly interact with mRNA to determine the specificity of RNA editing, and a PPR protein specifically recognizes one or several editing sites [15]. Approximately 200 PPR proteins are involved in RNA editing in chloroplast and mitochondria in A. thaliana [15]. The MORFs interact with the PPR proteins and participate in RNA editing of C-to-U conversion; PPR proteins recognize cytidine targets around the editing sites; and MORF proteins modulate the RNA-binding activity of the PPR proteins. Components of the RNA editosome mutants usually display various developmental defects. The loss of a MORF protein will abolish or lower editing at multiple sites. Previous studies found that disruption of MORF1, MORF3, and MORF8 genes reduced 19%, 26%, and 72% of mitochondria editing events, respectively, whereas mutants of either MORF2 or MORF9 exhibited reduced editing at nearly all sites in the chloroplast [11,16], indicating the spatial specificity of MORFs in RNA editing.
MORFs are a small protein family in land plants. Members of the MORF gene family have been widely identified in genomes of several species, such as A. thaliana with nine members, P. trichocarpa with nine [7], O. sativa with seven [17], Z. mays with seven [18], and Nicotiana with nine [19]. MORF proteins harbor a conserved stretch of residues (MORF-box), and form homo-and heteromers to interact with selected PPR proteins; however, the molecular function of the MORF-box remains elusive because it shares no sequence similarity with known domains [20]. Crystal structures of the A. thaliana MORF1 and MORF9 proteins were determined [20], which showed that they both adopt a novel globular fold, and validated the mechanism of MORF multimerization. In A. thaliana, MORF8 is localized in mitochondria and chloroplast, MORF2 and MORF9 are targeted to the chloroplast, and the other six members (MORF1, MORF3, MORF4, MORF5, MORF6, and MORF7) are targeted to mitochondria [11,21]. MORF2 and MORF9 can directly physically interact to form complexes that affect the RNA editing of NADH dehydrogenase subunit 4 (ndhD) in chloroplasts, whereas MORF8 can interact with MORF1 and MORF2 in mitochondria and chloroplasts, respectively [22,23]. Expressions of six and seven MORF genes in O. sativa were proved to be affected by cold and salt stresses, respectively [17]. In poplar, it has been reported that the PtrMORF genes responded to drought [7]. In recent studies, mitochondrion-localized NbMORF8 in tobacco was reported to negatively regulate plant immunity to pathogens [19]. OsMORF9 plays a critical role in the biogenesis of chloroplast ribosomes, chloroplast development, and seedling survival [24].
Until now, the distribution and functional studies focused on biotic and abiotic stresses of MORF proteins in kiwifruit remain unclear. In this study, we identified ten putative MORF genes in the kiwifruit genome. Comprehensive analyses of the kiwifruit MORF family were conducted, including genome-wide identification, motif annotation, subcellular localization, physical localization, phylogenetic evolution, synteny analysis, and expression and RNA editing detection. The expression profiles of MORF genes and RNA editing patterns among different tissues and in response to pathogen stress were explored based on transcriptome data, from which we observed different responses to pathogen stress between resistant and susceptible kiwifruit in both expression and editing level. Our results provide further information about the fascinating properties and biological functions of MORF genes, and provide important information to elucidate the defense mechanisms of kiwifruit during pathogen infection.

2. Results

2.1. Identification of MORF Gene Family Members in Kiwifruit

We searched the kiwifruit genome with known A. thaliana MORF proteins as the basis of queries. Both BLASTP and Hidden Markov Model (HMM) searches [25] were performed against the entire protein sequences. After blasting, 17 putative MORF genes were obtained initially. We annotated their motifs using the MEME server [26], and three conserved motifs were found in the MORF box domain, each motif with a length of about 20 amino acids. Ultimately, genes containing motif 2, motif 1, and motif 3 and in the order of motif 2—motif 1—motif 3 were confirmed as members of the MORF gene family. The conservation of amino acid composition is shown in Figure 1. Hence, 10 of 17 members were verified as final kiwifruit MORF genes. The phylogenetic tree from full-length amino acid sequences was constructed using the MEGA with maximum likelihood (ML) method [27] (Figure 2). Based on their phylogenetic relationship with MORF genes of A. thaliana, we named them MORF1, MORF2.1, MORF2.2, MORF2.3, MORF3.1, MORF3.2, MORF7, MORF8, MORF9.1, and MORF9.2 accordingly. The average exon numbers of MORF genes range from 4 to 10, and the length of the encoded proteins ranges from 177 to 624 amino acids (Table 1). The highest number of exons and longest sequence were detected in the MORF7 gene. Subcellular location prediction results showed that MORF3.1, MORF3.2, and MORF8 were localized in mitochondria, whereas the other seven MORF genes were localized in the chloroplast (Table 1).

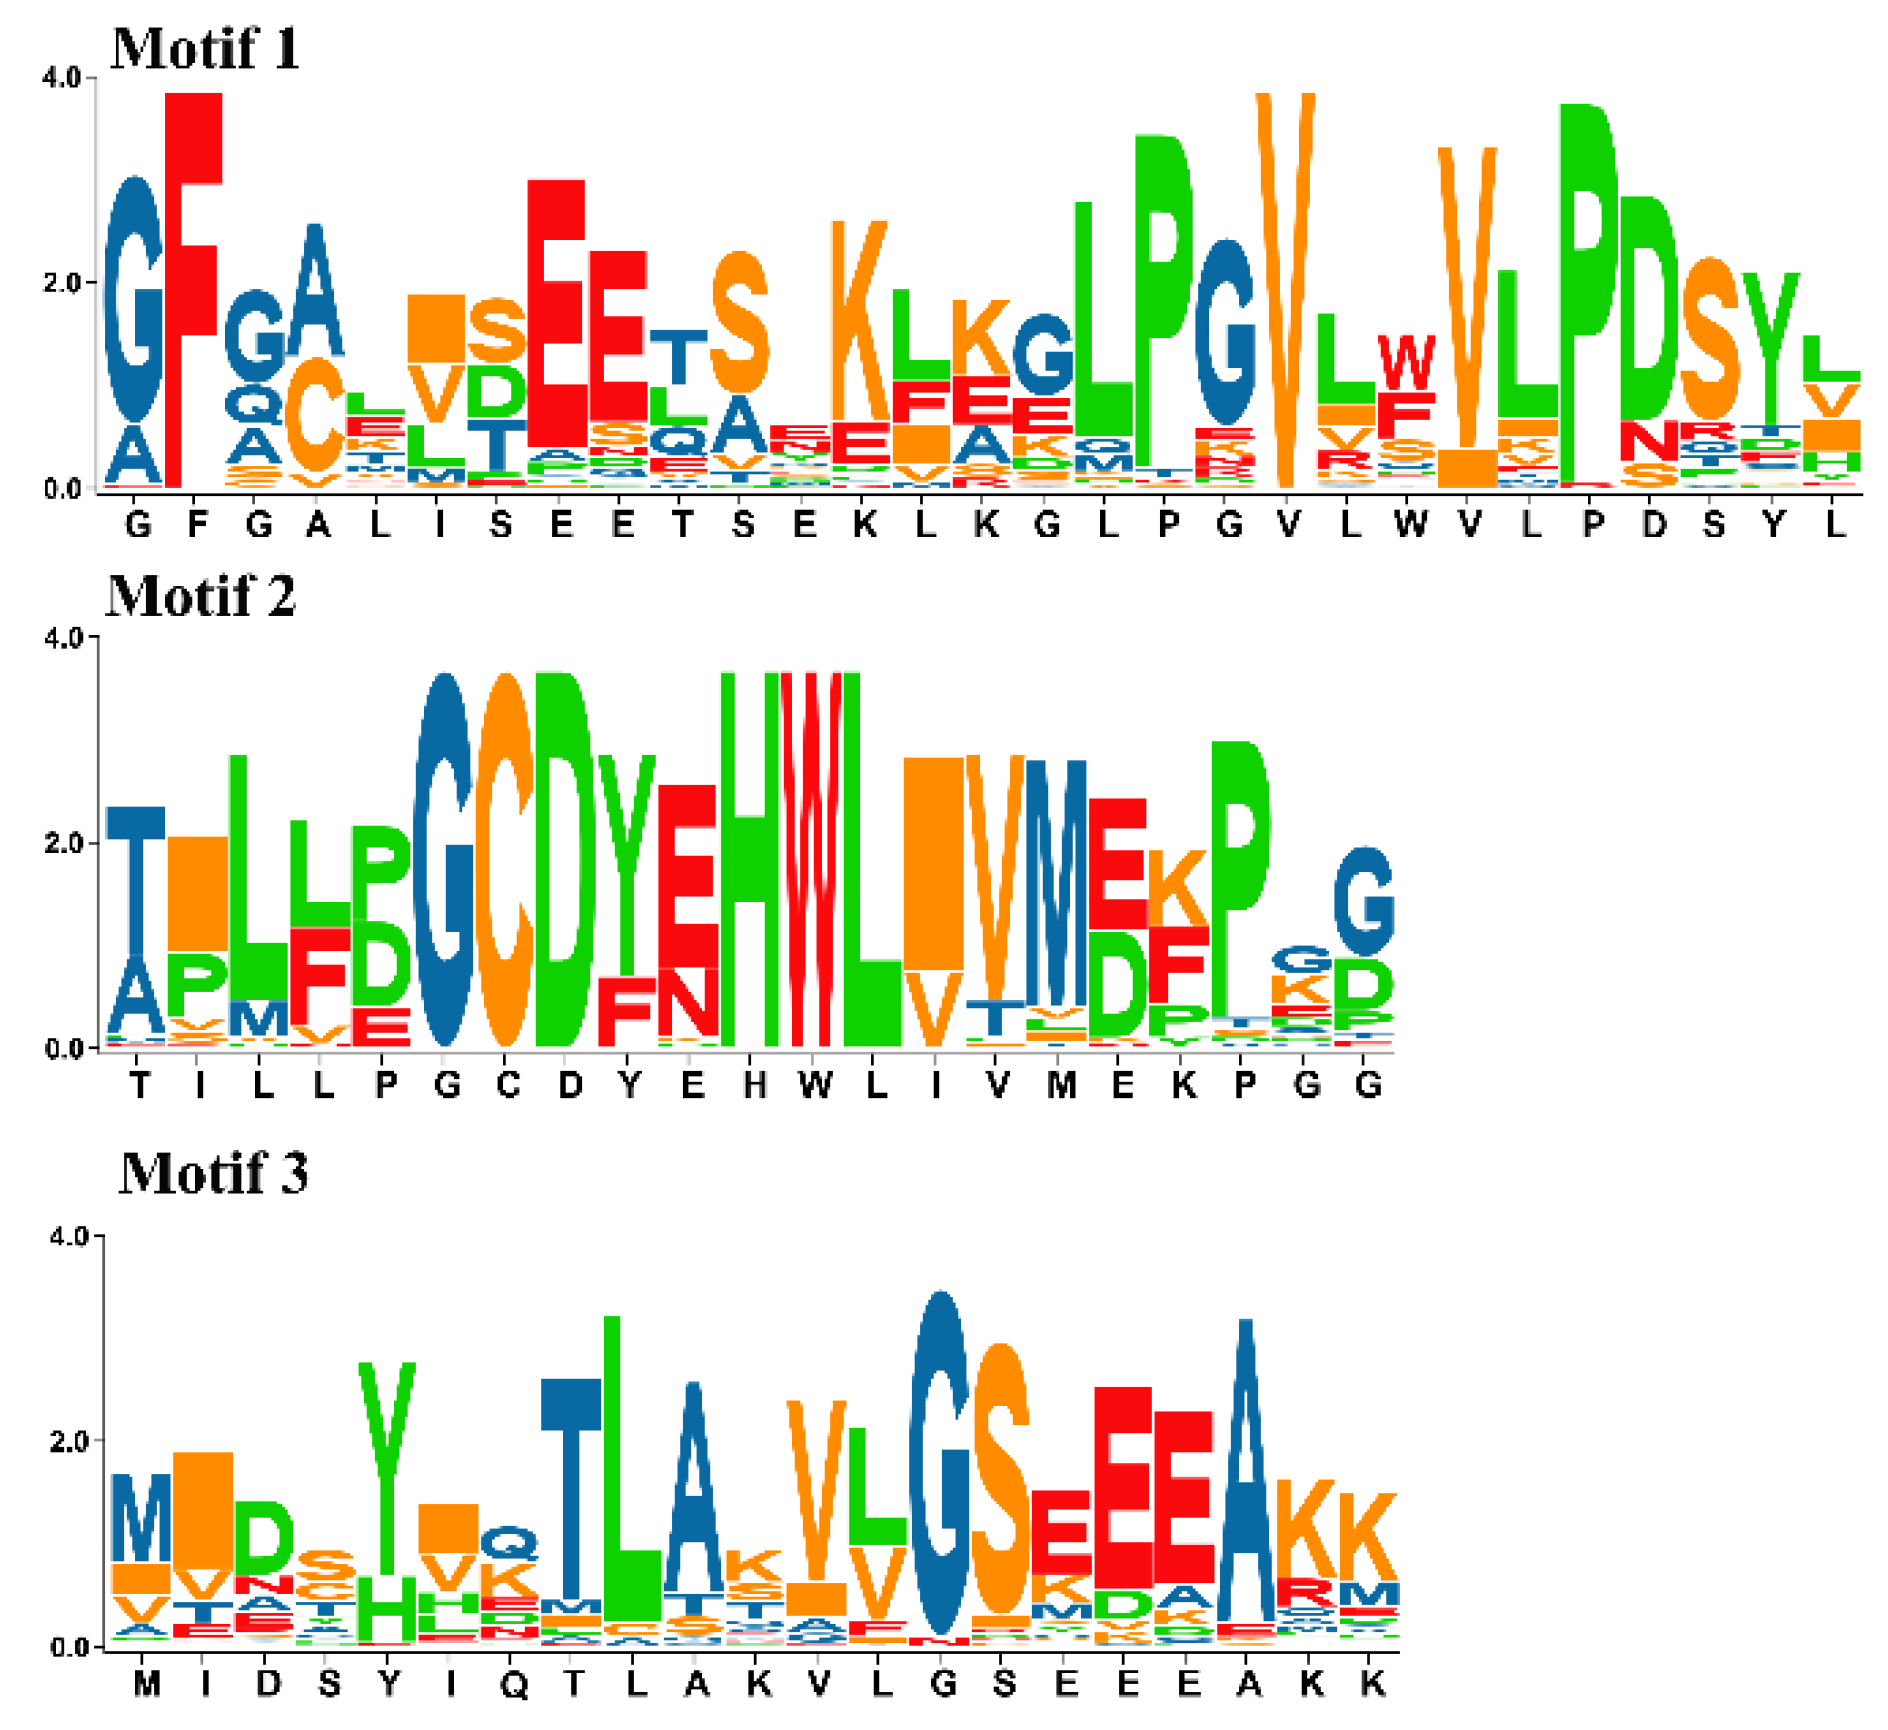
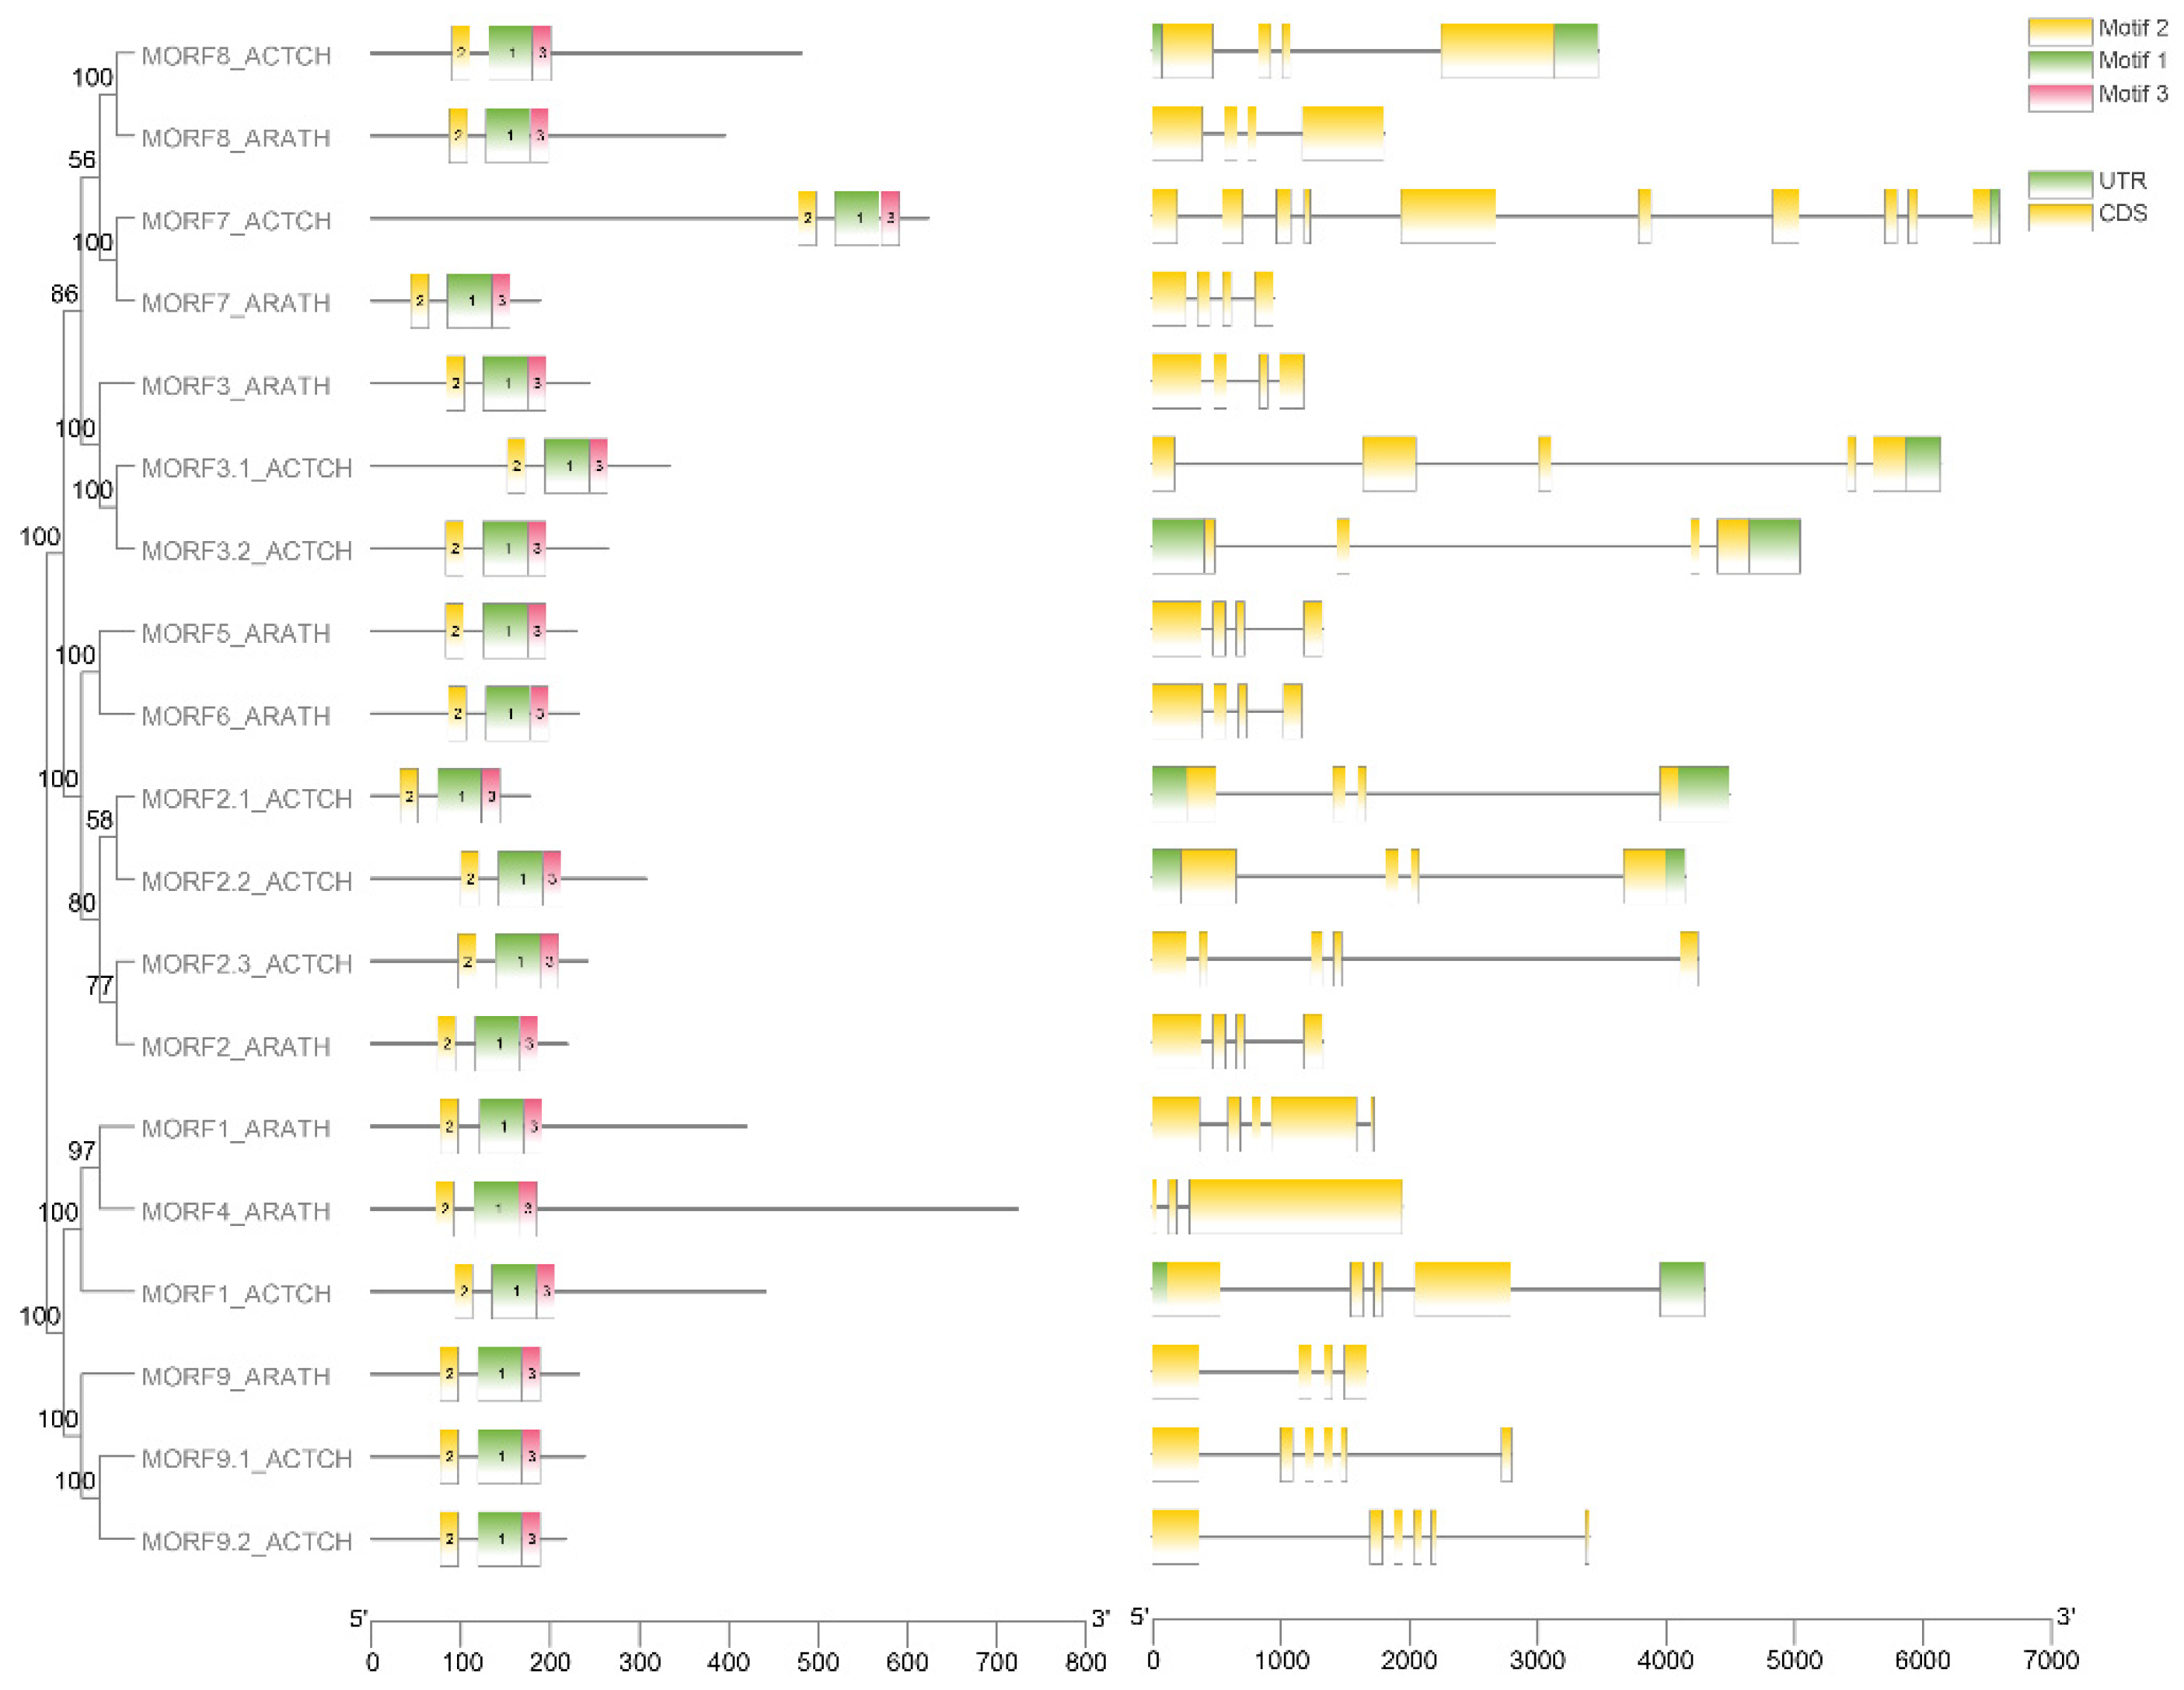
2.2. Phylogenetic Analysis of MORF Genes

To investigate the molecular evolution of MORF genes in kiwifruit, a phylogenetic analysis was performed. Four plants representing major evolutionary lineages were chosen for detection and classification of MORF genes, and BLASTP and HMM searches were both performed against their entire protein sequences. Therefore, nine members in A. thaliana and 28 other functionally known MORF genes from three species (O. sativa, N. tabacum, P. persica) were identified. The numbers of MORF genes in five species were comparable, ranging from six (in O. sativa) to thirteen (N. tabacum). In total, 47 MORF genes were used to construct the ML tree using MEGA [27]. The results indicated that all MORF genes were divided into six clades and designated as the Groups A–F (Figure 3). Among these, Group A and Group C were larger than the others, containing 21 members and accounting for 44.68% of all predicted MORF genes. Nearly all species had the corresponding MORF members in each group; however, Group E was one exception, which only contained MORF members from A. thaliana, kiwifruit, and P. persica. No MORF members were detected in the other two species (N. tabacum, O. sativa). The copy number variation among species in each group was detected; for example, in Group A, kiwifruit and rice both have one MORF copy, whereas the other three species contain two MORF copies; in Group C, one copy was detected in A. thaliana, P. persica, and O. sativa, whereas kiwifruit and tobacco have two copies. These observations indicated the frequent expansion and loss of MORF genes with evolution; however, the total copy number in each species was stable with a certain range around ten. For kiwifruit, MORF genes were found in all groups, among which, three of the groups exhibited kiwifruit specific expansion, including Groups B, C, and D. Three pairs of MORF genes, MORF9.1-MORF9.2, MORF2.1-MORF2.2, and MORF3.1-MORF3.2, revealed a high degree of homology (Figure 3), suggesting that they were paralogous genes from recent duplication events.

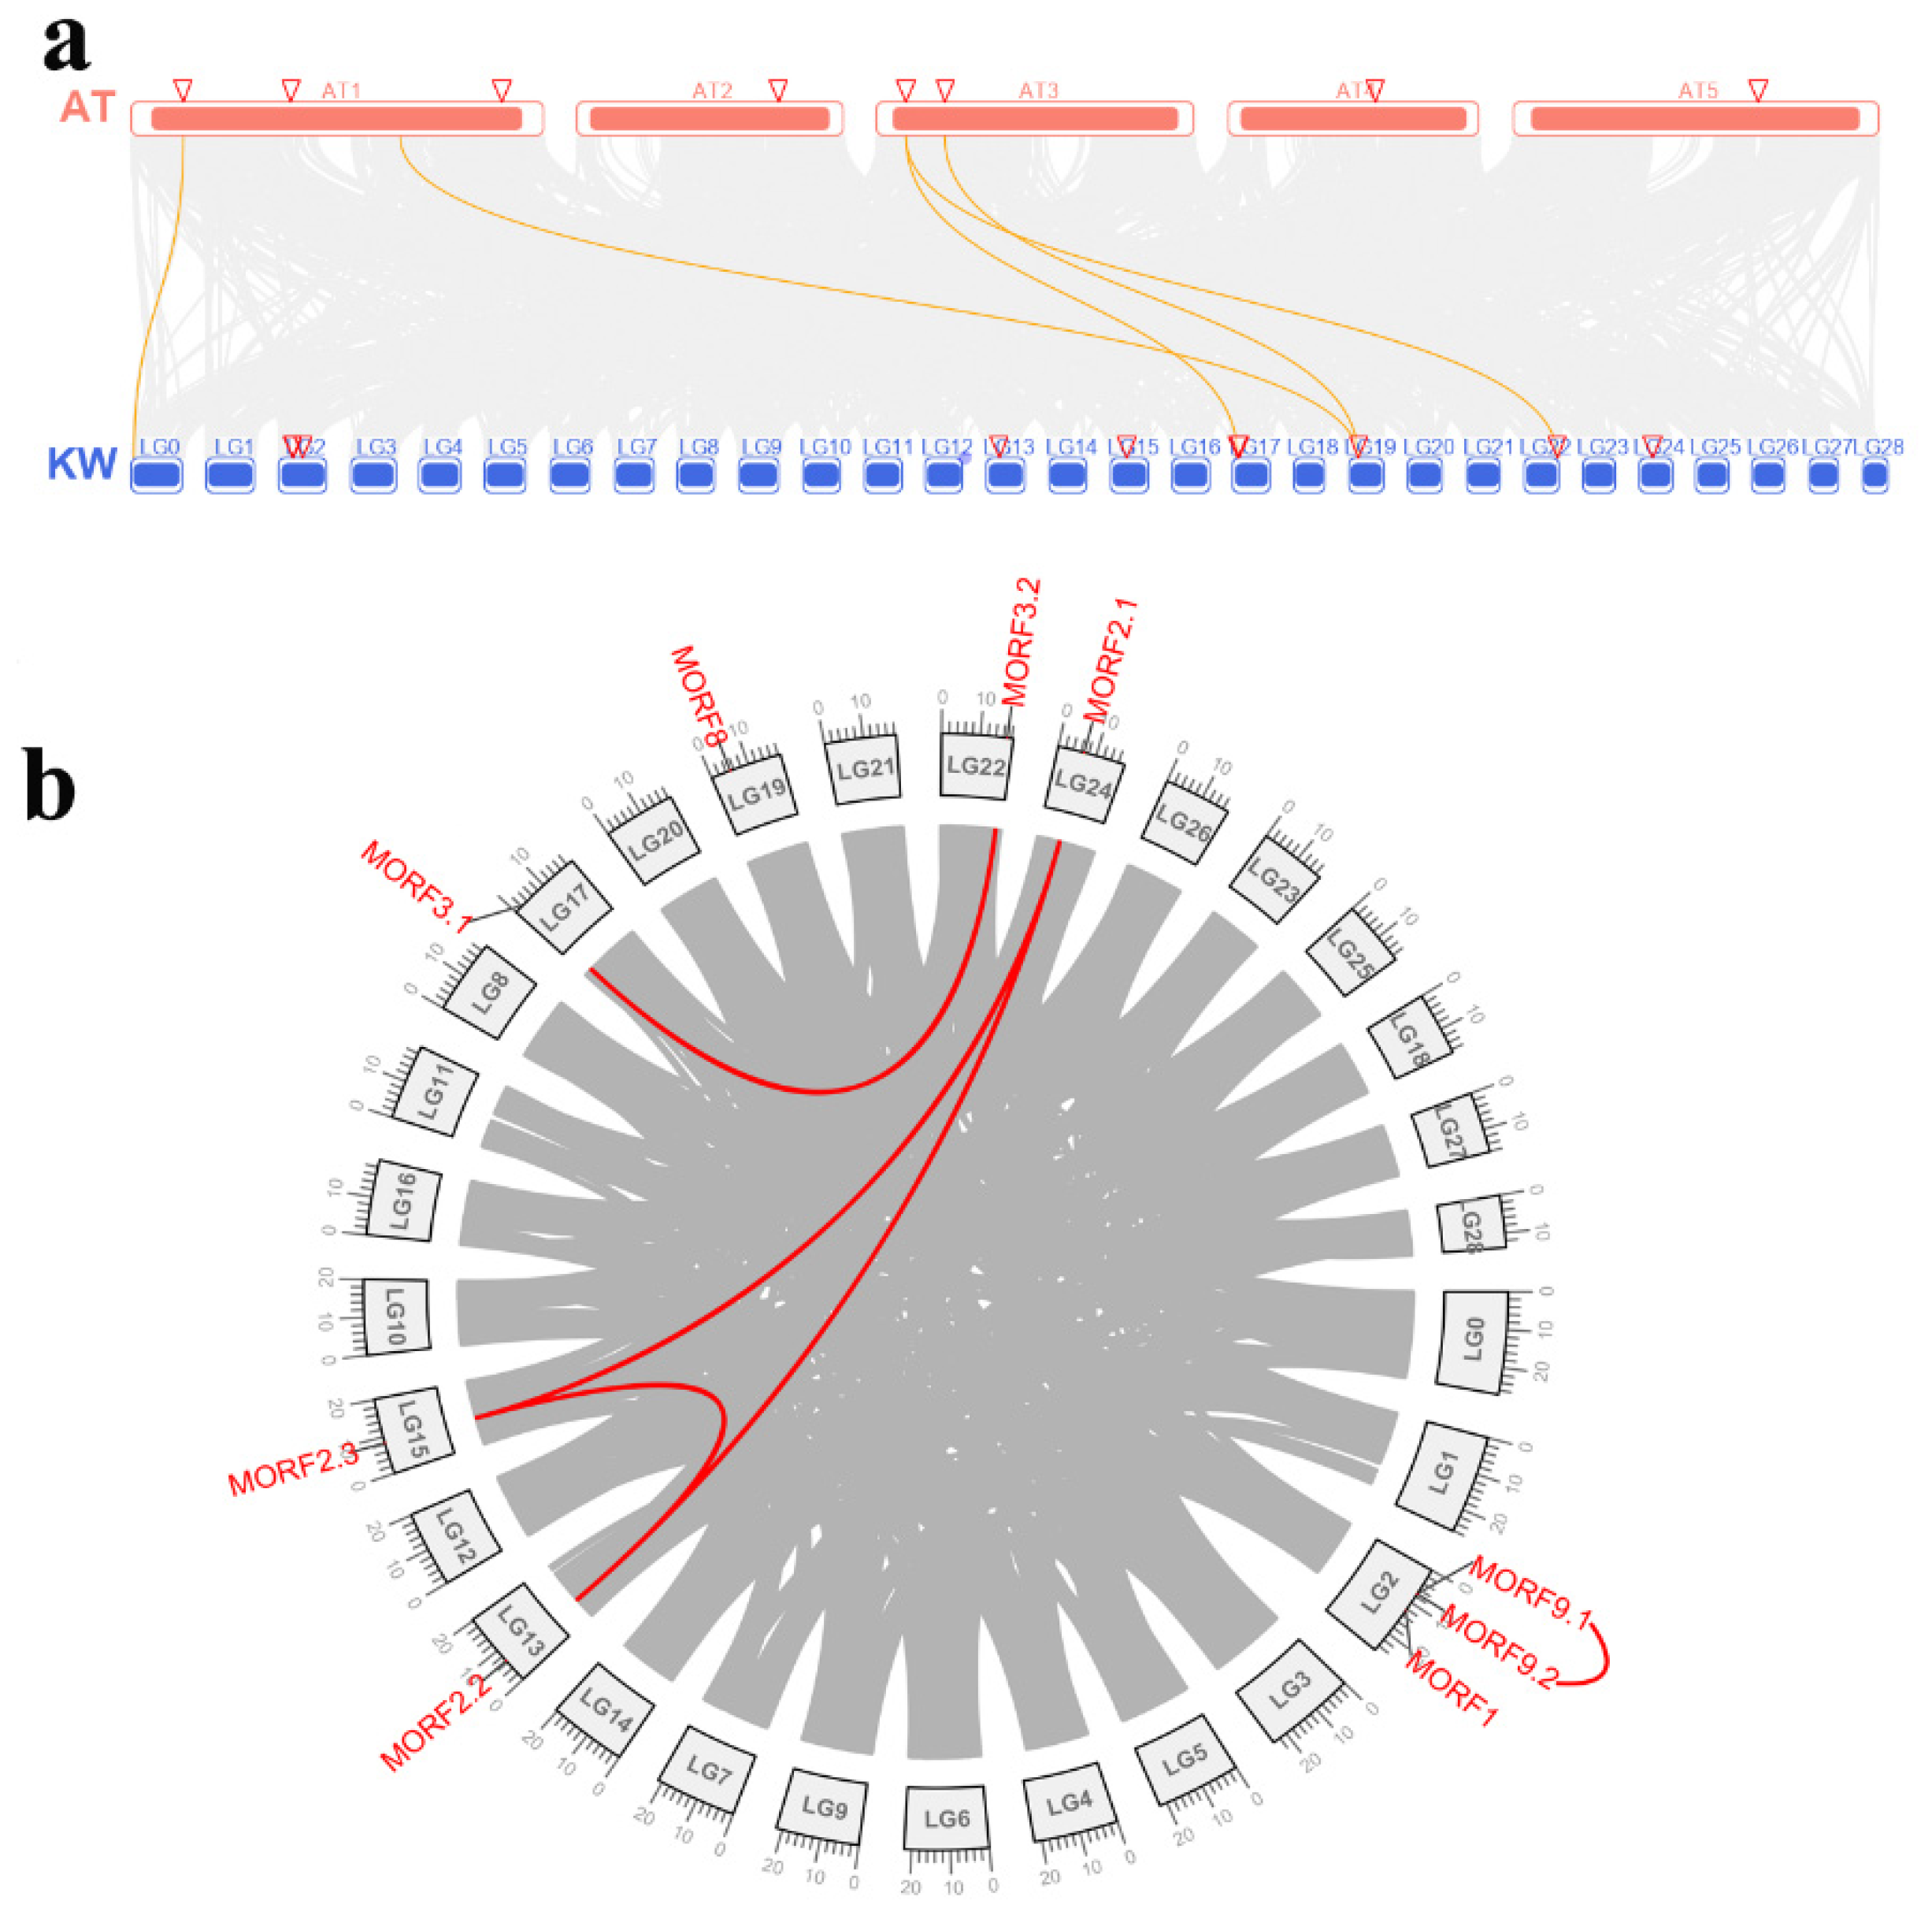
2.3. Genome Distribution and Synteny Analysis of MORF Genes in Kiwifruit

All kiwifruit MORF genes were mapped to the kiwifruit reference genome, as shown in Figure 4, which indicates that the MORF genes in kiwifruit were distributed across seven Linkage Groups (LG) (namely LG 2, 13, 15, 17, 19, 22, and 24) and one unanchored contig (contig01446). Synteny analysis within the kiwifruit genome using MCScanX software was further conducted to determine their duplication events, as shown in Figure 5. LG2 had three MORF genes, namely, MORF1, MORF9.1, and MORF9.2. The latter two, occurring within the neighboring region, were deemed as tandem duplication paralogous genes. The other MORF genes were distributed on the genome separately. In addition to tandem duplication, five MORF genes were assigned to segmental duplication events (MORF3.1/MORF3.2, MORF2.1/MORF2.2/MORF2.3) in kiwifruit LGs 17, 22, 24, 13, and 15. MORF2.1 and MORF2.2 have a higher homology, indicating they were recently segmentally duplicated; however, the detailed duplication relation between them and MORF2.3 remains unclear due to their comparable homology. It was worth noting that MORF7 had the longest sequence and was localized in contig01446 alone with no recent duplicates. MCScanX was also used to identify possible collinear blocks between the kiwifruit genome and that of A. thaliana. The syntenic map between them was constructed, as shown in Figure 5a, which showed that four kiwifruit MORF genes showed syntenic relationships with MORFs in A. thaliana. To explore the selection pressure in the evolution of MORF genes, the Ka/Ks values were calculated for three pairs of paralogous MORF genes from recent duplication events. The Ka/Ks values of all these gene paralogs were less than one, suggesting that these genes evolved under purifying selection.

2.4. Identification of RNA Editing Sites in Kiwifruit

Based on merged RNA sequencing (RNA-seq) data [29] from different kiwifruit tissues (shoots, leaves, flower buds, flowers, and different developmental stages of fruits after full bloom), we used REDO tools to identify all RNA editing sites by following the protocol in our previous study [9]. The overall mapping depth is ~50X, which is adequate for the identification of RNA editing sites. A total of 61 and 347 RNA editing sites that occur in 29 and 33 genes were detected in the kiwifruit chloroplast and mitochondrion, respectively (Table 2). Detailed information is listed in Tables S1 and S2. Nearly all of the editing types are C-to-U substitution, except for several mismatches, such as atpA_1336 having an A-to-C substitution type, which may result from sequencing error. In addition, one site located in the ndhD gene was detected to produce a functional start codon, with an editing efficiency of about 49.2%, whereas three sites located in chloroplast cytochrome c (ccsA), ATPase subunit 9 (atp9), and ribosomal protein L16 (rpl16) genes produced a premature termination codon (Tables S1 and S2). In addition, the average RNA editing efficiencies of chloroplast and mitochondrion are ~75.8% and 85.5%, respectively. We observed that the RNA editing efficiency varied among individual edited genes, ranging from 10% to 100%; for example, the editing efficiency of the ndhD_1470 site is 15.9%, whereas it is nearly 100% for the rps2_134 site. Based on RNA-seq data from each sample or condition, we also conducted a comparison analysis of RNA editing events in the subsequent study.

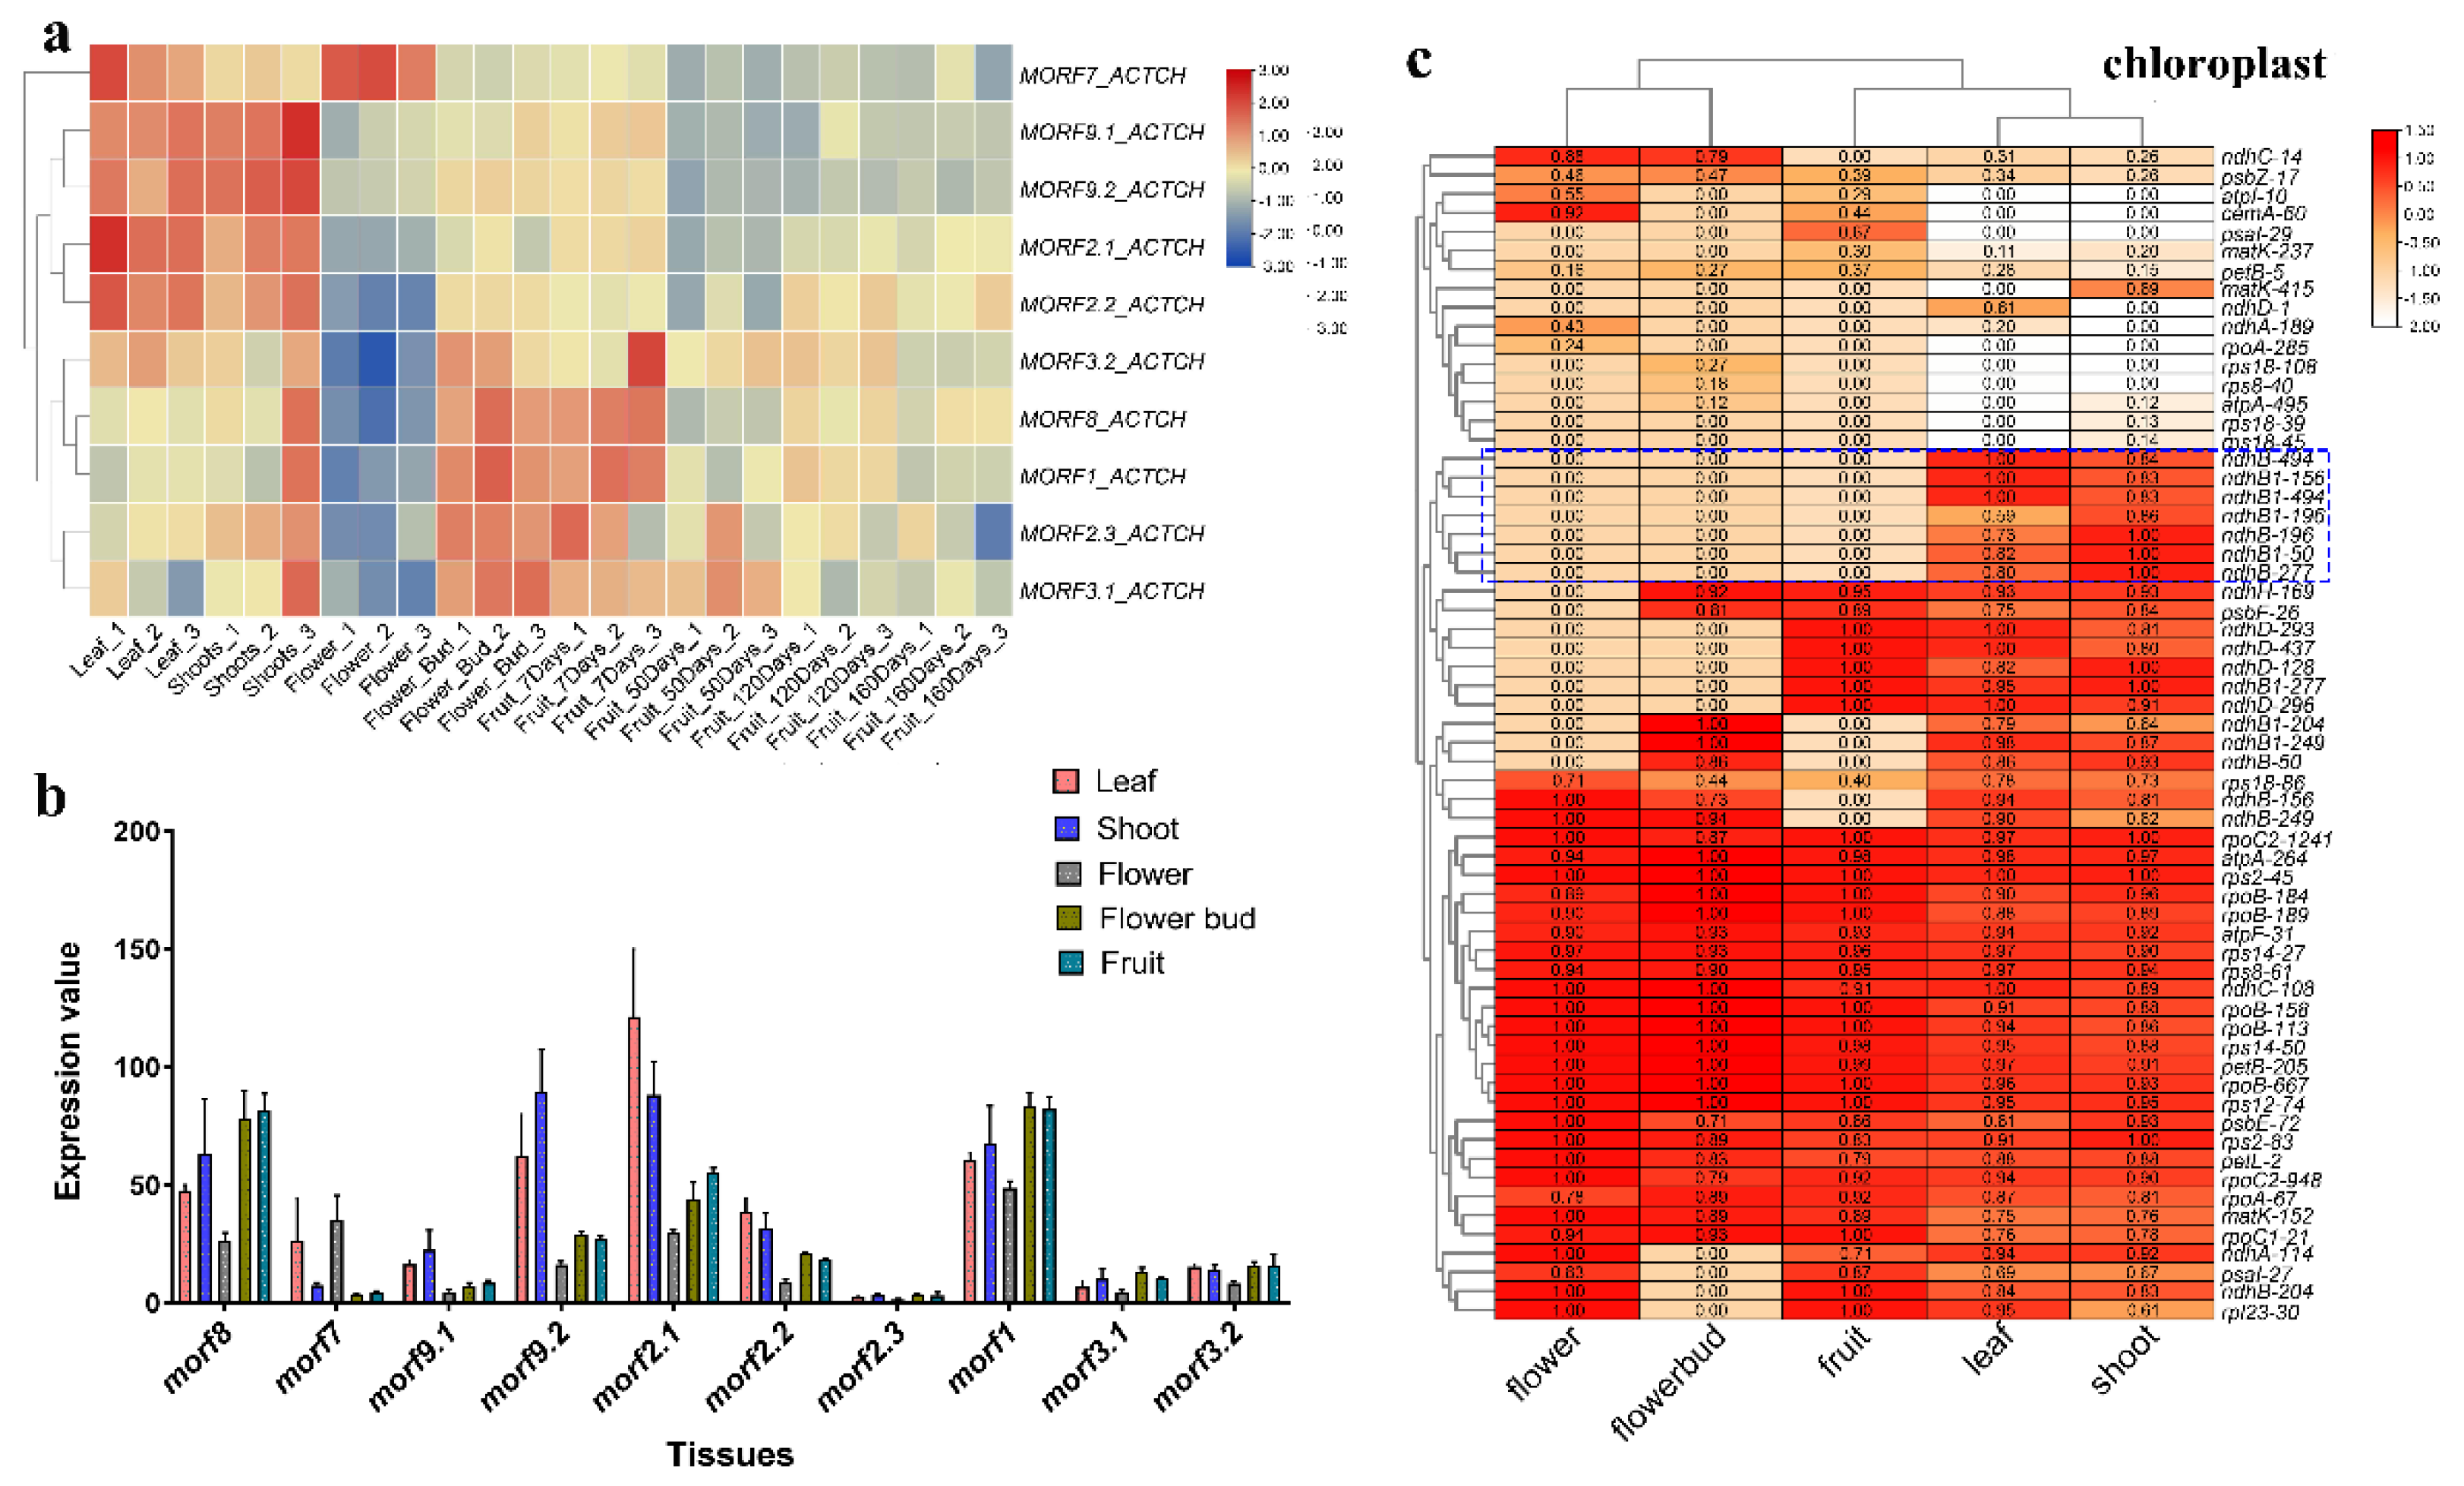
2.5. Profiles of MORF Gene Expression and RNA Editing Patterns in Different Tissues of Kiwifruit

Based on RNA-seq data from different tissues, as shown above, we examined the tissue expression profiles of MORF genes, and observed that MORF genes of kiwifruit demonstrated tissue-specific expression; see Figure 6a,b. The expression profile of MORF genes in the leaf is similar to that of the shoot, whereas the expression profile of MORF genes in flower buds is similar to that in the earlier developmental stage of fruits (7 days after full bloom). Five MORF genes showed obvious tissue-specific expression, namely, MORF2.1, MORF2.2, MORF9.1, MORF9.2, and MORF7. The first four genes were highly expressed in leaf and shoot, but weakly expressed in other tissues, whereas the MORF7 gene was relatively highly expressed in flower and leaf but weakly expressed in other tissues. In contrast, MORF8 and MORF1 were widely expressed in all tissue types with a higher expression level except flower. Three other MORF genes, namely, MORF2.3, MORF3.1, and MORF3.2, were all weakly expressed in all tissues. In addition, we also observed that the expression level of MORF genes decreased obviously with the increase in fruit ripeness. Furthermore, we found that MORF genes with closer evolutionary relationships shared similar expression patterns generally, such as MORF2.1 and MORF2.1, and MORF9.1 and MORF9.2, whereas MORF2.3 was an exception, and was expressed at a very low level.
Given the observation that MORF genes exhibited varied expression patterns in kiwifruit, we further examined their RNA editing pattern among tissues. Taking chloroplast RNA editing as an example (Figure 6c), we found that the clustering relationship of tissues based on RNA editing efficiency is similar to that of MORF genes’ expression, and leaf and shoot were both clustered together. In addition, we also observed that a few editing sites only occurred in certain tissues. More editing sites were detected in the leaf and shoot, such as the editing sites in the ndhB gene, which was only edited in the leaf and shoot. By comparison, the flower has the least editing sites, and even lost the editing in the ndhD gene. However, there were still several editing sites that were notably highly edited, or only edited, in flowers, such as the ndhC-14, psbZ-17, and atpI-10 sites. The tissue-specific expression of MORF genes probably contributes to the discrepancy in RNA editing, such as high expression of MORF2.1, MORF2.2, MORF9.1, and MORF9.2 in the leaf and shoot, and the relatively high expression of MORF7 in the flower.

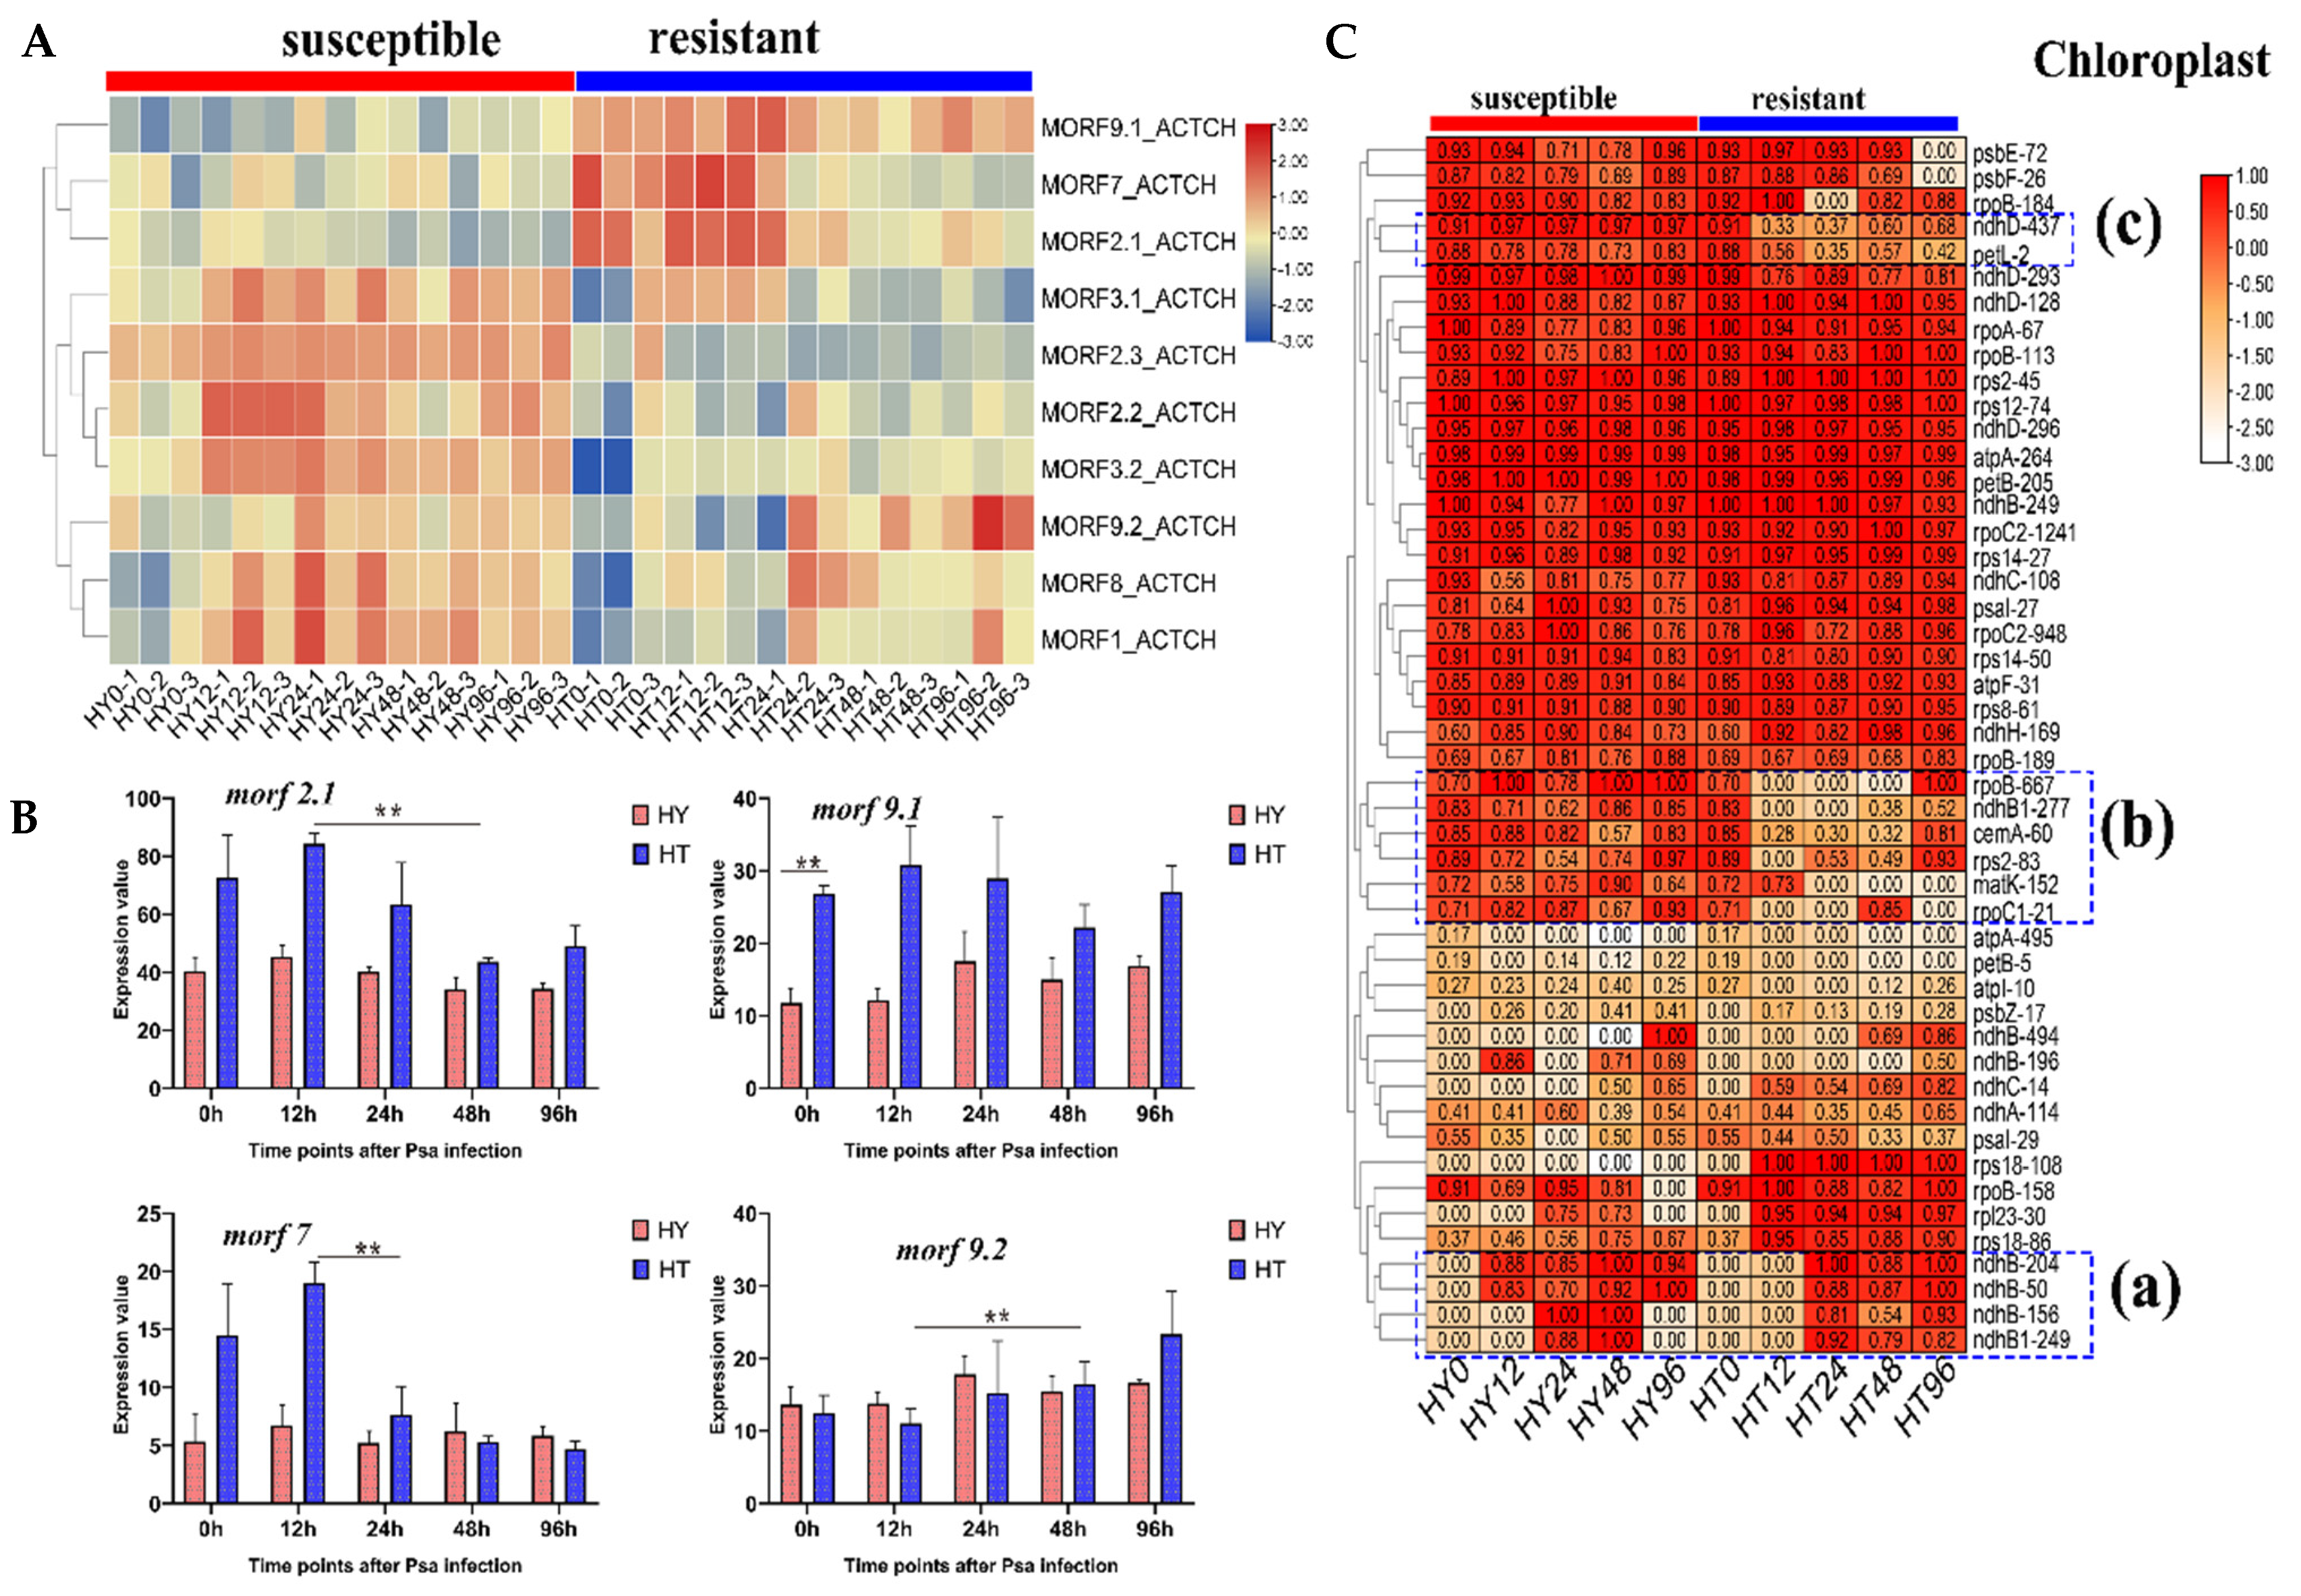
2.6. Different MORF Genes Expression in Response to Psa Infection between Resistant and Susceptible Kiwifruits

Based on RNA-seq data [30] in resistant and susceptible kiwifruit during early infection of Pseudomonas syringae pv. Actinidiae (Psa), we examined the expression of MORF genes. As shown in Figure 7A,B and Table 3, we found that MORF genes exhibited significantly different expression levels between resistant (HT, ‘Huate’) and susceptible (HY, ‘Hongyang’) kiwifruit under pathogen stress. We compared their expression level at the time points of 0 and 12 hours after inoculation (hai) as examples. At 0 hai, five MORF genes exhibited significantly different expression abundance between two varieties. Three of these, namely, MORF2.1, MORF9.1, and MORF7, were highly expressed in HT, whereas two other genes, MORF1 and MORF3.2, were relatively highly expressed in HY; at 12 hai, the expression levels of MORF2.1, MORF9.1, and MORF7 in HT were still higher than those in HY, whereas the expression levels of MORF2.3, MORF2.2, MORF1, and MORF3.2 in HT were significantly lower than those in HY.
Moreover, within a variety, we also examined the MORF gene expression between two neighboring time points in response to Psa infection. For HT variety, two MORF genes exhibited significant differential expression; MORF2.3 was down-regulated at 12 hai, and MORF7 was obviously down-regulated at 24 hai, whereas no differentially expressed MORF genes were detected in HY. When we further compared the MORF gene expression between 12 and 48 hai, we observed that five MORF genes exhibited differential expression in HT. Among these, MORF2.1 and MORF7 were both down-regulated at 48 hai, and MORF9.2, MORF1, and MORF8 were all up-regulated slightly. Furthermore, in HT, we observed that the degree of down-regulation was the dominant trend, and was remarkably higher than that of up-regulation. In contrast, only one MORF gene, MORF2.2, was down-regulated slightly at 48 hai in HY.
Taken together, these results indicated that MORF genes demonstrated differential expression in response to Psa infection, especially in resistant kiwifruit, where the response of MORF gene expression to pathogen stress in the resistant variety is stronger than in the susceptible variety. It is speculated that the changed expression of MORF genes in the resistant variety improved the ability to regulate stress response. For HT, from the heatmap plotting, we observed that down-regulated MORF genes (MORF2.1, MORF7, and MORF2.3) shared a similar tissue expression pattern, and were all localized in the chloroplast; however, despite the same subcellular location, MORF9.2 and MORF1 have opposite expression trends under stress—they were up-regulated slightly at later infection, indicating their opposite roles in stress response.

2.7. Different RNA Editing Patterns in Response to Psa Infection between Resistant and Susceptible Kiwifruits

Given the different expression patterns of MORF genes between and within varieties in response to Psa infection, we further examined their corresponding RNA editing events, as shown in Figure 7C. At 0 hai, HY and HT shared the same RNA editing pattern. After Psa infection, they both acquired RNA editing in certain sites, such as editing in ndhB (sites_a in Figure 7C), indicating their common response of RNA editing to pathogen stress, and that the up-regulation of RNA editing factors, not merely MORF genes, may contribute to the acquisition of editing. By comparison, we observed that only HT exhibited a wide reduction or loss of editing efficiency in other sites, such as sites_b and sites_c in Figure 7C, where a total of eight sites showed obviously reduced editing efficiency. Among these, editing in sites cemA-60, ndhD-437, and petL-2 were reduced at 12 hai, whereas editing of rpoC-666, ndhB1–277, and rpoc1–21 were completely lost at 12 hai.0 However, these notable reductions in editing were not detected in HY. Taken together, compared with HY, resistant variety HT demonstrated a more dramatic response to Psa infection in terms of both RNA editing level and MORF gene expression, and down-regulation of MORF2.1 and MORF7 may be responsible for the reduced editing in HT. Under pathogen attack, MORF genes were prone to be down-regulated, thereby reducing the RNA editing level to trigger a series of defense responses.

3. Discussion

Plant MORF proteins are multifunctional proteins, and there were about 9–10 members localized in mitochondria and chloroplasts. MORF proteins act as a components of the RNA editosome through interacting with other RNA editing factors, PPR proteins, RRM domain-containing proteins, etc. [11,16]. RNA editing is a post-transcription process that alters the genetic information of RNA molecules. In flowering plants this mainly occurs in chloroplasts and mitochondria. Traditionally, the conversion of RNA editing is thought to act as a corrective mechanism for DNA mutations by restoration of conserved amino acids to ensure proper protein function. In recent years, the roles of MORF proteins in plant development and immunity have attracted more attention [9,10].
Research has shown that, in A. thaliana, MORF2 and MORF9 are involved in most editing sites within the chloroplast; MORF1, MORF3, MORF4, MORF6, and MORF7 are targeted to mitochondria, and involved in editing within mitochondria; MORF5 and MORF8 are dually targeted to chloroplast and mitochondria [11,21]. MORF proteins can form homodimers or heterodimers. Recently, the crystal structures of MORF1, MORF2, and MORF9 proteins have been reported. The latter two MORF proteins tightly form homodimers in crystals and regulate chloroplast RNA editing of ndhD in A. thaliana, whereas MORF8 can interact with MORF1 in mitochondria and chloroplasts, respectively [20,22]. In our study, we identified 10 MORF genes utilizing the recently released kiwifruit assembly. Among these, three pairs of MORF genes (MORF2, MORF9, MORF3) were paralogous genes that derived from segmental and tandem gene duplication. In contrast to A. thaliana, in which most MORF proteins are localized in mitochondria, and few are localized in the chloroplast, in kiwifruit, prediction showed that most kiwifruit MORF proteins were localized in the chloroplast and a few in mitochondria. All five copies of MORF2 and MORF9 are exclusively localized in the chloroplast, and highly expressed in the leaf and shoot with tissue specificity. However, kiwifruit MORF2.3 was an exception; overall, it exhibited a low expression level, indicating that it may be a newly derived gene from segmental duplication of MORF2. In contrast to A. thaliana, kiwifruit MORF1 and MORF7 genes were also localized in the chloroplast. Only MORF3 and MORF8 copies were localized in mitochondria, where MORF1 and MORF8 were widely expressed in all tissues. The similar expression patterns between MORF2 and MORF9, and MORF1 and MORF8, suggested their functional relevance, and confirmed their selective heteromer interactions. The chloroplast RNA editing pattern among tissues also supports this point; ndhB and ndhD genes were only exclusively edited in the leaf and shoot where MORF2 and MORF9 were highly expressed. However, the mitochondria RNA editing did not show the obvious discrepancy among tissues. This finding is consistent with the stable expression of mitochondria-localized MORF genes.
Mitochondria and chloroplasts, which serve as energy conversion sites within cells, play key roles in plant–pathogen interactions. They are also important sources of reactive oxygen species (ROS) that act as key defense molecules in plant immune responses [31]. However, it remains largely unclear how mitochondrial and chloroplast proteins achieve modulation of the plant immune system. Recently, nuclear gene expression has been acknowledged to be involved in post-transcriptional regulation of chloroplast function in response to external stimuli. RNA editing is one of these control mechanisms. A previous study determined that one gene, overexpressor of cationic peroxidase3 (ocp3), contributed to control of the extent of ndhB transcripts’ editing, and proposed that in ocp3-mediated chloroplast RNA editing in plant immunity, ocp3 mutants lead to ndhB editing efficiency decays, thereby impairing cyclic electron flow (CEF) and substantially enhancing disease resistance to fungal pathogens [32]. Recent evidence indicated that MORF genes were vital for plant development and stress response, such as drought stress in poplar, seedling survival in rice, and pathogen stress in tobacco [7,17,19]. Another study also found that NbMORF8 localized in the mitochondrion negatively regulates plant immunity to Phytophthora pathogens [19], indicating the roles of nuclear gene regulation in plant enhanced resistance. In our study, the comparison between resistant and susceptible kiwifruits also confirmed this hypothesis. After Psa infection, the down-regulation of MORF genes (MORF7 and MORF2.1), accompanied by reduced RNA editing, were detected in resistant kiwifruit. The affected chloroplast genes mostly function in the photosystem, DNA-RNA transcription, and RNA splicings, such as ndhB, ndhD, rpoC, and rpoD. ndhB encodes the B subunit of the chloroplast NADH dehydrogenase-like complex (NDH) involved in cyclic electron flow (CEF) around photosystem I. Hence, we speculated that the decays in editing efficiency in these genes may trigger the impaired CEF, thereby leading to the activation of ROS-mediated retrograde signaling and the substantial enhancement of the disease resistance to pathogens; see Figure 8. Thus, NDH complex activity and plant immunity appear to be interlinked processes. MORF genes modulate the plant–pathogen interaction through the control of the extent of RNA editing, and especially components of the NDH complex. The discrepancy in MORF genes’ expression in response to pathogen infection between resistant and susceptible kiwifruit partly explains their different disease resistance capacity.

4. Materials and Methods

4.1. Genome-Wide Identification of MORF Genes in Kiwifruit

Kiwifruit (Actinidia chinensis cv. ‘Hongyang’) genome files were downloaded from the Kiwifruit Genome Database (http://kiwifruitgenome.org/, accessed on 24 November 2021). First, using the previously identified MORF genes in A. thaliana as queries [11], we implemented BLASTP searches of the entire protein database with an E-value cut-off of 0.00001 to reduce false positives. Second, Hidden Markov Model (HMM) profiles of MORF genes in A. thaliana were constructed, and used to search against the kiwifruit protein database using HMMER software with an E-value cut-off of 0.001 [25]. Ultimately, the conserved motifs of all hits were annotated using the online MEME software [26]. Genes containing motif 2, motif 1, and motif 3 and in the order of motif 2—motif 1—motif 3 were confirmed as members of the MORF gene family in kiwifruit. The final kiwifruit MORF genes are named based on their phylogenetic relationship with that of A. thaliana, accordingly.

4.2. Gene Structure Analysis, Subcellular and Physical Localization

TargetP [33] and pLoc-mPlant (www.jci-bioinfo.cn/pLoc-mPlant/, accessed on 24 November 2021) were used to predict the putative subcellular localization of MORF proteins. The gene structure and positional information of MORF genes in kiwifruit on the genome were obtained from the annotation documents, and the sketch map of the gene structure and physical location was drawn using TBtools [28].

4.3. Phylogenetic Tree Construction

In addition to kiwifruit, four other species (O. sativa, N. tabacum, A. thaliana, and P. persica) that represent major evolutionary lineages were chosen for phylogenetic analysis of MORF genes. BLASTP and HMM searches were both performed against their entire protein sequences, as shown above. The obtained MORF protein sequences were used to perform multiple sequence alignment using the ClustalW method [34], and the aligned sequences were further used for phylogenetic tree construction by the MEGA7 program [27]. The trees were generated by the Maximum Likelihood method based on the Jones–Taylor–Thornton (JTT) matrix-based model. The bootstrap method was used for phylogeny testing with 500 replications. The produced tree was further embellished by Figtree (http://tree.bio.ed.ac.uk/software/figtree/, accessed on 24 November 2021). MORF genes were classified by their clustering relation with the query sequences mentioned above.

4.4. Synteny Analysis and Detection of Tandemly/Segmentally Duplicated MORF Genes

To identify the synteny of MORF genes in kiwifruit and between genomes, we performed self-blast and all-to-all BLASTP between and within the genomes of kiwifruit and A. thaliana using BLASTP with an E-value cut-off of 0.00001. All BLASTP hits were used as input for MCScanX (Multiple Collinearity Scan toolkit) software [35] to identify possible collinear blocks within and between genomes of different species. Based on the self-blast results, we detected the tandemly/segmentally duplicated MORF genes in kiwifruit. In addition to the tandem duplication that was determined by MCScanX, paralogues that were either adjacent to or separated by ≤5 genes along a chromosome were also assigned as tandem duplicates. If paralogues were within known genomic duplication blocks, they were considered to be duplicated through segmental duplication. All intra/inter-genomic synteny relationships were visualized with TBtools [28].

4.5. Transcriptome Data Collection and Preprocessing

The transcriptome data of different tissues (shoots, leaves, flower buds, flowers, and fruits (7, 50, 120, and 160 days) after full bloom) from ’Hayward’ kiwifruit were retrieved from the SRA database of NCBI (www.ncbi.nlm.nih.gov/, accessed on 24 November 2021) with accession number PRJNA564374. Each tissue consisted of more than three replicates. In addition, the transcriptome data of shoots from resistant ‘Hongyang’ (HY) and susceptible ‘Huate’ (HT) kiwifruit in response to Psa during early infection was also retrieved from the SRA database of NCBI with accession number PRJNA514180. The early infection consists of 0, 12, 24, 48, and 96 hai with Psa, and each condition also consists of three replicates. We utilized the FastQC tool to first check the quality of the transcriptome data [36]. For detection of RNA editing sites, we retrieved the genome sequences of kiwifruit chloroplasts and mitochondria, and their annotation files from the nucleotide database of NCBI with accession numbers KP297245 and MH645953, respectively. To increase sequencing depth, we merged the duplicates from each tissue into one sample.

4.6. Expression Analysis of MORF Genes in Kiwifruit

The clean reads of RNA-seq data from each sample were mapped against the kiwifruit genome reference with HISAT2 [37]. Each SAM file was converted into a BAM file, and sorted, and duplicates were removed with SAMtools [38,39]. Further transcript assembly and quantification of the read alignments were performed using Stringtie [40]. Gene expression levels were measured by fragments per kilobase of transcript per million mapped reads (FPKM). EdgeR was used to determine the differentially expressed genes [41]. Cluster analysis was also performed using the HeatMap function implemented in TBtools [28] based on the matrix of MORF gene expression, which was initially normalized by subtracting the row-wise mean from the values in each row of data and dividing by the standard deviation of each row. Based on the gene expression levels from transcriptome, we performed comparisons among tissues and infection points.

4.7. Identification of RNA Editing Sites

The transcriptome data were mapped to the chloroplast/mitochondrial genome reference using the HISAT2 software with default parameters [37]. Then, each SAM file was converted into a BAM file, and sorted, and duplicates were removed with SAMtools [38,39]. The variant calling process was conducted by the SAMtools ‘mpileup’ command, and the single nucleotide polymorphisms (SNPs) were identified by the BCFtools ‘call’ command [42]. RNA editing sites were filtered based on the variants’ results from transcriptome sequencing data. For chloroplasts/mitochondria, based on their SNP-calling results and gene annotation files, RNA editing sites were identified using the REDO tool [43]. REDO is a comprehensive application tool for identifying RNA editing events in plant organelles based on variant calling format files from RNA-seq data. To reduce the number of false positives, the REDO tool implements a series of comprehensive rule-dependent and statistical filters [43]. We further manually examined all mismatches to minimize false-positive sites. For each site, RNA editing efficiency was quantified by the proportion of edited transcripts in the totally covered transcripts. For comparison between tissues and conditions, cluster analysis was also performed using the HeatMap function implemented in TBtools [28] based on the matrix of RNA editing efficiency, which was initially normalized by subtracting the row-wise mean from the values in each row of data and dividing by the standard deviation of each row.

5. Conclusions

In conclusion, this study investigated the MORF gene family in kiwifruit based on gene structure, phylogenetic relationships, and synteny analysis, and provided their expression pattern among different tissues and under pathogen stress. The findings revealed that MORF gene members were all predicted to be localized in mitochondria and chloroplasts, and displayed tissue-specific expression, which may be responsible for different RNA editing. Different expressions of MORF genes and RNA editing profiles in chloroplasts between resistant and susceptible kiwifruit after pathogen infection were also observed, indicating the roles of MORF genes in stress response. Our findings will be useful for further molecular elucidation of plant immunity and the breeding of resistant kiwifruit.

Supplementary Materials

The following are available online at https://www.mdpi.com/article/10.3390/plants11020146/s1, Table S1. Detailed information of identified RNA editing sites in the chloroplast of kiwifruit. (XLSX); Additional file 2: Table S2. Detailed information of identified RNA editing sites in mitochondria of kiwifruit. (XLSX).

Author Contributions

Conceptualization, Y.X. and A.Z.; methodology, Y.X.; software, Y.X.; validation, Y.X., A.Z. and J.F.; formal analysis, T.W.; investigation, Y.X.; resources, Y.X.; data curation, Y.X.; writing—original draft preparation, Y.X.; writing—review and editing, A.Z., K.L. and H.P.; visualization, X.J.; supervision, A.Z.; project administration, X.Z.; funding acquisition, X.Z. All authors have read and agreed to the published version of the manuscript.

Funding

This research was funded by the National Natural Science Foundation of China, grant numbers 32070682, the National Science & Technology Innovation Zone Project, grant numbers 1716315XJ00200303 and 1816315XJ00100216, and CAS Pioneer Hundred Talents Program.

Institutional Review Board Statement

Not applicable.

Informed Consent Statement

Not applicable.

Data Availability Statement

All raw reads used in this work were deposited in NCBI Bio-Project with the accession number PRJNA564374 and PRJNA514180.

Acknowledgments

We would like to thank the members of Bioinformatics Group of Wuhan Botanical Garden, Chinese Academy of Sciences, China for the discussion and suggestion to improve the manuscript.

Conflicts of Interest

The authors declare no conflict of interest.

Abbreviations

MORF: Multiple organelle RNA editing factors; Psa: Pseudomonas syringae pv. Actinidiae; C-to-U: cytidines substituting uridines; PPR: Pentatrico peptide repeat; RNA-seq: RNA sequencing; SNPs: single nucleotide polymorphisms; ndh: NADH dehydrogenase; atp9: ATPase subunit 9; rpl16: ribosomal protein L16; hai: hour after inoculation; HMM: Hidden Markov Model; CEF: cyclic electron flow.

References

  1. Wu, H.; Ma, T.; Kang, M.; Ai, F.; Zhang, J.; Dong, G.; Liu, J. A high-quality Actinidia chinensis (kiwifruit) genome. Hortic. Res. 2019, 6, 117. [Google Scholar] [CrossRef] [Green Version]
  2. Park, Y.S.; Im, M.H.; Ham, K.S.; Kang, S.G.; Park, Y.K.; Namiesnik, J.; Leontowicz, H.; Leontowicz, M.; Katrich, E.; Gorinstein, S. Nutritional and pharmaceutical properties of bioactive compounds in organic and conventional growing kiwifruit. Plant Foods Hum. Nutr. 2013, 68, 57–64. [Google Scholar] [CrossRef]
  3. Petriccione, M.; Di Cecco, I.; Arena, S.; Scaloni, A.; Scortichini, M. Proteomic changes in Actinidia chinensis shoot during systemic infection with a pandemic Pseudomonas syringae pv. actinidiae strain. J. Proteom. 2013, 78, 461–476. [Google Scholar] [CrossRef]
  4. Vanneste, J.L.; Yu, J.; Cornish, D.A.; Tanner, D.J.; Windner, R.; Chapman, J.R.; Taylor, R.K.; Mackay, J.F.; Dowlut, S. Identification, Virulence, and Distribution of Two Biovars of Pseudomonas syringae pv. actinidiae in New Zealand. Plant Dis. 2013, 97, 708–719. [Google Scholar] [CrossRef] [Green Version]
  5. Giege, P.; Brennicke, A. RNA editing in Arabidopsis mitochondria effects 441 C to U changes in ORFs. Proc. Natl. Acad. Sci. USA 1999, 96, 15324–15329. [Google Scholar] [CrossRef] [Green Version]
  6. Ruchika; Okudaira, C.; Sakari, M.; Tsukahara, T. Genome-Wide Identification of U-To-C RNA Editing Events for Nuclear Genes in Arabidopsis thaliana. Cells 2021, 10, 635. [Google Scholar] [CrossRef]
  7. Wang, D.; Meng, S.; Su, W.; Bao, Y.; Lu, Y.; Yin, W.; Liu, C.; Xia, X. Genome-Wide Analysis of Multiple Organellar RNA Editing Factor Family in Poplar Reveals Evolution and Roles in Drought Stress. Int. J. Mol. Sci. 2019, 20, 1425. [Google Scholar] [CrossRef] [Green Version]
  8. Chateigner-Boutin, A.L.; Small, I. Plant RNA editing. RNA Biol. 2010, 7, 213–219. [Google Scholar] [CrossRef]
  9. Zhang, A.; Jiang, X.; Zhang, F.; Wang, T.; Zhang, X. Dynamic response of RNA editing to temperature in grape by RNA deep sequencing. Funct. Integr. Genom. 2020, 20, 421–432. [Google Scholar] [CrossRef] [Green Version]
  10. Fang, J.; Jiang, X.H.; Wang, T.F.; Zhang, X.J.; Zhang, A.D. Tissue-specificity of RNA editing in plant: Analysis of transcripts from three tobacco (Nicotiana tabacum) varieties. Plant Biotechnol. Rep. 2021, 15, 471–482. [Google Scholar] [CrossRef]
  11. Takenaka, M.; Zehrmann, A.; Verbitskiy, D.; Kugelmann, M.; Hartel, B.; Brennicke, A. Multiple organellar RNA editing factor (MORF) family proteins are required for RNA editing in mitochondria and plastids of plants. Proc. Natl. Acad. Sci. USA 2012, 109, 5104–5109. [Google Scholar] [CrossRef] [Green Version]
  12. Zhang, F.; Tang, W.; Hedtke, B.; Zhong, L.; Liu, L.; Peng, L.; Lu, C.; Grimm, B.; Lin, R. Tetrapyrrole biosynthetic enzyme protoporphyrinogen IX oxidase 1 is required for plastid RNA editing. Proc. Natl. Acad. Sci. USA 2014, 111, 2023–2028. [Google Scholar] [CrossRef] [Green Version]
  13. Tian, F.; Yu, J.; Zhang, Y.; Xie, Y.; Wu, B.; Miao, Y. MORF9 Functions in Plastid RNA Editing with Tissue Specificity. Int. J. Mol. Sci. 2019, 20, 4635. [Google Scholar] [CrossRef] [Green Version]
  14. Haag, S.; Schindler, M.; Berndt, L.; Brennicke, A.; Takenaka, M.; Weber, G. Crystal structures of the Arabidopsis thaliana organellar RNA editing factors MORF1 and MORF9. Nucleic Acids Res. 2017, 45, 4915–4928. [Google Scholar] [CrossRef] [Green Version]
  15. Barkan, A.; Small, I. Pentatricopeptide repeat proteins in plants. Annu. Rev. Plant Biol. 2014, 65, 415–442. [Google Scholar] [CrossRef]
  16. Yan, J.; Zhang, Q.; Yin, P. RNA editing machinery in plant organelles. Sci. China Life Sci. 2018, 61, 162–169. [Google Scholar] [CrossRef]
  17. Zhang, Q.; Shen, L.; Ren, D.; Hu, J.; Chen, G.; Zhu, L.; Gao, Z.; Zhang, G.; Guo, L.; Zeng, D. Characterization, Expression, and Interaction Analyses of OsMORF Gene Family in Rice. Genes 2019, 10, 694. [Google Scholar] [CrossRef] [Green Version]
  18. Luo, M.; Cai, M.; Zhang, J.; Li, Y.; Zhang, R.; Song, W.; Zhang, K.; Xiao, H.; Yue, B.; Zheng, Y. Functional divergence and origin of the DAG-like gene family in plants. Sci. Rep. 2017, 7, 5688. [Google Scholar] [CrossRef] [Green Version]
  19. Yang, Y.; Fan, G.; Zhao, Y.; Wen, Q.; Wu, P.; Meng, Y.; Shan, W. Cytidine-to-Uridine RNA Editing Factor NbMORF8 Negatively Regulates Plant Immunity to Phytophthora Pathogens. Plant Physiol. 2020, 184, 2182–2198. [Google Scholar] [CrossRef]
  20. Yang, J.; Zhang, M.; Wang, X. Crystal structure of the chloroplast RNA editing factor MORF2. Biochem Biophys Res Commun 2018, 495, 2038–2043. [Google Scholar] [CrossRef]
  21. Bentolila, S.; Heller, W.P.; Sun, T.; Babina, A.M.; Friso, G.; van Wijk, K.J.; Hanson, M.R. RIP1, a member of an Arabidopsis protein family, interacts with the protein RARE1 and broadly affects RNA editing. Proc. Natl. Acad. Sci. USA 2012, 109, E1453–E1461. [Google Scholar] [CrossRef] [Green Version]
  22. Zehrmann, A.; Hartel, B.; Glass, F.; Bayer-Csaszar, E.; Obata, T.; Meyer, E.; Brennicke, A.; Takenaka, M. Selective homo- and heteromer interactions between the multiple organellar RNA editing factor (MORF) proteins in Arabidopsis thaliana. J. Biol. Chem. 2015, 290, 6445–6456. [Google Scholar] [CrossRef] [Green Version]
  23. Huang, C.; Li, Z.R.; Yu, Q.B.; Ye, L.S.; Cui, Y.L.; Molloy, D.P.; Yang, Z.N. MORF2 tightly associates with MORF9 to regulate chloroplast RNA editing in Arabidopsis. Plant Sci. 2019, 278, 64–69. [Google Scholar] [CrossRef]
  24. Zhang, Q.; Wang, Y.; Xie, W.; Chen, C.; Ren, D.; Hu, J.; Zhu, L.; Zhang, G.; Gao, Z.; Guo, L.; et al. OsMORF9 is necessary for chloroplast development and seedling survival in rice. Plant Sci. 2021, 307, 110907. [Google Scholar] [CrossRef]
  25. Potter, S.C.; Luciani, A.; Eddy, S.R.; Park, Y.; Lopez, R.; Finn, R.D. HMMER web server: 2018 update. Nucleic Acids Res. 2018, 46, W200–W204. [Google Scholar] [CrossRef] [Green Version]
  26. Bailey, T.L.; Johnson, J.; Grant, C.E.; Noble, W.S. The MEME Suite. Nucleic Acids Res. 2015, 43, W39–W49. [Google Scholar] [CrossRef] [Green Version]
  27. Kumar, S.; Stecher, G.; Tamura, K. MEGA7: Molecular Evolutionary Genetics Analysis Version 7.0 for Bigger Datasets. Mol. Biol. Evol. 2016, 33, 1870–1874. [Google Scholar] [CrossRef] [Green Version]
  28. Chen, C.; Chen, H.; Zhang, Y.; Thomas, H.R.; Frank, M.H.; He, Y.; Xia, R. TBtools: An Integrative Toolkit Developed for Interactive Analyses of Big Biological Data. Mol. Plant 2020, 13, 1194–1202. [Google Scholar] [CrossRef]
  29. Salazar, J.A.; Vergara-Pulgar, C.; Jorquera, C.; Zapata, P.; Ruiz, D.; Martinez-Gomez, P.; Infante, R.; Meneses, C. De Novo Transcriptome Sequencing in Kiwifruit (Actinidia chinensis var. deliciosa (A Chev) Liang et Ferguson) and Development of Tissue-Specific Transcriptomic Resources. Agronomy 2021, 11, 919. [Google Scholar] [CrossRef]
  30. Song, Y.; Sun, L.; Lin, M.; Chen, J.; Qi, X.; Hu, C.; Fang, J. Comparative transcriptome analysis of resistant and susceptible kiwifruits in response to Pseudomonas syringae pv. Actinidiae during early infection. PLoS ONE 2019, 14, e0211913. [Google Scholar] [CrossRef]
  31. Amirsadeghi, S.; Robson, C.A.; Vanlerberghe, G.C. The role of the mitochondrion in plant responses to biotic stress. Physiol. Plant. 2007, 129, 253–266. [Google Scholar] [CrossRef]
  32. Garcia-Andrade, J.; Ramirez, V.; Lopez, A.; Vera, P. Mediated plastid RNA editing in plant immunity. PLoS Pathog. 2013, 9, e1003713. [Google Scholar] [CrossRef] [PubMed] [Green Version]
  33. Boos, F.; Muhlhaus, T.; Herrmann, J.M. Detection of Internal Matrix Targeting Signal-like Sequences (iMTS-Ls) in Mitochondrial Precursor Proteins Using the TargetP Prediction Tool. Bio Protoc. 2018, 8, e2474. [Google Scholar] [CrossRef] [PubMed]
  34. Hung, J.H.; Weng, Z. Sequence Alignment and Homology Search with BLAST and ClustalW. Cold Spring Harb. Protoc. 2016, 2016, 11. [Google Scholar]
  35. Wang, Y.; Li, J.; Paterson, A.H. MCScanX-transposed: Detecting transposed gene duplications based on multiple colinearity scans. Bioinformatics 2013, 29, 1458–1460. [Google Scholar] [CrossRef] [Green Version]
  36. Brown, J.; Pirrung, M.; McCue, L.A. FQC Dashboard: Integrates FastQC results into a web-based, interactive, and extensible FASTQ quality control tool. Bioinformatics 2017, 33, 3137–3139. [Google Scholar] [CrossRef] [PubMed] [Green Version]
  37. Kim, D.; Langmead, B.; Salzberg, S.L. HISAT: A fast spliced aligner with low memory requirements. Nat. Methods 2015, 12, 357–360. [Google Scholar] [CrossRef] [Green Version]
  38. Li, H.; Handsaker, B.; Wysoker, A.; Fennell, T.; Ruan, J.; Homer, N.; Marth, G.; Abecasis, G.; Durbin, R. The Sequence Alignment/Map format and SAMtools. Bioinformatics 2009, 25, 2078–2079. [Google Scholar] [CrossRef] [Green Version]
  39. Danecek, P.; Bonfield, J.K.; Liddle, J.; Marshall, J.; Ohan, V.; Pollard, M.O.; Whitwham, A.; Keane, T.; McCarthy, S.A.; Davies, R.M.; et al. Twelve years of SAMtools and BCFtools. Gigascience 2021, 10, 1–4. [Google Scholar] [CrossRef]
  40. Pertea, M.; Pertea, G.M.; Antonescu, C.M.; Chang, T.C.; Mendell, J.T.; Salzberg, S.L. StringTie enables improved reconstruction of a transcriptome from RNA-seq reads. Nat. Biotechnol. 2015, 33, 290–295. [Google Scholar] [CrossRef] [Green Version]
  41. Robinson, M.D.; McCarthy, D.J.; Smyth, G.K. edgeR: A Bioconductor package for differential expression analysis of digital gene expression data. Bioinformatics 2010, 26, 139–140. [Google Scholar] [CrossRef] [PubMed] [Green Version]
  42. Danecek, P.; McCarthy, S.A. BCFtools/csq: Haplotype-aware variant consequences. Bioinformatics 2017, 33, 2037–2039. [Google Scholar] [CrossRef] [PubMed]
  43. Wu, S.; Liu, W.; Aljohi, H.A.; Alromaih, S.A.; Alanazi, I.O.; Lin, Q.; Yu, J.; Hu, S. REDO: RNA Editing Detection in Plant Organelles Based on Variant Calling Results. J. Comput. Biol. 2018, 25, 509–516. [Google Scholar] [CrossRef] [PubMed]
Figure 1. Seqlogo of conserved motifs in kiwifruit MORF genes. Protein sequences were used to estimate amino acids’ residue variation. The bit score represents the information content for each position in the sequence.
Plants 11 00146 g001
Figure 2. Classification, motif annotation, and genomic structures of MORF genes in kiwifruit. The phylogenetic tree is shown in the left panel, whereas conserved motifs and genomic structures are shown in the right two panels. The phylogenetic tree from full-length amino acid sequences was constructed using the MEGA with maximum likelihood (ML) method. Three conserved motifs are indicated by different colored boxes. CDSs and UTRs are indicated by yellow and green boxes, respectively. Their sizes are estimated using the length scale at the bottom.
Plants 11 00146 g002
Figure 3. Phylogenetic relationships of the MORF gene family from kiwifruit, O. sativa, N. tabacum, A. thaliana, and P. persica. Forty-seven MORF genes were used for phylogenetic tree construction by the maximum likelihood (ML) method [27]. MORF genes in kiwifruit are indicated by red boxes, numbers on branches indicate the branch length. All the MORF genes were classified into six groups and designated as Groups A–F; branches from different groups are indicated by different colors.
Plants 11 00146 g003
Figure 4. Chromosomal locations of MORF genes in kiwifruit. The chromosomal locations of the MORF genes were mapped with TBtools [28].
Plants 11 00146 g004
Figure 5. Synteny analysis of MORF genes in kiwifruit. (a) Synteny analysis of MORF genes between kiwifruit and A. thaliana. Gray lines in the background indicate the collinear blocks between different species, whereas the orange lines highlight the syntenic MORF gene pairs. (b) Interchromosomal relationships of MORF genes in kiwifruit. Gray lines indicate all synteny blocks within the kiwifruit genome, and the red lines indicate synteny blocks where duplicated MORF gene pairs were.
Plants 11 00146 g005
Figure 6. Expression and RNA editing pattern of MORF genes in kiwifruit among different tissues. (a) Heat mapping of MORF gene expression in different tissues of kiwifruit. The x-axis represents different samples (leaf, shoot, flower, flower bud, and fruits at different developmental stages), the y-axis represents MORF genes. The rows were clustered based on expression values. (b) Expression level of ten MORF genes in kiwifruit among different tissues. Tissues are indicated by different colors. (c) Heat mapping of RNA editing efficiency in kiwifruit chloroplast genes among different tissues. The x-axis represents different tissues, the y-axis represents chloroplast RNA editing sites, and the rows are clustered based on RNA editing efficiency. Editing sites occurring in ndhB gene are marked by a blue box.
Plants 11 00146 g006
Figure 7. Expression and RNA editing pattern of MORF genes between resistant and susceptible kiwifruits in response to Psa infection. (A) Heat mapping of MORF gene expression between resistant and susceptible kiwifruits after Psa infection. The x-axis represents hours after Psa infection (0, 12, 24, 48, 96 hai), the y-axis represents MORF genes. The rows are clustered based on expression values. HY (‘Hongyang’) and HT (‘Huate’) represent susceptible and resistant kiwifruits, respectively. (B) Expression level of representative MORF genes (MORF2.1, MORF7, MORF9.1, and MORF9.2) between resistant and susceptible kiwifruits in response to Psa infection. Asterisks denote significant differences: ** p-value < 0.01. (C) Heat mapping of RNA editing efficiency in chloroplast genes between resistant and susceptible kiwifruits in response to Psa infection. The x-axis represents infection time points, the y-axis represents chloroplast RNA editing sites, and the rows are clustered based on RNA editing efficiency. Editing sites in response to infection are marked by a blue box.
Plants 11 00146 g007
Figure 8. Schematic model for the role of MORF genes in plant immunity. The MORF-regulated ROS burst is likely achieved through its effect on the functionality of respiratory chain components. MORF genes participate in the RNA editing of chloroplast photosystem genes and subsequently affect the cyclic electron flow activities. Pathogen infection leads to down-regulation of MORF genes and reduced RNA editing efficiency, thereby impairing CEF, and up-regulating ROS levels, which enhances the immunity to pathogens.
Plants 11 00146 g008
Table 1. The characteristics of putative MORF genes in kiwifruit.
NameGene IDChromosomeLength of Protein (aa 1)Predicted Subcellular Location
MORF9.1_ACTCH Actinidia35298.t1LG2238chloroplast
MORF9.2_ACTCH Actinidia35301.t1LG2217chloroplast
MORF1_ACTCH Actinidia39020.t1LG2441chloroplast
MORF3.1_ACTCH Actinidia18632.t1LG17333mitochondrion
MORF3.2_ACTCH Actinidia40300.t1LG22272mitochondrion
MORF2.1_ACTCH Actinidia30139.t1LG24177chloroplast
MORF2.2_ACTCH Actinidia37538.t1LG13307chloroplast
MORF2.3_ACTCH Actinidia09527.t1LG15250chloroplast
MORF8_ACTCH Actinidia12559.t2LG19481mitochondrion
MORF7_ACTCH Actinidia26821.t2Ctig01446624chloroplast
1 aa: amino acid.
Table 2. Distribution of RNA editing sites among different tissues in chloroplasts and mitochondria of kiwifruit.
Number of Editing SitesNumber of Edited Genes
TissuesChloroplastMitochondrionChloroplastMitochondrion
All613472933
Flower bud351952127
Flower371512424
Fruit412192728
Leaf531862527
Shoot541382525
Table 3. Differentially expressed MORF genes between and within resistant (HT) and susceptible (HY) kiwifruit at different time points after Psa infection.
VarietyTime Points After Psa InfectionGeneslogFCp-Value
HY-HT0 haiMORF9.1_ACTCH0.975.17 × 10−4
MORF7_ACTCH1.212.15 × 10−3
MORF2.1_ACTCH0.644.053 × 10−3
MORF3.2_ACTCH−0.937.06 × 10−3
MORF1_ACTCH−0.403.91 × 10−2
12 haiMORF2.1_ACTCH0.841.85 × 10−8
MORF9.1_ACTCH1.291.35 × 10−6
MORF7_ACTCH1.433.86 × 10−5
MORF2.3_ACTCH−3.011.8 × 10−6
MORF2.2_ACTCH−1.021.97 × 10−4
MORF1_ACTCH−0.462.08 × 10−3
MORF3.2_ACTCH−0.731.01 × 10−2
HT0 hai−12 haiMORF2.3_ACTCH−1.964.75 × 10−2
12 hai−24 haiMORF7_ACTCH−1.232.63 × 10−4
12 hai−48 haiMORF2.1_ACTCH−0.624.04 × 10−5
MORF7_ACTCH−1.495.71 × 10−5
MORF9.2_ACTCH0.885.31 × 10−3
MORF1_ACTCH0.429.13 × 10−3
MORF8_ACTCH0.391.34 × 10−2
HY12 hai−48 haiMORF2.2_ACTCH−0.553.2764 × 10−2
Note: Genes highlighted in bold font are shown in Figure 7B.
Publisher’s Note: MDPI stays neutral with regard to jurisdictional claims in published maps and institutional affiliations.

