
Effective Methods Based on Distinct Learning Principles for the Analysis of Hyperspectral Images to Detect Black Sigatoka Disease

 , , and
Abstract
:1. Introduction
Plant Disease Detection Using Hyperspectral Imaging
2. Materials and Methods
2.1. Plant Material
2.2. Data
2.3. Preprocessing
2.4. Model Building
3. Results
4. Discussion
5. Conclusions and Future Research Directions
Author Contributions
Funding
Institutional Review Board Statement
Informed Consent Statement
Data Availability Statement
Conflicts of Interest
References
- Etebu, E.; Young-Harry, W. Control of black sigatoka disease: Challenges and prospects. Afr. J. Agric. Res. 2011, 6, 508–514. [Google Scholar]
- Cevallos-Cevallos, J.M.; Jines, C.; Maridueña-Zavala, M.G.; Molina-Miranda, M.J.; Ochoa, D.E.; Flores-Cedeno, J.A. GC-MS metabolite profiling for specific detection of dwarf somaclonal variation in banana plants. Appl. Plant Sci. 2018, 6, e01194. [Google Scholar] [CrossRef]
- Hidalgo, M.; Tapia, A.; Rodriguez, W.; Serrano, E. EFECTO DE LA SIGATOKA NEGRA (Mycosphaerella fijiensis) SOBRE LA FOTOSÍNTESIS Y TRANSPIRACIÓN FOLIAR DEL BANANO (Musa s. AAA, cv. Valery). Agron. Costarric. 2006, 30, 35–41. [Google Scholar]
- Bousset, L.; Jumel, S.; Picault, H.; Domin, C. An easy, rapid and accurate method to quantify plant disease severity: Application to phoma stem canker leaf spots. Eur. J. Plant Pathol. 2015, 145, 697–709. [Google Scholar] [CrossRef]
- Kim, S.Y.; Kim, Y.K. An energy efficient uav-based edge computing system with reliability guarantee for mobile ground nodes. Sensors 2021, 21, 8264. [Google Scholar] [CrossRef] [PubMed]
- Behmann, J.; Steinrücken, J.; Plümer, L. Detection of early plant stress responses in hyperspectral images. ISPRS J. Photogramm. Remote Sens. 2014, 93, 98–111. [Google Scholar] [CrossRef]
- Kuska, M.; Wahabzada, M.; Leucker, M.; Dehne, H.; Kersting, K. Hyperspectral phenotyping on the microscopic scale: Towards automated characterization of plant-pathogen interactions. Plant Methods 2015, 11, 28. [Google Scholar] [CrossRef]
- Mahlein, A.-K.; Steiner, U.; Hillnhütter, C.; Dehne, H.-W.; Oerke, E.-C. Hyperspectral imaging for small-scale analysis of symptoms caused by different sugar beet diseases. Plant Methods 2012, 8, 3. [Google Scholar] [CrossRef]
- Hunt, E.R.; Rock, B.N. Detection of Changes in Leaf Water Content Using Near- and Middle-Infrared Reflectances. Remote Sens. Environ. 1989, 54, 43–54. [Google Scholar]
- Slaton, M.; Hunt, E.R.; Smith, W. Estimating near-infrared leaf reflectance from leaf structural characteristics. Am. J Bot. 2001, 88, 278–284. [Google Scholar] [CrossRef]
- IB, S.; Antonio, R.; Almorox, J.A. Aplicación de sensores remotos en la detección y evaluación de plagas y enfermedades en la vegetación. Teledetección. Av. Apl. 1999, 64–67. [Google Scholar]
- Mahlein, A. Detection, Identification and Quantification of Fungal Diseases of Sugar Beet Leaves Using Imaging and Non-Imaging Hyperspectral Techniques. Ph.D. Thesis, Rheinischen Friedrich-Wilhelms-Universität, Bonn, Germany, 2011. [Google Scholar]
- Lowe, A.; Harrison, N.; French, A.P. Hyperspectral image analysis techniques for the detection and classification of the early onset of plant disease and stress. Plant Methods 2017, 13, 80. [Google Scholar] [CrossRef] [PubMed]
- Liakos, K.G.; Busato, P.; Moshou, D.; Pearson, S. Machine Learning in Agriculture: A Review. Sensors 2018, 18, 2674. [Google Scholar] [CrossRef] [PubMed]
- Huang, W.; Lamb, D.W.; Niu, Z.; Zhang, Y.; Liu, L.; Wang, J. Identification of yellow rust in wheat using in-situ spectral reflectance measurements and airborne hyperspectral imaging. Precis. Agric. 2007, 8, 187–197. [Google Scholar] [CrossRef]
- Rumpf, T.; Mahlein, A.K.; Steiner, U.; Oerke, E.C.; Dehne, H.W.; Plümer, L. Early detection and classification of plant diseases with Support Vector Machines based on hyperspectral reflectance. Comput. Electron. Agric. 2010, 74, 91–99. [Google Scholar] [CrossRef]
- Zhu, H.; Chu, B.; Zhang, C.; Liu, F.; Jiang, L.; He, Y. Hyperspectral Imaging for Presymptomatic Detection of Tobacco Disease with Successive Projections Algorithm and Machine-learning Classifiers. Sci. Rep. 2017, 7, 4125. [Google Scholar] [CrossRef] [PubMed]
- Ugarte, F.J.; Bayorna, A.O.; Criollo, B.R.; Cevallos-Cevallos, J.; Maridueña-Zavala, M.G.; Ochoa, D.D.; Vicente-Villardón, J.L. Early detection of black Sigatoka in banana leaves using hyperspectral images. Appl. Plant Sci. 2020, 8, e11383. [Google Scholar] [CrossRef] [PubMed]
- Aghdam, S.A.; Brown, A.M.V. Deep learning approaches for natural product discovery from plant endophytic microbiomes. Environ. Microbiomes 2021, 16, 6. [Google Scholar] [CrossRef]
- Sanchez-Azofeifa, A.; Oki, Y.; Fernandes, G.W.; Ball, R.A.; Gamon, J. Relationships between endophyte diversity and leaf optical properties. Trees-Struct. Funct. 2012, 26, 291–299. [Google Scholar] [CrossRef]
- Vujanovic, V.; Kim, S.H.; Lahlali, R.; Karunakaran, C. Spectroscopy and SEM imaging reveal endosymbiont-dependent components changes in germinating kernel through direct and indirect coleorhiza-fungus interactions under stress. Sci. Rep. 2019, 9, 2–10. [Google Scholar] [CrossRef]
- Gbongue, L.R.; Lalaymia, I.; Zeze, A.; Delvaux, B.; Declerck, S. Increased silicon acquisition in bananas colonized by Rhizophagus irregularis MUCL 41833 reduces the incidence of Pseudocercospora fijiensis. Front. Plant Sci. 2019, 9, 1977. [Google Scholar] [CrossRef] [PubMed]
- Fouré, E. Varietal reactions of bananas and plantains to black leaf streak disease. In Banana and Plantain Breeding Strategies; Australian Centre for International Agricultural Research: Bruce, ACT, Australia, 1987; Volume 21, pp. 110–113. Available online: https://aciar.gov.au/publication/technical-publications/banana-and-plantain-breeding-strategies (accessed on 21 August 2022).
- Folch-Fortuny, A.; Prats-montalbán, J.M.; Cubero, S.; Blasco, J.; Ferrer, A. Chemometrics and Intelligent Laboratory Systems VIS/NIR hyperspectral imaging and N-way PLS-DA models for detection of decay lesions in citrus fruits. Chemom. Intell. Lab. Syst. 2016, 156, 241–248. [Google Scholar] [CrossRef]
- Porcel, M. Técnicas Quimiométricas para el Desarrollo de Nuevos Métodos Cinético-Espectrofotométricos de Análisis; Universidad Autónoma de Barcelona: Barcelona, Spain, 2001. [Google Scholar]
- Bro, R. Multi-Way Analysis in the Food Industry; University of Amsterdam: Amsterdam, The Netherlands, 1998. [Google Scholar]
- Bro, R.; Smilde, A.K.; Jong, S. De On the difference between low-rank and subspace approximation: Improved model for multi-linear PLS regression. Chemom. Intell. Lab. Syst. 2001, 58, 3–13. [Google Scholar] [CrossRef]
- Deisenroth, M.P.; Faisal, A.A.; Ong, C.S. Mathematics for Machine Learning; Cambridge University Press: Cambridge, UK, 2019. [Google Scholar]
- Wu, L.; He, J.; Liu, G.; Wang, S.; He, X. Detection of common defects on jujube using Vis-NIR and NIR hyperspectral imaging. Postharvest Biol. Technol. 2016, 112, 134–142. [Google Scholar] [CrossRef]
- Aggarwal, C.C. Neural Networks and Deep Learning; IBM T. J. Watson Research Center; Springer: New York, NY, USA, 2018; ISBN 978-3-319-94462-3. [Google Scholar]
- Huang, G.B.; Chen, Y.Q.; Babri, H.A. Classification ability of single hidden layer feedforward neural networks. IEEE Trans. Neural Netw. 2000, 11, 799–801. [Google Scholar] [CrossRef]
- Kingma, D.P.; Ba, J.L. Adam: A method for stochastic optimization. In Proceedings of the 3rd Internlational Conference Learning Representations ICLR 2015-Conference Track Proceedings, San Diego, CA, USA, 7–9 May 2015; pp. 1–15. [Google Scholar] [CrossRef]
- Patterson, J.; Gibson, A. Deep Learning A Practioner’s Approach; O’Reilly Media: Newton, MA, USA, 2019; Volume 53. [Google Scholar]


| Stage | Symptoms |
|---|---|
| 1 | Yellow spots (<1 mm in diameter) on the abaxial leaf surfaces. |
| 2 | Red to brown streaks from 1 to 5 mm. |
| 3 | Red to brown streaks greater than 5 mm. |
| 4 | Brown elliptical streaks on the abaxial leaf surface and black streaks on the adaxial leaf surface. |
| 5 | The streak is fully black with a yellow halo and has spread to the abaxial leaf surface. |
| 6 | The center of the streak is light gray surrounded by a black ring and a yellow halo. |
| Training | ||||
|---|---|---|---|---|
| Models | Accuracy | Precision | Sensitivity | F1 Score |
| PLS-PLR 1 | 0.98 | 0.98 | 1 | 0.99 |
| NPLS-DA | 0.9 | 1 | 0.88 | 0.94 |
| Linear SVM | 1 | 1 | 1 | 1 |
| Polynomial SVM | 1 | 1 | 1 | 1 |
| MLP 1 | 1 | 1 | 1 | 1 |
| MLP 2 | 1 | 1 | 1 | 1 |
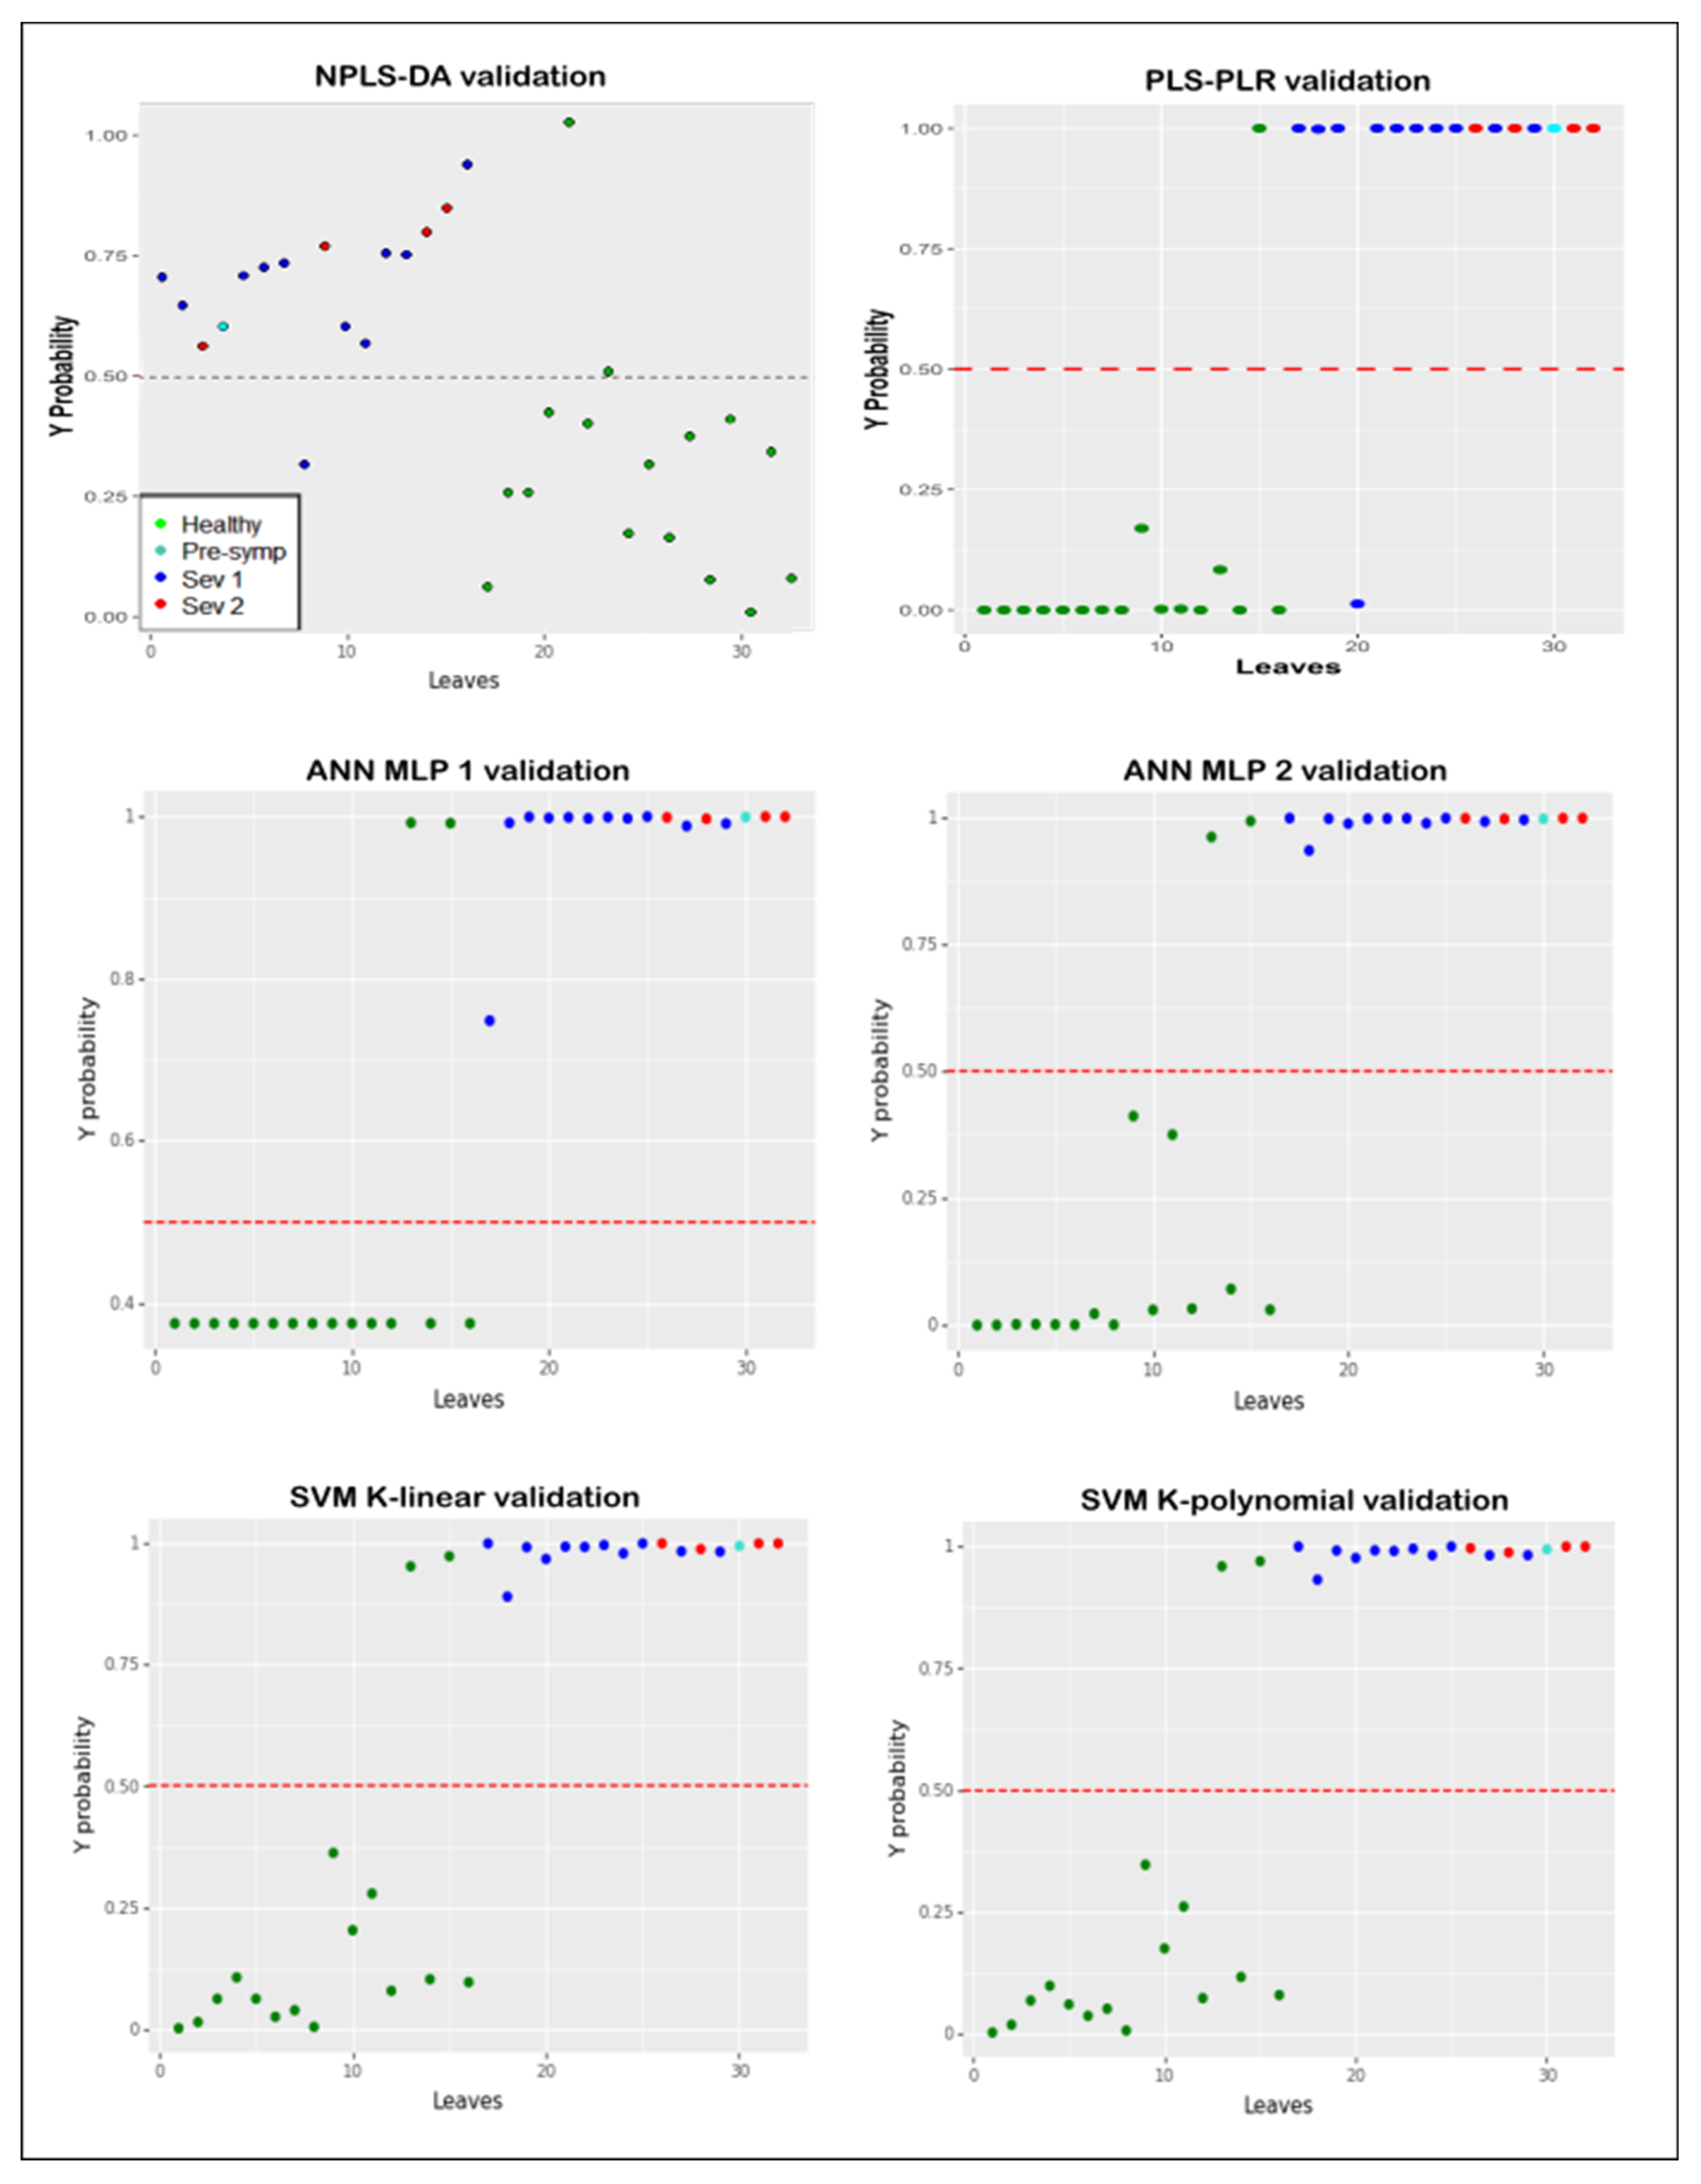
| Validation | |||||
|---|---|---|---|---|---|
| Models | Accuracy | Precision | Sensitivity | F1 Score | AUC |
| PLS-PLR | 0.94 | 0.94 | 0.94 | 0.94 | 0.94 |
| NPLS-DA | 0.91 | 0.88 | 0.94 | 0.91 | 0.91 |
| Linear SVM | 0.94 | 0.89 | 1 | 0.94 | 0.94 |
| Polynomial SVM | 0.94 | 0.89 | 1 | 0.94 | 0.94 |
| MLP 1 | 0.94 | 0.89 | 1 | 0.94 | 0.94 |
| MLP 2 | 0.94 | 0.89 | 1 | 0.94 | 0.94 |
| Classification Errors | ||||
|---|---|---|---|---|
| Model | Leaf Number | Probability | Prediction | Label |
| PLS-PLR | 15 | 0.9999 | Infected | healthy |
| 20 | 0.0061 | healthy | Infected | |
| Linear SVM | 13 | 0.9548 | Infected | healthy |
| 15 | 0.9757 | Infected | healthy | |
| MLP 1 | 13 | 0.9931 | Infected | healthy |
| 15 | 0.9942 | Infected | healthy | |
Publisher’s Note: MDPI stays neutral with regard to jurisdictional claims in published maps and institutional affiliations. |
© 2022 by the authors. Licensee MDPI, Basel, Switzerland. This article is an open access article distributed under the terms and conditions of the Creative Commons Attribution (CC BY) license (https://creativecommons.org/licenses/by/4.0/).
Share and Cite
Ugarte Fajardo, J.; Maridueña-Zavala, M.; Cevallos-Cevallos, J.; Ochoa Donoso, D. Effective Methods Based on Distinct Learning Principles for the Analysis of Hyperspectral Images to Detect Black Sigatoka Disease. Plants 2022, 11, 2581. https://doi.org/10.3390/plants11192581
Ugarte Fajardo J, Maridueña-Zavala M, Cevallos-Cevallos J, Ochoa Donoso D. Effective Methods Based on Distinct Learning Principles for the Analysis of Hyperspectral Images to Detect Black Sigatoka Disease. Plants. 2022; 11(19):2581. https://doi.org/10.3390/plants11192581
Chicago/Turabian StyleUgarte Fajardo, Jorge, María Maridueña-Zavala, Juan Cevallos-Cevallos, and Daniel Ochoa Donoso. 2022. "Effective Methods Based on Distinct Learning Principles for the Analysis of Hyperspectral Images to Detect Black Sigatoka Disease" Plants 11, no. 19: 2581. https://doi.org/10.3390/plants11192581
APA StyleUgarte Fajardo, J., Maridueña-Zavala, M., Cevallos-Cevallos, J., & Ochoa Donoso, D. (2022). Effective Methods Based on Distinct Learning Principles for the Analysis of Hyperspectral Images to Detect Black Sigatoka Disease. Plants, 11(19), 2581. https://doi.org/10.3390/plants11192581