Article

OsVTC1-1 Gene Silencing Promotes a Defense Response in Rice and Enhances Resistance to Magnaporthe oryzae

by
Kanyanat Lamanchai
1,
Nicholas Smirnoff
2,
Deborah L. Salmon
2,
Athipat Ngernmuen
3,
Sittiruk Roytrakul
4,
Kantinan Leetanasaksakul
4,
Suthathip Kittisenachai
4 and
Chatchawan Jantasuriyarat
1,5,*
1
Department of Genetics, Faculty of Science, Kasetsart University, Chatuchak, Bangkok 10900, Thailand
2
Biosciences, College of Life and Environmental Sciences, University of Exeter, Exeter EX4 4QD, UK
3
Department of Zoology, Faculty of Science, Kasetsart University, Chatuchak, Bangkok 10900, Thailand
4
Functional Proteomics Technology, National Center for Genetic Engineering and Biotechnology, National Science and Technology Development Agency, 113 Paholyothin Road, Klong 1, Klong Luang, Pathumthani 12120, Thailand
5
Center for Advanced Studies in Tropical Natural Resources, National Research University-Kasetsart (CASTNAR, NRU-KU), Kasetsart University, Chatuchak, Bangkok 10900, Thailand
*
Author to whom correspondence should be addressed.
Plants 2022, 11(17), 2189; https://doi.org/10.3390/plants11172189
Submission received: 13 July 2022 / Revised: 13 August 2022 / Accepted: 23 August 2022 / Published: 24 August 2022
(This article belongs to the Special Issue Molecular Basis of Disease Resistance in Plants)

Abstract

:
Rice blast disease is a serious disease in rice caused by Magnaporthe oryzae (M. oryzae). Ascorbic acid (AsA), or vitamin C, is a strong antioxidant that prevents oxidative damage to cellular components and plays an essential role in plant defense response. GDP-D-mannose pyrophosphorylase (GMP or VTC1) is an enzyme that generates GDP-D-mannose for AsA, cell wall, and glycoprotein synthesis. The OsVTC1 gene has three homologs in the rice genome: OsVTC1-1, OsVTC1-3, and OsVTC1-8. Using OsVTC1-1 RNAi lines, this study investigated the role of the OsVTC1-1 gene during rice blast fungus inoculation. The OsVTC1-1 RNAi inoculated with rice blast fungus induced changes to cell wall monosaccharides, photosynthetic efficiency, reactive oxygen species (ROS) accumulation, and malondialdehyde (MDA) content. Additionally, the OsVTC1-1 RNAi lines were shown to be more resistant to rice blast fungus than the wild type. Genes and proteins related to defense response, plant hormone synthesis, and signaling pathways, especially salicylic acid and jasmonic acid, were up-regulated in the OsVTC1-1 RNAi lines after rice blast inoculation. These results suggest that the OsVTC1-1 gene regulates rice blast resistance through several defense mechanisms, including hormone synthesis and signaling pathways.

1. Introduction

Rice blast is one of the most devastating diseases affecting rice production worldwide. It is caused by a filamentous ascomycete fungus, Magnaporthe oryzae (M. oryzae) [1]. Rice blast fungus causes lesions on all aboveground plant physiology, including the leaves, leaf collars, necks, panicles, and seeds. The symptoms on leaves appear as diamond-shaped lesions, initially, but then the lesions extend and kill the entire leaf [2]. There are several strategies that plants employ to detect and combat invading pathogens, such as impenetrable barriers, phytoalexins, callose deposition, and production of pathogenesis-related (PR) proteins [3,4,5]. An efficient mechanism to prevent pathogen invasion is hypersensitivity response (HR), which results in rapid cell death at the pathogen attack site to restrict pathogen invasion [6,7,8]. During HR, reactive oxygen species (ROS) are rapidly generated and cause oxidative damage through interactions with nucleic acids, proteins, and lipids [9,10,11].
A potent antioxidant, ascorbic acid (AsA), also known as vitamin C, plays an essential role in many biological processes, such as participating as an enzyme cofactor, photosynthesis, cell wall growth, cell expansion, and response to biotic and abiotic stresses [12,13,14]. Plants synthesize AsA primarily via the L-galactose pathway or the Smirnoff-Wheeler pathway [15,16]. Enzymes in the L-galactose pathway consist of phosphoglucose isomerase (PGI), phosphomannose isomerase (PMI), phosphomannose mutase (PMM), GDP-mannose pyrophosphorylase (GMP or VTC1), GDP-mannose-3′,5′-epimerase (GME), GDP-L-galactose phosphorylase (GGP or VTC2), L-galactose-1-phosphate phosphatase (GPP or VTC4), L-galactose dehydrogenase (GDH), and L-galactono-1,4-lactone dehydrogenase (GLDH). However, VTC1 catalyzes the formation of GDP-D-mannose, which serves as a precursor for AsA synthesis and is critical for cell wall polysaccharide and glycoprotein synthesis [17]. There are three OsVTC1 homologous genes in the rice genome: OsVTC1-1, OsVTC1-3, and OsVTC1-8. AsA content is increased in OsVTC1-1 and OsVTC1-3 overexpression lines and not OsVTC1-8 overexpression lines, indicating that OsVTC1-1 and OsVTC1-3 are involved in plant AsA synthesis. OsVTC1-1 and OsVTC1-3 are involved in the production of AsA in rice leaves and roots, respectively [18]. Several studies have investigated the function of VTC1 gene in plants. Down-regulation of OsVTC1-1 genes led to increased superoxide (O2) anion and malondialdehyde (MDA) levels as well as decreased chlorophyll levels as a result of decreased salt tolerance [19]. A previous study also showed that the overexpression of tomato GMPase (VTC1) increased the AsA content in tobacco and led to increased thermal tolerance [20]. Barth et al. [21] reported that bacterial and fungal hyphal development was suppressed in vtc1 Arabidopsis mutants with lower levels of AsA. Similarly, the presence of dead cells and an increased resistance to Pseudomonas syringae infection in Arabidopsis were observed in vtc1 mutants [22]. These studies indicate that VTC1 is vital in plant responses to abiotic and biotic stresses.
Many biological processes are altered after pathogen infection [23]. Upon infection with a biotrophic fungal pathogen, plants lose their ability to photosynthesize and mobilize nutrients [24]. Cell walls, as a physical barrier, are the first plant defense mechanism against pathogens. Upon infection, plants accumulate reinforcing polymers, such as callose and phenolic compounds, for cell wall strengthening [25,26]. High sugar content in plant tissues is associated with plant resistance, serving as substrates for cell wall polymers, signaling molecules, and energy for defense responses [27,28]. Furthermore, ROS accumulation in the plant’s subcellular compartments, which is toxic to the cells, acts as signaling molecules during defense responses [29]. A previous study reported that ROS accumulation and cell death were observed in resistant accessions after infection with Alternaria brassicae in Arabidopsis [30]. ROS also promote lipid peroxidation, detectable by measuring malondialdehyde (MDA) content [31]. In incompatible rice and M. oryzae interactions, ROS accumulation and increased MDA content were measured, which ultimately resulted in HR cell death [32]. Additionally, plant hormones are pivotal in regulating plant defense against various pathogens [33]. Among several plant hormones, salicylic acid (SA) and jasmonic acid (JA) are key in defense against insect herbivores and microbial pathogens [34].
Although, the above studies revealed that pathogen infections induce several defense mechanisms in plants, it remains unclear how AsA synthesis is affected during rice defense responses. OsVTC1-1 in the AsA synthesis pathway might affect defenses against rice blast infections through several processes. Therefore, the aim of the present study was to investigate the role of OsVTC1-1 during rice blast infection. We compared cell wall monosaccharide composition, photosynthetic efficiency, AsA content, superoxide anion (O2) levels, malondialdehyde (MDA) content, transcriptome, and proteome between wild type (WT) and OsVTC1-1 RNAi lines after rice blast fungus infection. OsVTC1-1 RNAi rice seeds, which knock-down the OsVTC1-1 gene, were obtained from Qin et al. [18]. Due to the antioxidant properties of AsA, the reduction in OsVTC1-1 gene expression should improve the defense of plants against rice blast infections. Reducing AsA levels increases ROS and MDA accumulation in HR cell death and protects photosynthesis machinery. In addition, transcriptome and proteome profiles should alter in the OsVTC1-1 RNAi line as the OsVTC1-1 RNAi lines enhance resistance to rice blast fungus infections. Several genes and proteins were differentially expressed, especially those involved in defense mechanisms, hormone synthesis, and signaling pathways. These results demonstrate the important role of OsVTC1-1 in rice defense responses during rice blast fungus infections.

2. Results

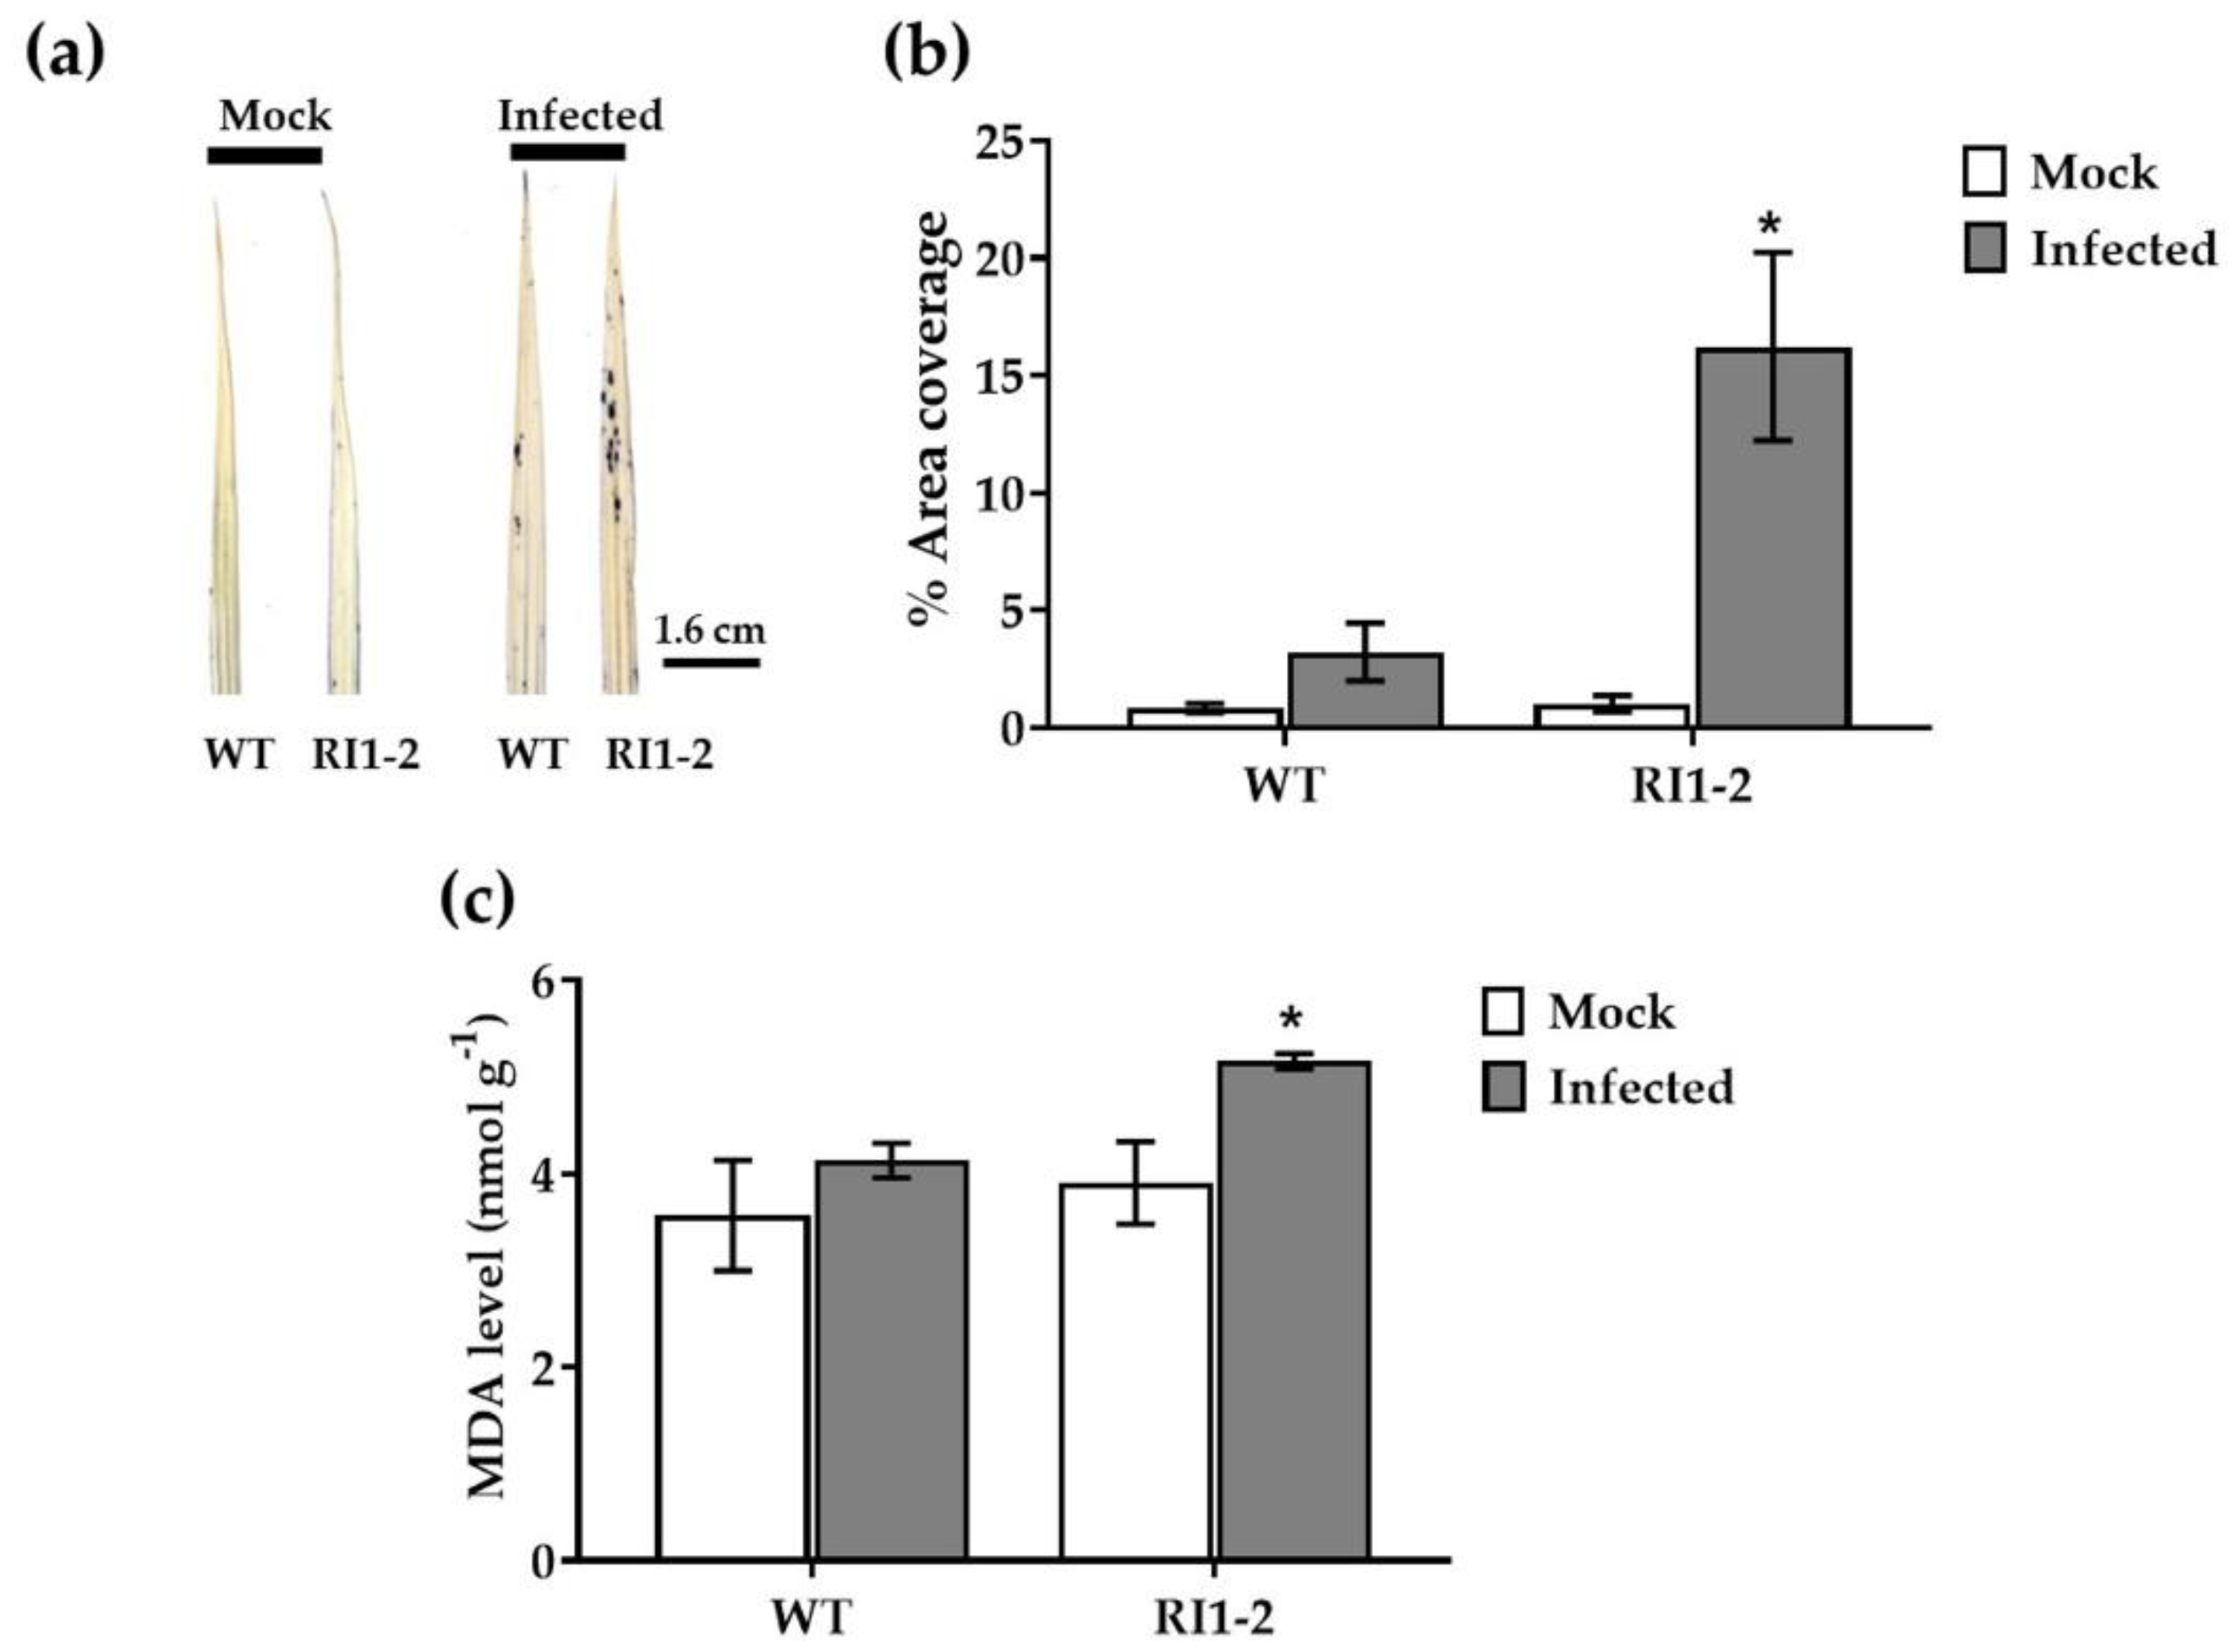
2.1. Pathogenicity Assay

Rice blast disease symptoms were observed 7 days after inoculation. Lesions were observed in both WT and OsVTC1-1 RNAi lines caused by the rice blast Guy11 isolate. RI1-2 and RI1-3 lines, however, had smaller and fewer lesions than WT (Figure 1a). Similar results were observed in leaves infected with rice blast 10100 isolate from the RI1-2 line. Khao Dawk Mali 105 (KDML105) and Jao Hom Nin (JHN) were used as susceptible and resistant controls, respectively (Figure 1b). A mock inoculation showed no symptoms on leaves (Figure 1). The results show that OsVTC1-1 RNAi lines have enhanced disease resistance against rice blast fungus.

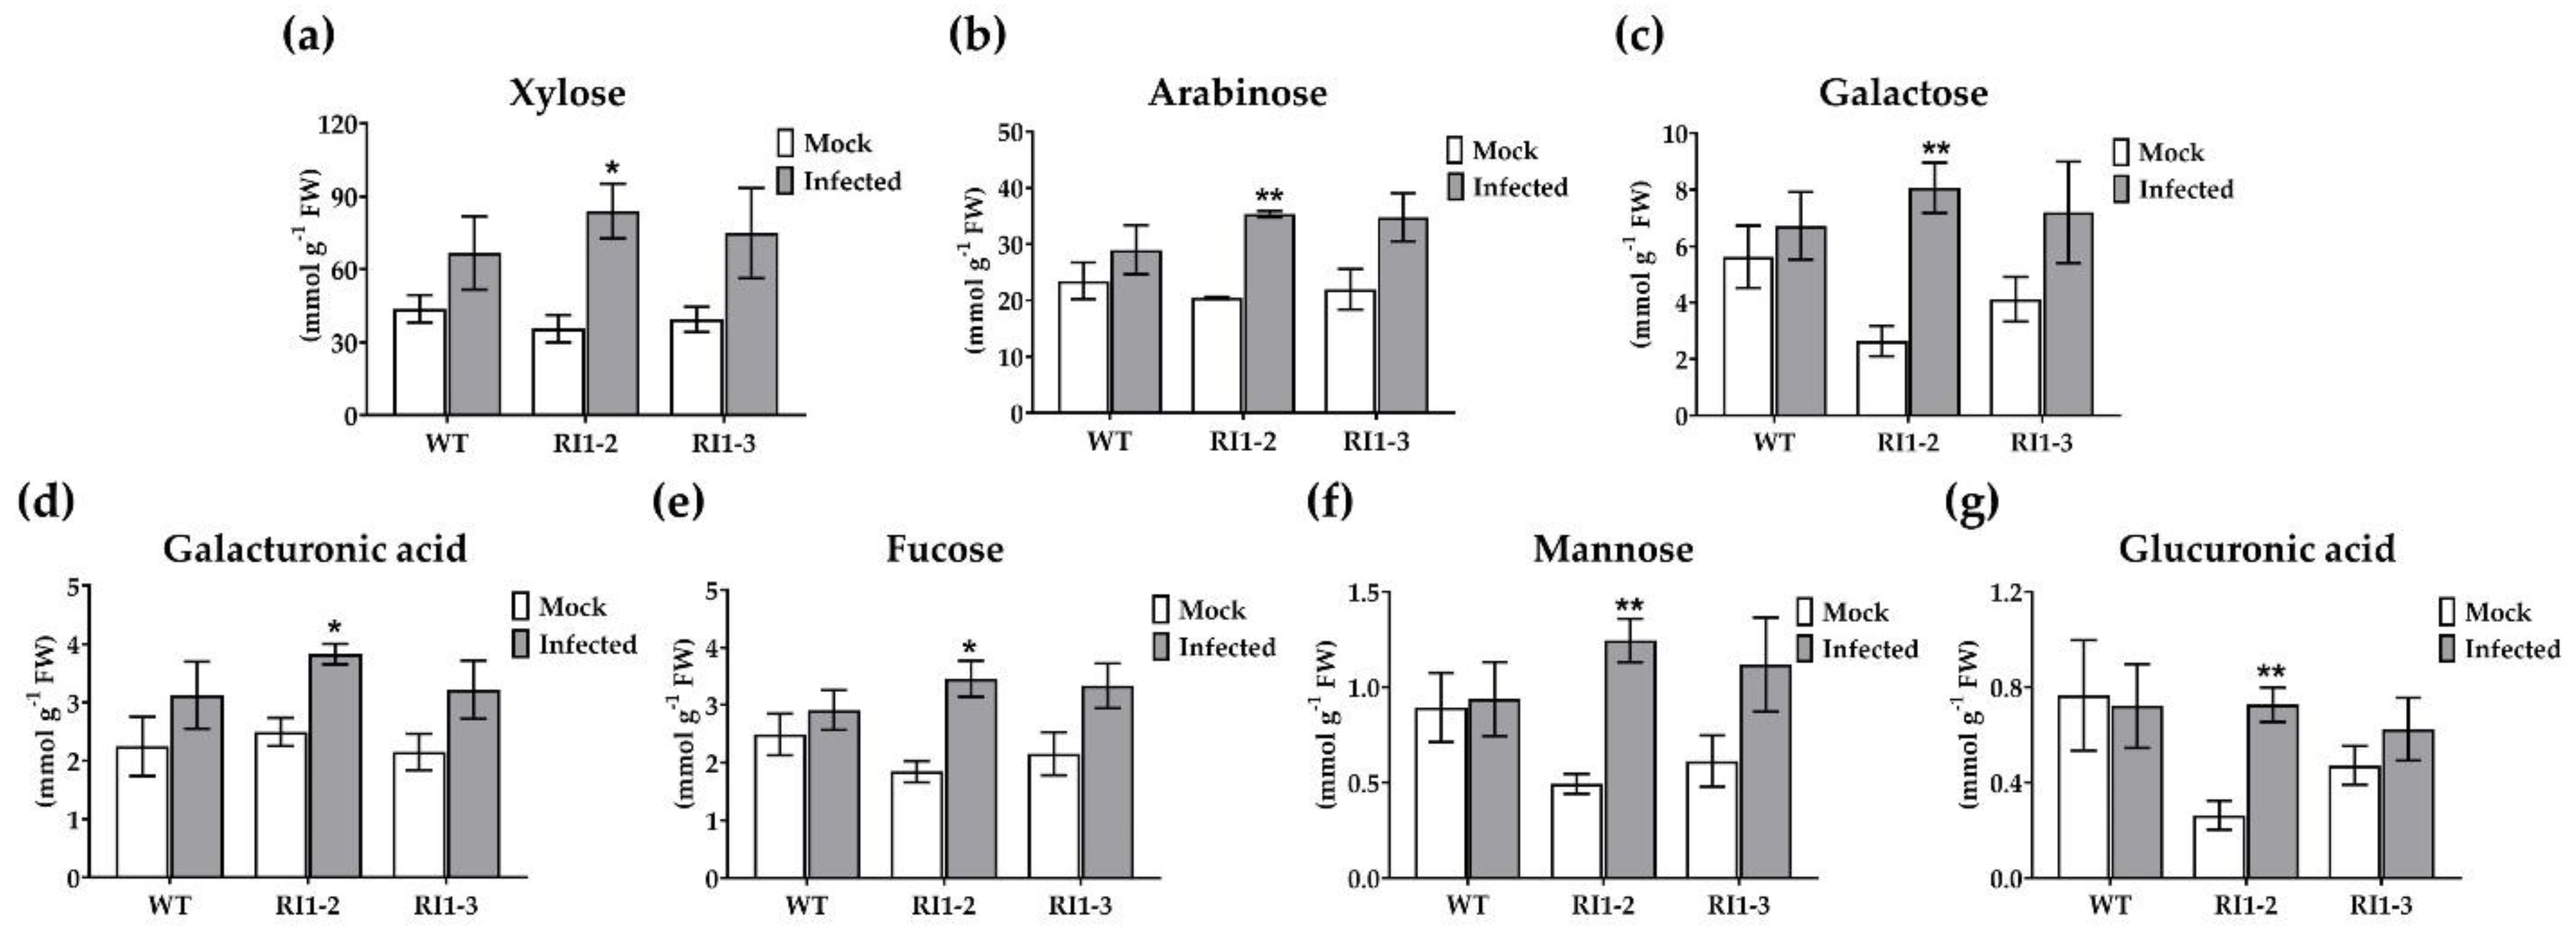
2.2. Cell Wall Sugar Composition Analysis

To assess whether the OsVTC1-1 gene is involved in a cell-wall-associated defense mechanism against rice blast fungus, the composition of cell walls at 4 days after inoculation with rice blast fungus in WT and OsVTC1-1 RNAi lines was investigated. Xylose, arabinose, galactose, galacturonic acid, fucose, mannose, and glucuronic acid were measured as monosaccharides in the cell wall. The highest proportion of xylose was found in hydrolyzed cell wall samples, followed by arabinose and galactose (Figure 2a–c). Comparison between WT rice and the OsVTC1-1 RNAi line in a mock inoculation was previously reported [35], in which the OsVTC1-1 RNAi line showed lower levels of galactose, mannose, and glucuronic acid than WT rice (Figure 2c,f,g). After rice blast inoculation, cell wall monosaccharide compositions were increased in both WT rice and the OsVTC1-1 RNAi line (Figure 2a–g). Moreover, all cell wall monosaccharide compositions were significantly higher in the OsVTC1-1 RNAi line than in the WT after rice blast fungus infection (Figure 2a–g). These results suggest that OsVTC1-1 is involved in monosaccharide deposition in the cell wall during rice blast infection.

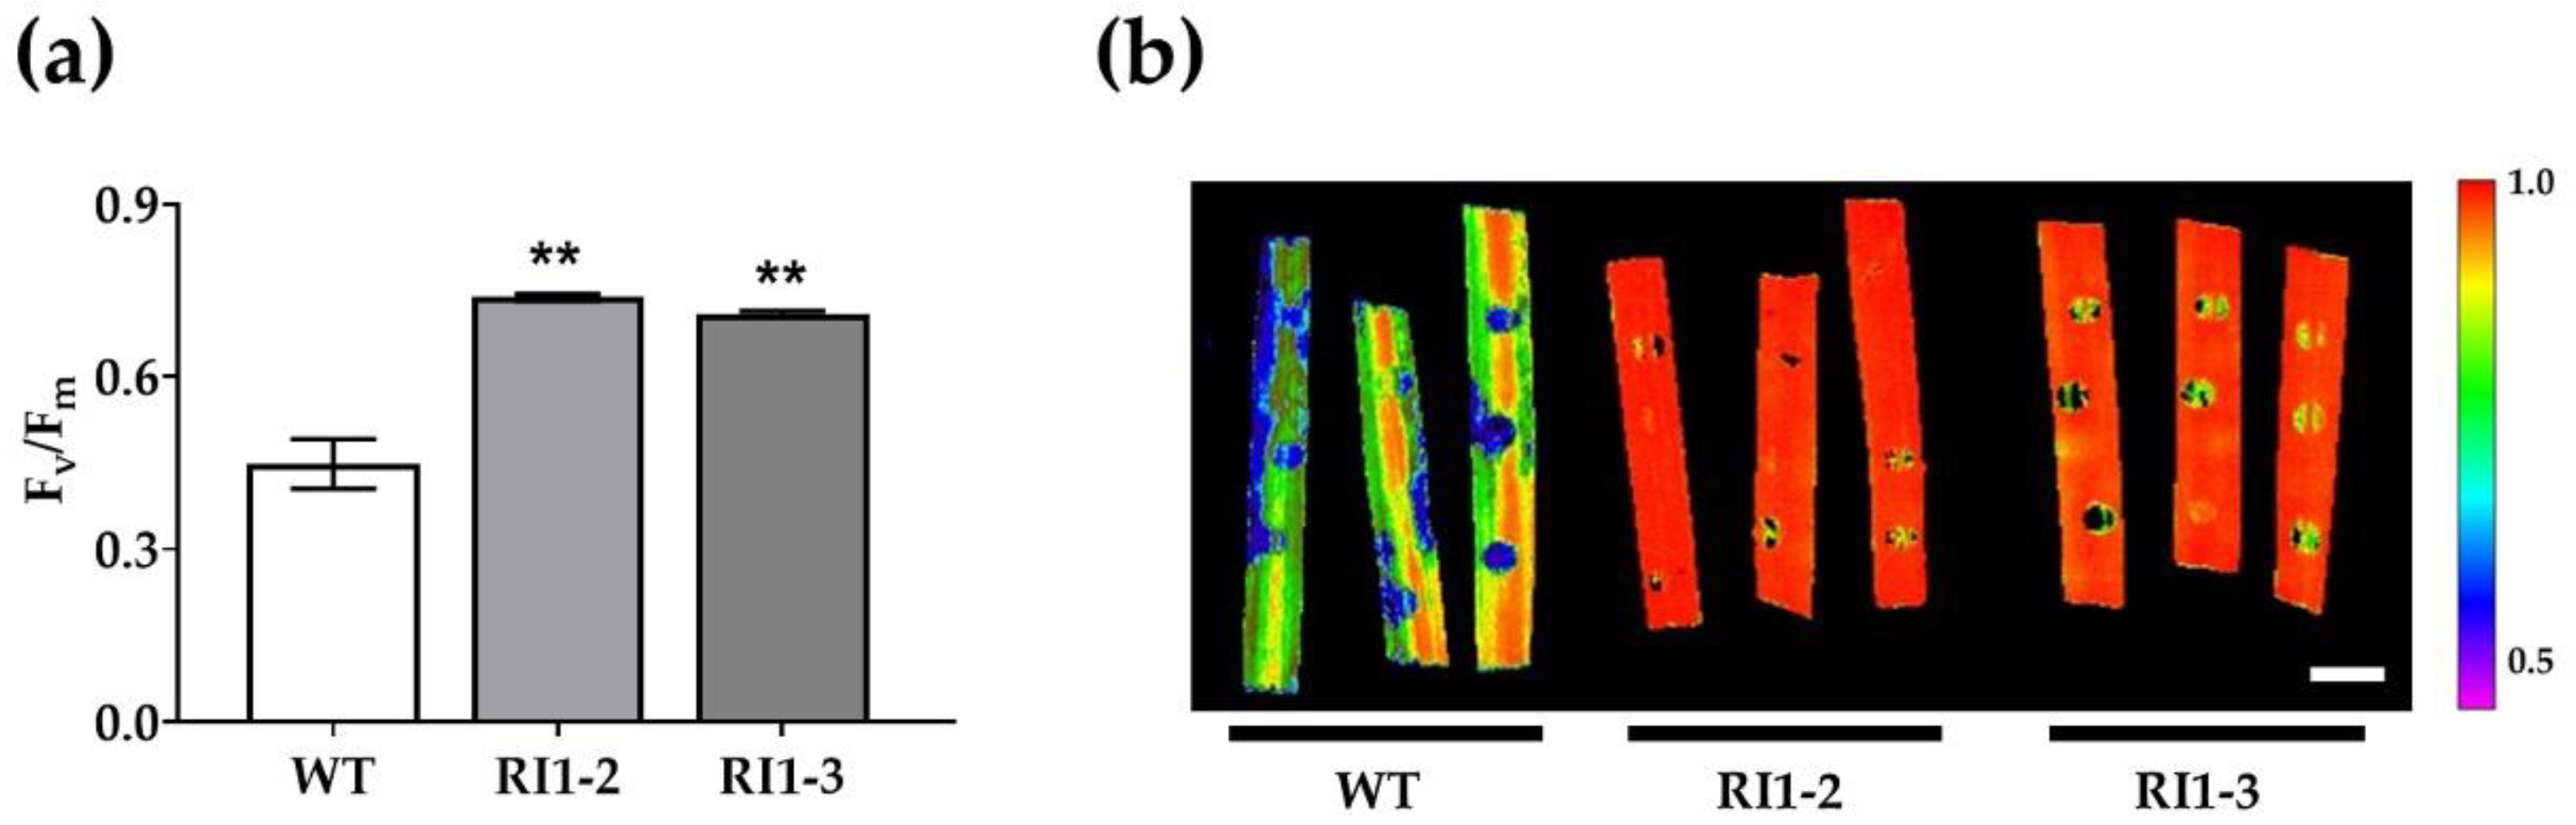
2.3. Photosynthetic Efficiency Analysis

Maximum quantum efficiency of photosystem II (PSII) was measured by the Fv/Fm parameter and used to assess chlorophyll fluorescence to compare photosynthetic efficiency between WT and OsVTC1-1 RNAi lines at 5 days post inoculation. The OsVTC1-1 RNAi lines showed higher maximum efficiency of PSII (Fv/Fm) in infected leaves compared to the WT (Figure 3a). According to fluorescence imaging of chlorophyll fluorescence, the photosynthetic system of WT plants was affected by M. oryzae infection, but OsVTC1-1 RNAi plants were not affected (Figure 3b). These results suggest that the reduction in OsVTC1-1 gene expression protected photosynthetic efficiency in OsVTC1-1 RNAi lines during M. oryzae infection.

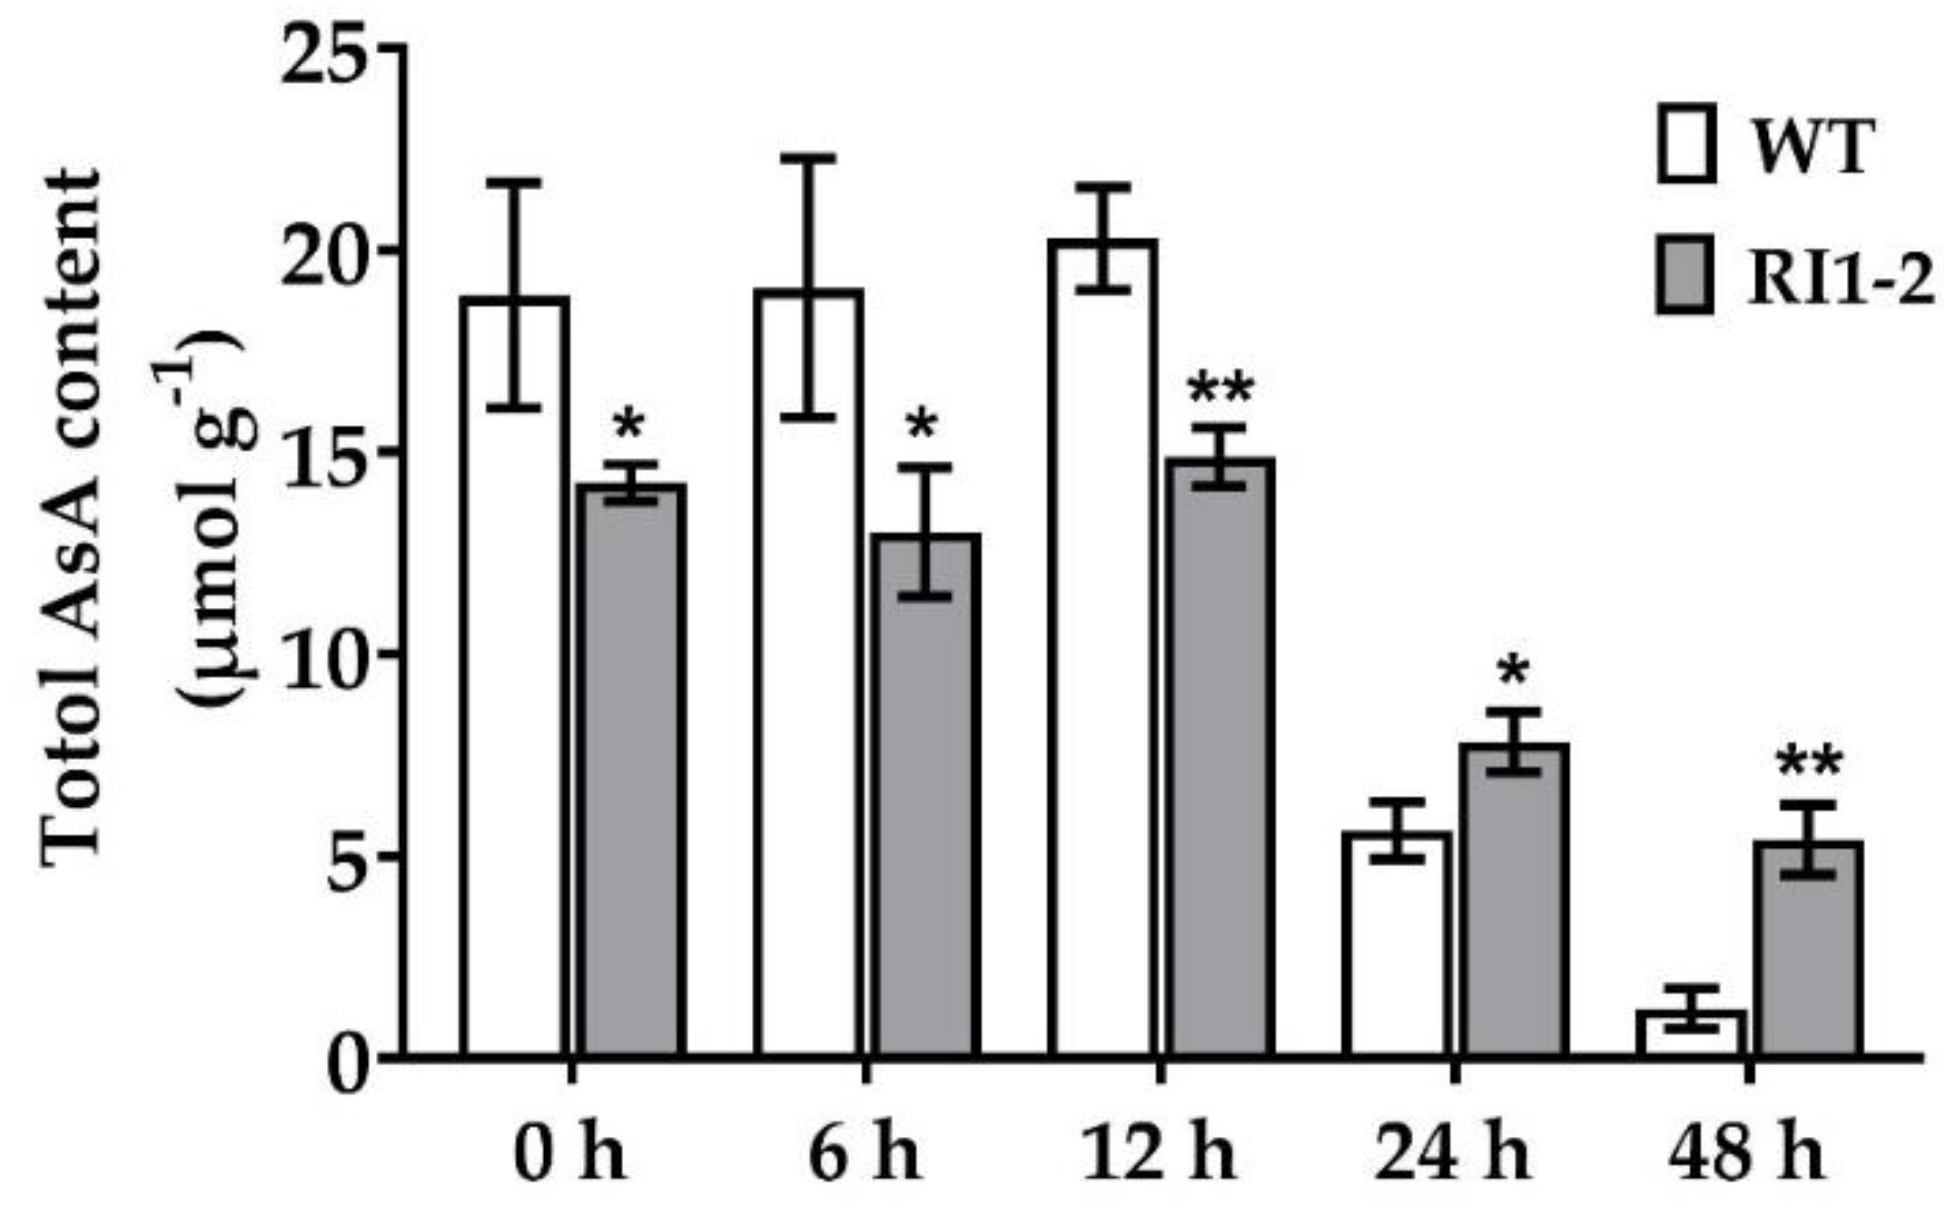
2.4. Measurement of Ascorbic Acid Content

The AsA content was measured in WT and OsVTC1-1 RI1-2 line at 0, 6, 12, 24, and 48 h post inoculation (hpi) with the rice blast 10100 isolate. AsA content was significantly different between the WT and OsVTC1-1 RI1-2 line at all time points (Figure 4). A high AsA content was observed at 6 and 12 hpi, followed by a dramatic decline at 24 hpi. AsA contents were lower in the OsVTC1-1 RNAi line than in the WT at 0, 6, and 12 hpi, but they were higher at 24 and 48 hpi in the OsVTC1-1 RNAi line when compared to the WT (Figure 4). These results suggest that AsA is significant during rice blast fungus infection.

2.5. Detection of Superoxide Anion by Nitroblue Tetrazolium (NBT) Staining and Measurement of Malondialdehyde (MDA) Content

To investigate the mechanism of OsVTC1-1 in response to rice blast fungal infection, O2 accumulation was measured in WT and RI1-2 leaves at 24 hpi with the 10100 isolate. The OsVTC1-1 RNAi line accumulated more O2 than the WT (Figure 5a,b, Table S1). A reduction in OsVTC1-1 activity leads to a higher ROS accumulation after rice blast inoculation.
The production of malondialdehyde (MDA), a byproduct of lipid peroxidation, was measured in WT and OsVTC1-1 RI1-2 line at 24 hpi. After rice blast inoculation, there was no change in MDA content in WT leaves. Meanwhile, a significant difference was observed in MDA content between the uninfected and infected leaves of the RI1-2 line (Figure 5c). A higher level of MDA was produced in infected leaves compared to uninfected leaves. These results indicate that reducing the AsA level caused the OsVTC1-1 RNAi line to suffer more from cell damage than WT after rice blast inoculation.

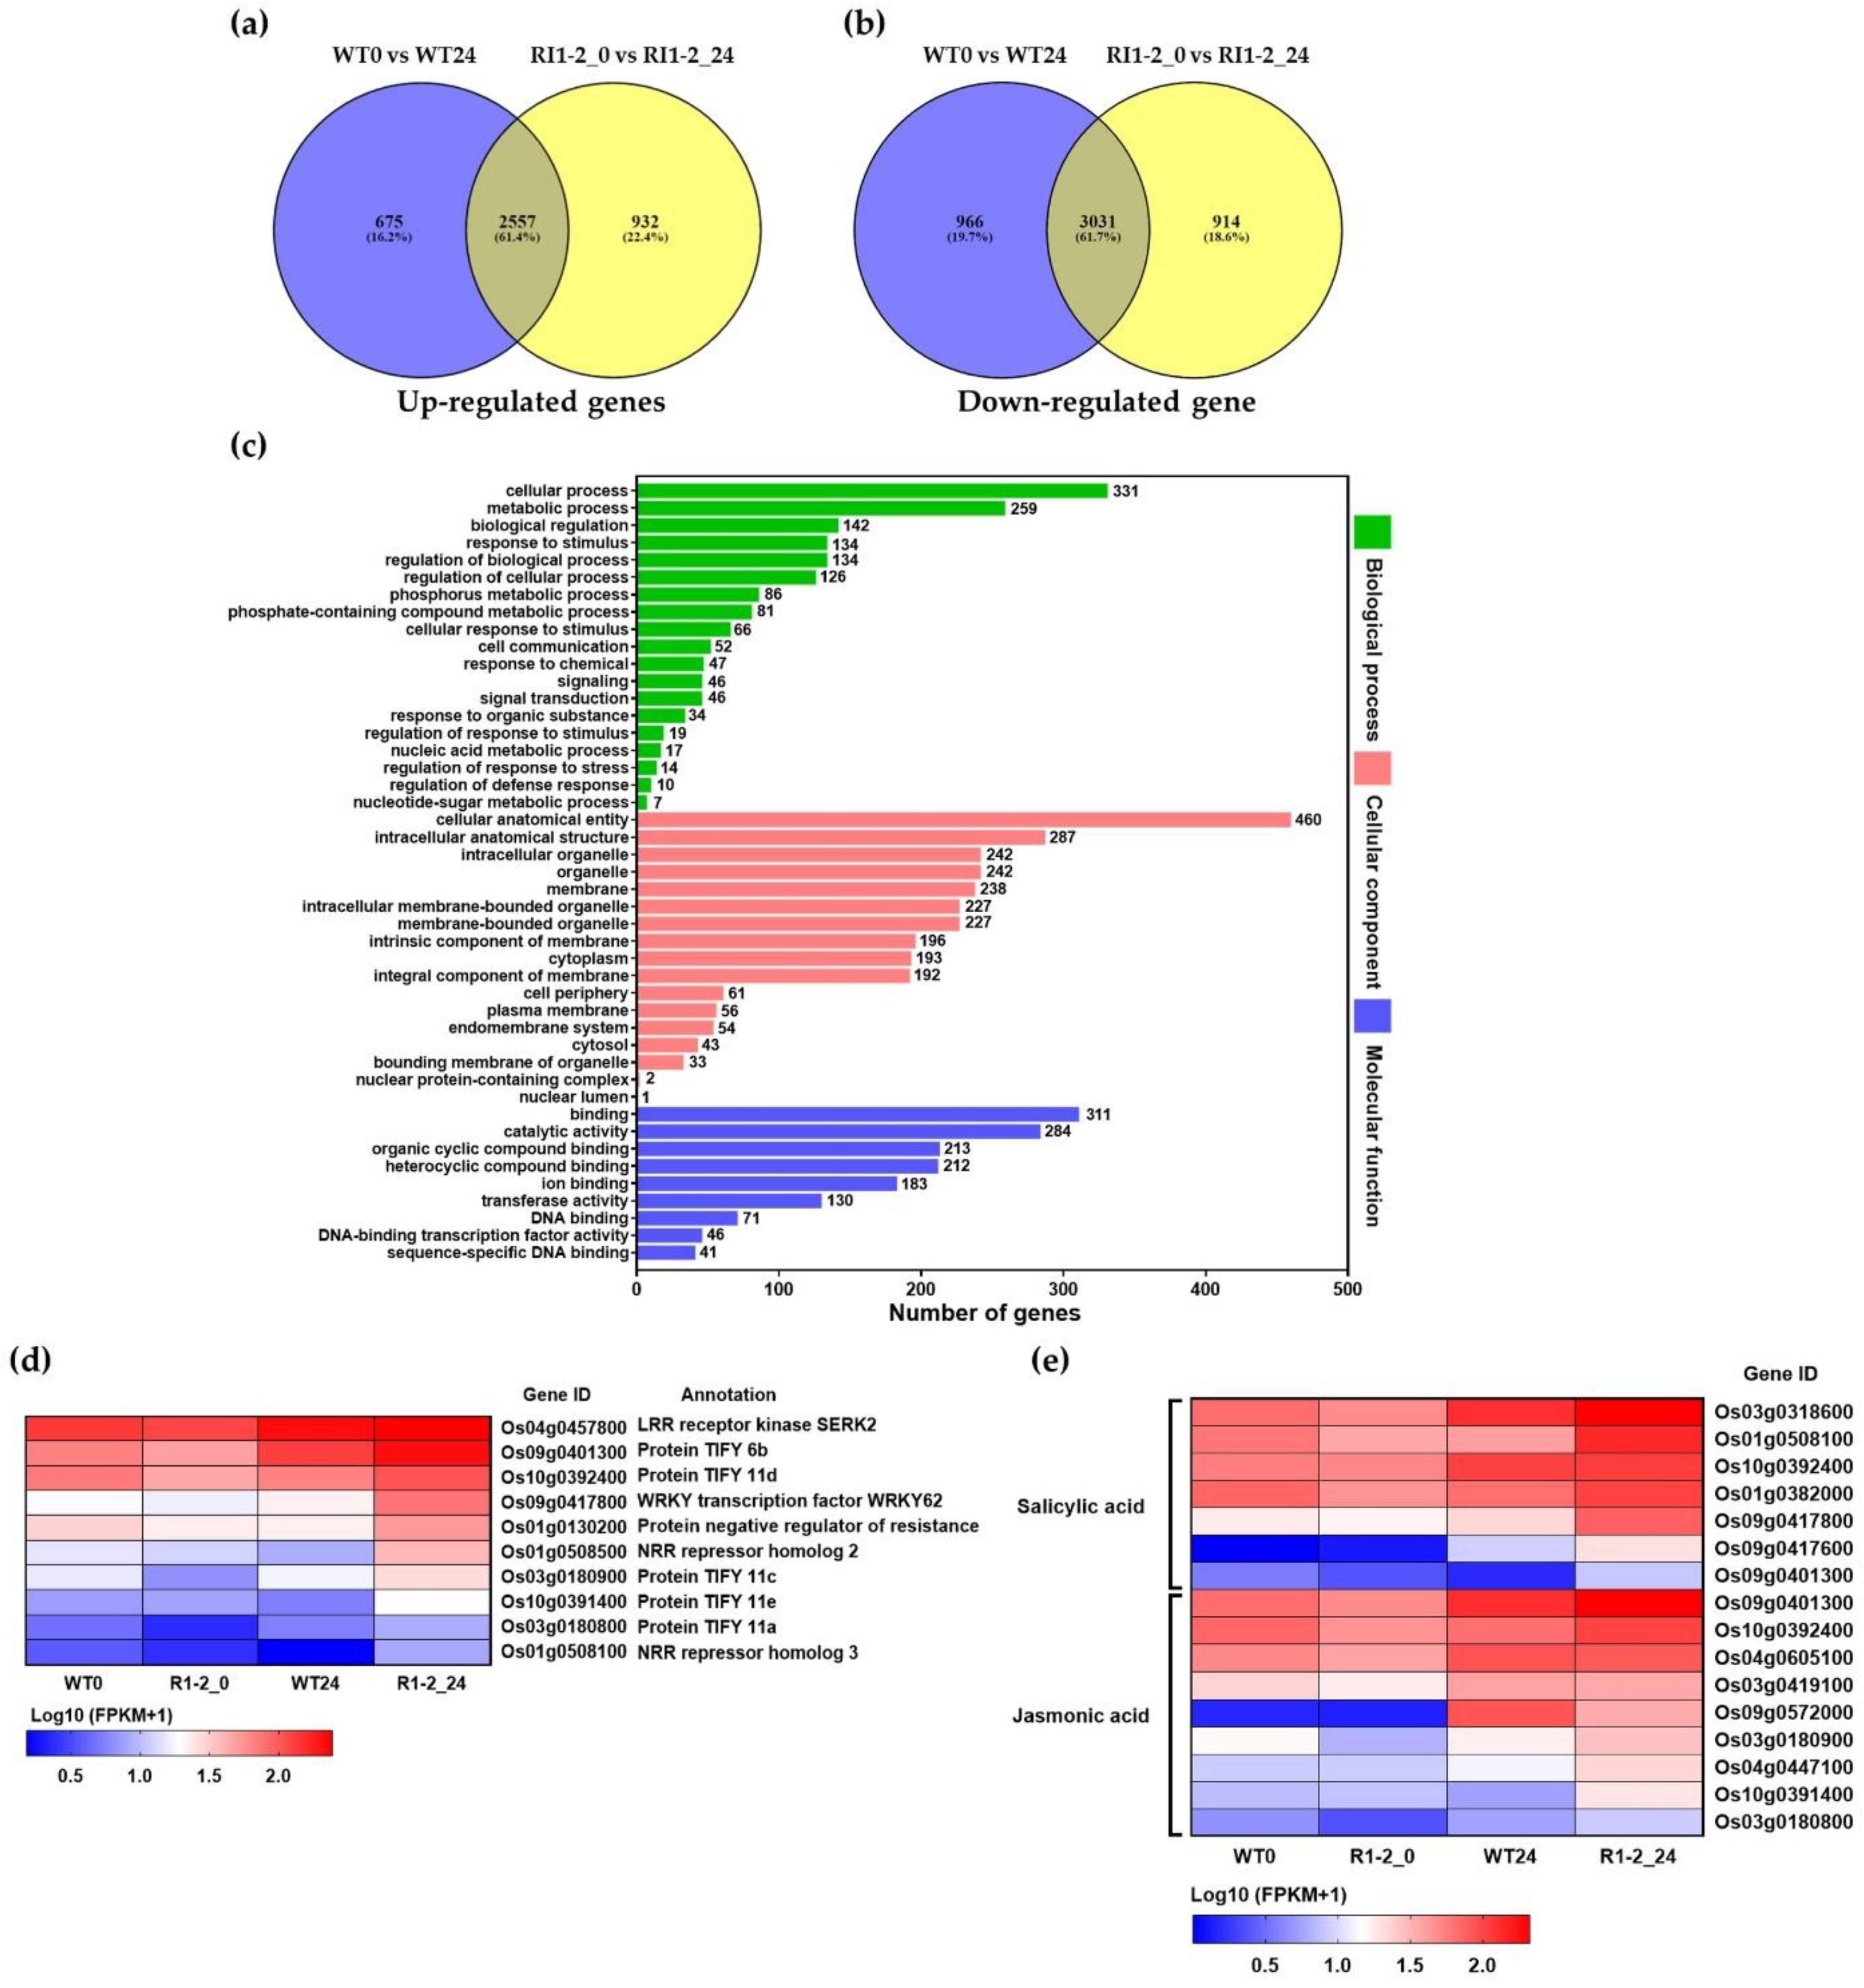
2.6. Transcriptome Analysis

Transcriptome analysis of differentially expressed genes (DEGs) between rice-blast-inoculated WT and OsVTC1-1 RI1-2 plants was analyzed at 0 and 24 hpi. The RNA-seq data showed that the raw sequence reads of each sample ranged from 43,787,008 to 64,022,678. Reads were filtered and mapped to a reference sequence and more than 90% of the reads aligned successfully with the reference genome (Table S2). In total, there are 9075 DEGs in WT and RI1-2 represented by 4164 up-regulated DEGs and 4911 down-regulated DEGs. Among these DEGs, 675 up-regulated DEGs and 966 down-regulated DEGs were only presented in WT, while 932 up-regulated DEGs and 914 down-regulated DEGs were only presented in RI1-2. Additionally, 2557 up-regulated DEGs and 3031 down-regulated DEGs overlapped both in WT and RI1-2 (Figure 6a,b). Principal component analysis (PCA) was performed to verify the similarity between three replicates based on the fragments per kilobase of transcript per million mapped read (FPKM) values transformed into log10 (FPKM + 1). The data of 100 common genes from the WT and OsVTC1-1 RI1-2 line was clustered closely at 0 and 24 hpi and was grouped by time point on the PCA plot (Figure S1). The gene expression levels of 100 common genes were similar among three replicates based on log10 (FPKM + 1) values for WT and OsVTC1-1 RI1-2 lines at 0 and 24 hpi (Figure S2, Table S3).
Table 1 lists the top 20 up- and down-regulated DEGs found only in the OsVTC1-1 RI1-2 line ranked by log2FC value. Several defense-related genes were up-regulated at 24 hpi in the OsVTC1-1 RI1-2 line, including germin-like protein 8-10, peroxidase, cytochrome P450 family, chitinase-4 or pathogenesis-related (PR)-3, glycoside hydrolase, chymotrypsin protease inhibitor, germin-like protein 8-5, terpene synthase, and germin-like protein 8-7. Several DEGs were down-regulated in OsVTC1-1 RI1-2, including S-like ribonuclease, tonoplast membrane integral protein, UDP-glucuronosyl/UDP-glucosyltransferase, aldo/keto reductase, and flavin-containing monooxygenase (Table 1).
Gene ontology (GO) enrichment analysis was used to classify the 932 up-regulated DEGs between 0 and 24 hpi in the OsVTC1-1 RI1-2 line (Table S4). DEGs were divided into three major categories: biological process, cellular component, and molecular function (Figure 6c). Among the three groups, DEGs were further subdivided into 19 subgroups of biological process, 17 subgroups of cellular component, and 9 subgroups of molecular function. The three most abundant biological process subgroups were cellular process (331 DEGs), metabolic process (259 DEGs), and biological regulation (142 DEGs). In addition, 10 DEGs in regulation of defense response subgroup were also enriched in biological process, including LRR receptor kinase, protein TIFY, WRKY transcription factor WRKY62, protein negative regulator of resistance, and NRR repressor (Figure 6d). A major subgroup of cellular component is cellular anatomical entity (460 DEGs), followed by intracellular anatomical structure (287 DEGs) and intracellular organelle (242 DEGs). In terms of molecular function, the three most significant subgroups were binding (311 DEGs), catalytic activity (284 DEGs), and organic cyclic compound binding (213 DEGs) (Figure 6c).
An analysis of plant reactome pathways was conducted to visualize up-regulated DEGs between 0 and 24 hpi with rice blast fungus in the OsVTC1-1 RI1-2 line. A total of 932 DEGs was identified in 82 plant reactome pathways (Table S5). The top 10 enriched pathways include metabolism and regulation; hormone signaling, transport, and metabolism; carbohydrate metabolism; growth and developmental processes; reproductive structure development; seed development; seed size regulation; amino acid metabolism; jasmonic acid signaling; and salicylic acid signaling (Figure S3a). Additionally, a number of DEGs was also assigned to enzymes involved in the synthesis and signaling of hormones, including SA and JA (Figure 6e). Moreover, DEGs involved in cellulose and phenylpropanoid synthesis were identified (Table S5).

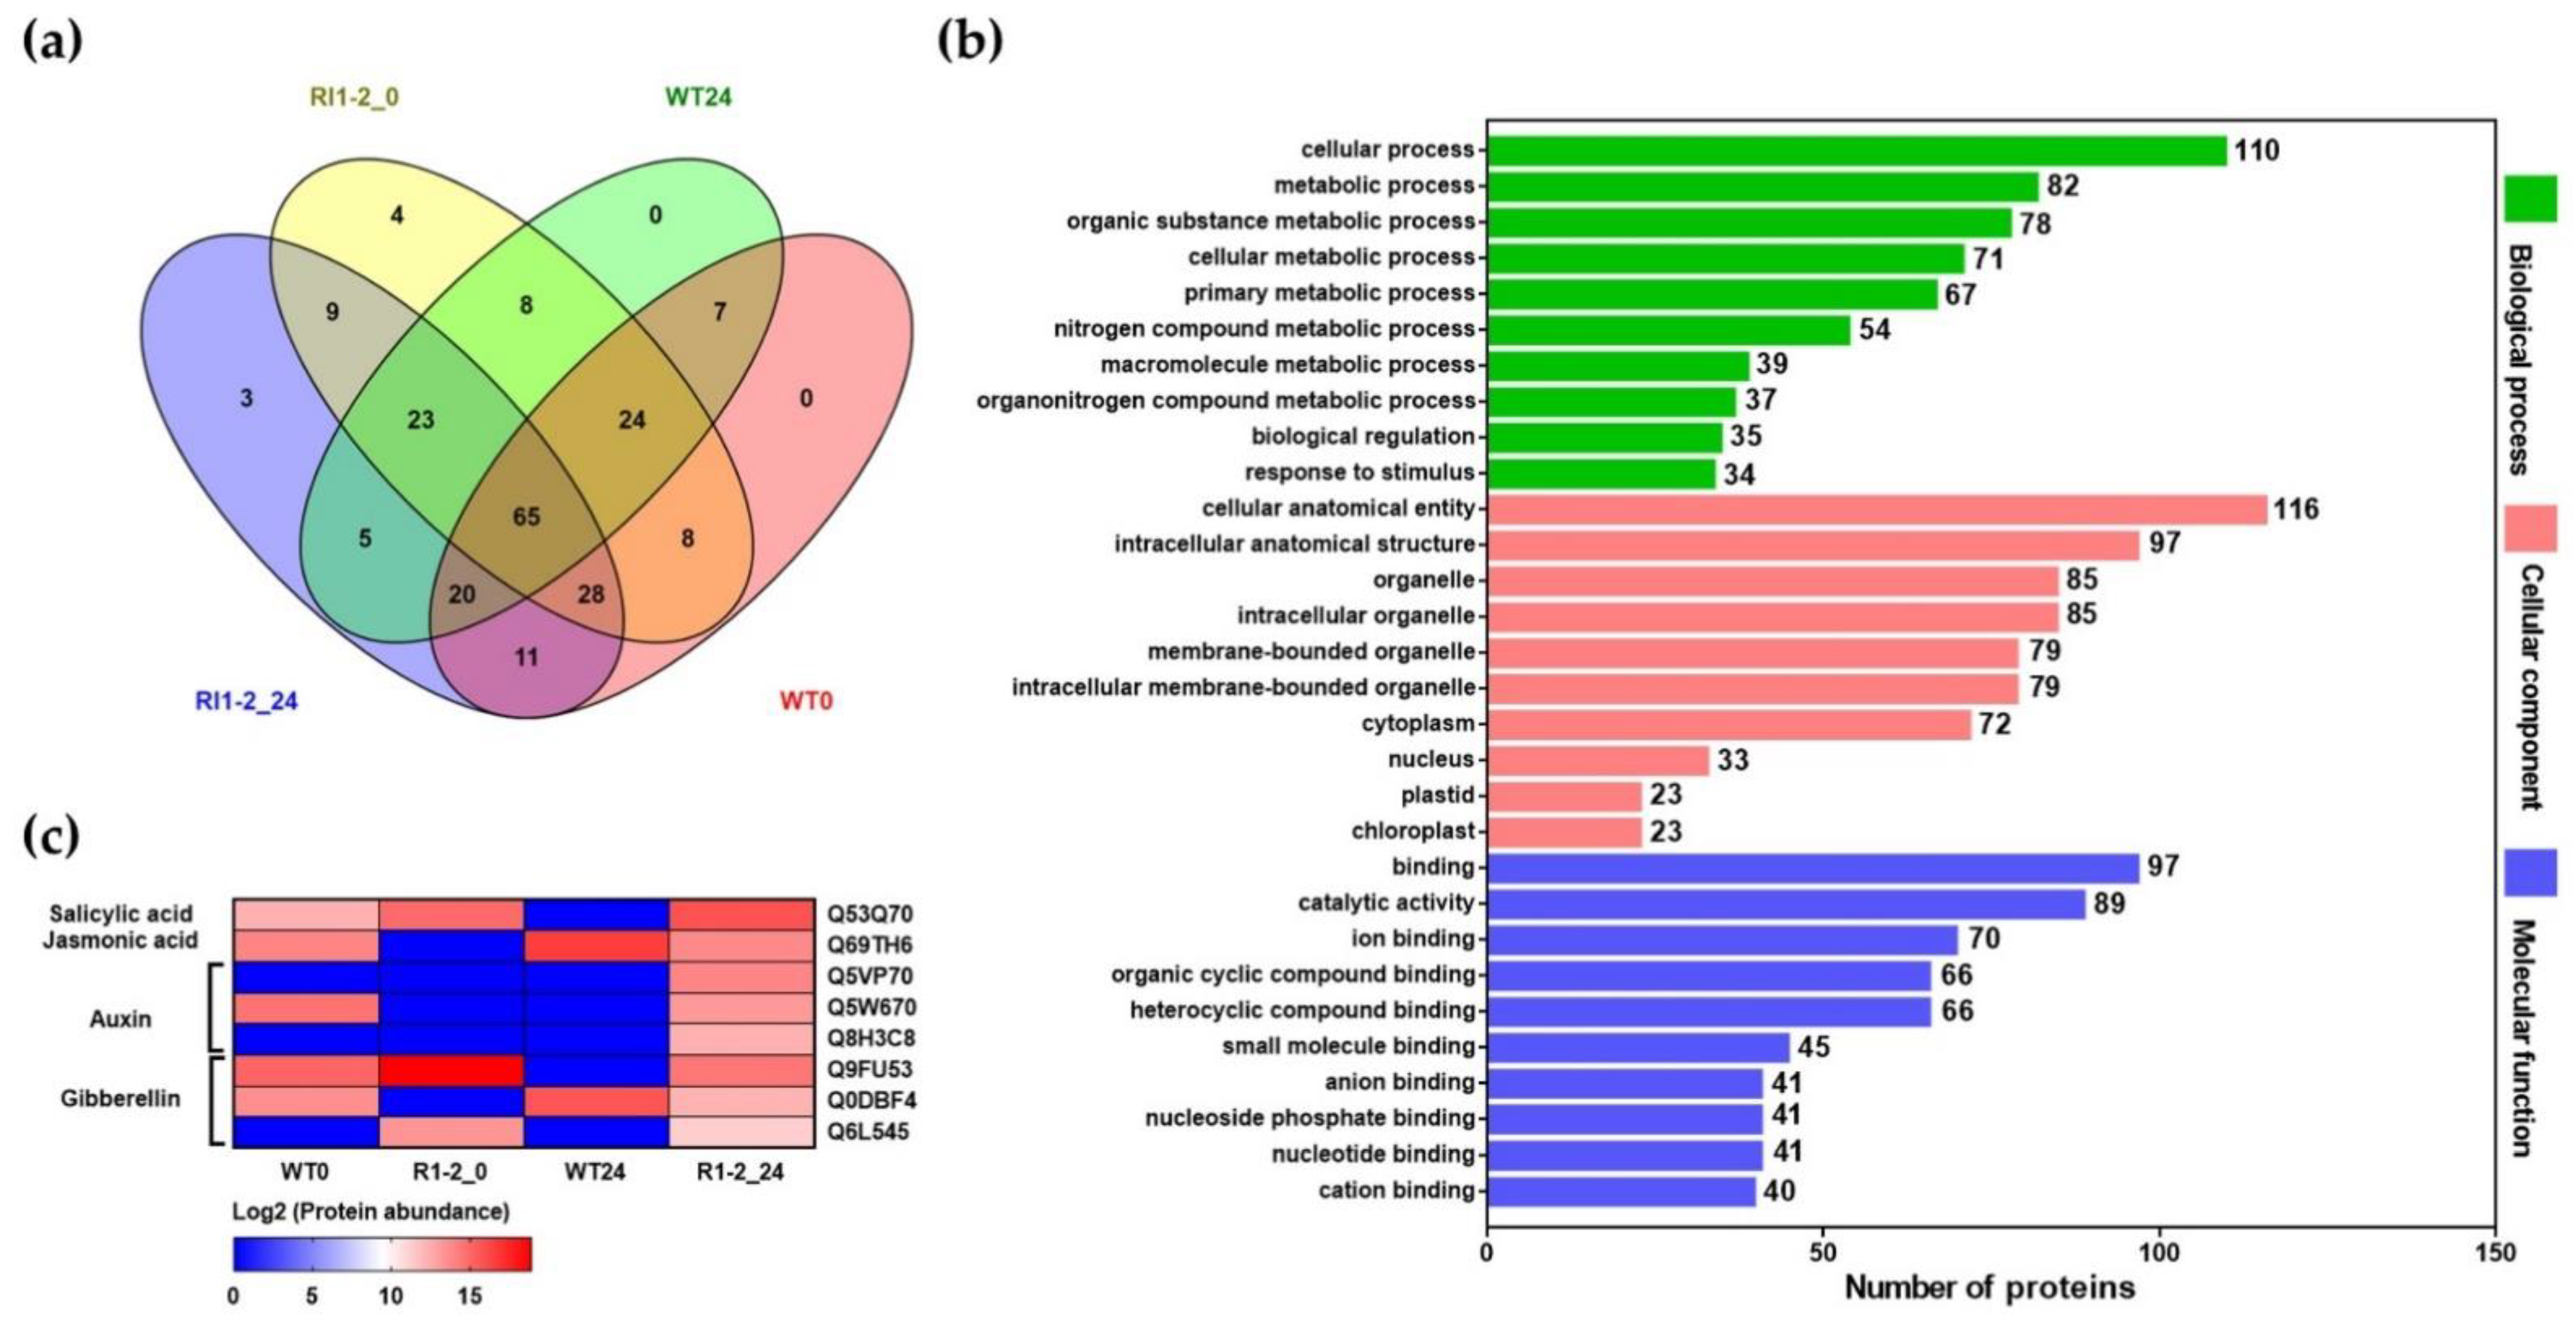
2.7. Proteome Analysis

To examine the changes in differentially expressed proteins (DEPs) after rice blast inoculation, leaf samples were collected from WT and OsVTC1-1 RI1-2 lines at 0 and 24 hpi. A total protein extract was prepared and the peptide sequences were identified using liquid chromatography-tandem mass spectrometry (LC/MS-MS). The peptide sequence data was identified using Uniprot (http://www.uniprot.org/) (accessed 26 January 2022). Thus, 215 proteins were detected, of which 163, 152, 169, and 164 were detected in WT0, WT24, RI1-2_0, and RI1-2_24, respectively. Further, 65 proteins were common in all samples (Figure 7a). The differentially expressed proteins between the WT and OsVTC1-1 RI1-2 line are shown in Table 2. Three proteins were specifically identified in the OsVTC1-1 RI1-2 line, including auxin efflux carrier component 3a, probable protein phosphatase 2C 1, and IAA-amino acid hydrolase ILR1-like 8. A variety of transcription factors were found to be both increasing and decreasing in abundance in the OsVTC1-1 RI1-2 line. There was a substantial increase in the abundance of cell-wall-related proteins, such as expansin-A2, kinesin-like protein KIN-7E, and beta-galactosidase 9, as well as defense proteins, including leucine aminopeptidase 2, endoribonuclease dicer homolog 2, and pheophorbide an oxygenase, in the OsVTC1-1 RI1-2 line, compared to the WT after rice blast inoculation. However, glutathione reductase, superoxide dismutase, glutathione S-transferase, and 12-oxophytodienoate reductase 11 are involved in cell redox and showed a decrease in protein abundance after rice blast inoculation in the OsVTC1-1 RI1-2 line (Table 2).
Gene ontology (GO) and plant reactome pathway analysis were used to analyze the functions and pathways of differentially expressed proteins (DEPs) in OsVTC1-1 RI1-2 lines at 24 hpi. A list of the top 10 subgroups in three categories, comprising biological process, cellular component, and molecular function, are shown in Figure 7b and Table S6. Cellular processes, cellular anatomical entity, and binding were the most enriched subgroups in biological process, cellular component, and molecular function, respectively (Figure 7b). A total of 164 DEPs was assigned to 58 plant reactome pathways (Table S7). Metabolism and regulation; hormone signaling, transport and metabolism; growth and developmental processes; reproductive structure development; amino acid metabolism; secondary metabolism; seed development; regulation of seed size; cofactor biosynthesis; and auxin signaling were the top 10 enriched plant reactome pathways (Figure S3b). At 24 hpi, the OsVTC1-1 RI1-2 line contained highly expressed proteins related to plant hormone synthesis and signaling pathways (Figure 7c). Proteins involved in phenylpropanoid biosynthesis were also detected in the OsVTC1-1 RI1-2 line at 24 hpi (Table S7).

3. Discussion

Ascorbic acid (AsA) plays an important role in many plant processes, including cell wall biosynthesis, photosynthesis, hormone synthesis, and defense response [36]. When genes in the AsA biosynthesis pathway are modified, it affects the previously mentioned physiological pathways and mechanisms. In this study, an inclusive investigation of the OsVTC1-1 gene in the AsA synthesis pathway and how it influenced defense responses after rice blast inoculation was conducted. In comparison with the WT, OsVTC1-1 RI1-2 and RI1-3 lines demonstrated enhanced resistance to rice blast fungus by exhibiting fewer and smaller lesions and the induction of several defense mechanisms. Silencing OsVTC1-1 leads to reducing the amount of AsA, an ROS-scavenging antioxidant. AsA decreases lead to an increase in ROS production, which results in HR and cell death.
The silencing of OsVTC1-1 also impacts the abundance of non-cellulosic cell wall polysaccharides. After rice blast infection, non-cellulosic cell wall polysaccharides increased in the OsVTC1-1 RI1-2 line. These changes could influence the ability of the fungus to penetrate the cell wall.
Photosynthesis parameters alter as a result of pathogen infection [37]. This study revealed that the maximum efficiency of photosystem II (PSII), measured as Fv/Fm, was reduced in the infected leaves of the WT but not in the OsVTC1-1 RI1-2 line. The reduction in OsVTC1-1 gene expression protected photosynthetic efficiency in OsVTC1-1 RNAi lines during M. oryzae infection. Moreover, the amount of AsA decreased 24 h after rice blast inoculation in both WT and OsVTC1-1 RI1-2 lines. These results are consistent with a previous report, in which AsA contents decreased in infected leaves and roots at 24 h after infection with Phytophthora cinnamomi [38]. Additionally, it was found that the OsVTC1-1 RI1-2 line accumulates more O2 and MDA than the WT. O2 is an ROS that is essential in initiating signaling pathways and defense-related gene activation, as well as interacting with proteins, DNA, and lipids to cause cell damage [39]. MDA is a byproduct of lipid peroxidation caused by ROS. Increased lipid peroxidation was observed in HR cell death after M. oryzae infection in rice [32].
OsVTC1-1 gene silencing enhances resistance to M. oryzae by disturbing gene and protein expression in multiple pathways, including defense response and hormone signaling. DEGs and DEPs between WT and OsVTC1-1 RI1-2 line at 0 and 24 hpi were identified. Among the up-regulated DEGs associated with defense response, determined in this study and reported in previous studies, include germin-like protein family (GLP), peroxidase, and pathogenesis-related (PR) proteins. GLPs play an essential role in defense against Aspergillus flavus [40]. Peroxidases are associated with ROS generation and interacting with plant defense molecules, such as salicylic acid (SA), chitooligosaccharides (COSs), and aromatic monoamines (AMAs) [41]. Additionally, the RNA-seq data revealed that the peroxidase gene was expressed at the highest level at 12 hpi with rice blast fungus in Nipponbare [42]. PR proteins are generated during plant–pathogen interactions, which can inhibit the growth of pathogens [43]. A previous study reported that the expression of the PR-3 (At2g43590) gene was induced at 6 and 24 h after inoculation with Alternaria brassicae [44]. Moreover, in this study, through proteome analysis, DEPs related to cell wall biosynthesis and defense response were identified, including expansin, which is involved in plant cell wall expansion [45]; kinesin, which is necessary in cellulose microfibril and microtubule organization, signal transduction, and vesicle transport [46]; and leucine aminopeptidase, which acts downstream of JA synthesis and is involved in defenses against herbivores by developing late wounds in tomato [47].
Hormone signaling pathways are also disrupted by OsVTC1-1 silencing after rice blast inoculation. Particularly, SA and JA were the most effected plant hormones during infection. SA acts as signaling molecules in systemic acquired resistance (SAR) [48]. Consistent with a previous report, genes involved in hormone signaling molecules (SA and JA) were detected through transcriptome analysis during rice–rice blast interaction [49]. The SA activates the immune response against biotrophic pathogens, whereas the JA activates the immune response against necrotrophic pathogens [50]. SA and JA are, thus, required for rice defense signals against M. oryzae, a hemibiotrophic fungal pathogen. These results suggest that several defense mechanisms are induced in response to rice blast infection, especially plant hormone synthesis and signaling pathways.

4. Materials and Methods

4.1. Plant Materials and Growth Conditions

Transgenic rice seeds with knocked-down expression of the OsVTC1-1 gene (RI1-2 and RI1-3) and Zhonghua17 (ZH17) background of RNAi plants or WT were acquired from the Biotechnology Research Institute, Chinese Academy of Agricultural Sciences, Beijing, China [18]. Rice seeds were cultivated as previously described [35]. Briefly, rice seeds were germinated in a Petri dish containing moist tissue papers for 4–5 days, grown in plastic pots (9 cm diameter) containing soil (eight seeds per pot) and cultured at 24 °C under photoperiod cycle of 12 h light/dark and 90% humidity in a plant growth chamber (Reftech BV, Sassenheim, The Netherlands). Three-week-old rice seedlings were used for rice blast fungus inoculation in cell wall monosaccharide composition analysis and photosynthetic efficiency analysis.
Due to insufficient amount of OsVTC1-1 RI line seeds, only OsVTC1-1 RI1-2 line was used in AsA content measurement, detection of superoxide anion accumulation, MDA content measurement, and transcriptome and proteome analysis. WT and RI1-2 rice seeds were cultured in a greenhouse at 30 °C with 80% humidity and 12 h photoperiod. Khao Dawk Mali 105 (KDML105) and Jao Hom Nin (JHN), Thai rice varieties, were used as susceptible and resistant varieties to rice blast fungus, respectively. Three-week-old rice seedlings were used for rice blast fungus inoculation.

4.2. Fungal Materials and Culture Conditions

Rice blast fungus Guy11 isolate, which can infect the ZH17 rice variety, was used for rice inoculation in cell wall monosaccharide composition analysis and photosynthetic efficiency analysis. Guy11 is stored in Nicholas J. Talbot’s laboratory at the School of Biosciences, University of Exeter, UK. Fungal isolates in filter paper were cultured on solid complete medium (CM) and incubated at 24 °C with a 12-h shift of the light–dark cycle in a fungal growth room for 5 days. The fungal plate was sub-cultured by cutting a 0.5 cm × 0.5 cm mycelia piece to new medium and incubating it using the above conditions for 5 days before inoculation [51].
Rice blast fungus 10100 isolate that causes the disease in the ZH17 rice variety was collected from Srakaew, Thailand, in 2006. It was used for rice inoculation samples analyzed for AsA content, detection of superoxide anion accumulation, MDA content, and transcriptome and proteome analysis. The filter paper stock of 10100 isolate was cultured on rice flour agar (RFA; 20 g of rice powder, 28 g of agar and 2 g of yeast extract in 1 L of distilled water) in a Petri dish and incubated at 28 °C for 7 days. Then, the fungal plate was sub-cultured by cutting a 0.5 cm × 0.5 cm mycelia piece to new RFA medium and incubating the new piece as previously described. Fungal mycelia were scraped off using a stainless-steel spatula to induce sporulation and placed under UV light for 3 days before inoculation.

4.3. Rice Inoculation and Pathogenicity assay

Conidia of Guy11 were collected from culture plates by washing with sterile water and filtered using sterile Miracloth (Calbiochem, San Diego, CA, USA). Conidia suspensions were centrifuged at 8000× g for 5 min at room temperature. Conidia suspensions were mixed with 0.2% (w/v) gelatin and adjusted to 1 × 10⁵ spores mL−1. Conidia suspensions were used immediately after preparation to avoid germination. Conidia suspensions were sprayed on 3-week-old WT and OsVTC1-1 RNAi rice seedlings (5 mL per three pots) with an artist’s airbrush (Badger Airbrush, Franklin Park, IL, USA). For mock inoculations, plants were sprayed with 0.2% (w/v) gelatin only. The inoculated plants were kept in closed containers for 24 h and, afterwards were stored in a plant-growth-controlled environment room at 24 °C with a photoperiod cycle of 12 h light/dark and 90% humidity. Infected leaves were collected 4 days after inoculation, immediately immersed in the liquid nitrogen, and stored at −80 °C until cell wall extraction. Rice blast symptoms were examined at 7 days post inoculation. Furthermore, conidia suspensions were also used for a spot inoculation method. Twenty microliter droplets of conidia suspension were inoculated on the adaxial surfaces of detached WT and OsVTC1-1 RNAi leaves at three drops per leaf. Inoculated rice leaves were incubated in moist chambers for 5 days for photosynthetic efficiency analysis.
For 10100 isolates, conidia were harvested by washing them out from the RFA medium with sterile water. To make conidia suspensions, conidia were mixed with 0.3% (w/v) gelatin and 0.01% (v/v) Tween 20 and adjusted to 1 × 10⁵ spores mL−1. Conidia suspensions were sprayed to 3-week-old WT and RI1-2 rice plants using nano-sprayer machine. Five mL of inoculum was applied per three pots. For mock inoculations, rice seedlings were sprayed with 0.3% (w/v) gelatin and 0.01% (v/v) Tween 20. Inoculated rice plants were kept in the dark at 25 °C and 80–100% humidity overnight and transferred to the greenhouse. Leaf samples were collected at 0, 6, 12, 24, and 48 h after inoculation for AsA content measurement and were collected at 0 and 24 h for detection of superoxide anion, measurement of MDA content, and transcriptome and proteome analysis. Moreover, disease symptoms were also observed at 7 days post inoculation.

4.4. Cell Wall Sugar Composition Analysis

For cell wall preparation, GC-MS analysis and data analysis were performed as previously reported [35]. Briefly, 3-week-old leaves of WT and OsVTC1-1 RNAi lines, both mock and rice blast fungus treated, were collected at 4 days after inoculation and stored in liquid nitrogen. Frozen leaf samples were ground with a TissueLyser (Qiagen, Hilden, Germany) twice for 30 s at 30 Hz frequency. The alcohol-insoluble residue (AIR) preparation method was used for cell wall preparation as previously described [52]. Monosaccharide compositions of cell wall samples were investigated using an Agilent 7200 series-accurate mass Q-TOF GC-MS together with a 7890A GC system (Agilent Technologies, Santa Clara, CA, USA). Data analysis was performed using Agilent technologies MassHunter qualitative version B.07.00 and quantitative software version B.08.00 (Agilent Technologies, Santa Clara, CA, USA). Data from mock inoculation were previously used and published in Lamanchai et al. [35]

4.5. Photosynthetic Efficiency Analysis

Photosynthetic efficiency in WT and OsVTC1-1 RNAi line after rice blast inoculation was determined by measurement of chlorophyll fluorescence FluorImager software version 2.2 (CF Imager, Technologica Ltd., Colchester, UK). Detached leaves were placed in the CF Imager and dark adapted for 20 min before measurement of basal fluorescence (F0). Maximal fluorescence (Fm) was induced by a saturating flash of blue light (0.5 s at 6000 µmol m−2 s−1). Variable fluorescence (Fv) was calculated as Fm-F0 to provide the dark-adapted quantum efficiency of photosystem II (Fv/Fm) [53]. Three replicates were performed for each rice line.

4.6. Measurement of Ascorbic Acid Content

To measure AsA content in WT and RI1-2 line, leaf samples were collected at 0, 6, 12, 24, and 48 h after inoculation and stored in liquid nitrogen. AsA content measurement with three biological replicates was performed as previously described [54] with slight modification according to Lamanchai et al. [35]. Finally, the absorbance was measured at 525 nm using a spectrophotometer and the concentrations were calculated using a standard calibration curve.

4.7. Detection of Superoxide Anion by Nitroblue Tetrazolium (NBT) Staining

Superoxide anion (O2), one of the most important ROS in cells, was measured by NBT staining following methodology described by Kumar et al. [55]. Leaf samples were collected at 24 h post inoculation and immersed in 50 mM sodium phosphate buffer (pH 7.5) containing 0.2% (w/v) NBT for detection of O2. Samples were incubated in the dark at room temperature overnight. After the NBT was drained off, chlorophyll was removed by immersing samples in absolute ethanol and heating in a water bath at 80 °C until the green color was completely removed. The samples were transferred to a paper towel saturated with 60% (v/v) glycerol and stained samples were photographed. O2 was detected as a dark blue color. The percentage area covered by O2 accumulation was measured using ImageJ software version 1.53k (Wayne Rasband, National Institutes of Health, Bethesda, MD, USA). Three replicates were performed for each rice line.

4.8. Measurement of Malondialdehyde (MDA) Content

To measure MDA content, 0.1 g of leaf samples was used for extraction in 1 mL of 0.1% (w/v) TCA for 10 min and centrifuged at 10,000× g at 4 °C for 15 min. Seven hundred microliters of supernatant was transferred to new microcentrifuge tubes. One milliliter of 0.5% (v/v) tertiary butyl alcohol (TBA) was added to supernatant, boiled at 95 °C for 25 min, and quickly cooled on ice for 5 min. Absorbance was measured using spectrophotometer at 532 and 600 nm. MDA content was calculated based on calculations in Health and Packer 1968 [56]. Three replicates were performed for each experiment.

4.9. Transcriptome Analysis

Leaf samples of WT and OsVTC1-1 RI1-2 line were collected at 0 and 24 hpi and labelled as W0, W24, RI1-2_0, and RI1-2_24, respectively. Total RNA was extracted using the GF-1 Total RNA extraction kit (Vivantis, Shah Alam, Malaysia) according to the manufacturer’s instructions. Pair-end sequencing using Illumina Novaseq 6000 platform (Illumina, San Diego, CA, USA) was conducted by Novogene Bioinformatics Technology Co., Ltd., Beijing, China. For data analysis, the RNA-seq data was performed as previously described [35] using apps in the CyVerse Discovery Environment (DE) [57]. The sequences were mapped using IRGSP-1.0 as the reference genome sequence. DEGs were identified using adjusted p-value < 0.05 and |log2FC| > 1 as cutoff criterion. The Rice Annotation Project Database (RAP-DB, http://rapdb.dna.affrc.go.jp/) was used to find gene descriptions for DEGs (accessed on 11 June 2022) [58,59]. DEGs with up- and down-regulated genes at 0 and 24 h after rice blast inoculation between WT and OsVTC1-1 RI1-2 line were compared. A Venn diagram was constructed using Venny version 2.1.0. (https://bioinfogp.cnb.csic.es/tools/venny/index.html, accessed on 8 June 2022). Gene ontology (GO, http://geneontology.org/) enrichment analysis was performed to classify the function of DEGs (accessed on 11 June 2022) [60,61,62]. Pathway analysis was analyzed using plant reactome database (http://plantreactome.gramene.org/, accessed on 11 June 2022) [63]. A heatmap of up-regulated DEGs and correlation between three biological replicates was generated based on the fragments per kilobase of transcript per million mapped reads (FPKM) values transformed by log10 (FPKM+1) using GraphPad Prism version 9.0.0 for Windows (San Diego, CA, USA). Principal component analysis (PCA) was carried out with factoextra package in RStudio [64] using a log10 transformation of (FPKM+1) values to compare similarity between three biological replicates.

4.10. Proteome Analysis

Protein extraction, digestion, LC-MS/MS determination, and protein identification were achieved as previously described [35]. Briefly, leaf samples were ground into a powder with liquid nitrogen. Protein was extracted using 0.5% (w/v) sodium dodecyl sulfate (SDS) and the concentration was measured by the method of Lowry [65]. Protein samples were digested in gel with trypsin (1:20 ratio) (Promega, Madison, WI, USA). The tryptic peptide samples were prepared for injection into an Ultimate3000 Nano/Capillary LC System (Thermo Scientific, Waltham, MA, USA) coupled to a Hybrid quadrupole Q-Tof impact II™ (Bruker Daltonics, Bremen, Germany) equipped with a Nano-captive spray ion source. MaxQuant version 1.6.6.0 (Max-Planck Institute for Biochemistry, Planegg, Germany) was used to quantify the peptide MS signal intensities from the analyzed MS/MS data from LC-MS [66]. For protein identification, the data were searched against the Uniprot database (released date 26 January 2022). A Venn diagram was constructed using Venny version 2.1.0. (https://bioinfogp.cnb.csic.es/tools/venny/index.html, accessed on 8 June 2022). Gene ontology (GO, http://geneontology.org/) enrichment analysis was performed to classify the function of proteins (accessed on 11 June 2022) [60,61,62]. Pathway analysis was analyzed using plant reactome database (http://plantreactome.gramene.org/, accessed on 11 June 2022) [63]. A heatmap of identified proteins was created based on log2 (protein abundance) value using GraphPad Prism version 9.0.0 for Windows (San Diego, CA, USA).

4.11. Statistical Analyses

The data were reported as mean ± standard error (SE) and were analyzed using IBM SPSS Statistics v. 26 software (IBM, New York, NY, USA). A Student’s t-test was performed to determine statistical differences at a significant level of 0.05.

5. Conclusions

In this study, we report that the OsVTC1-1 gene is involved in the interaction between rice and rice blast fungus. Disease reaction, cell wall monosaccharide composition, photosynthetic efficiency, AsA content, O2 accumulation, and MDA content were analyzed in WT and OsVTC1-1 RNAi lines after rice blast inoculation. An enhanced rice blast resistance was observed in the OsVTC1-1 RNAi lines. A significant difference between OsVTC1-1 RNAi lines and WT was observed in the composition of monosaccharides on cell walls, photosynthetic efficiency, O2 accumulation, and levels of MDA. Transcriptome and proteome analysis revealed that rice blast inoculation induced defense-related genes and proteins. Pathways involved in the biosynthesis of plant hormones, especially SA and JA, were identified in the OsVTC1-1 RNAi line after rice blast inoculation. Our results indicate that a reduction in the expression of the OsVTC1-1 gene in the AsA synthesis pathway enhances resistance to rice blast fungus via multiple defense mechanisms.

Supplementary Materials

The following are available online at https://www.mdpi.com/article/10.3390/plants11172189/s1, Figure S1: Principal component analysis (PCA) plot of log10 (FPKM+1) values of 100 common genes from WT and OsVTC1-1 RNAi lines at 0 and 24 h after rice blast inoculation between three replicates; Figure S2: Heatmap of the expression levels of 100 common genes from WT and OsVTC1-1 RI1-2 line at 0 and 24 hpi among three replicates. The color scale on the right represents the fragments per kilobase of transcript per million mapped reads (FPKM) values transformed by log10 (FPKM+1). Red and blue represent high- and low-expression levels of genes, respectively; Figure S3: Plant reactome pathway enrichment analysis. (a) The top 10 enriched plant reactome pathways of DEGs in the OsVTC1-1 RI1-2 line between 0 and 24 hpi; (b) The top 10 enriched plant reactome pathways of DEPs in the OsVTC1-1 RI1-2 line at 24 hpi; Table S1: Quantification of O2– accumulation in a mock-inoculated and rice-blast-infected leaves of WT and OsVTC1-1 RI1-2 line using ImageJ software; Table S2: Summary of RNA-seq data and reads mapping; Table S3: FPKM expression values represented as log10 (FPKM+1) values of 100 common genes from WT and OsVTC1-1 RI1-2 lines with three replicates at 0 and 24 hpi; Table S4: Gene ontology (GO) enrichment analysis of up-regulated DEGs in the OsVTC1-1 RI1-2 line between 0 and 24 hpi. The GO categories include biological process (BP), cellular component (CC), and molecular function (MF); Table S5: Plant reactome pathway analysis of up-regulated DEGs in the OsVTC1-1 RI1-2 line between 0 and 24 hpi; Table S6: The top 10 gene ontology (GO) enrichment analysis of DEPs in the OsVTC1-1 RI1-2 line at 24 hpi. The GO categories include biological process (BP), cellular component (CC), and molecular function (MF); Table S7: Plant reactome pathway analysis of DEPs in the OsVTC1-1 RI1-2 line at 24 hpi.

Author Contributions

Conceptualization, C.J.; data curation, K.L. (Kanyanat Lamanchai) and K.L. (Kantinan Leetanasaksakul); formal analysis, K.L. (Kanyanat Lamanchai), D.L.S., A.N., K.L. (Kantinan Leetanasaksakul) and S.K.; funding acquisition, C.J.; investigation, K.L. (Kanyanat Lamanchai); methodology, N.S. and C.J.; project administration, C.J.; resources, N.S., S.R. and S.K.; software, N.S., S.R., K.L. (Kantinan Leetanasaksakul) and S.K.; supervision, N.S. and D.L.S.; writing—original draft, K.L. (Kanyanat Lamanchai); writing—review and editing, C.J. and N.S. All authors have read and agreed to the published version of the manuscript.

Funding

This research was supported by Kasetsart University Research and Development Institute (KURDI) project FF(KU)5.64 and National Research Council of Thailand (NRCT) as of fiscal year 2021. The first author was financially supported by Development and Promotion of Science and Technology Talents Project (DPST).

Institutional Review Board Statement

Not applicable.

Informed Consent Statement

Not applicable.

Data Availability Statement

Not applicable.

Acknowledgments

The authors acknowledge Zhijin Zhang from Biotechnology Research Institute, Chinese Academy of Agricultural Sciences, Beijing, China, for providing OsVTC1-1 RNAi rice seeds in this experiment. The authors would like to thank the laboratory of Nicholas J. Talbot at the School of Biosciences, College of Life and Environmental Sciences, University of Exeter, UK, for the rice inoculation experiment.

Conflicts of Interest

The authors declare no conflict of interest.

References

  1. Talbot, N.J. On the trail of a cereal killer: Exploring the biology of Magnaporthe grisea. Annu. Rev. Microbiol. 2003, 57, 177–202. [Google Scholar] [CrossRef] [PubMed] [Green Version]
  2. TeBeest, D.O.; Guerber, C.; Ditmore, M. Rice Blast. Available online: https://www.apsnet.org/edcenter/disandpath/fungalasco/pdlessons/Pages/RiceBlast.aspx (accessed on 20 May 2022).
  3. Andersen, E.J.; Ali, S.; Byamukama, E.; Yen, Y.; Nepal, M.P. Disease resistance mechanisms in plants. Genes 2018, 9, 339. [Google Scholar] [CrossRef] [Green Version]
  4. Jain, D.; Khurana, J.P. Role of pathogenesis-related (PR) proteins in plant defense Mechanism. In Molecular Aspects of Plant-Pathogen Interaction; Singh, A., Singh, I.K., Eds.; Springer: Singapore, 2018; pp. 265–281. [Google Scholar]
  5. Maleck, K.; Lawton, K. Plant strategies for resistance to pathogens. Curr. Opin. Biotechnol. 1998, 9, 208–213. [Google Scholar] [CrossRef]
  6. Bolwell, G.P.; Bindschedler, L.V.; Blee, K.A.; Butt, V.S.; Davies, D.R.; Gardner, S.L.; Gerrish, C.; Minibayeva, F. The apoplastic oxidative burst in response to biotic stress in plants: A three-component system. J. Exp. Bot. 2002, 53, 1367–1376. [Google Scholar] [CrossRef] [PubMed]
  7. Balint-Kurti, P. The plant hypersensitive response: Concepts, control and consequences. Mol. Plant Pathol. 2019, 20, 1163–1178. [Google Scholar] [CrossRef] [PubMed] [Green Version]
  8. Morel, J.-B.; Dangl, J.L. The hypersensitive response and the induction of cell death in plants. Cell Death Differ. 1997, 4, 671–683. [Google Scholar] [CrossRef] [Green Version]
  9. Dangl, J.L.; Dietrich, R.A.; Richberg, M.H. Death don’t haveno mercy: Cell death programs in plant-microbe interactions. Plant Cell 1996, 8, 1793–1807. [Google Scholar] [CrossRef]
  10. Pennell, R.I.; Lamb, C. Programmed cell death in plants. Plant Cell 1997, 9, 1157–1168. [Google Scholar] [CrossRef] [Green Version]
  11. Sharma, P.; Jha, A.B.; Dubey, R.S.; Pessarakli, M. Reactive oxygen species, oxidative damage, and antioxidative defense mechanism in plants under stressful conditions. J. Bot. 2012, 2012, 26. [Google Scholar] [CrossRef] [Green Version]
  12. Smirnoff, N.; Wheeler, G.L. Ascorbic Acid in plants: Biosynthesis and function. Crit. Rev. Biochem. Mol. Biol. 2000, 35, 291–314. [Google Scholar] [CrossRef]
  13. Zhang, Y. Biological role of ascorbate in plants. In Ascorbic Acid in Plants; Springer Briefs in Plant Science; Springer: New York, NY, USA, 2013; pp. 7–33. [Google Scholar] [CrossRef]
  14. Davey, M.; Van Montagu, M.; Inzé, D.; Sanmartin, M.; Kanellis, A.; Smirnoff, N.; Benzie, I.; Strain, J.; Favell, D.; Fletcher, J. Plant L-ascorbic acid: Chemistry, function, metabolism, bioavailability and effects of processing. J. Sci. Food Agric. 2000, 80, 825–860. [Google Scholar] [CrossRef]
  15. Wheeler, G.L.; Jones, M.A.; Smirnoff, N. The biosynthetic pathway of vitamin C in higher plants. Nature 1998, 393, 365–369. [Google Scholar] [CrossRef] [PubMed]
  16. Smirnoff, N.; Conklin, P.L.; Loewus, F.A. Biosynthesis of ascorbic acid in plants: A renaissance. Annu. Rev. Plant Physiol. Plant Mol. Biol. 2001, 52, 437–467. [Google Scholar] [CrossRef] [PubMed]
  17. Smirnoff, N. Ascorbic acid: Metabolism and functions of a multi-facetted molecule. Curr. Opin. Plant Biol. 2000, 3, 229–235. [Google Scholar] [CrossRef]
  18. Qin, H.; Deng, Z.; Zhang, C.; Wang, Y.; Wang, J.; Liu, H.; Zhang, Z.; Huang, R.; Zhang, Z. Rice GDP-mannose pyrophosphorylase OsVTC1-1 and OsVTC1-3 play different roles in ascorbic acid synthesis. Plant Mol. Biol. 2016, 90, 317–327. [Google Scholar] [CrossRef]
  19. Qin, H.; Wang, Y.; Wang, J.; Liu, H.; Zhao, H.; Deng, Z.; Zhang, Z.; Huang, R.; Zhang, Z. Knocking down the expression of gmpase gene OsVTC1-1 decreases salt tolerance of rice at seedling and reproductive stages. PLoS ONE 2016, 11, e0168650. [Google Scholar] [CrossRef]
  20. Wang, H.-S.; Yu, C.; Zhu, Z.-J.; Yu, X.-C. Overexpression in tobacco of a tomato GMPase gene improves tolerance to both low and high temperature stress by enhancing antioxidation capacity. Plant Cell Rep. 2011, 30, 1029–1040. [Google Scholar] [CrossRef]
  21. Barth, C.; Moeder, W.; Klessig, D.F.; Conklin, P.L. The timing of senescence and response to pathogens is altered in the ascorbate-deficient Arabidopsis mutant vitamin c-1. Plant Physiol. 2004, 134, 1784–1792. [Google Scholar] [CrossRef] [Green Version]
  22. Pavet, V.; Olmos, E.; Kiddle, G.; Mowla, S.; Kumar, S.; Antoniw, J.; Alvarez, M.; Foyer, C. Ascorbic acid deficiency activates cell death and disease resistance responses in Arabidopsis. Plant Physiol. 2005, 139, 1291–1303. [Google Scholar] [CrossRef] [Green Version]
  23. Dzhavakhiya, V.G.; Ozeretskovskaya, O.L.; Zinovyeva, S.V. Chapter 10—Immune response. In Comprehensive and Molecular Phytopathology; Dyakov, Y.T., Dzhavakhiya, V.G., Korpela, T., Eds.; Elsevier: Amsterdam, The Netherlands, 2007; pp. 265–314. [Google Scholar]
  24. Walters, D.R.; McRoberts, N. Plants and biotrophs: A pivotal role for cytokinins? Trends Plant Sci. 2006, 11, 581–586. [Google Scholar] [CrossRef]
  25. Hückelhoven, R. Cell wall–associated mechanisms of disease resistance and susceptibility. Annu. Rev. Phytopathol. 2007, 45, 101–127. [Google Scholar] [CrossRef] [PubMed]
  26. Wang, Y.; Li, X.; Fan, B.; Zhu, C.; Chen, Z. Regulation and function of defense-related callose deposition in plants. Int. J. Mol. Sci. 2021, 22, 2393. [Google Scholar] [CrossRef] [PubMed]
  27. Morkunas, I.; Ratajczak, L. The role of sugar signaling in plant defense responses against fungal pathogens. Acta Physiol. Plant 2014, 36, 1607–1619. [Google Scholar] [CrossRef] [Green Version]
  28. Voiniciuc, C.; Pauly, M.; Usadel, B. Monitoring polysaccharide dynamics in the plant cell wall. Plant Physiol. 2018, 176, 2590–2600. [Google Scholar] [CrossRef] [Green Version]
  29. Jabs, T. Reactive oxygen intermediates as mediators of programmed cell death in plants and animals. Biochem. Pharmacol. 1999, 57, 231–245. [Google Scholar] [CrossRef]
  30. Mandal, S.; Rajarammohan, S.; Kaur, J. ROS accumulation and associated cell death mediates susceptibility to Alternaria brassicae in Arabidopsis accessions. Physiol. Mol. Plant Pathol. 2019, 107, 51–59. [Google Scholar] [CrossRef]
  31. Su, L.J.; Zhang, J.H.; Gomez, H.; Murugan, R.; Hong, X.; Xu, D.; Jiang, F.; Peng, Z.Y. Reactive oxygen species-induced lipid peroxidation in apoptosis, autophagy, and ferroptosis. Oxid. Med. Cell Longev. 2019, 2019, 5080843. [Google Scholar] [CrossRef] [Green Version]
  32. Dangol, S.; Chen, Y.; Hwang, B.K.; Jwa, N.-S. Iron- and reactive oxygen species-dependent ferroptotic cell death in rice- Magnaporthe oryzae interactions. Plant Cell. 2019, 31, 189–209. [Google Scholar] [CrossRef] [Green Version]
  33. Bari, R.; Jones, J.D.G. Role of plant hormones in plant defence responses. Plant Mol. Biol. 2009, 69, 473–488. [Google Scholar] [CrossRef]
  34. Leon-Reyes, A.; Van der Does, D.; De Lange, E.S.; Delker, C.; Wasternack, C.; Van Wees, S.C.M.; Ritsema, T.; Pieterse, C.M.J. Salicylate-mediated suppression of jasmonate-responsive gene expression in Arabidopsis is targeted downstream of the jasmonate biosynthesis pathway. Planta 2010, 232, 1423–1432. [Google Scholar] [CrossRef] [Green Version]
  35. Lamanchai, K.; Salmon, D.L.; Smirnoff, N.; Sutthinon, P.; Roytrakul, S.; Leetanasaksakul, K.; Kittisenachai, S.; Jantasuriyarat, C. OsVTC1-1 RNAi mutant with reduction of ascorbic acid synthesis alters cell wall sugar composition and cell wall-associated proteins. Agronomy 2022, 12, 1272. [Google Scholar] [CrossRef]
  36. Gallie, D.R. Ascorbic Acid: A multifunctional molecule supporting plant growth and development. Scientifica 2013, 2013, 795964. [Google Scholar] [CrossRef] [PubMed] [Green Version]
  37. Barón, M.; Pineda, M.; Pérez-Bueno, M.L. Picturing pathogen infection in plants. Z. Naturforsch. C J. Biosci. 2016, 71, 355–368. [Google Scholar] [CrossRef] [PubMed]
  38. Dempsey, R.W.; Merchant, A.; Tausz, M. Differences in ascorbate and glutathione levels as indicators of resistance and susceptibility in Eucalyptus trees infected with Phytophthora cinnamomi. Tree Physiol. 2012, 32, 1148–1160. [Google Scholar] [CrossRef] [Green Version]
  39. Schieber, M.; Chandel, N.S. ROS function in redox signaling and oxidative stress. Curr. Biol. 2014, 24, 453–462. [Google Scholar] [CrossRef] [Green Version]
  40. Wang, T.; Chen, X.; Zhu, F.; Li, H.; Li, L.; Yang, Q.; Chi, X.; Yu, S.; Liang, X. Characterization of peanut germin-like proteins, AhGLPs in plant development and defense. PLoS ONE 2013, 8, e61722. [Google Scholar] [CrossRef] [Green Version]
  41. Kawano, T. Roles of the reactive oxygen species-generating peroxidase reactions in plant defense and growth induction. Plant Cell Rep. 2003, 21, 829–837. [Google Scholar] [CrossRef]
  42. Yang, D.; Li, S.; Xiao, Y.; Lu, L.; Zheng, Z.; Tang, D.; Cui, H. Transcriptome analysis of rice response to blast fungus identified core genes involved in immunity. Plant Cell Environ. 2021, 44, 3103–3121. [Google Scholar] [CrossRef]
  43. Filipenko, E.A.; Kochetov, A.V.; Kanayama, Y.; Malinovsky, V.I.; Shumny, V.K. PR-proteins with ribonuclease activity and plant resistance against pathogenic fungi. Russ. J. Genet. Appl. 2013, 3, 474–480. [Google Scholar] [CrossRef]
  44. Chandrashekar, N.; Ali, S.; Grover, A. Exploring expression patterns of PR-1, PR-2, PR-3, and PR-12 like genes in Arabidopsis thaliana upon Alternaria brassicae inoculation. 3 Biotech 2018, 8, 230. [Google Scholar] [CrossRef]
  45. McQueen-Mason, S.J. Expansins and cell wall expansion. J. Exp. Bot. 1995, 46, 1639–1650. [Google Scholar] [CrossRef]
  46. Li, J.; Xu, Y.; Chong, K. The novel functions of kinesin motor proteins in plants. Protoplasma 2012, 249 (Suppl. S2), S95–S100. [Google Scholar] [CrossRef] [PubMed] [Green Version]
  47. Fowler, J.H.; Narváez-Vásquez, J.; Aromdee, D.N.; Pautot, V.; Holzer, F.M.; Walling, L.L. Leucine aminopeptidase regulates defense and wound signaling in tomato downstream of jasmonic acid. Plant Cell. 2009, 21, 1239–1251. [Google Scholar] [CrossRef] [PubMed] [Green Version]
  48. Durrant, W.E.; Dong, X. Systemic acquired resistance. Annu. Rev. Phytopathol. 2004, 42, 185–209. [Google Scholar] [CrossRef] [PubMed]
  49. Wang, Y.; Kwon, S.J.; Wu, J.; Choi, J.; Lee, Y.-H.; Agrawal, G.K.; Tamogami, S.; Rakwal, R.; Park, S.-R.; Kim, B.-G.; et al. Transcriptome analysis of early responsive genes in rice during Magnaporthe oryzae infection. Plant Pathol. J. 2014, 30, 343–354. [Google Scholar] [CrossRef] [Green Version]
  50. Spoel, S.H.; Johnson, J.S.; Dong, X. Regulation of tradeoffs between plant defenses against pathogens with different lifestyles. Proc. Natl. Acad. Sci. USA 2007, 104, 18842–18847. [Google Scholar] [CrossRef] [Green Version]
  51. Talbot, N.J.; Ebbole, D.J.; Hamer, J.E. Identification and characterization of MPG1, a gene involved in pathogenicity from the rice blast fungus Magnaporthe grisea. Plant Cell 1993, 5, 1575–1590. [Google Scholar] [CrossRef] [Green Version]
  52. Conklin, P.L.; Gatzek, S.; Wheeler, G.L.; Dowdle, J.; Raymond, M.J.; Rolinski, S.; Isupov, M.; Littlechild, J.A.; Smirnoff, N. Arabidopsis thaliana VTC4 Encodes L-Galactose-1-P Phosphatase, a plant ascorbic acid biosynthetic enzyme. J. Biol. Chem. 2006, 281, 15662–15670. [Google Scholar] [CrossRef] [Green Version]
  53. Baker, N.R. Chlorophyll fluorescence: A probe of photosynthesis in vivo. Annu. Rev. Plant Biol. 2008, 59, 89–113. [Google Scholar] [CrossRef] [Green Version]
  54. Gillespie, K.; Ainsworth, E. Measurement of reduced, oxidized and total ascorbate content in plants. Nat. Protoc. 2007, 2, 871–874. [Google Scholar] [CrossRef]
  55. Kumar, D.; Yusuf, M.; Singh, P.; Sardar, M.; Sarin, N. Histochemical detection of superoxide and H2O2 accumulation in Brassica juncea seedlings. Bio-Protocol 2014, 4, e1108. [Google Scholar] [CrossRef]
  56. Heath, R.L.; Packer, L. Photoperoxidation in isolated chloroplasts. I. kinetics and stoichiometry of fatty acid peroxidation. Arch. Biochem. Biophys. 1968, 125, 189–198. [Google Scholar] [CrossRef]
  57. Merchant, N.; Lyons, E.; Goff, S.; Vaughn, M.; Ware, D.; Micklos, D.; Antin, P. The iPlant collaborative: Cyberinfrastructure for enabling data to discovery for the life sciences. PLoS Biol. 2016, 14, e1002342. [Google Scholar] [CrossRef] [PubMed] [Green Version]
  58. Sakai, H.; Lee, S.; Tanaka, T.; Numa, H.; Kim, J.; Kawahara, Y.; Wakimoto, H.; Yang, C.-C.; Iwamoto, M.; Abe, T.; et al. Rice Annotation Project Database (RAP-DB): An integrative and interactive database for rice genomics. Plant Cell Physiol. 2013, 54, e6. [Google Scholar] [CrossRef] [PubMed]
  59. Kawahara, Y.; Bastide, M.; Hamilton, J.; Kanamori, H.; McCombie, W.; Ouyang, S.; Schwartz, D.; Tanaka, T.; Wu, J.; Zhou, S.; et al. Improvement of the Oryza sativa Nipponbare reference genome using next generation sequence and optical map data. Rice 2013, 6, 4. [Google Scholar] [CrossRef] [Green Version]
  60. Ashburner, M.; Ball, C.A.; Blake, J.A.; Botstein, D.; Butler, H.; Cherry, J.M.; Davis, A.P.; Dolinski, K.; Dwight, S.S.; Eppig, J.T.; et al. Gene ontology: Tool for the unification of biology. The Gene Ontology Consortium. Nat. Genet. 2000, 25, 25–29. [Google Scholar] [CrossRef] [Green Version]
  61. Consortium, T.G.O. The Gene Ontology resource: Enriching a Gold mine. Nucleic Acids Res. 2021, 49, D325–D334. [Google Scholar] [CrossRef]
  62. Mi, H.; Muruganujan, A.; Ebert, D.; Huang, X.; Thomas, P.D. PANTHER version 14: More genomes, a new PANTHER GO-slim and improvements in enrichment analysis tools. Nucleic Acids Res. 2019, 47, D419–D426. [Google Scholar] [CrossRef]
  63. Naithani, S.; Gupta, P.; Preece, J.; D’Eustachio, P.; Elser, J.L.; Garg, P.; Dikeman, D.A.; Kiff, J.; Cook, J.; Olson, A.; et al. Plant Reactome: A knowledgebase and resource for comparative pathway analysis. Nucleic Acids Res. 2019, 48, D1093–D1103. [Google Scholar] [CrossRef]
  64. Extract and Visualize the Results of Multivariate Data Analyses [R Package Factoextra Version 1.0.7]. Available online: https://CRAN.R-project.org/package=factoextra (accessed on 14 June 2022).
  65. Lowry, O.; Rosebrough, N.; Farr, A.L.; Randall, R. Protein measurement with the folin phenol reagent. J. Biol. Chem. 1951, 193, 265–275. [Google Scholar] [CrossRef]
  66. Tyanova, S.; Temu, T.; Cox, J. The MaxQuant computational platform for mass spectrometry-based shotgun proteomics. Nat. Protoc. 2016, 11, 2301–2319. [Google Scholar] [CrossRef] [PubMed]
Figure 1. Disease symptoms on wild-type (WT) and OsVTC1-1 RNAi lines (RI1-2 and RI1-3) rice leaves inoculated with rice blast fungus isolates. (a) Guy11; (b) 10100, Khao Dawk Mali 105 (KDML105) and Jao Hom Nin (JHN) were used as susceptible and resistant controls, respectively. Diseased rice leaves were photographed 7 days post inoculation.
Plants 11 02189 g001
Figure 2. Cell wall monosaccharide composition (mmol g−1 fresh weight) of 3-week-old rice leaves from wild-type (WT) and OsVTC1-1 RNAi lines at 4 days after inoculation with Guy11 isolate. (a) Xylose; (b) arabinose; (c) galactose; (d) galacturonic acid; (e) fucose; (f) mannose; (g) glucuronic acid. Data are presented as the mean ± standard error of three replicates. Asterisk indicates statistically significant differences between mock and infected plants for each rice line analyzed using Student’s t-test (* p < 0.05 and ** p < 0.01).
Plants 11 02189 g002
Figure 3. Leaf photosynthetic efficiency in wild-type (WT) and OsVTC1-1 RNAi lines (RI1-2 and RI1-3) at 5 days post inoculation with Guy11 isolate. (a) Maximal efficiency of PSII (Fv/Fm); (b) chlorophyll fluorescence image showing photosynthetic activity across the leaf surface (scale bar = 1 cm). Data are presented as the mean ± standard error of three replicates. Asterisk indicates statistically significant differences from WT analyzed using Student’s t-test (** p < 0.01).
Plants 11 02189 g003
Figure 4. Ascorbic acid content in wild-type (WT) and OsVTC1-1 RI1-2 line after rice fungus inoculation with 10100 isolate at 0, 6, 12, 24, and 48 h. Data are presented as the mean ± standard error of three replicates. Asterisk indicates statistically significant differences from WT at each time point analyzed using Student’s t-test (* p < 0.05, ** p < 0.01).
Plants 11 02189 g004
Figure 5. OsVTC1-1 RNAi (RI1-2) line induces accumulation of superoxide anion and lipid peroxidation at 24 hpi with 10100 isolate. (a) Visualization of O2 detected by nitroblue tetrazolium (NBT) staining; (b) the percentage of the leaf area covered by O2 accumulation; (c) determination of lipid peroxidation by MDA measurement. Data are presented as the mean ± standard error of three replicates. Asterisk indicates statistically significant differences between mock and infected plants for each rice lines analyzed using Student’s t-test (* p < 0.05).
Plants 11 02189 g005
Figure 6. Transcriptome analysis in wild-type (WT) and OsVTC1-1 RI1-2 line at 0 and 24 hpi with rice blast 10100 isolate. (a) Venn diagram of up-regulated differentially expressed genes (DEGs) and (b) down-regulated DEGs; (c) gene ontology (GO) enrichment analysis of up-regulated DEGs in the OsVTC1-1 RI1-2 line in terms of biological process (green), cellular component (pink), and molecular function (blue); (d) heatmap of up-regulated DEGs related to defense response; (e) heatmap of up-regulated DEGs related to plant hormone synthesis and signaling pathways. The gene expression levels are presented by log10 (FPKM+1) values. Red color displays high expression levels of genes and blue color represents low expression levels of genes.
Plants 11 02189 g006
Figure 7. Proteome analysis in wild-type (WT) and OsVTC1-1 RI1-2 line at 0 and 24 hpi with rice blast 10100 isolate. (a) Venn diagram of differentially expressed proteins (DEPs) in WT and OsVTC1-1 RI1-2 line at 0 and 24 hpi; (b) gene ontology (GO) enrichment analysis of DEPs in the OsVTC1-1 RI1-2 line at 24 hpi in terms of biological process (green), cellular component (pink), and molecular function (blue); (c) heatmap of DEPs related to plant hormone synthesis and signaling pathways. Red color displays high expression levels of proteins and blue color represents low expression levels of proteins.
Plants 11 02189 g007
Table 1. Top 20 up- and down-regulated differentially expressed genes (DEGs) in OsVTC1-1 RI1-2 line at 24 h after inoculation with rice blast 10100 isolate. Genes were ranked by log2FC value.
Up-Regulated DEGs of RI1-2
No.Gene IDGene DescriptionLog2FC
1Os08g0189900Germin-like protein 8-10, disease resistance10.156
2Os12g0503000Allantoin transporter8.199
3Os03g0363100Armadillo-like helical domain containing protein8.186
4Os06g0522300Haem peroxidase family protein8.156
5Os05g0473101Hypothetical gene7.671
6Os07g0541900Similar to KI domain interacting kinase 17.659
7Os07g0677200Peroxidase, negative regulation of rice resistance to blast disease7.640
8Os08g0507100Cytochrome P450 family protein7.599
9Os04g0493400Chitinase-4, Pathogenesis-related (PR)-37.596
10Os07g0539100Glycoside hydrolase family 17 protein7.476
11Os06g0244000Similar to anthranilic acid methyltransferase7.395
12Os01g0731150Hypothetical protein7.374
13Os09g0447300Cytochrome P450 family protein7.297
14Os01g0615100Chymotrypsin protease inhibitor7.297
15Os01g0615050Chymotrypsin inhibitor7.274
16Os09g0400400Cinnamyl alcohol dehydrogenase7.260
17Os08g0189400Germin-like protein 8-5, disease resistance7.104
18Os09g0319800Terpene synthase-like domain containing protein7.067
19Os11g0618700Protein of unknown function DUF594 domain containing protein.7.001
20Os08g0189600Germin-like protein 8-7, disease resistance6.956
Down-Regulated DEGs of RI1-2
No.Gene IDGene DescriptionLog2FC
1Os09g0537700S-like ribonuclease, regulation of photomorphogenesis−9.326
2Os05g0579600Homeodomain-like containing protein.−8.560
3Os01g0975900Similar to tonoplast membrane integral protein ZmTIP1-2−7.913
4Os01g0922700Conserved hypothetical protein.−7.627
5Os05g0409500Similar to MtN21 protein.−7.565
6Os01g0973100Hypothetical conserved gene−7.496
7Os06g0107100Protein of unknown function DUF819 family protein−7.267
8Os07g0628900Similar to KI domain interacting kinase 1−7.125
9Os01g0734600UDP-glucuronosyl/UDP-glucosyltransferase family protein−6.893
10Os03g0371300Similar to Cytochrome P450−6.689
11Os12g0493900Armadillo-like helical domain containing protein.−6.654
12Os07g0142900Aldo/keto reductase family protein.−6.645
13Os04g0282400Flowering-promoting factor 1-like protein 4−6.383
14Os05g0500101Hypothetical gene−6.379
15Os07g0111900Flavin-containing monooxygenase FMO family protein−6.326
16Os07g0558300Inositol monophosphatase family protein−6.267
17Os03g0223100Cytochrome P450 family protein−6.242
18Os08g0249900Similar to Gibberellin 20 oxidase 2−6.239
19Os01g0733500Similar to dehydration-induced protein RD22-like protein 1−6.185
20Os04g0583900MYB-related transcription factor−6.183
Table 2. Differentially expressed proteins in wild-type (WT) and OsVTC1-1 RI1-2 line at 0 and 24 h post inoculation with 10100 isolate.
No.Protein IDProtein NameLog2 Protein Abundance
WT0RI1-2_0WT24RI1-2_24
1Q5VP70Auxin efflux carrier component 3a 00.00013.89
2Q942P9Probable protein phosphatase 2C 1 00.00013.40
3Q8H3C8IAA-amino acid hydrolase ILR1-like 8 00.00012.32
4Q75KV9Transcription factor BHLH148 14.860.000.0012.16
5Q53Q70Transcription factor TGAL4 12.2714.910.0015.84
6Q9FWX2NAC domain-containing protein 7 13.6113.030.0015.28
7Q9FY82NAC domain-containing protein 82 14.1617.6411.1313.48
8Q6K537Dof zinc finger protein 3 0.0015.5512.7711.53
9A4LBC0B3 domain-containing protein LFL1 12.1517.9016.000.00
10Q7Y0V7Homeobox-leucine zipper protein ROC6 12.8616.9815.160.00
11Q6ZBS8Transcription factor TGAL100.0012.6612.050.00
12Q40636Expansin-A2 14.330.000.0013.32
13B9FFA3Kinesin-like protein KIN-7E15.9714.9515.4417.06
14Q5Z7L0Beta-galactosidase 9 13.810.0012.7113.43
15Q7XPY5Putative beta-glucosidase 15 11.3918.1110.4515.45
16Q6K669Leucine aminopeptidase 20.0012.0615.0417.61
17Q3EBC8Endoribonuclease dicer homolog 2 13.7318.6014.9316.27
18Q0DV66Pheophorbide a oxygenase15.810.0014.6516.10
19Q0D5R3Cysteine-rich receptor-like protein kinase 614.2119.460.0014.71
20Q6Z8P4Plant intracellular Ras-group-related LRR protein 414.8515.6813.2914.80
21Q7X7X4Cytochrome P450 13.2717.210.0013.74
22P48642Glutathione reductase15.7515.3915.060.00
23P93407Superoxide dismutase 0.0014.9312.1411.05
24Q65XA0Probable glutathione S-transferase DHAR10.0013.8616.4611.51
25B9FSC8Putative 12-oxophytodienoate reductase 11 13.2715.7312.510.00
Publisher’s Note: MDPI stays neutral with regard to jurisdictional claims in published maps and institutional affiliations.

