
Irrigation Regimes and Nitrogen Rates as the Contributing Factors in Quinoa Yield to Increase Water and Nitrogen Efficiencies


Abstract
:1. Introduction
2. Results
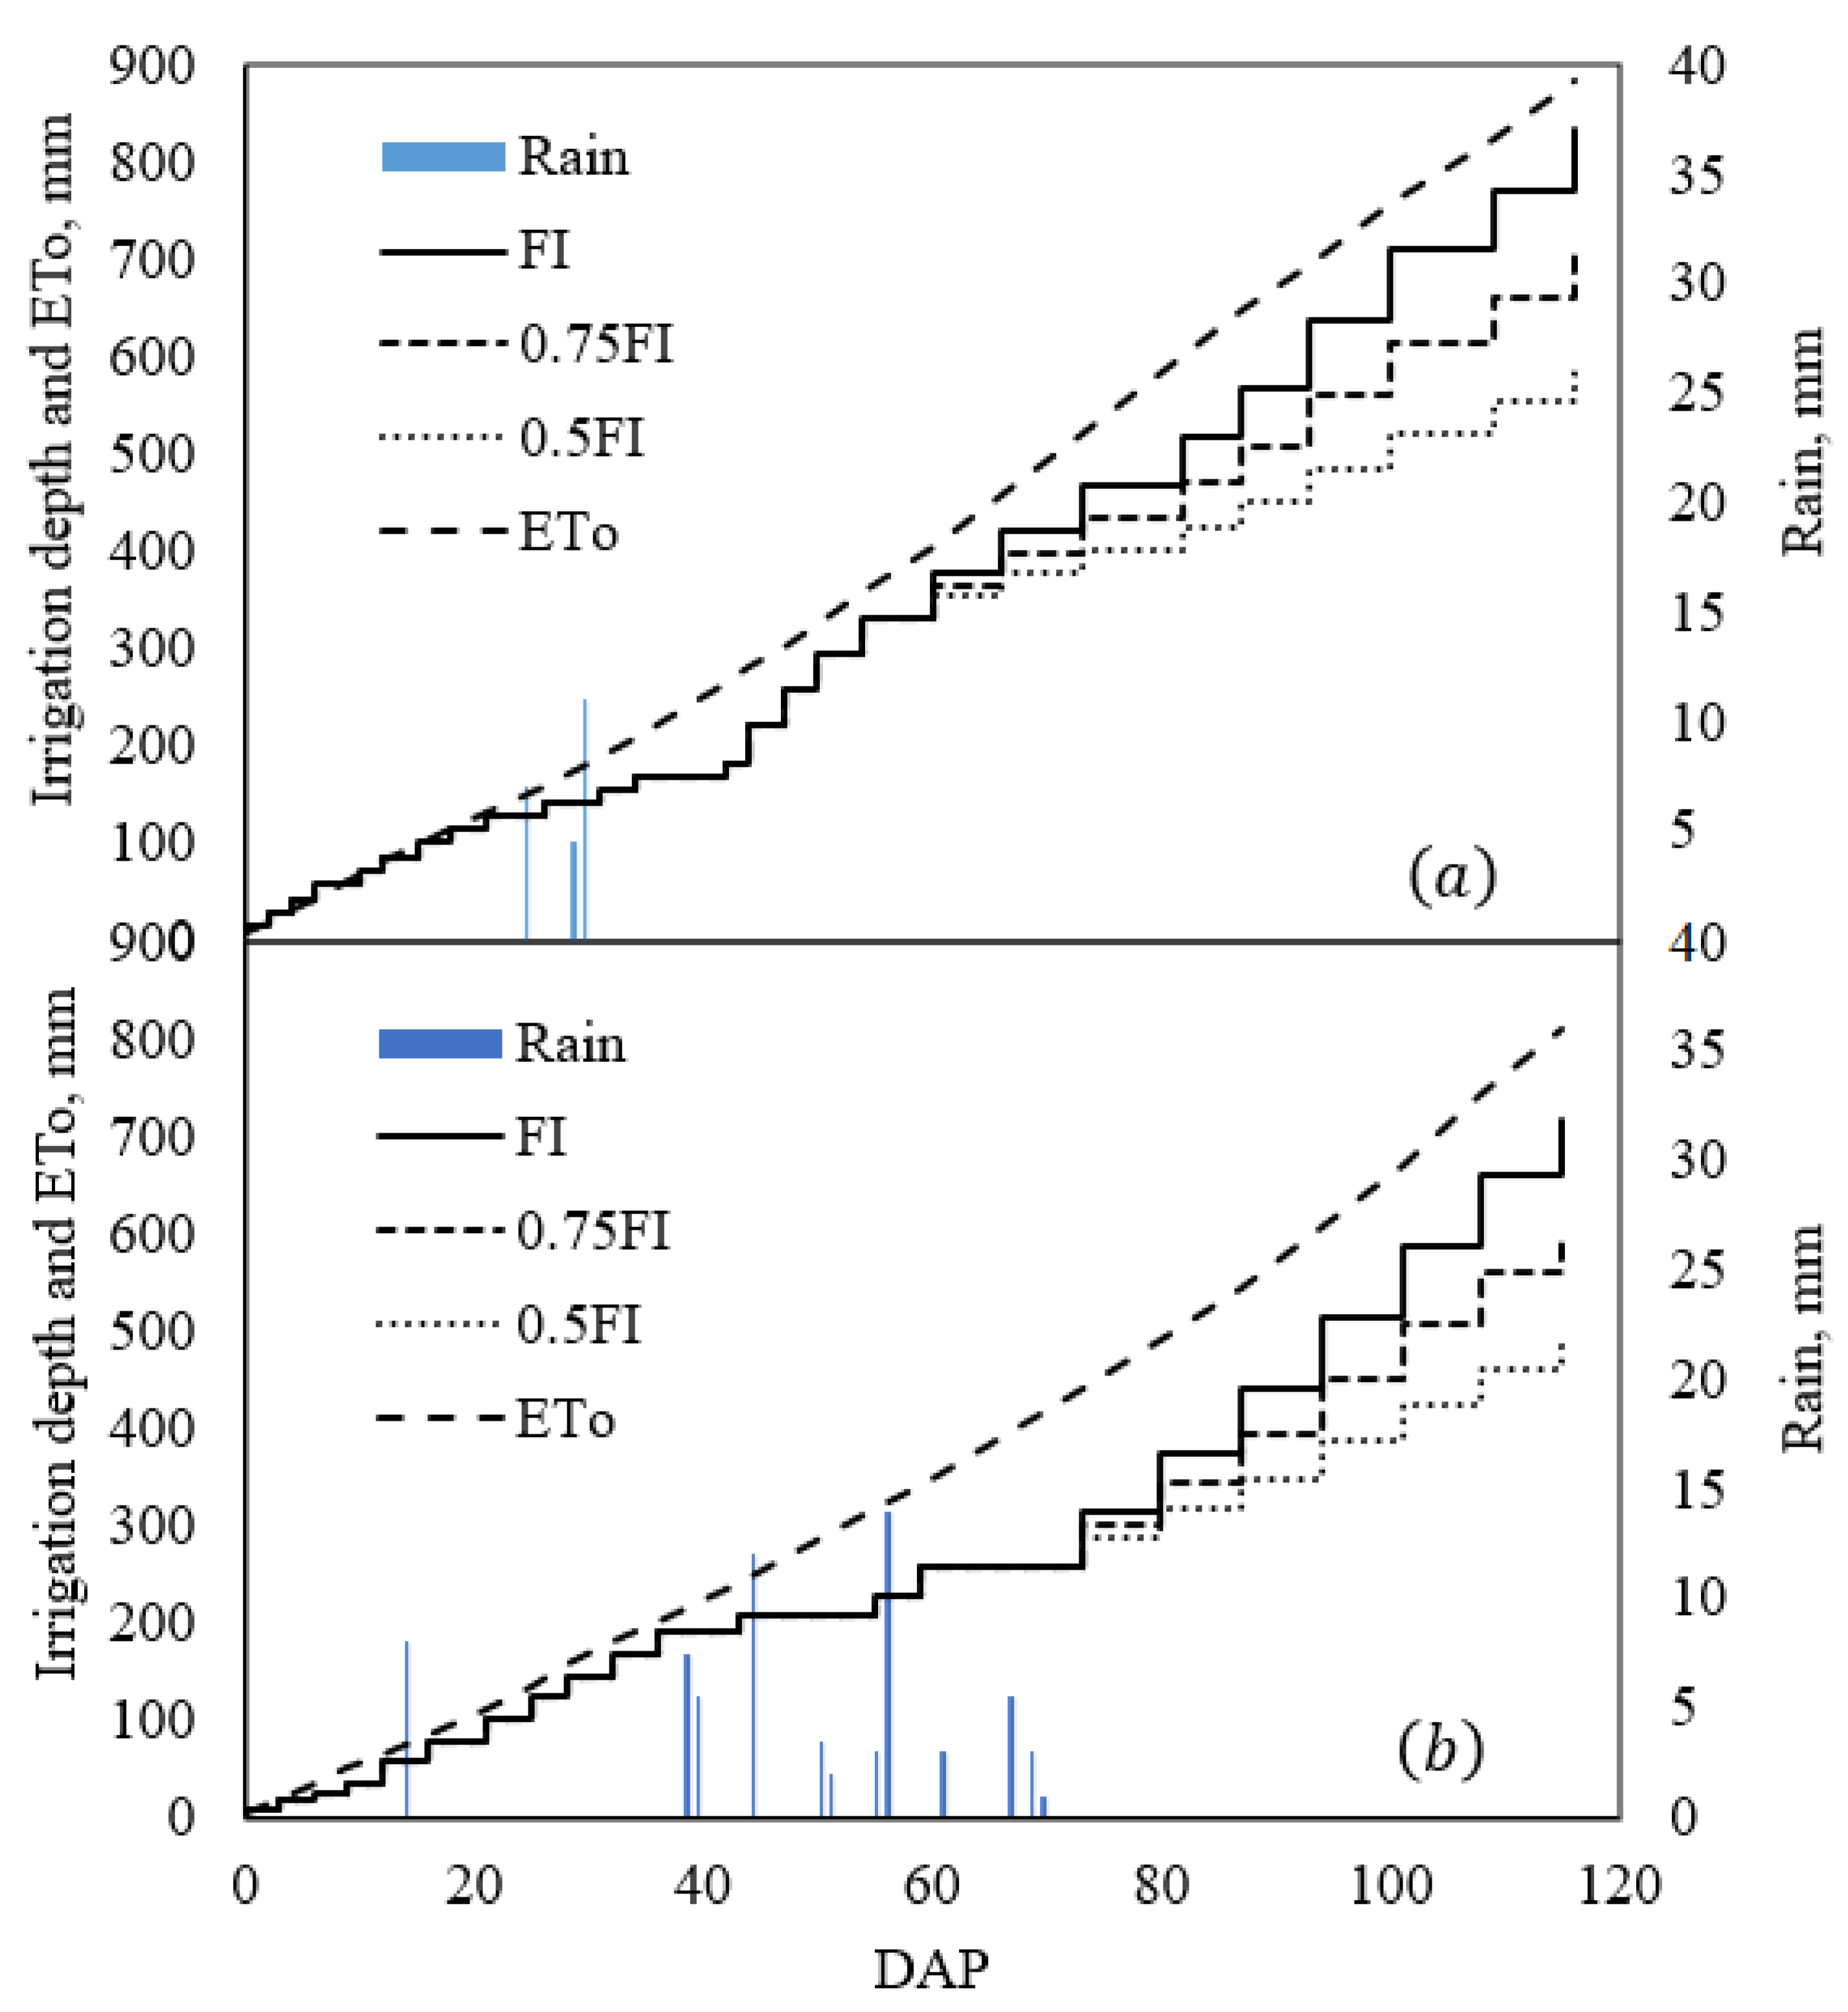
2.1. Water Use
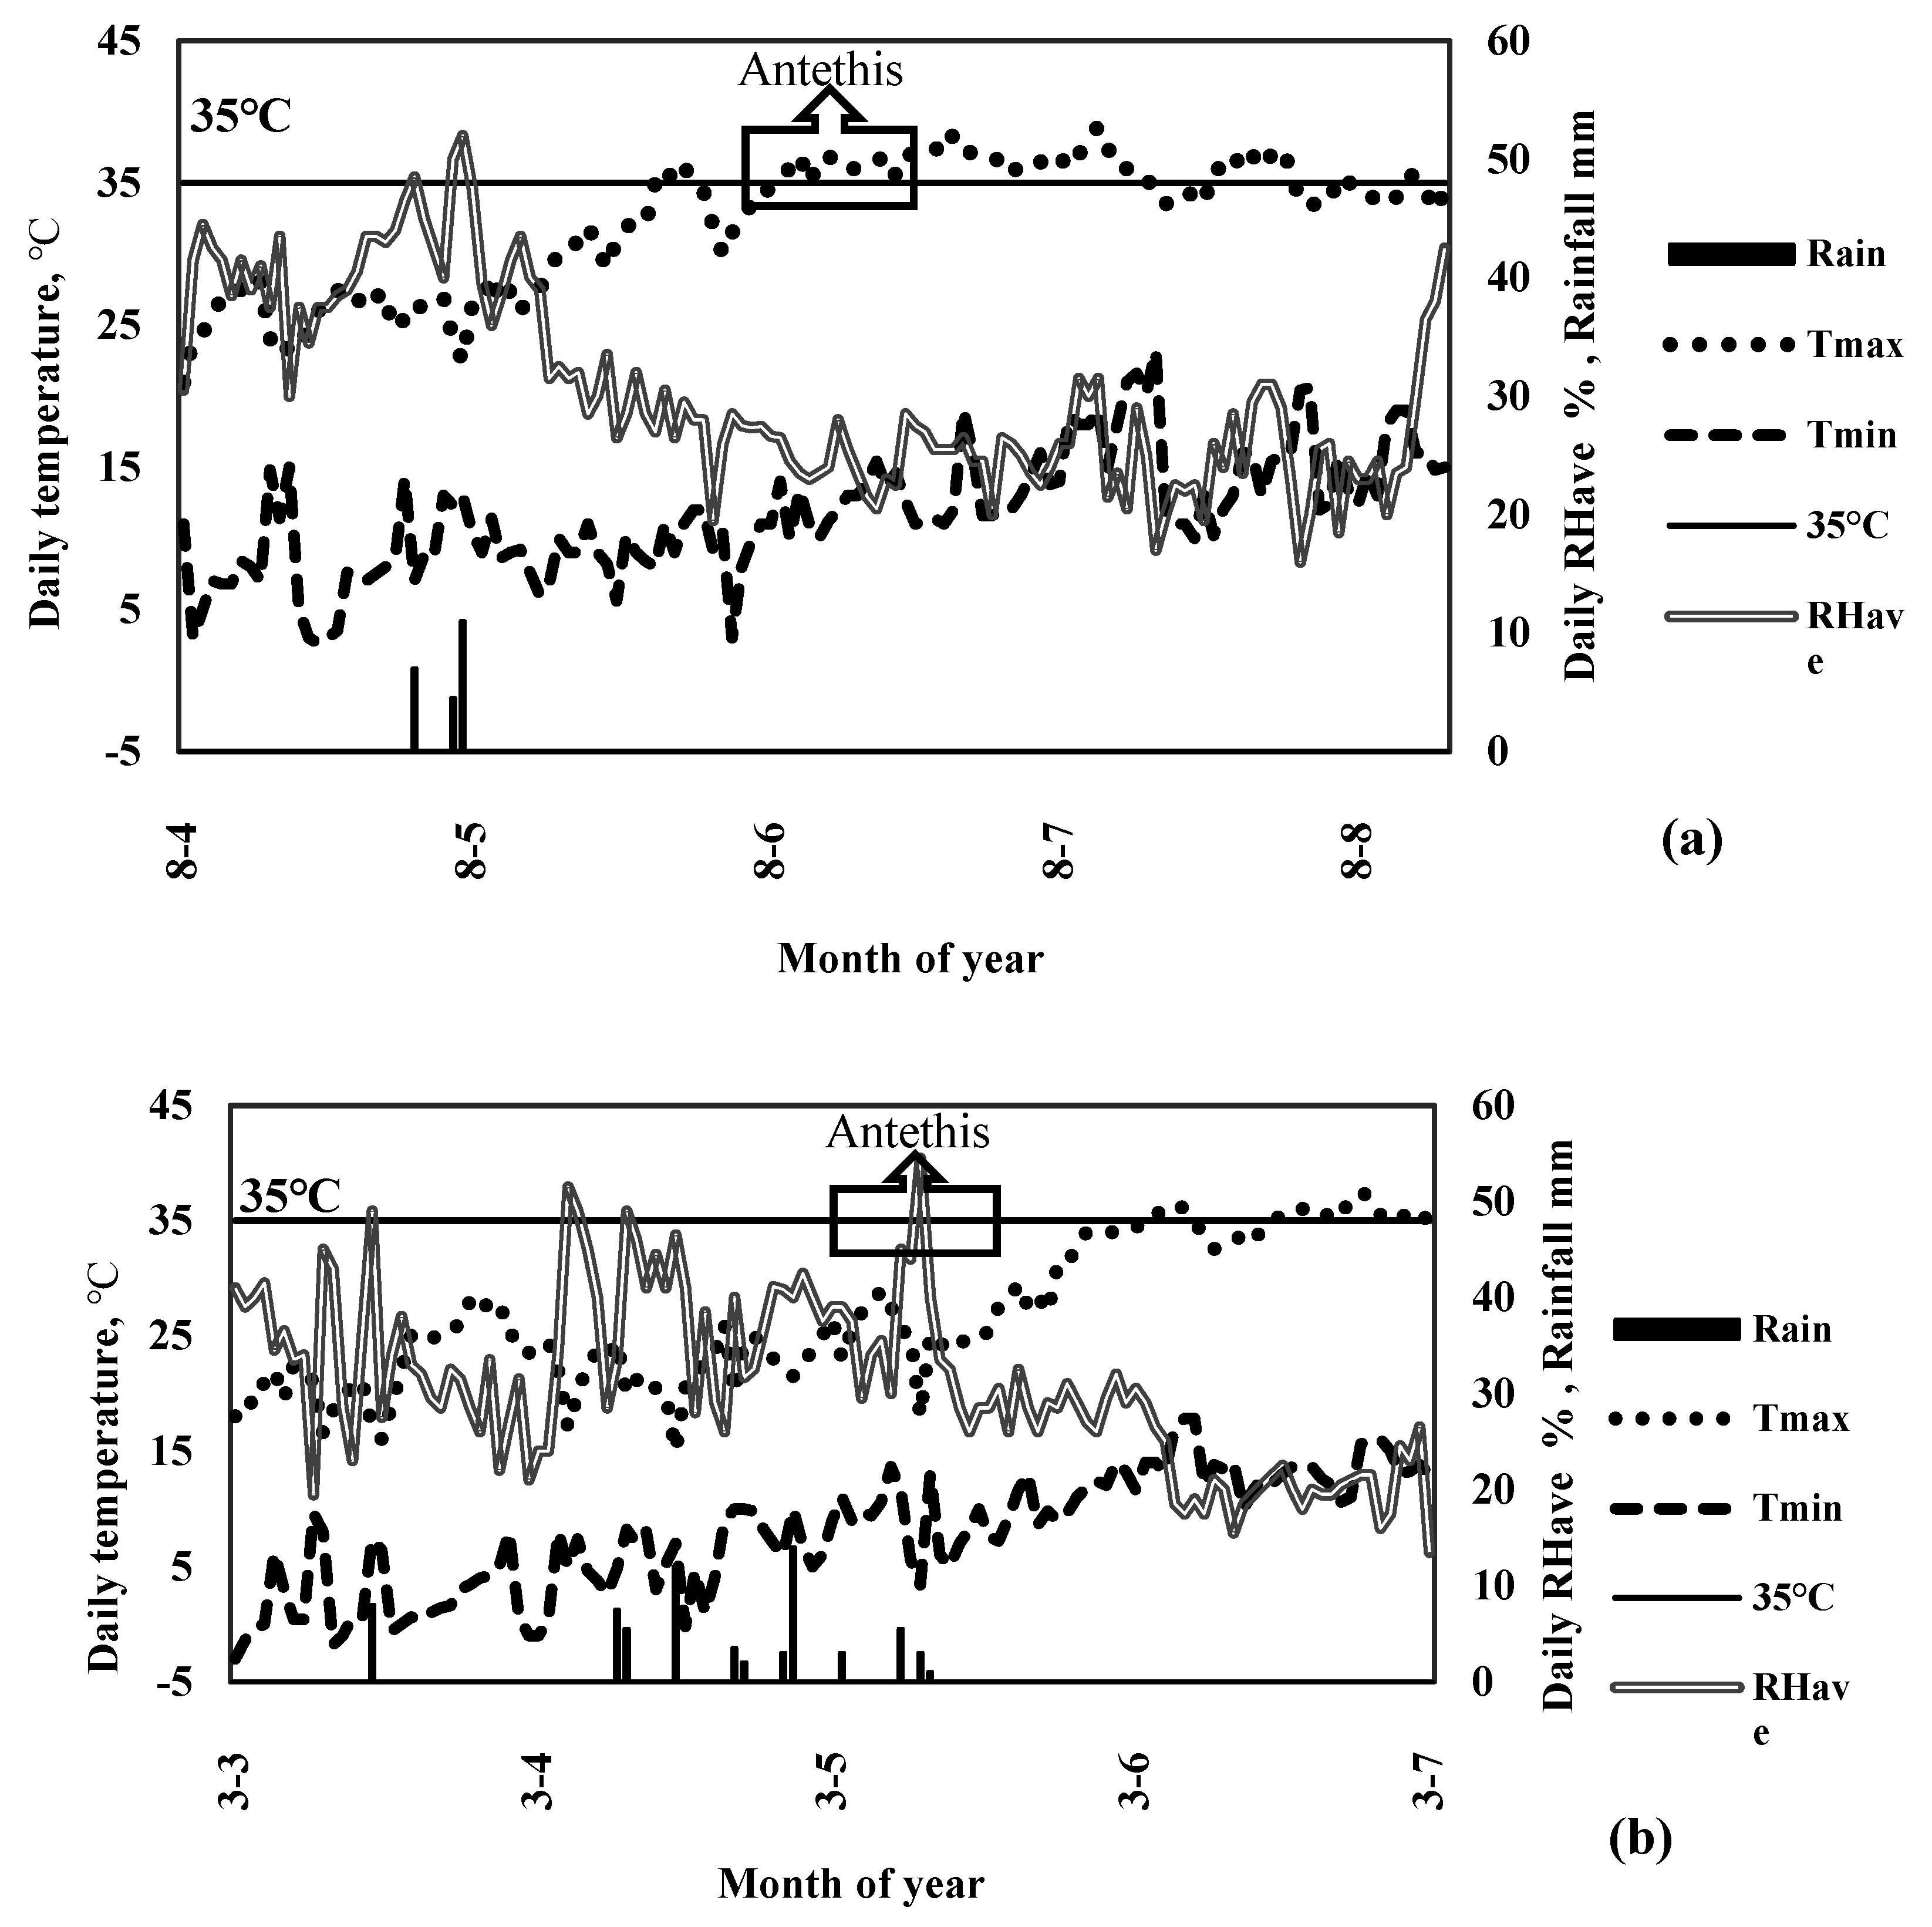
2.2. Seasonal Evapotranspiration
2.3. Seasonal Evaporation and Transpiration
2.4. Yield and Yield Components
2.4.1. Seed Yield
2.4.2. Total Dry Matter
2.4.3. Harvest Index
2.5. Total Nitrogen Uptake
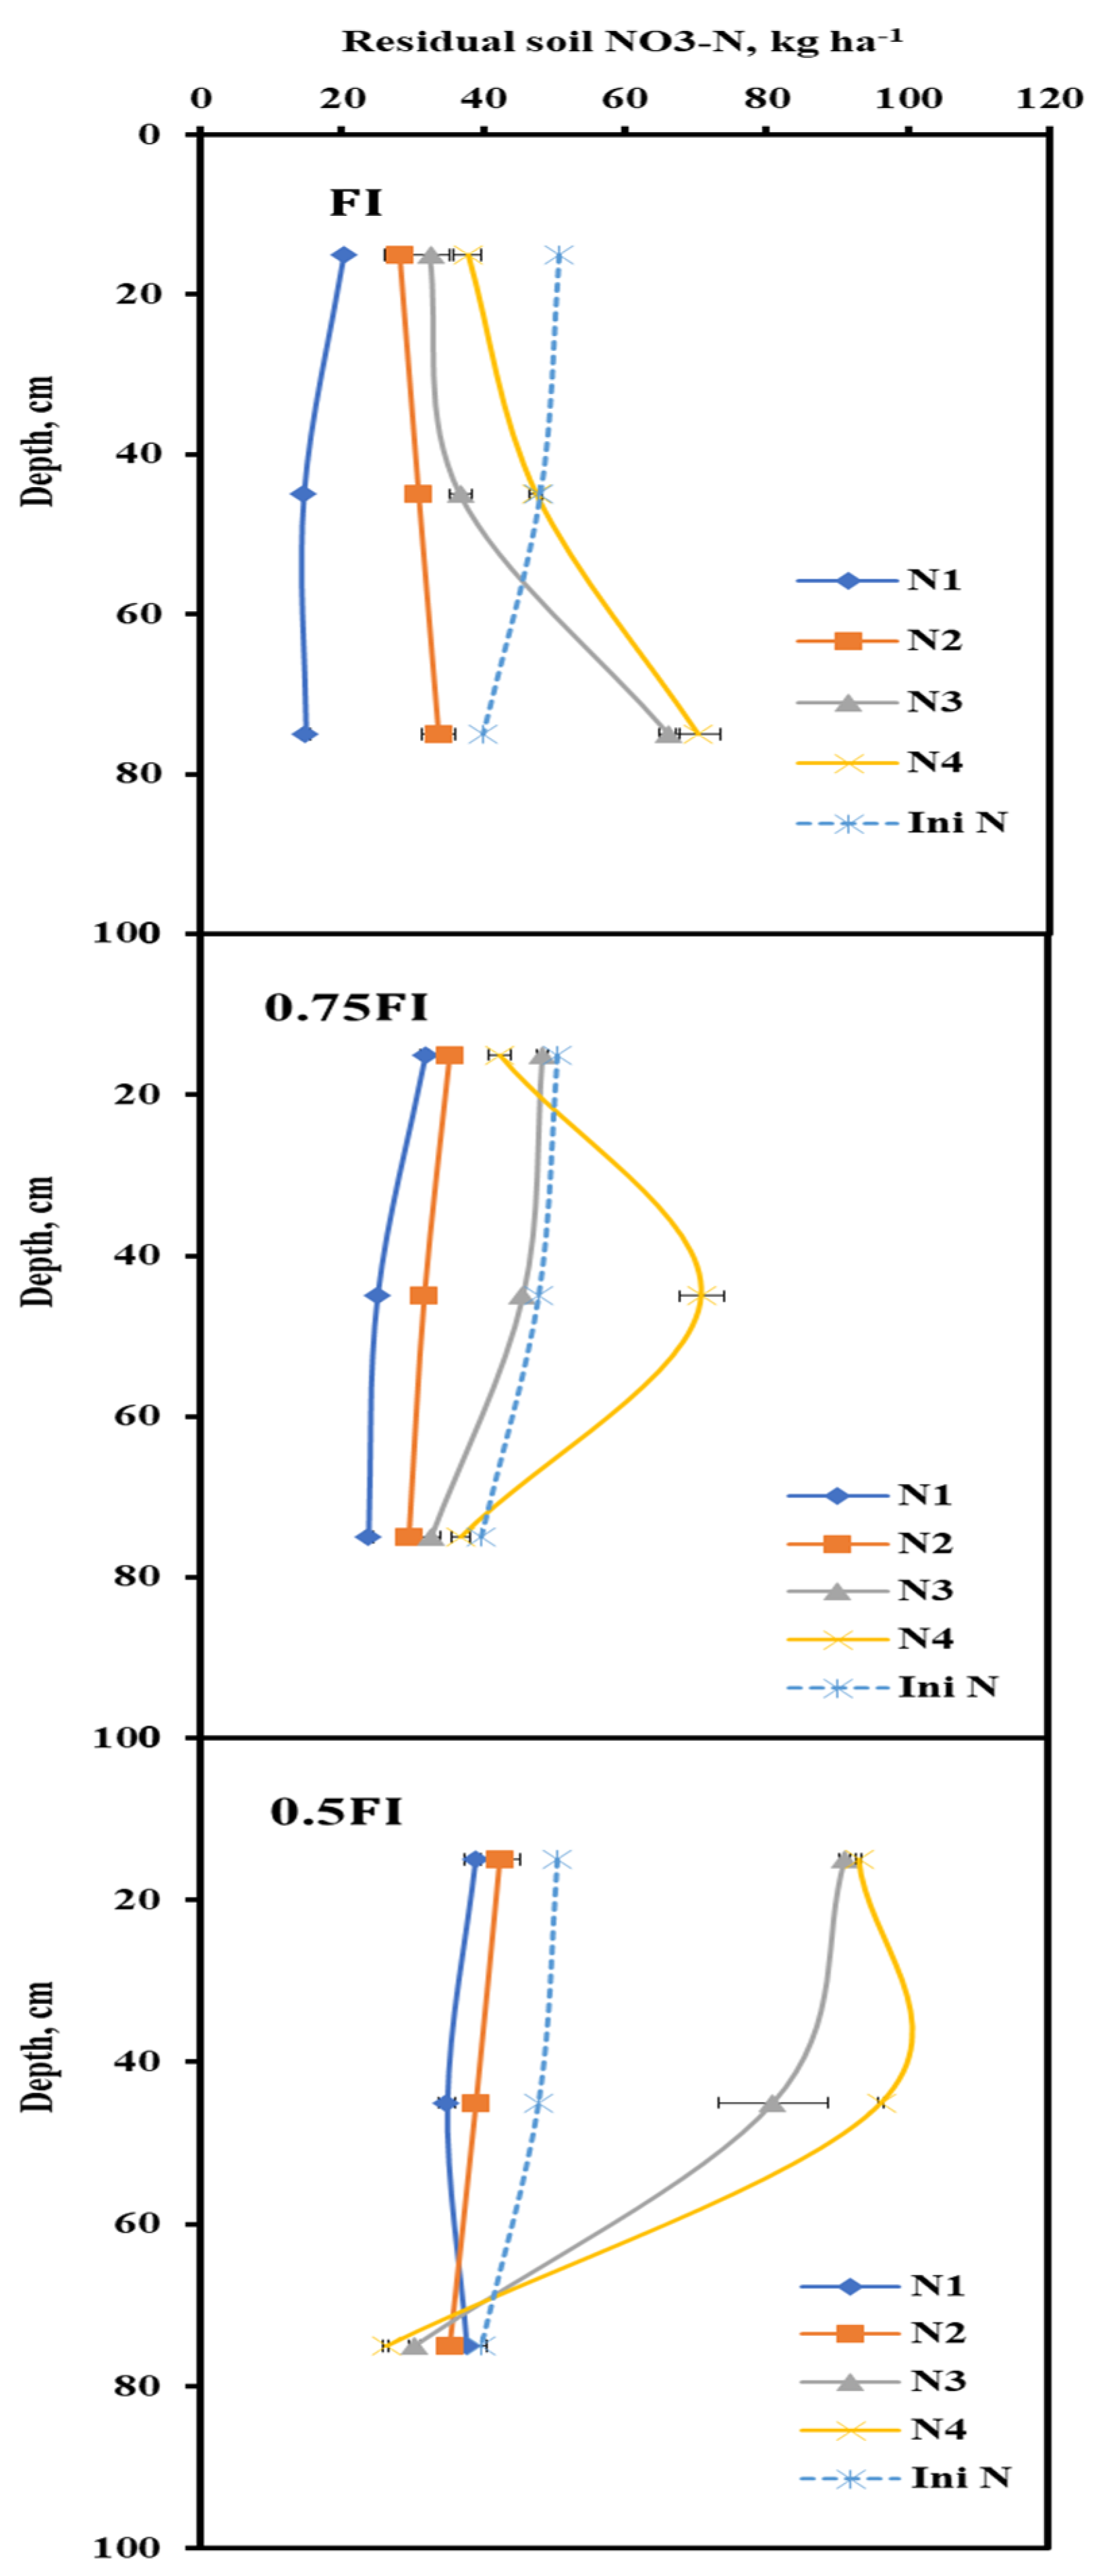
2.6. Residual Soil NO3-N
2.7. The Relationship between Total N Uptake and Transpiration
R2 = 0.76, p < 0.001, SE = 0.35, n = 9
R2 = 0.75, p < 0.001, SE = 0.40, n = 9
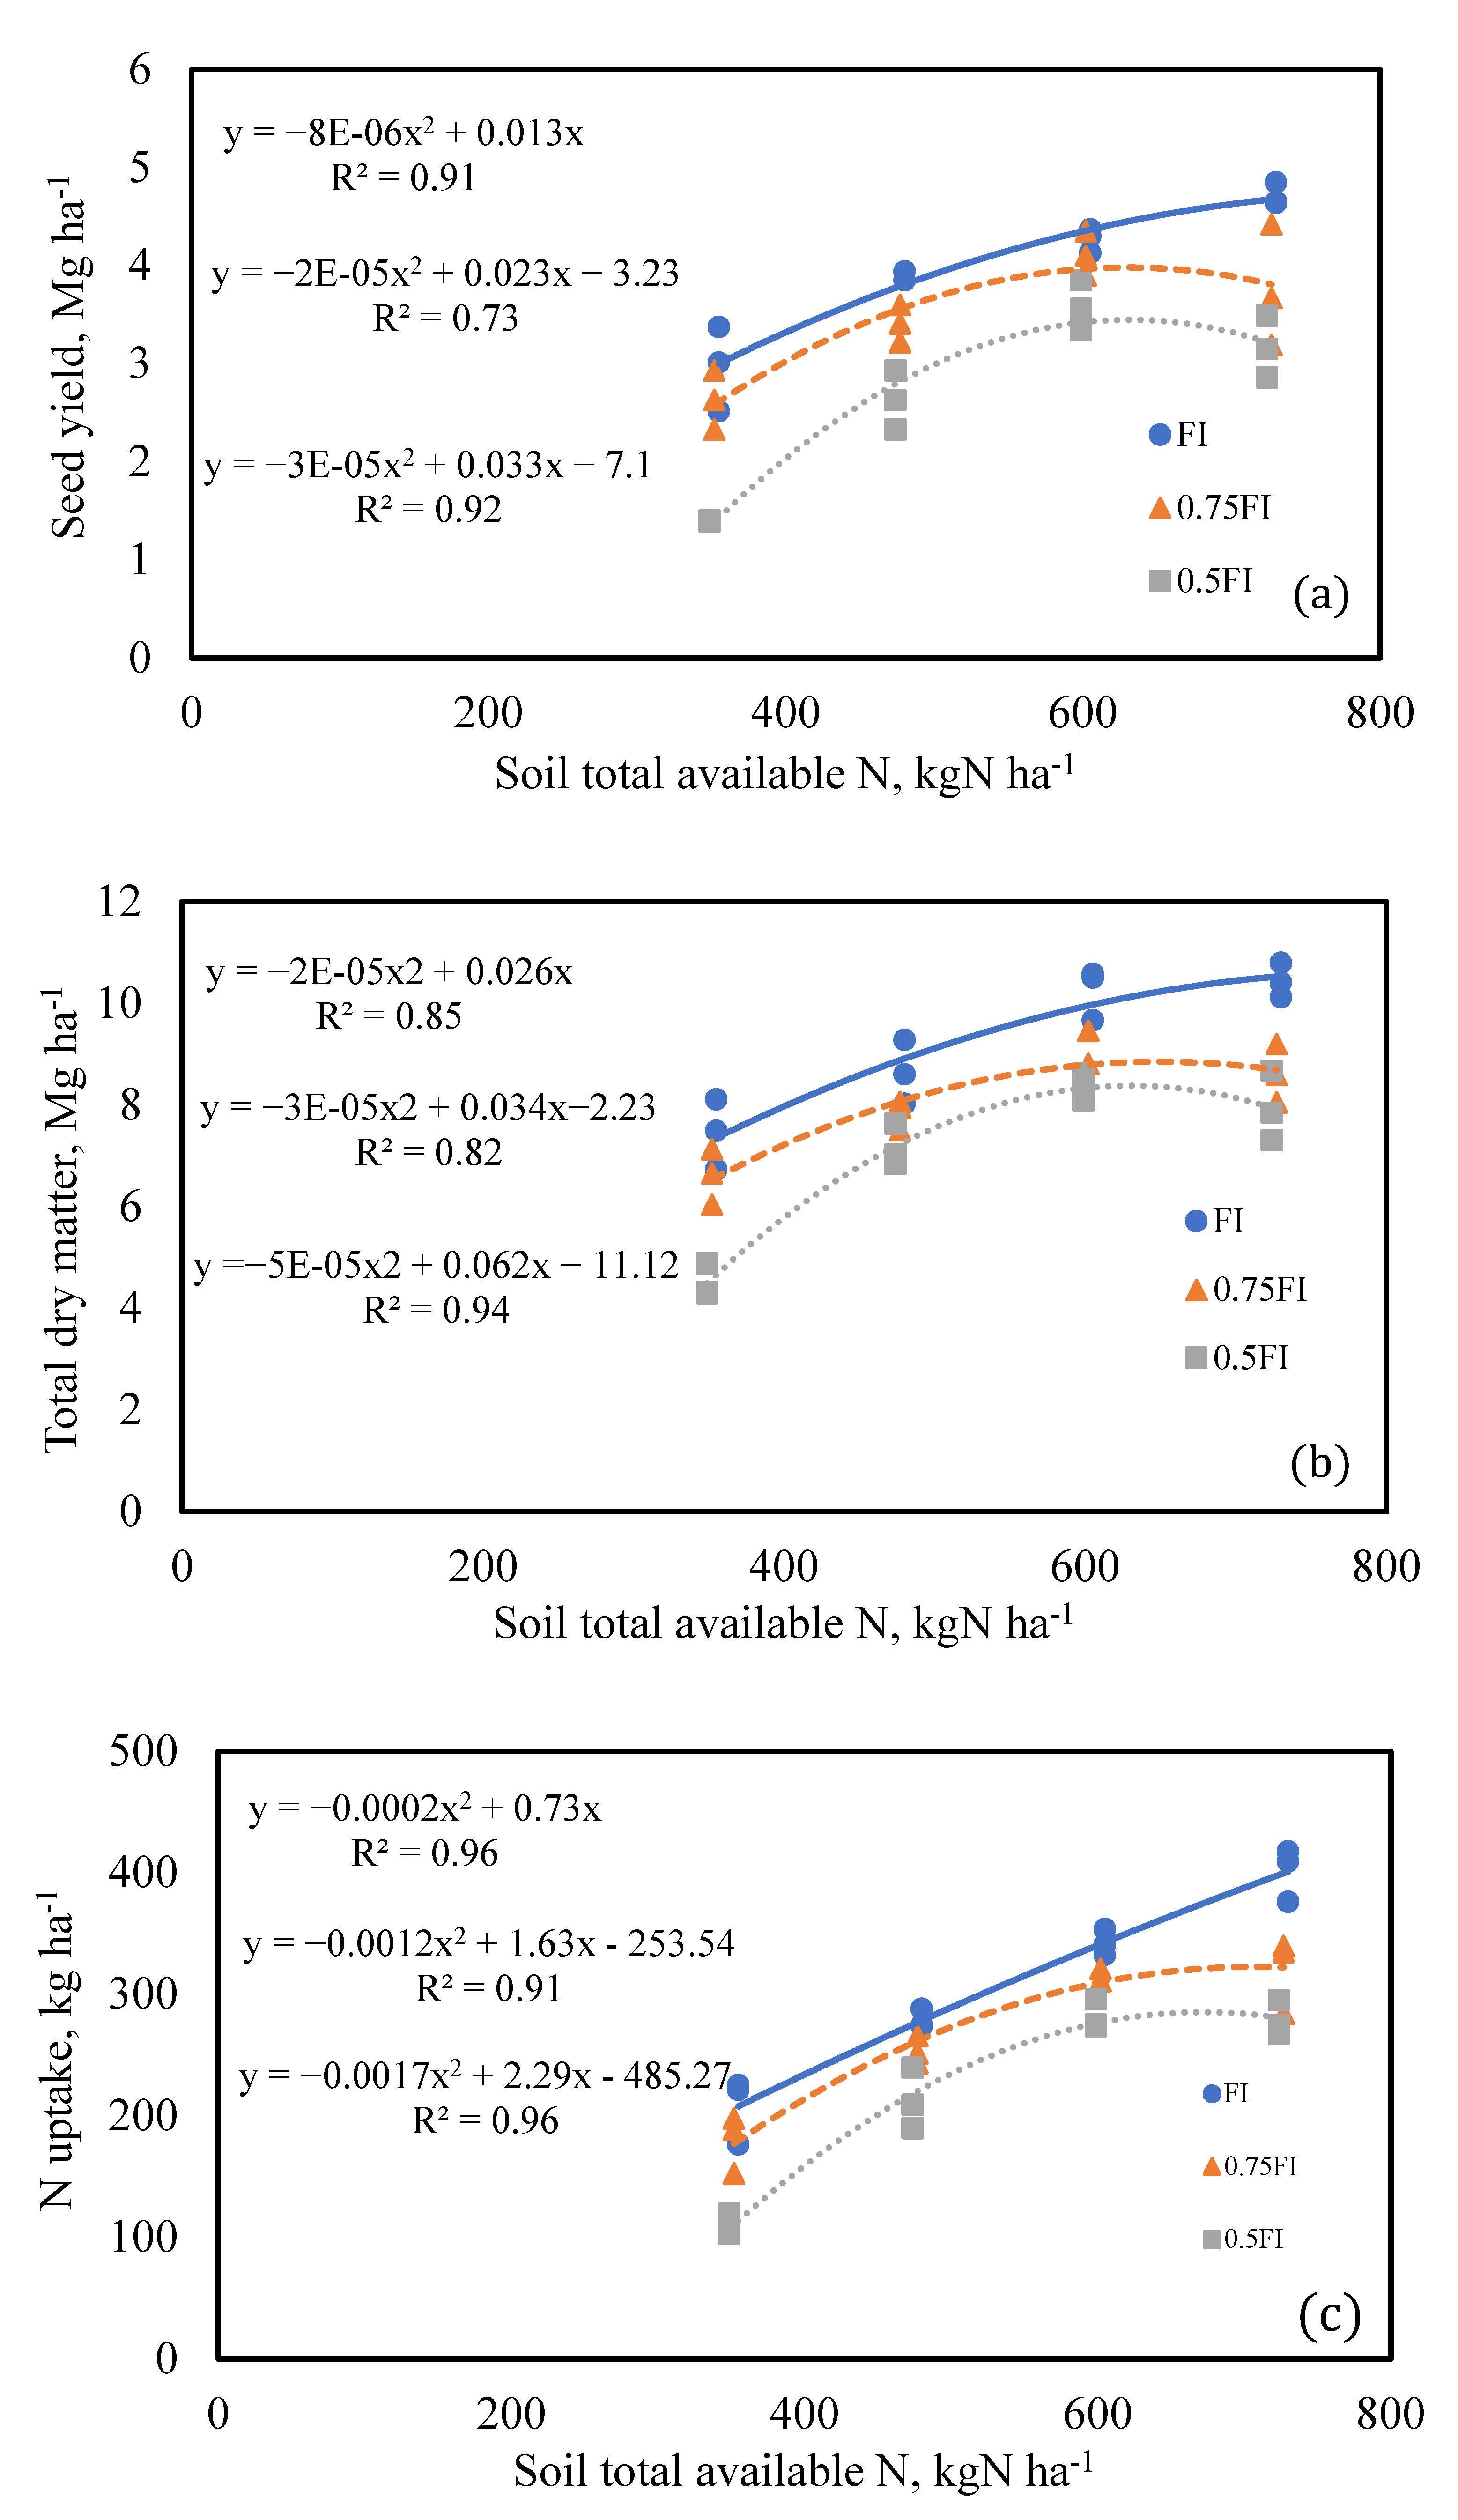
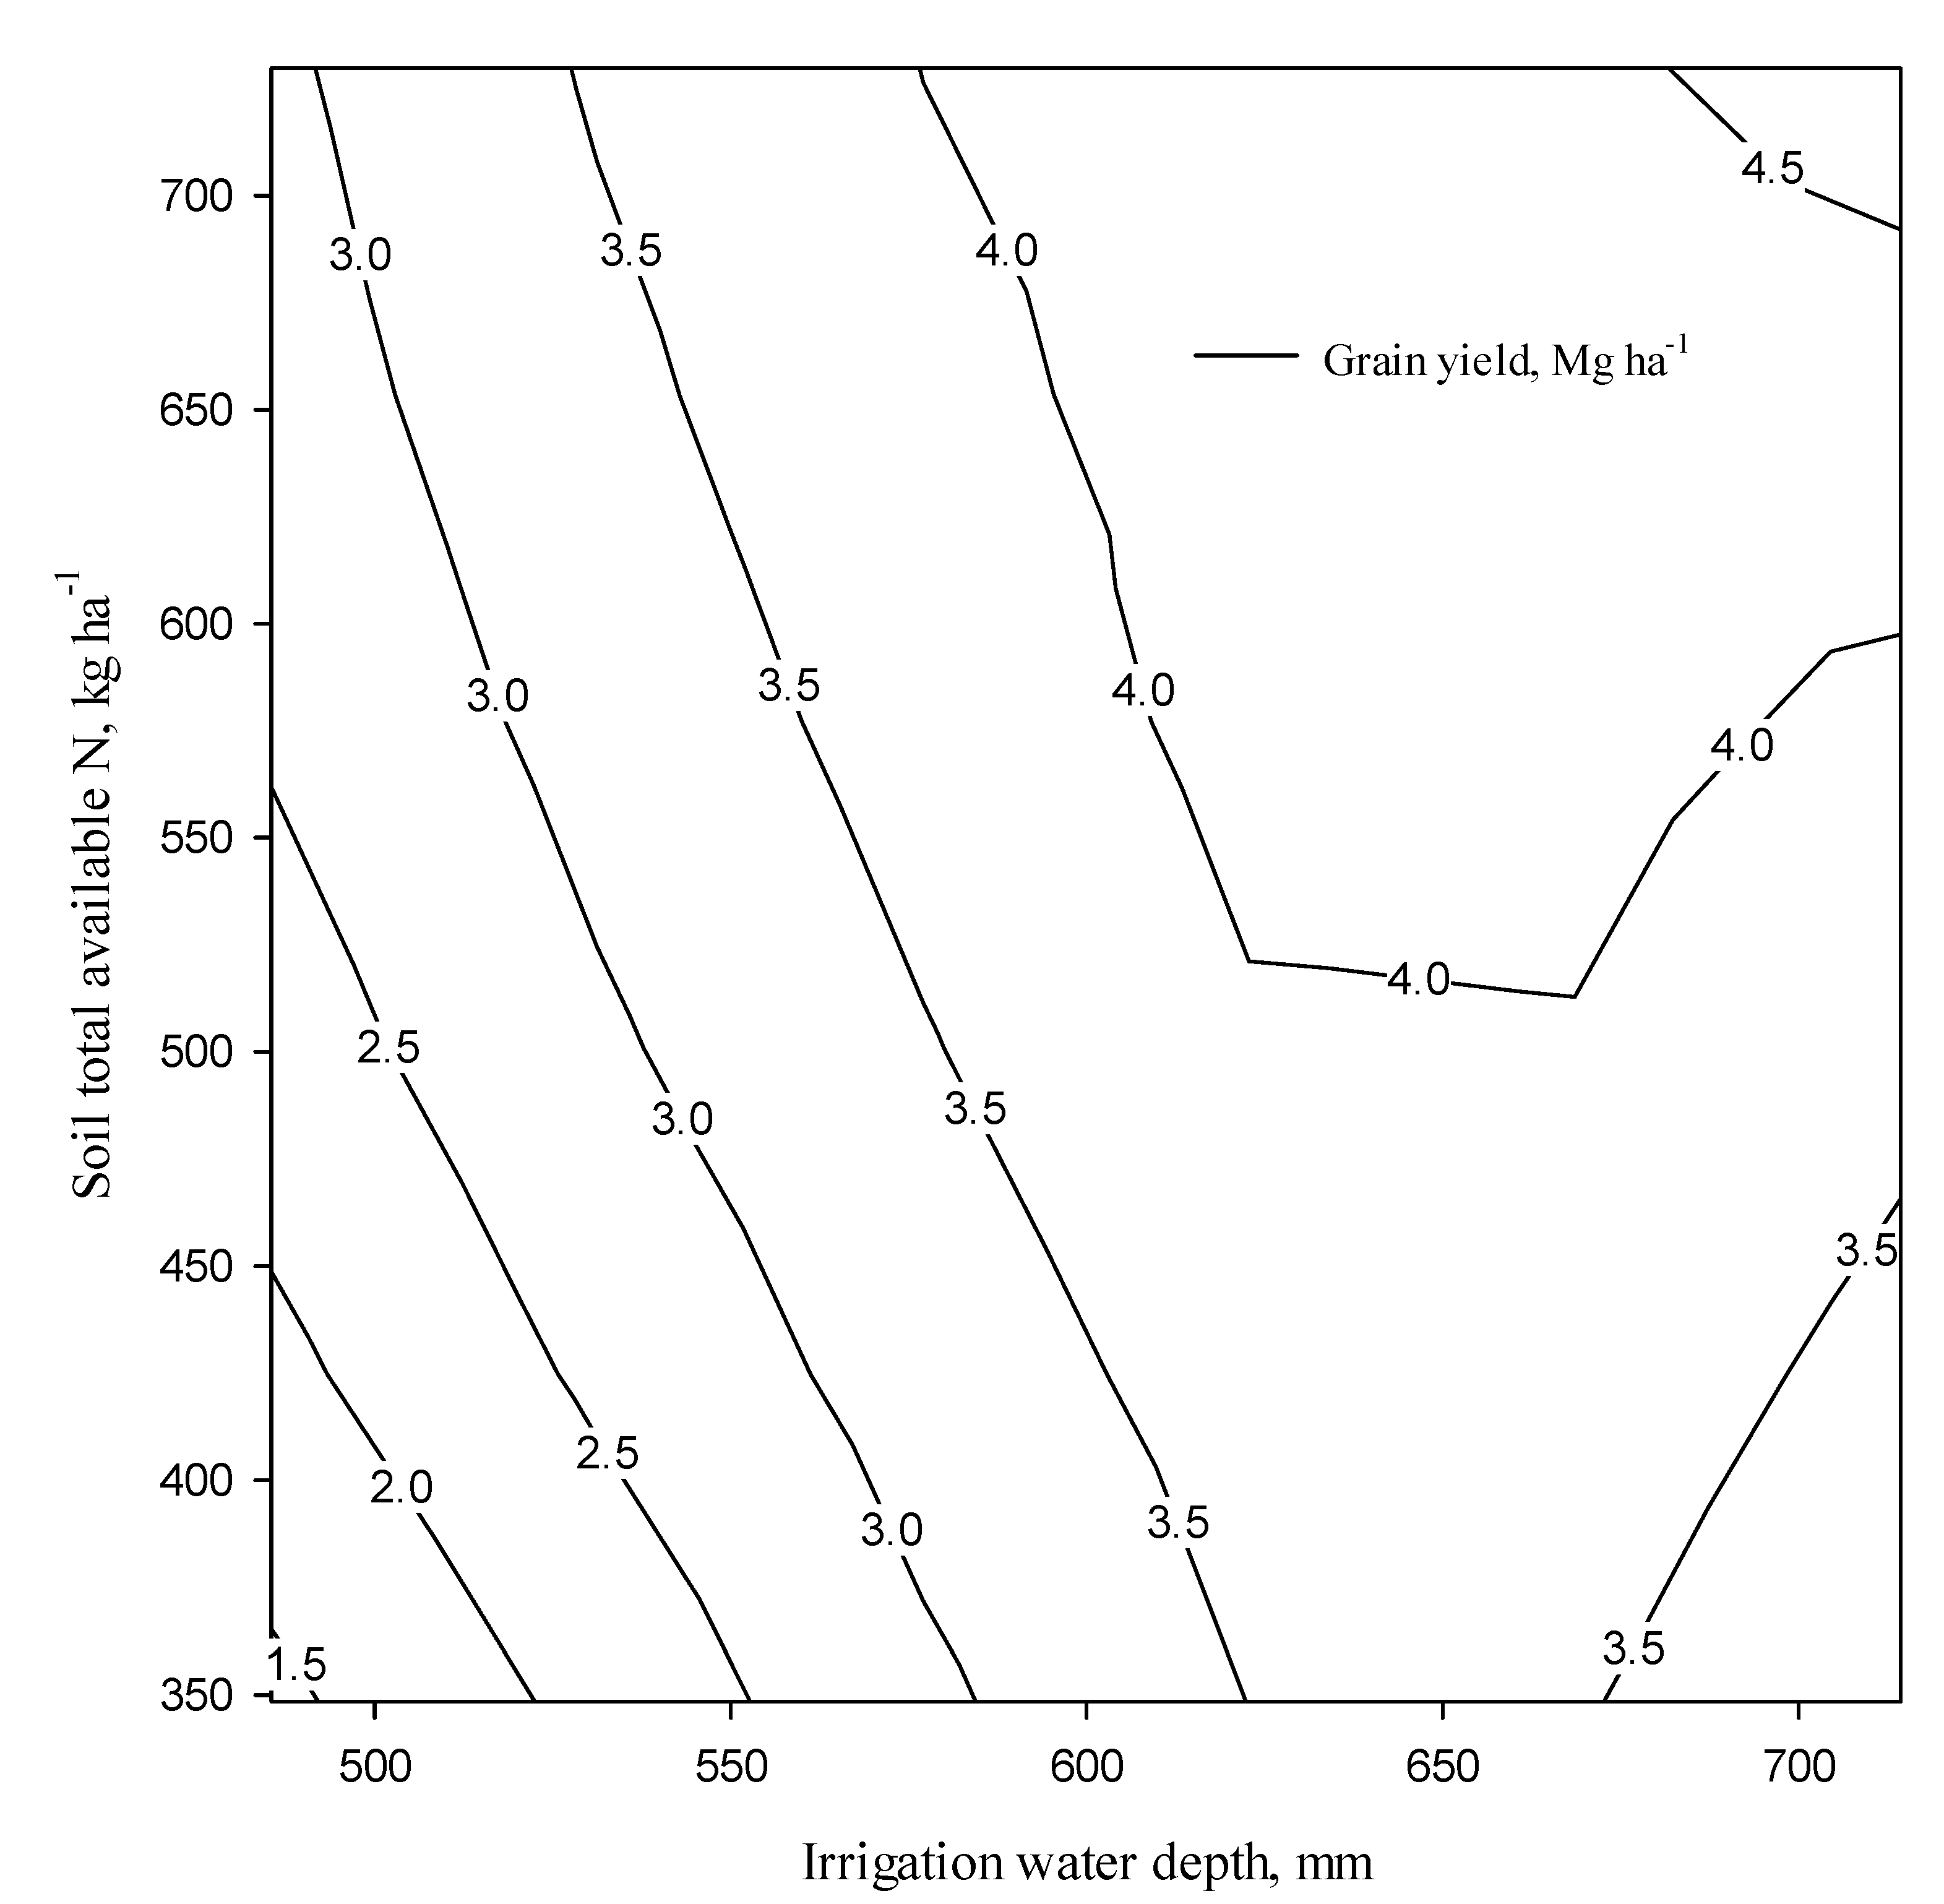
2.8. The Relationship between Soil Total Available N and Yield
R2 = 0.88, p < 0.001, SE = 0.22, n = 9
2.9. Water Use Efficiency
2.10. Nitrogen Efficiencies
3. Discussion
3.1. Quinoa Yield Is Affected by N Application Rate and Irrigation Regimes
3.2. Water and N Efficiencies as Influenced by N Application Rate
3.3. Nitrogen Uptake Mechanism and N Application Rate
4. Materials and Methods
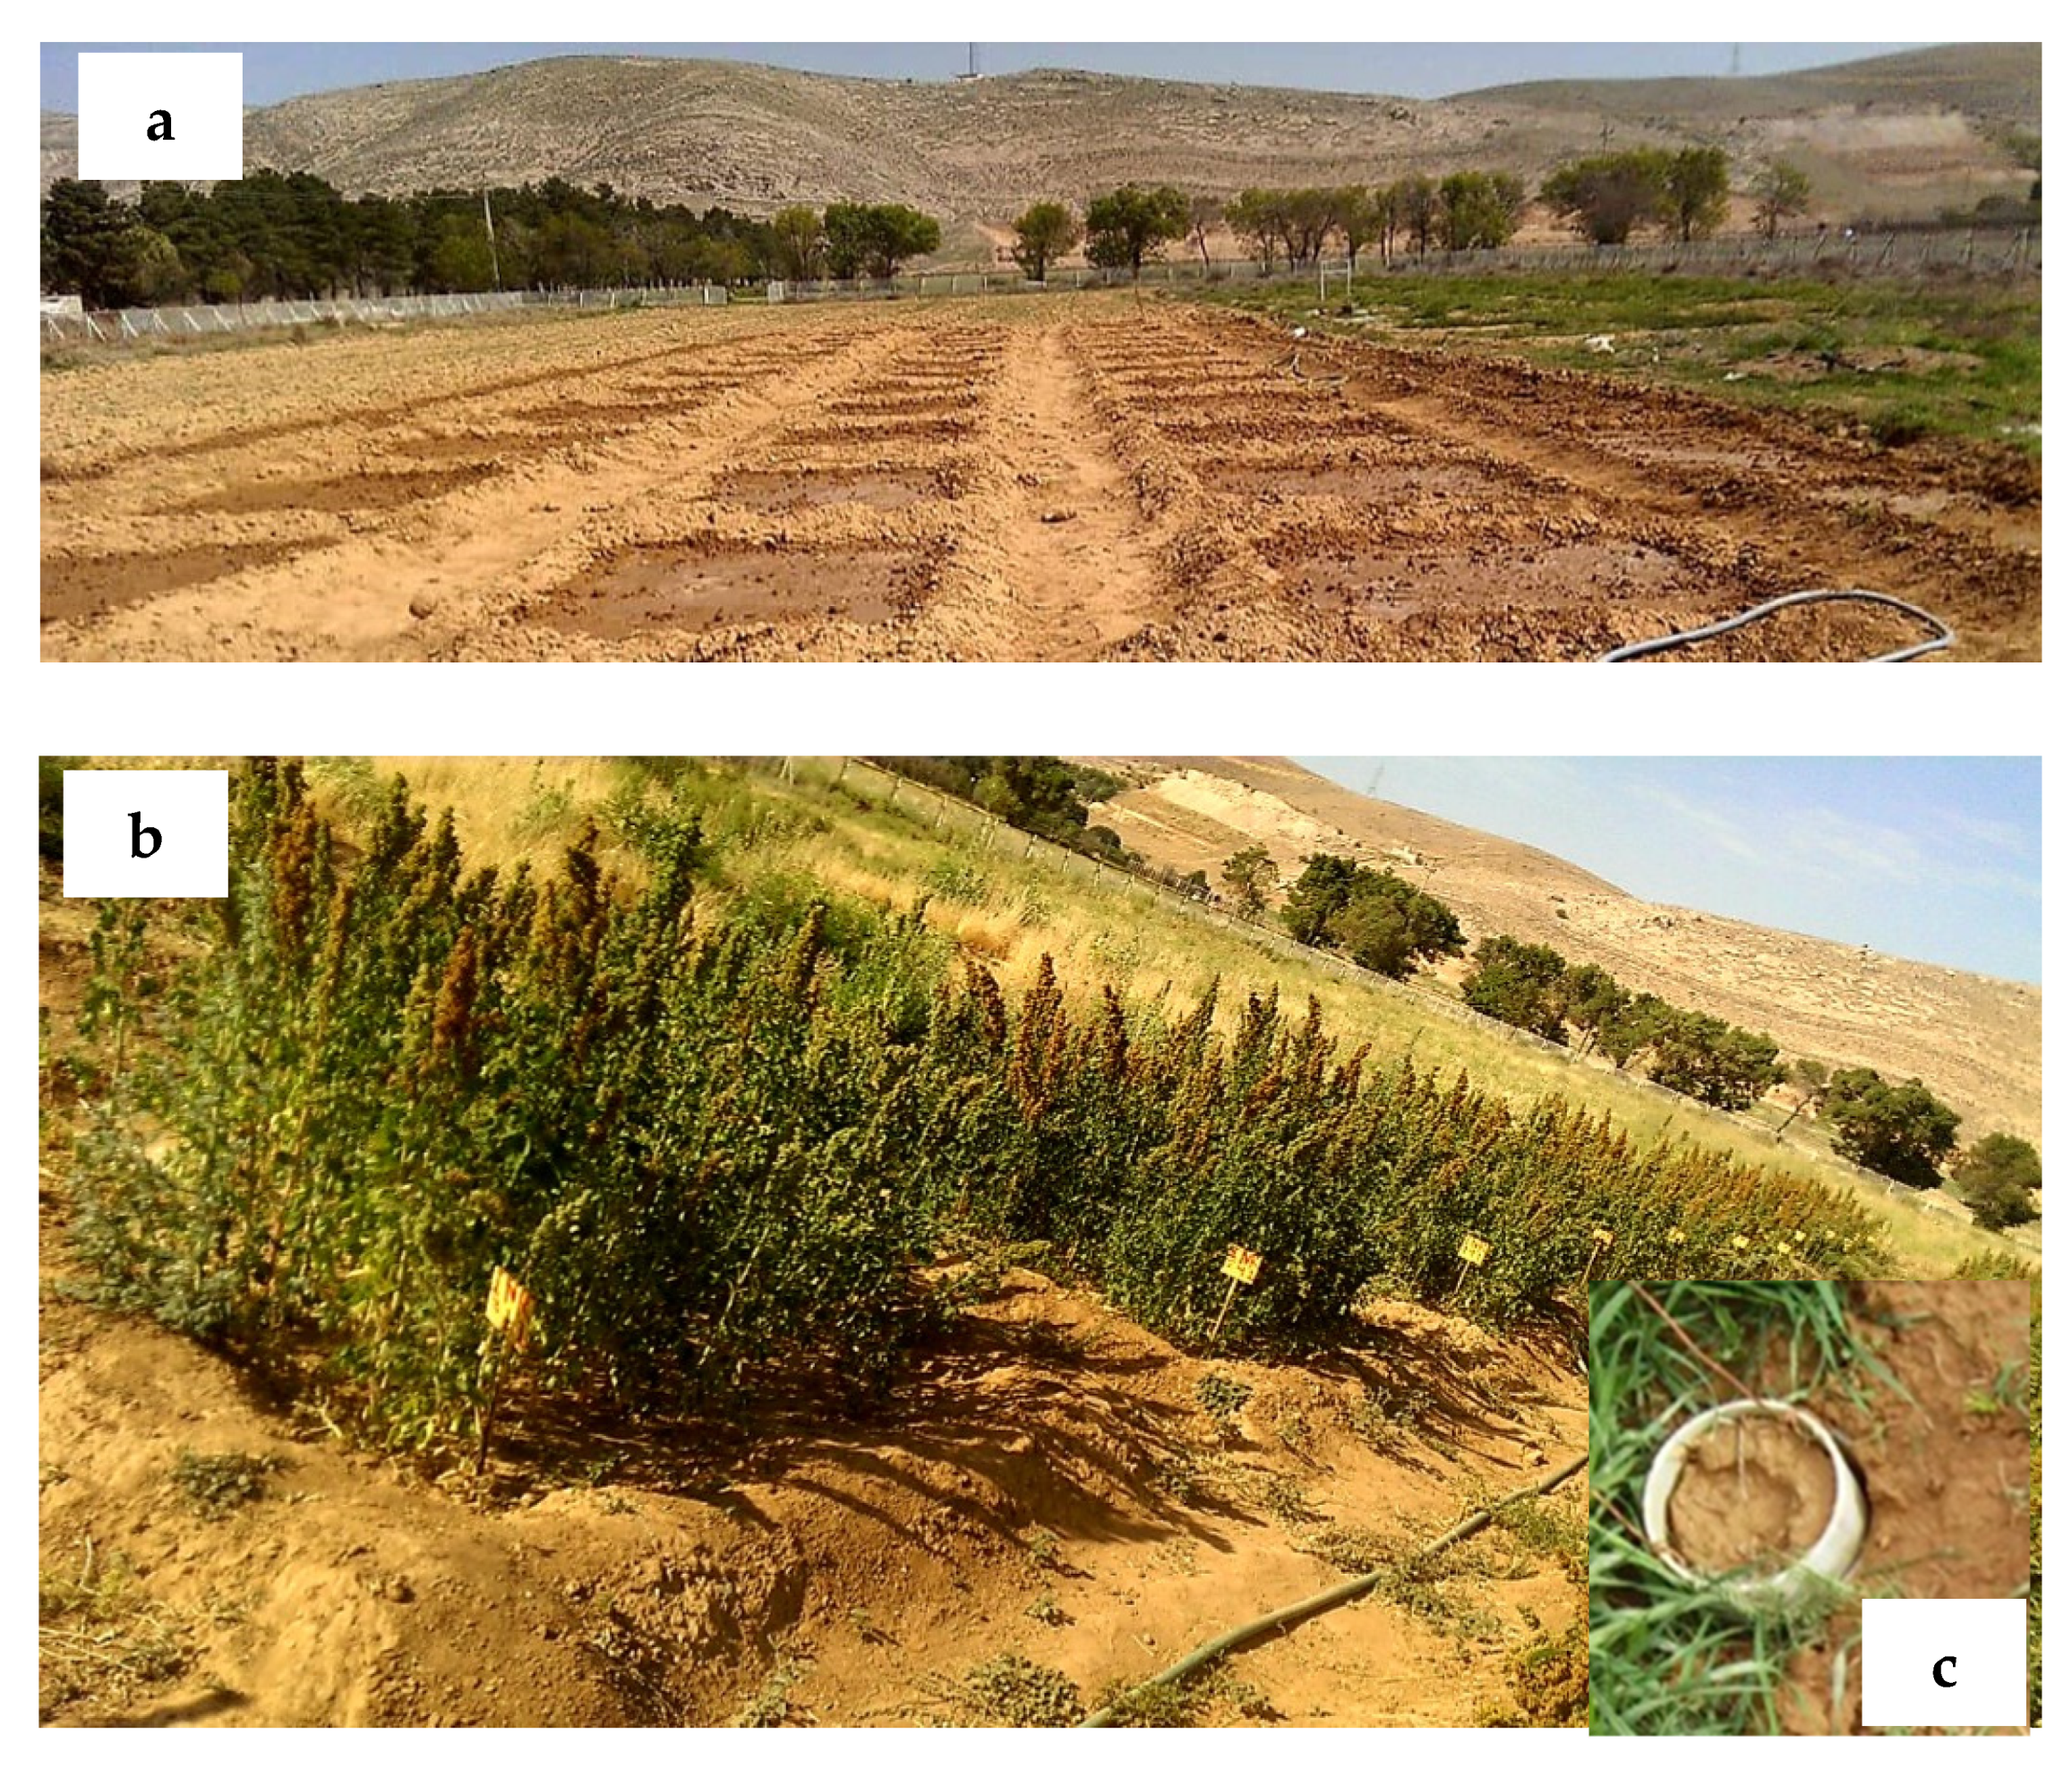
4.1. Experimental Site and Design
4.2. Irrigation Requirement
4.3. Crop Actual Evapotranspiration
4.4. Field Measurements
4.5. Water and Nitrogen Use Efficiencies
4.6. Statistical Analysis
5. Conclusions
Author Contributions
Funding
Institutional Review Board Statement
Informed Consent Statement
Data Availability Statement
Acknowledgments
Conflicts of Interest
References
- Hunter, M.C.; Smith, R.G.; Schipanski, M.E.; Atwood, L.W.; Mortensen, D.A. Agriculture in 2050: Recalibrating Targets for Sustainable Intensification. Bioscience 2017, 67, 386–391. [Google Scholar] [CrossRef] [Green Version]
- Kakabouki, I.; Bilalis, D.; Karkanis, A.; Zervas, G.; Hela, D. Effects of Fertilization and Tillage System on Growth and Crude Protein Content of Quinoa (Chenopodium quinoa Willd.): An Alternative Forage Crop. Emirates J. Food Agric. 2014, 26, 18–24. [Google Scholar] [CrossRef] [Green Version]
- Leakey, R.; Kranjac-Berisavljevic, G.; Caron, P.; Craufurd, P.; Martin, A.M.; McDonald, A.; Abedini, W.; Afiff, S.; Bakurin, N.; Bass, S. Impacts of AKST on Development and Sustainability Goals; Island Press: New York, NY, USA, 2009. [Google Scholar]
- Fathi, F.; Sheikhzeinoddin, A.; Talebnejad, R. Environmental and Economic Risk Management of Seed Maize Production in Iran. J. Clean. Prod. 2020, 258, 120772. [Google Scholar] [CrossRef]
- Ruiz, K.B.; Biondi, S.; Oses, R.; Acuña-Rodríguez, I.S.; Antognoni, F.; Martinez-Mosqueira, E.A.; Coulibaly, A.; Canahua-Murillo, A.; Pinto, M.; Zurita, A.; et al. Quinoa Biodiversity and Sustainability for Food Security under Climate Change. A Review. Agron. Sustain. Dev. 2014, 34, 349–359. [Google Scholar] [CrossRef] [Green Version]
- García-Parra, M.A.; Roa-Acosta, D.F.; Stechauner-Rohringer, R.; García-Molano, F.; Bazile, D.; Plazas-Leguizamón, N. Effect of Temperature on the Growth and Development of Quinoa Plants (Chenopodium quinoa Willd.): A Review on a Global Scale. Sylwan 2020, 164, 411–423. [Google Scholar]
- Ruiz-Carrasco, K.; Antognoni, F.; Coulibaly, A.K.; Lizardi, S.; Covarrubias, A.; Martínez, E.A.; Molina-Montenegro, M.A.; Biondi, S.; Zurita-Silva, A. Variation in Salinity Tolerance of Four Lowland Genotypes of Quinoa (Chenopodium quinoa Willd.) as Assessed by Growth, Physiological Traits, and Sodium Transporter Gene Expression. Plant Physiol. Biochem. 2011, 49, 1333–1341. [Google Scholar] [CrossRef]
- Hatfield, J.L.; Prueger, J.H. Temperature Extremes: Effect on Plant Growth and Development. Weather Clim. Extrem. 2015, 10, 4–10. [Google Scholar] [CrossRef] [Green Version]
- Kaya, Ç.I.; Yazar, A.; Sezen, S.M. SALTMED Model Performance on Simulation of Soil Moisture and Crop Yield for Quinoa Irrigated Using Different Irrigation Systems, Irrigation Strategies and Water Qualities in Turkey. Agric. Agric. Sci. Procedia 2015, 4, 108–118. [Google Scholar] [CrossRef]
- Choukr-Allah, R.; Rao, N.K.; Hirich, A.; Shahid, M.; Alshankiti, A.; Toderich, K.; Gill, S.; Butt, K.U.R. Quinoa for Marginal Environments: Toward Future Food and Nutritional Security in MENA and Central Asia Regions. Front. Plant Sci. 2016, 7, 346. [Google Scholar] [CrossRef] [Green Version]
- Bazile, D.; Bertero, H.D.; Nieto, C. State of the Art Report on Quinoa around the World in 2013; FAO & CIRAD: Rome, Italy, 2015. [Google Scholar]
- Talebnejad, R.; Sepaskhah, A.R. Effect of deficit irrigation and different saline groundwater depths on yield and water productivity of quinoa in lysimiter. Agric. Water Manag. 2015, 159, 225–238. [Google Scholar] [CrossRef]
- Talebnejad, R.; Sepaskhah, A.R. Modification of Transient State Analytical Model under Different Saline Groundwater Depths, Irrigation Water Salinities and Deficit Irrigation for Quinoa. Int. J. Plant Prod. 2016, 10, 365–390. [Google Scholar] [CrossRef]
- Talebnejad, R.; Sepaskhah, A.R. Effect of Different Saline Groundwater Depths and Irrigation Water Salinities on Yield and Water Use of Quinoa in Lysimeter. Agric. Water Manag. 2015, 148, 177–188. [Google Scholar] [CrossRef]
- Ruiz, K.B.; Biondi, S.; Martínez, E.A.; Orsini, F.; Antognoni, F.; Jacobsen, S.-E. Quinoa–a Model Crop for Understanding Salt-Tolerance Mechanisms in Halophytes. Plant Biosyst. Int. J. Deal. All Asp. Plant Biol. 2016, 150, 357–371. [Google Scholar] [CrossRef]
- Sellami, M.H.; Pulvento, C.; Lavini, A. Agronomic Practices and Performances of Quinoa under Field Conditions: A Systematic Review. Plants 2021, 10, 72. [Google Scholar] [CrossRef]
- Jacobsen, S.E.; Monteros, C.; Christiansen, J.L.; Bravo, L.A.; Corcuera, L.J.; Mujica, A. Plant Responses of Quinoa (Chenopodium quinoa Willd.) to Frost at Various Phenological Stages. Eur. J. Agron. 2005, 22, 131–139. [Google Scholar] [CrossRef]
- Bazile, D.; Pulvento, C.; Verniau, A.; Al-Nusairi, M.S.; Ba, D.; Breidy, J.; Hassan, L.; Mohammed, M.I.; Mambetov, O.; Otambekova, M. Worldwide Evaluations of Quinoa: Preliminary Results from Post International Year of Quinoa FAO Projects in Nine Countries. Front. Plant Sci. 2016, 7, 850. [Google Scholar] [CrossRef] [Green Version]
- De Ron, A.M.; Sparvoli, F.; Pueyo, J.J.; Bazile, D. The Challenge of Protein Crops as a Sustainable Source of Food and Feed for the Future; Frontiers Media SA: Lausanne, Switzerland, 2017; ISBN 2889451623. [Google Scholar]
- Andreotti, F.; Bazile, D.; Biaggi, C.; Callo-Concha, D.; Jacquet, J.; Jemal, O.M.; King, O.I.; Mbosso, C.; Padulosi, S.; Speelman, E.N. When Neglected Species Gain Global Interest: Lessons Learned from Quinoa’s Boom and Bust for Teff and Minor Millet. Glob. Food Sec. 2022, 32, 100613. [Google Scholar] [CrossRef]
- Maliro, M.F.A.; Abang, M.; Mukankusi, C.; Lung’aho, M.; Fenta, B.; Wanderi, S.; Kapa, R.; Okiro, O.A.; Kooma, E.; Mwaba, C.; et al. Prospects for Quinoa Adaptation and Utilization in Eastern and Southern Africa: Technological, Institutional and Policy Considerations; Food & Agriculture Org: Rome, Italy, 2021; ISBN 9251336873. [Google Scholar]
- Nowak, V.; Du, J.; Charrondière, U.R. Assessment of the Nutritional Composition of Quinoa (Chenopodium quinoa Willd.). Food Chem. 2016, 193, 47–54. [Google Scholar] [CrossRef]
- Bilalis, D.; Roussis, I.; Fuentes, F.; Kakabouki, I.; Travlos, I. Organic Agriculture and Innovative Crops under Mediterranean Conditions. Not. Bot. Horti Agrobot. Cluj-Napoca 2017, 45, 323–331. [Google Scholar] [CrossRef] [Green Version]
- Comai, S.; Bertazzo, A.; Bailoni, L.; Zancato, M.; Costa, C.V.L.; Allegri, G. The Content of Proteic and Nonproteic (Free and Protein-Bound) Tryptophan in Quinoa and Cereal Flours. Food Chem. 2007, 100, 1350–1355. [Google Scholar] [CrossRef]
- Geerts, S.; Raes, D.; Garcia, M.; Taboada, C.; Miranda, R.; Cusicanqui, J.; Mhizha, T.; Vacher, J. Modeling the Potential for Closing Quinoa Yield Gaps under Varying Water Availability in the Bolivian Altiplano. Agric. Water Manag. 2009, 96, 1652–1658. [Google Scholar] [CrossRef]
- Razzaghi, F.; Bahadori-Ghasroldashti, M.R.; Henriksen, S.; Sepaskhah, A.R.; Jacobsen, S. Physiological Characteristics and Irrigation Water Productivity of Quinoa (Chenopodium quinoa Willd.) in Response to Deficit Irrigation Imposed at Different Growing Stages—A Field Study from Southern Iran. J. Agron. Crop Sci. 2020, 206, 390–404. [Google Scholar] [CrossRef]
- Geerts, S.; Raes, D.; Garcia, M.; Mendoza, J.; Huanca, R. Crop Water Use Indicators to Quantify the Flexible Phenology of Quinoa (Chenopodium quinoa Willd.) in Response to Drought Stress. Field Crop. Res. 2008, 108, 150–156. [Google Scholar] [CrossRef]
- Garcia, M.; Raes, D.; Jacobsen, S.E. Evapotranspiration Analysis and Irrigation Requirements of Quinoa (Chenopodium quinoa) in the Bolivian Highlands. Agric. Water Manag. 2003, 60, 119–134. [Google Scholar] [CrossRef]
- Geerts, S.; Raes, D.; Garcia, M.; Del Castillo, C.; Buytaert, W. Agro-Climatic Suitability Mapping for Crop Production in the Bolivian Altiplano: A Case Study for Quinoa. Agric. For. Meteorol. 2006, 139, 399–412. [Google Scholar] [CrossRef]
- Talebnejad, R.; Sepaskhah, A.R.; Bahrami, M. Quinoa, a Promising Halophyte with Modified Planting Date, and Minimum Water and Pesticide Requirements for Fars Province, Iran. In Future of Sustainable Agriculture in Saline Environments; CRC Press: Boca Raton, FL, USA, 2021; pp. 413–426. ISBN 1003112323. [Google Scholar]
- Geerts, S.; Raes, D.; Garcia, M.; Vacher, J.; Mamani, R.; Mendoza, J.; Huanca, R.; Morales, B.; Miranda, R.; Cusicanqui, J.; et al. Introducing Deficit Irrigation to Stabilize Yields of Quinoa (Chenopodium quinoa Willd.). Eur. J. Agron. 2008, 28, 427–436. [Google Scholar] [CrossRef]
- Repo-Carrasco, R.; Espinoza, C.; Jacobsen, S.-E.-E. Nutritional Value and Use of the Andean Crops Quinoa (Chenopodium quinoa) and Kañiwa (Chenopodium Pallidicaule). Food Rev. Int. 2003, 19, 179–189. [Google Scholar] [CrossRef]
- Geren, H. Effects of Different Nitrogen Levels on the Grain Yield and Some Yield Components of Quinoa (Chenopodium quinoa Willd.) under Mediterranean Climatic Conditions. Turk. J. Field Crop. 2015, 20, 59–64. [Google Scholar] [CrossRef] [Green Version]
- Alandia, G.; Jacobsen, S.; Kyvsgaard, N.C.; Condori, B.; Liu, F. Nitrogen Sustains Seed Yield of Quinoa under Intermediate Drought. J. Agron. Crop Sci. 2016, 202, 281–291. [Google Scholar] [CrossRef]
- Mahbod, M.; Zand-Parsa, S.; Sepaskhah, A.R. Modification of Maize Simulation Model for Predicting Growth and Yield of Winter Wheat under Different Applied Water and Nitrogen. Agric. Water Manag. 2015, 150, 18–34. [Google Scholar] [CrossRef]
- Oelke, E.A.; Oplinger, E.S.; Teynor, T.M.; Putnam, D.H.; Doll, J.D.; Kelling, K.A.; Durgan, B.R.; Noetzel, D.M. Safflower. In Alternative Field Crops Manual; Purdue University: St. Paul, MN, USA, 1992; pp. 1–8. [Google Scholar]
- Kaul, H.-P.; Kruse, M.; Aufhammer, W. Yield and Nitrogen Utilization Efficiency of the Pseudocereals Amaranth, Quinoa, and Buckwheat under Differing Nitrogen Fertilization. Eur. J. Agron. 2005, 22, 95–100. [Google Scholar]
- Razzaghi, F.; Plauborg, F.; Jacobsen, S.E.; Jensen, C.R.; Andersen, M.N. Effect of Nitrogen and Water Availability of Three Soil Types on Yield, Radiation Use Efficiency and Evapotranspiration in Field-Grown Quinoa. Agric. Water Manag. 2012, 109, 20–29. [Google Scholar] [CrossRef]
- Alvar-Beltrán, J.; Dao, A.; Dalla Marta, A.; Saturnin, C.; Casini, P.; Sanou, J.; Orlandini, S. Effect of Drought, Nitrogen Fertilization, Temperature and Photoperiodicity on Quinoa Plant Growth and Development in the Sahel. Agronomy 2019, 9, 607. [Google Scholar] [CrossRef] [Green Version]
- Wang, N.; Wang, F.-X.; Shock, C.C.; Meng, C.-B.; Huang, Z.-J.; Gao, L.; Zhao, J.-Y. Evaluating Quinoa Stem Lodging Susceptibility by a Mathematical Model and the Finite Element Method under Different Agronomic Practices. Field Crop. Res. 2021, 271, 108241. [Google Scholar] [CrossRef]
- Marschner, H. Marschner’s Mineral Nutrition of Higher Plants; Academic Press: Cambridge, MA, USA, 2011; ISBN 0123849063. [Google Scholar]
- Below, F.E. Nitrogen Metabolism and Crop Productivity. Handb. plant Crop Physiol. 2002, 2, 385–406. [Google Scholar]
- Mehrabi, F.; Sepaskhah, A.R. Partial Root Zone Drying Irrigation, Planting Methods and Nitrogen Fertilization Influence on Physiologic and Agronomic Parameters of Winter Wheat. Agric. Water Manag. 2019, 223, 105688. [Google Scholar] [CrossRef]
- Breidy, J. Final Report on Quinoa Evaluation Trials in Lebanon; Rome FAO: Rome, Italy, 2015. [Google Scholar]
- Djamal, S. Technical Assistance for the Introduction of Quinoa and Appropriation/Institutionalization of Its Production in Algeria-Second Evaluation Report; Rome FAO: Rome, Italy, 2015. [Google Scholar]
- Hassan, L. Iraq Final Evaluation Report on Quinoa; Rome FAO: Rome, Italy, 2015. [Google Scholar]
- Saeed, A.L. Yemen Progress Report on Quinoa; Rome FAO: Rome, Italy, 2015. [Google Scholar]
- Fonseca, A.E.; Westgate, M.E. Relationship between Desiccation and Viability of Maize Pollen. Field Crop. Res. 2005, 94, 114–125. [Google Scholar] [CrossRef]
- Curti, R.N.; De la Vega, A.J.; Andrade, A.J.; Bramardi, S.J.; Bertero, H.D. Adaptive Responses of Quinoa to Diverse Agro-Ecological Environments along an Altitudinal Gradient in North West Argentina. Field Crop. Res. 2016, 189, 10–18. [Google Scholar] [CrossRef]
- Shams, A.S. Response of Quinoa to Nitrogen Fertilizer Rates under Sandy Soil Conditions. In Proceedings of the 13th International Conference Agriculture, Faculty of Agriculture, Benha University, Benha, Egypt, 10 September 2012; pp. 9–10. [Google Scholar]
- Hirich, A.; Choukr-Allah, R.; Jacobsen, S. Deficit Irrigation and Organic Compost Improve Growth and Yield of Quinoa and Pea. J. Agron. Crop Sci. 2014, 200, 390–398. [Google Scholar] [CrossRef]
- Yazar, A.; Incekaya, Ç.; Sezen, S.M.; Jacobsen, S.-E. Saline Water Irrigation of Quinoa (Chenopodium quinoa) under Mediterranean Conditions. Crop Pasture Sci. 2015, 66, 993–1002. [Google Scholar] [CrossRef]
- Azizian, A.; Sepaskhah, A.R. Maize Response to Different Water, Salinity and Nitrogen Levels: Agronomic Behavior. Int. J. Plant Prod. 2014, 8, 107–130. [Google Scholar]
- Riccardi, M.; Pulvento, C.; Lavini, A.; d’Andria, R.; Jacobsen, S.E. Growth and Ionic Content of Quinoa under Saline Irrigation. J. Agron. Crop Sci. 2014, 200, 246–260. [Google Scholar] [CrossRef]
- Mehrabi, F.; Sepaskhah, A.R. Interaction Effects of Planting Method, Irrigation Regimes, and Nitrogen Application Rates on Yield, Water and Nitrogen Use Efficiencies of Winter Wheat (Triticum Aestivum). Int. J. Plant Prod. 2018, 12, 265–283. [Google Scholar] [CrossRef]
- Reid, R.; Hayes, J. Mechanisms and Control of Nutrient Uptake in Plants. Int. Rev. Cytol. 2003, 229, 73–115. [Google Scholar] [PubMed]
- Glass, A.D.M. Nitrate Uptake by Plant Roots. Botany 2009, 87, 659–667. [Google Scholar] [CrossRef]
- Antonopoulos, V.Z. Modelling of Water and Nitrogen Balances in the Ponded Water and Soil Profile of Rice Fields in Northern Greece. Agric. Water Manag. 2010, 98, 321–330. [Google Scholar] [CrossRef]
- Hanson, B.R.; Šimůnek, J.; Hopmans, J.W. Evaluation of Urea–Ammonium–Nitrate Fertigation with Drip Irrigation Using Numerical Modeling. Agric. Water Manag. 2006, 86, 102–113. [Google Scholar] [CrossRef]
- Yarami, N.; Sepaskhah, A.R. Saffron Response to Irrigation Water Salinity, Cow Manure and Planting Method. Agric. Water Manag. 2015, 150, 57–66. [Google Scholar] [CrossRef]
- Razzaghi, F.; Sepaskhah, A.R. Calibration and Validation of Four Common ET0 Estimation Equations by Lysimeter Data in a Semi-Arid Environment. Arch. Agron. Soil Sci. 2012, 58, 303–319. [Google Scholar] [CrossRef]
- Jacobson, D.A.; Streich, J.C.; Stanschewski, C.S.; Rey, E.; Fiene, G.; Craine, E.; Wellman, G.; Melino, V.; Patiranage, D.S.R.; Johansen, K. Quinoa Phenotyping Methodologies: An International Consensus. Plants 2021, 10, 1759. [Google Scholar]
- Singh, R.J.; Ahlawat, I.P.S. Dry Matter, Nitrogen, Phosphorous, and Potassium Partitioning, Accumulation, and Use Efficiency in Transgenic Cotton-Based Cropping Systems. Commun. Soil Sci. Plant Anal. 2012, 43, 2633–2650. [Google Scholar] [CrossRef]

| Parameters | Irrigation Treatment | Nitrogen Application Rate (kg N ha−1) | |
|---|---|---|---|
| 0 | 250 | ||
| Mean volumetric soil water content before irrigation, % | FI | 23.8 a * | 22.5 ab |
| 0.75 FI | 22.2 ab | 21.0 b | |
| 0.5 FI | 21.2 b | 20.8 b | |
| Seasonal evapotranspiration, mm | FI | 802.50 a | 782.1 a |
| 0.75 FI | 676.5 b | 655.9 b | |
| 0.5 FI | 542.2 c | 528.0 c | |
| Seasonal transpiration, mm | FI | 377.4 b | 479.3 a |
| 0.75 FI | 295.7 c | 396.2 b | |
| 0.5 FI | 236.2 c | 363.8 b | |
| Seasonal evaporation, mm | FI | 425.1 a | 302.8 b |
| 0.75 FI | 380.9 a | 259.7 b | |
| 0.5 FI | 306.0 b | 164.2 c | |
| SWUE, kg m−3 | FI | 0.43 c | 0.61 b |
| 0.75 FI | 0.42 c | 0.70 a | |
| 0.5 FI | 0.29 d | 0.77 a | |
| DWUE, kg m−3 | FI | 1.04 c | 1.48 b |
| 0.75 FI | 1.08 c | 1.54 b | |
| 0.5 FI | 0.93 d | 1.80 a | |
| Parameters | Irrigation Treatment | Nitrogen Application Rate (kg N ha−1) | |||
|---|---|---|---|---|---|
| 0 | 125 | 250 | 375 | ||
| Seed yield, Mg ha−1 (2017) | FI | 0.77 cde * | 0.84 bc | 0.89 ab | 0.96 a |
| 0.75 FI | 0.55 gh | 0.68 ef | 0.85 bc | 0.8 bcd | |
| 0.5 FI | 0.47 h | 0.54 h | 0.73 def | 0.64 fg | |
| Seed yield, Mg ha−1 (2018) | FI | 2.96 gf | 3.91 bcd | 4.27 b | 4.71 a |
| 0.75 FI | 2.63 g | 3.41 def | 4.12 bc | 3.76 cd | |
| 0.5 FI | 1.39 h | 2.63 g | 3.58 de | 3.17 ef | |
| Total dry matter, Mg ha−1 | FI | 6.37 bc | 7.43 abc | 8.86 a | 9.03 a |
| 0.75 FI | 5.79 c | 6.81 bc | 7.87 ab | 7.40 abc | |
| 0.5 FI | 4.23 d | 6.31 bc | 7.19 bc | 6.91 bc | |
| Harvest index | FI | 0.40 bc | 0.45 a | 0.42 ab | 0.45 a |
| 0.75 FI | 0.40 bc | 0.44 ab | 0.45 a | 0.44 ab | |
| 0.5 FI | 0.31 d | 0.37 c | 0.43 ab | 0.40 bc | |
| Estimated seed yield in the first year (2017), Mg ha−1 | FI | 2.10 gh | 2.83 cd | 3.13 b | 3.44 a |
| 0.75 FI | 1.98 h | 2.51 ef | 3.08 bc | 2.68 de | |
| 0.5 FI | 1.22 i | 2.01 h | 2.59 def | 2.35 fg | |
| Total N uptake, kg N ha−1 | FI | 96.56 de | 129.61 c | 159.15 b | 186.49 a |
| 0.75 FI | 83.53 e | 117.85 c | 147.68 b | 148.57 b | |
| 0.5 FI | 50.49 f | 98.90 d | 130.82 c | 129.71 c | |
| Residual soil NO3-N, kg N ha−1 | FI | 49.98 h | 92.59 f | 135.61 d | 155.59 c |
| 0.75 FI | 81.01 g | 96.81 f | 127.05 d | 150.56 c | |
| 0.5 FI | 111.94 e | 117.22 e | 202.96 b | 216.26 a | |
| NUE, kg m−3 | NYE, kg kg−1 | NPE, kg kg−1 | |
|---|---|---|---|
| Irrigation treatment | |||
| FI | 0.26 b * | 5.94 b | 26.98 b |
| 0.75 FI | 0.24 b | 5.12 b | 34.19 a |
| 0.5 FI | 0.31 a | 7.87 a | 31.55 ab |
| Nitrogen rate (kg N ha−1) | |||
| 125 | 0.31 a | 7.90 a | 29.77 a |
| 250 | 0.28 a | 6.64 a | 34.08 a |
| 375 | o.22 b | 4.40 b | 28.87 a |
| Physical and Chemical Properties | Soil Depth (cm) | Irrigation Water | ||
|---|---|---|---|---|
| 0–30 | 30–60 | 60–90 | ||
| Field capacity (cm cm−3) | 0.32 | 0.32 | 0.32 | |
| Permanent wilting point (cm cm−3) | 0.17 | 0.19 | 0.19 | |
| Bulk density (g cm−3) | 1.4 | 1.47 | 1.51 | |
| Sand% | 11 | 10 | 16 | |
| Silt% | 56 | 51 | 50 | |
| Clay% | 33 | 39 | 34 | |
| Texture | SCL * | SCL | SCL | |
| EC (dS m−1) | 0.74 | 0.51 | 0.49 | 0.58 |
| Cl− (meq L−1) | 5.31 | 3.05 | 2.90 | 0.50 |
| Na+ (meq L−1) | 3.29 | 1.97 | 1.91 | 0.48 |
| Ca2+ (meq L−1) | 5.43 | 4.16 | 4.07 | 1.80 |
| Mg2+ (meq L−1) | 3.50 | 2.88 | 2.84 | 2.0 |
Publisher’s Note: MDPI stays neutral with regard to jurisdictional claims in published maps and institutional affiliations. |
© 2022 by the authors. Licensee MDPI, Basel, Switzerland. This article is an open access article distributed under the terms and conditions of the Creative Commons Attribution (CC BY) license (https://creativecommons.org/licenses/by/4.0/).
Share and Cite
Bahrami, M.; Talebnejad, R.; Sepaskhah, A.R.; Bazile, D. Irrigation Regimes and Nitrogen Rates as the Contributing Factors in Quinoa Yield to Increase Water and Nitrogen Efficiencies. Plants 2022, 11, 2048. https://doi.org/10.3390/plants11152048
Bahrami M, Talebnejad R, Sepaskhah AR, Bazile D. Irrigation Regimes and Nitrogen Rates as the Contributing Factors in Quinoa Yield to Increase Water and Nitrogen Efficiencies. Plants. 2022; 11(15):2048. https://doi.org/10.3390/plants11152048
Chicago/Turabian StyleBahrami, Maryam, Rezvan Talebnejad, Ali Reza Sepaskhah, and Didier Bazile. 2022. "Irrigation Regimes and Nitrogen Rates as the Contributing Factors in Quinoa Yield to Increase Water and Nitrogen Efficiencies" Plants 11, no. 15: 2048. https://doi.org/10.3390/plants11152048
APA StyleBahrami, M., Talebnejad, R., Sepaskhah, A. R., & Bazile, D. (2022). Irrigation Regimes and Nitrogen Rates as the Contributing Factors in Quinoa Yield to Increase Water and Nitrogen Efficiencies. Plants, 11(15), 2048. https://doi.org/10.3390/plants11152048