
Genome-Wide Transcriptomic Analysis of the Effects of Infection with the Hemibiotrophic Fungus Colletotrichum lindemuthianum on Common Bean

 , ,
, , 
Abstract
1. Introduction
2. Results
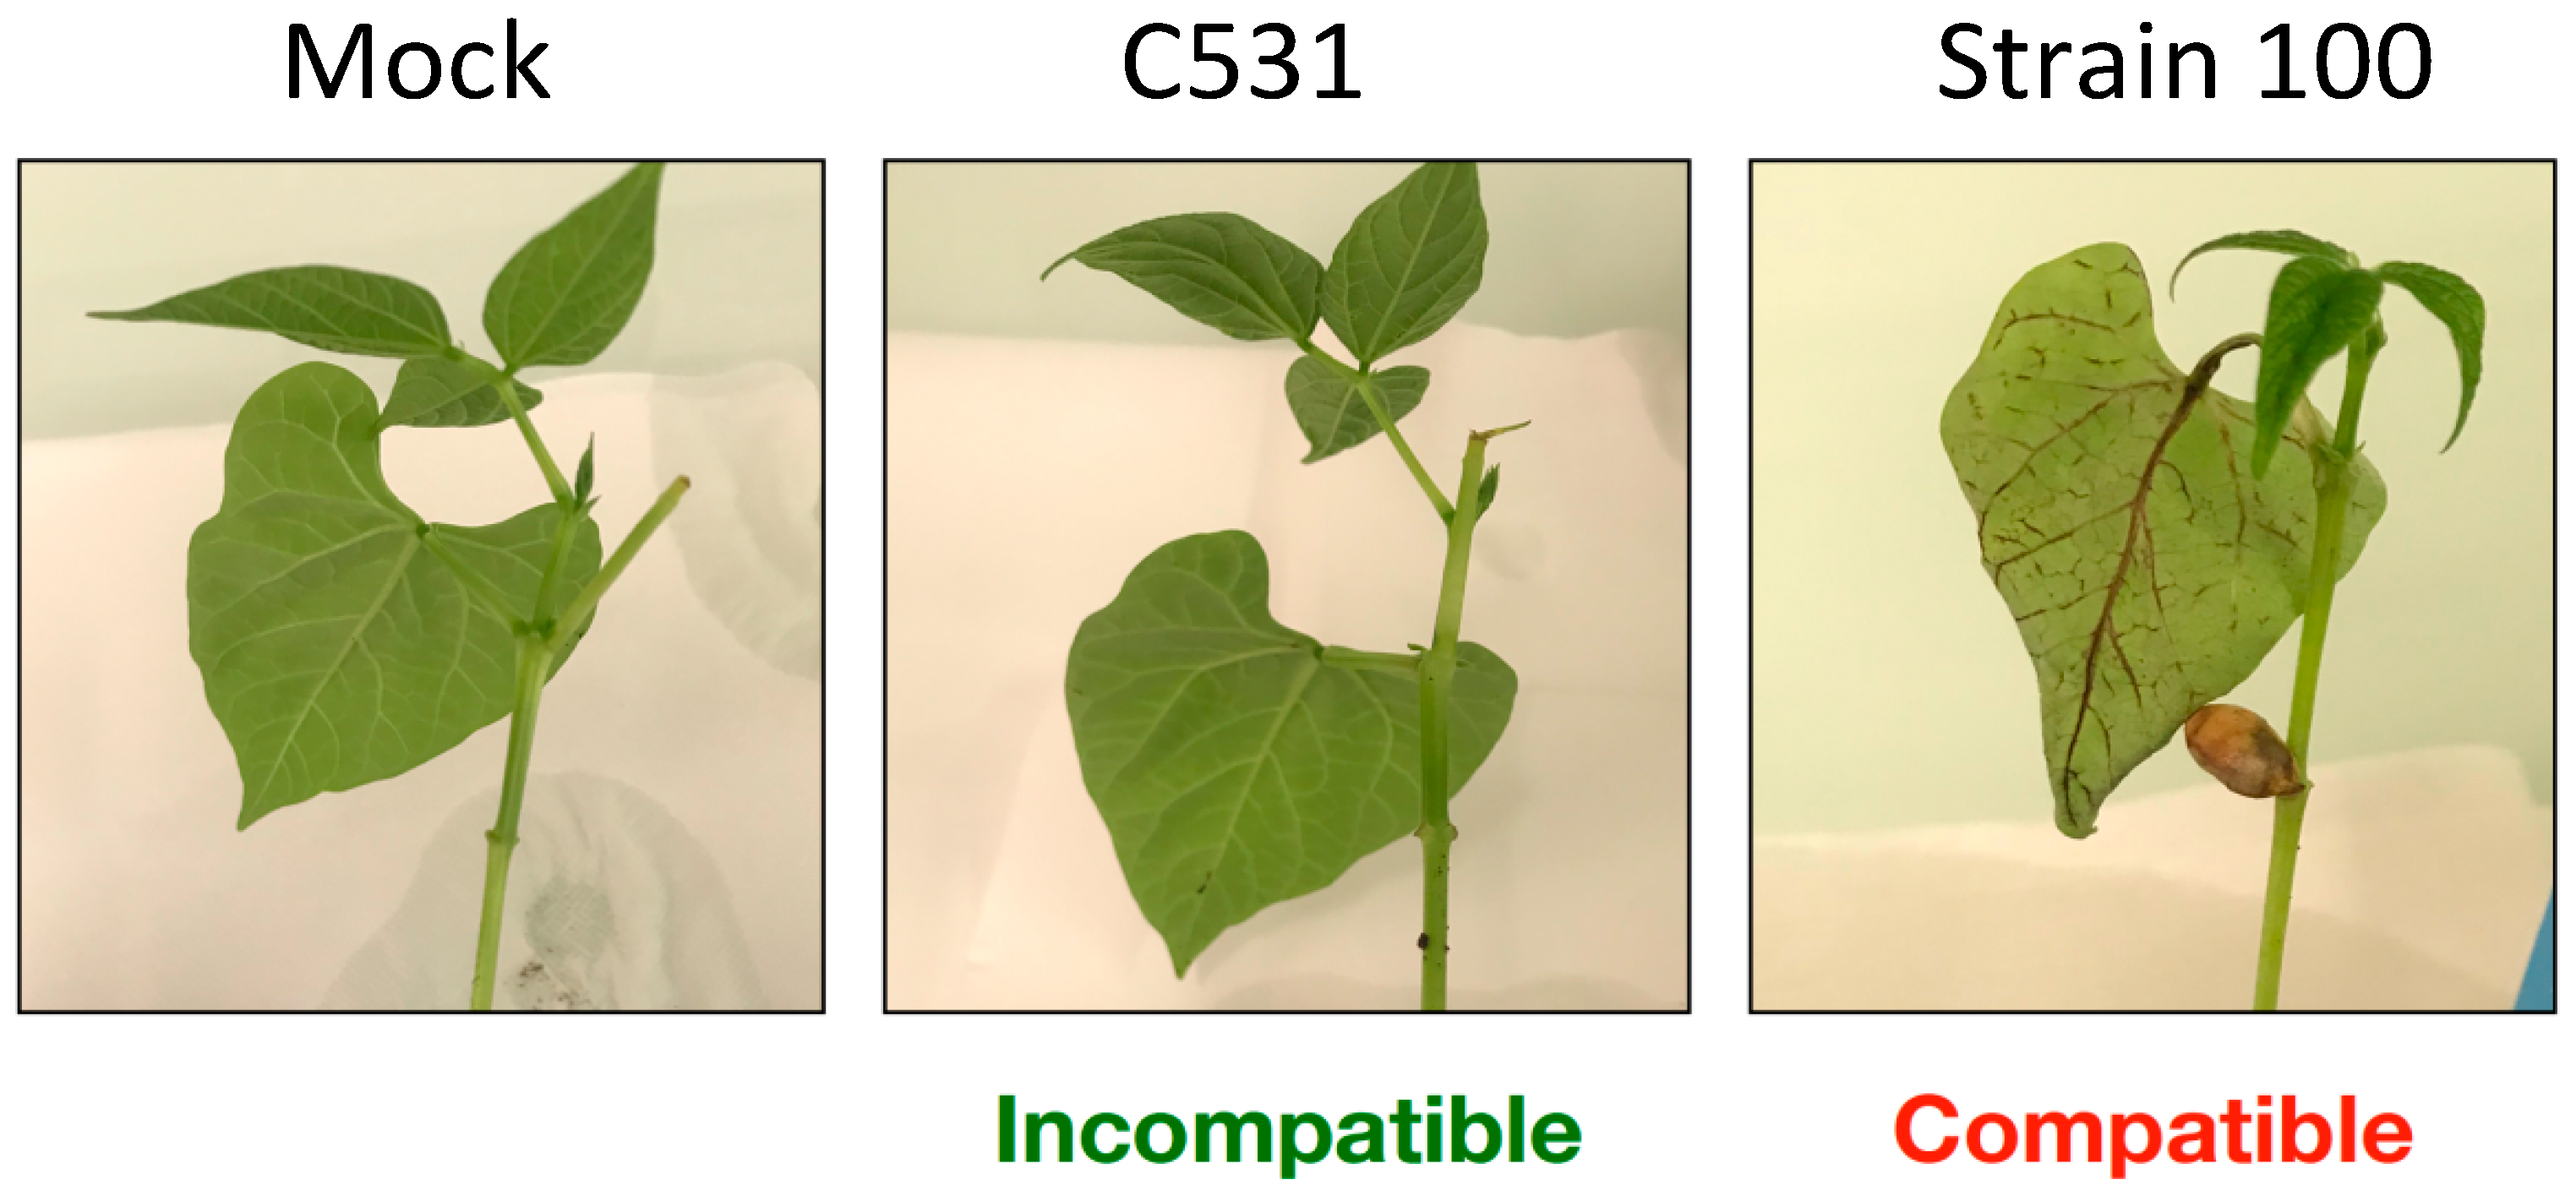
2.1. Disease Development
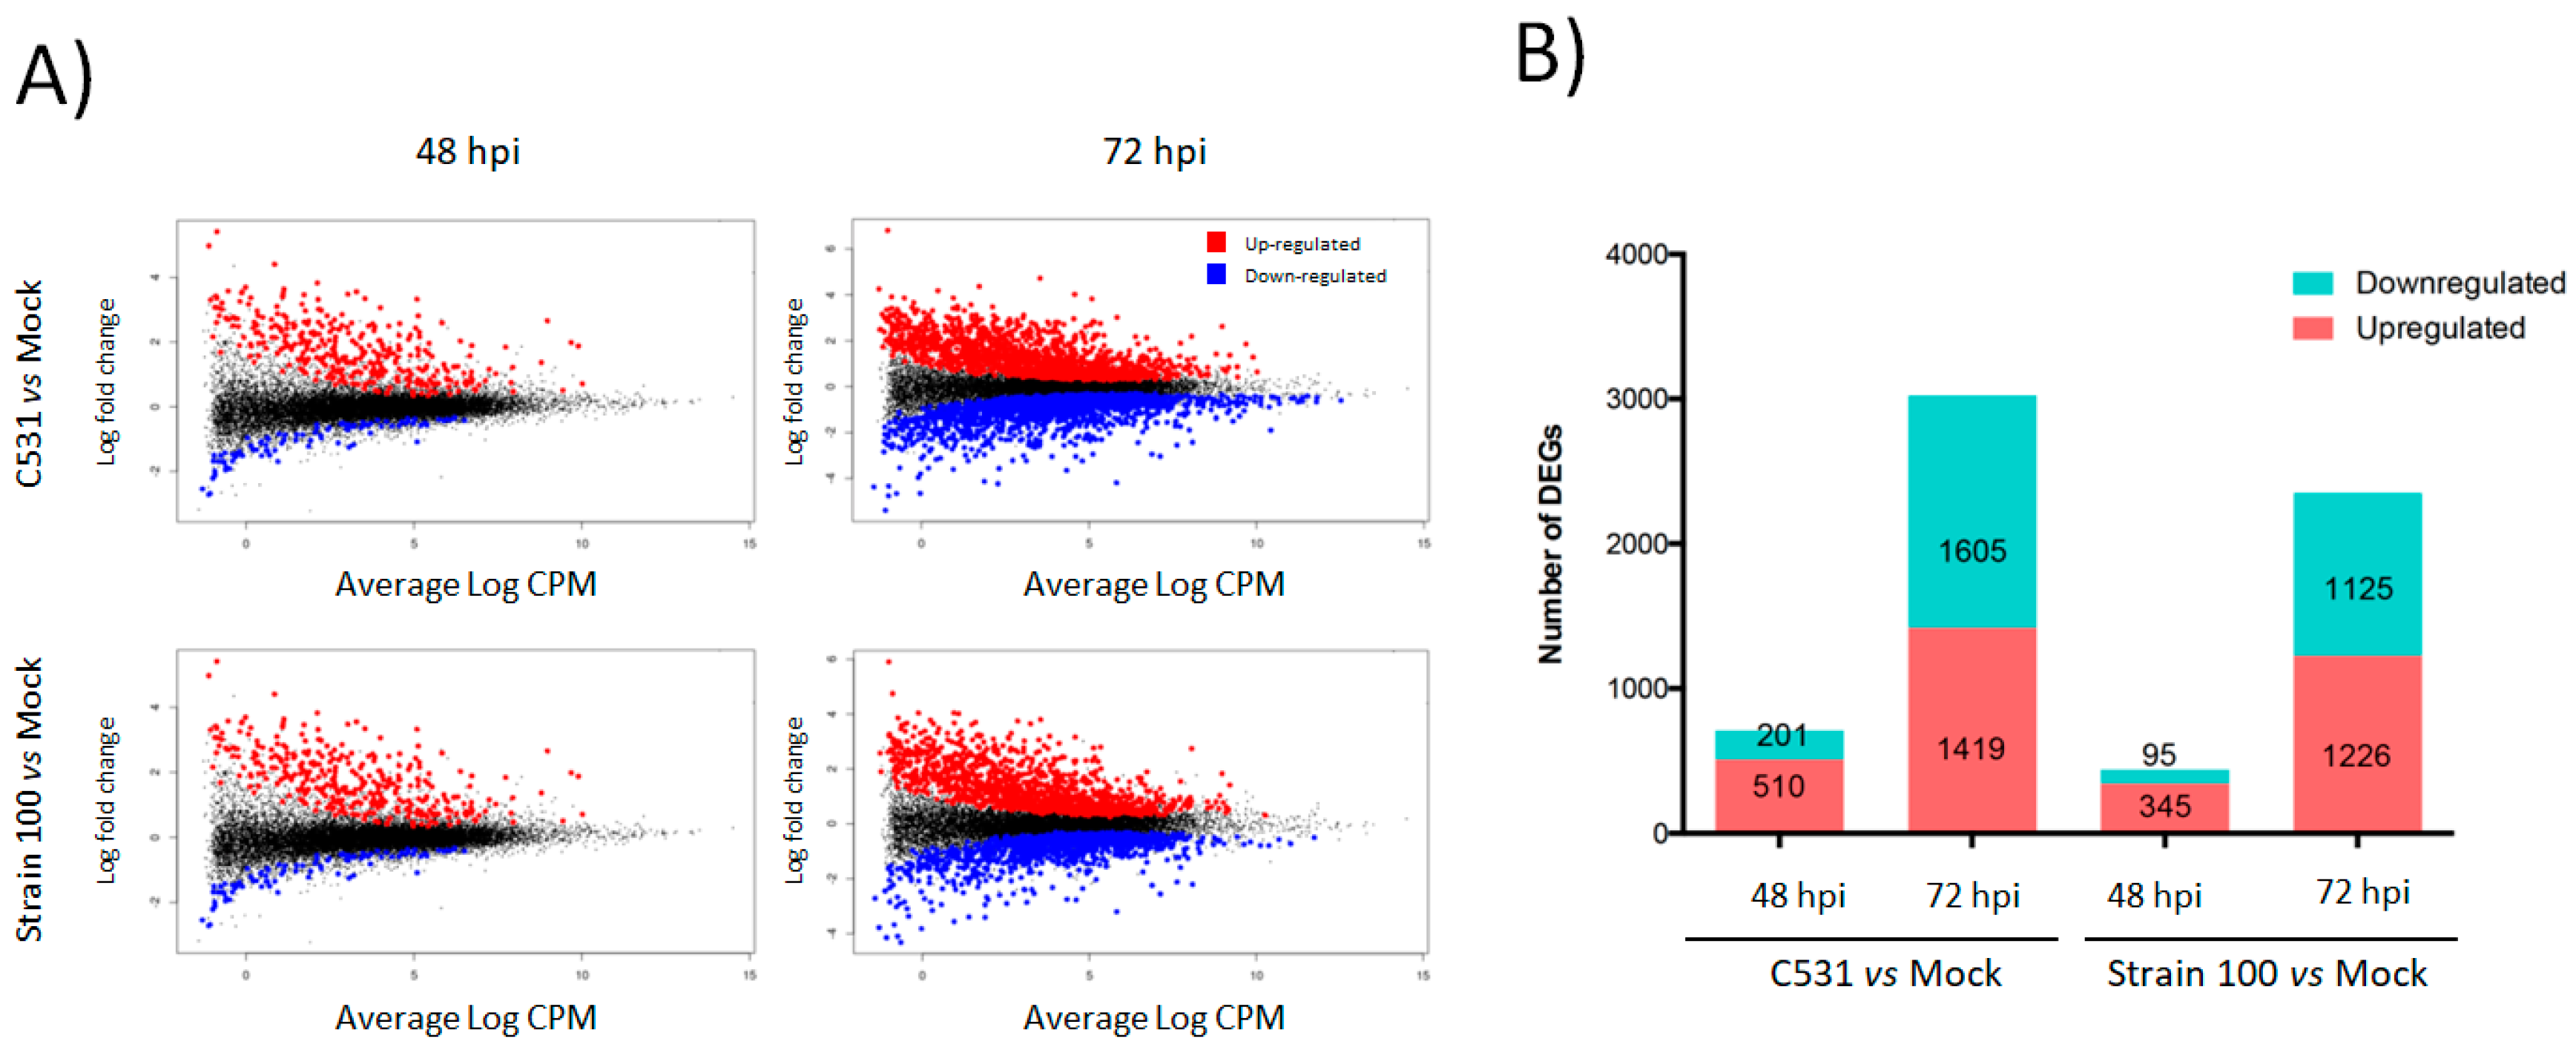
2.2. Quality Control of Transcriptome Analysis
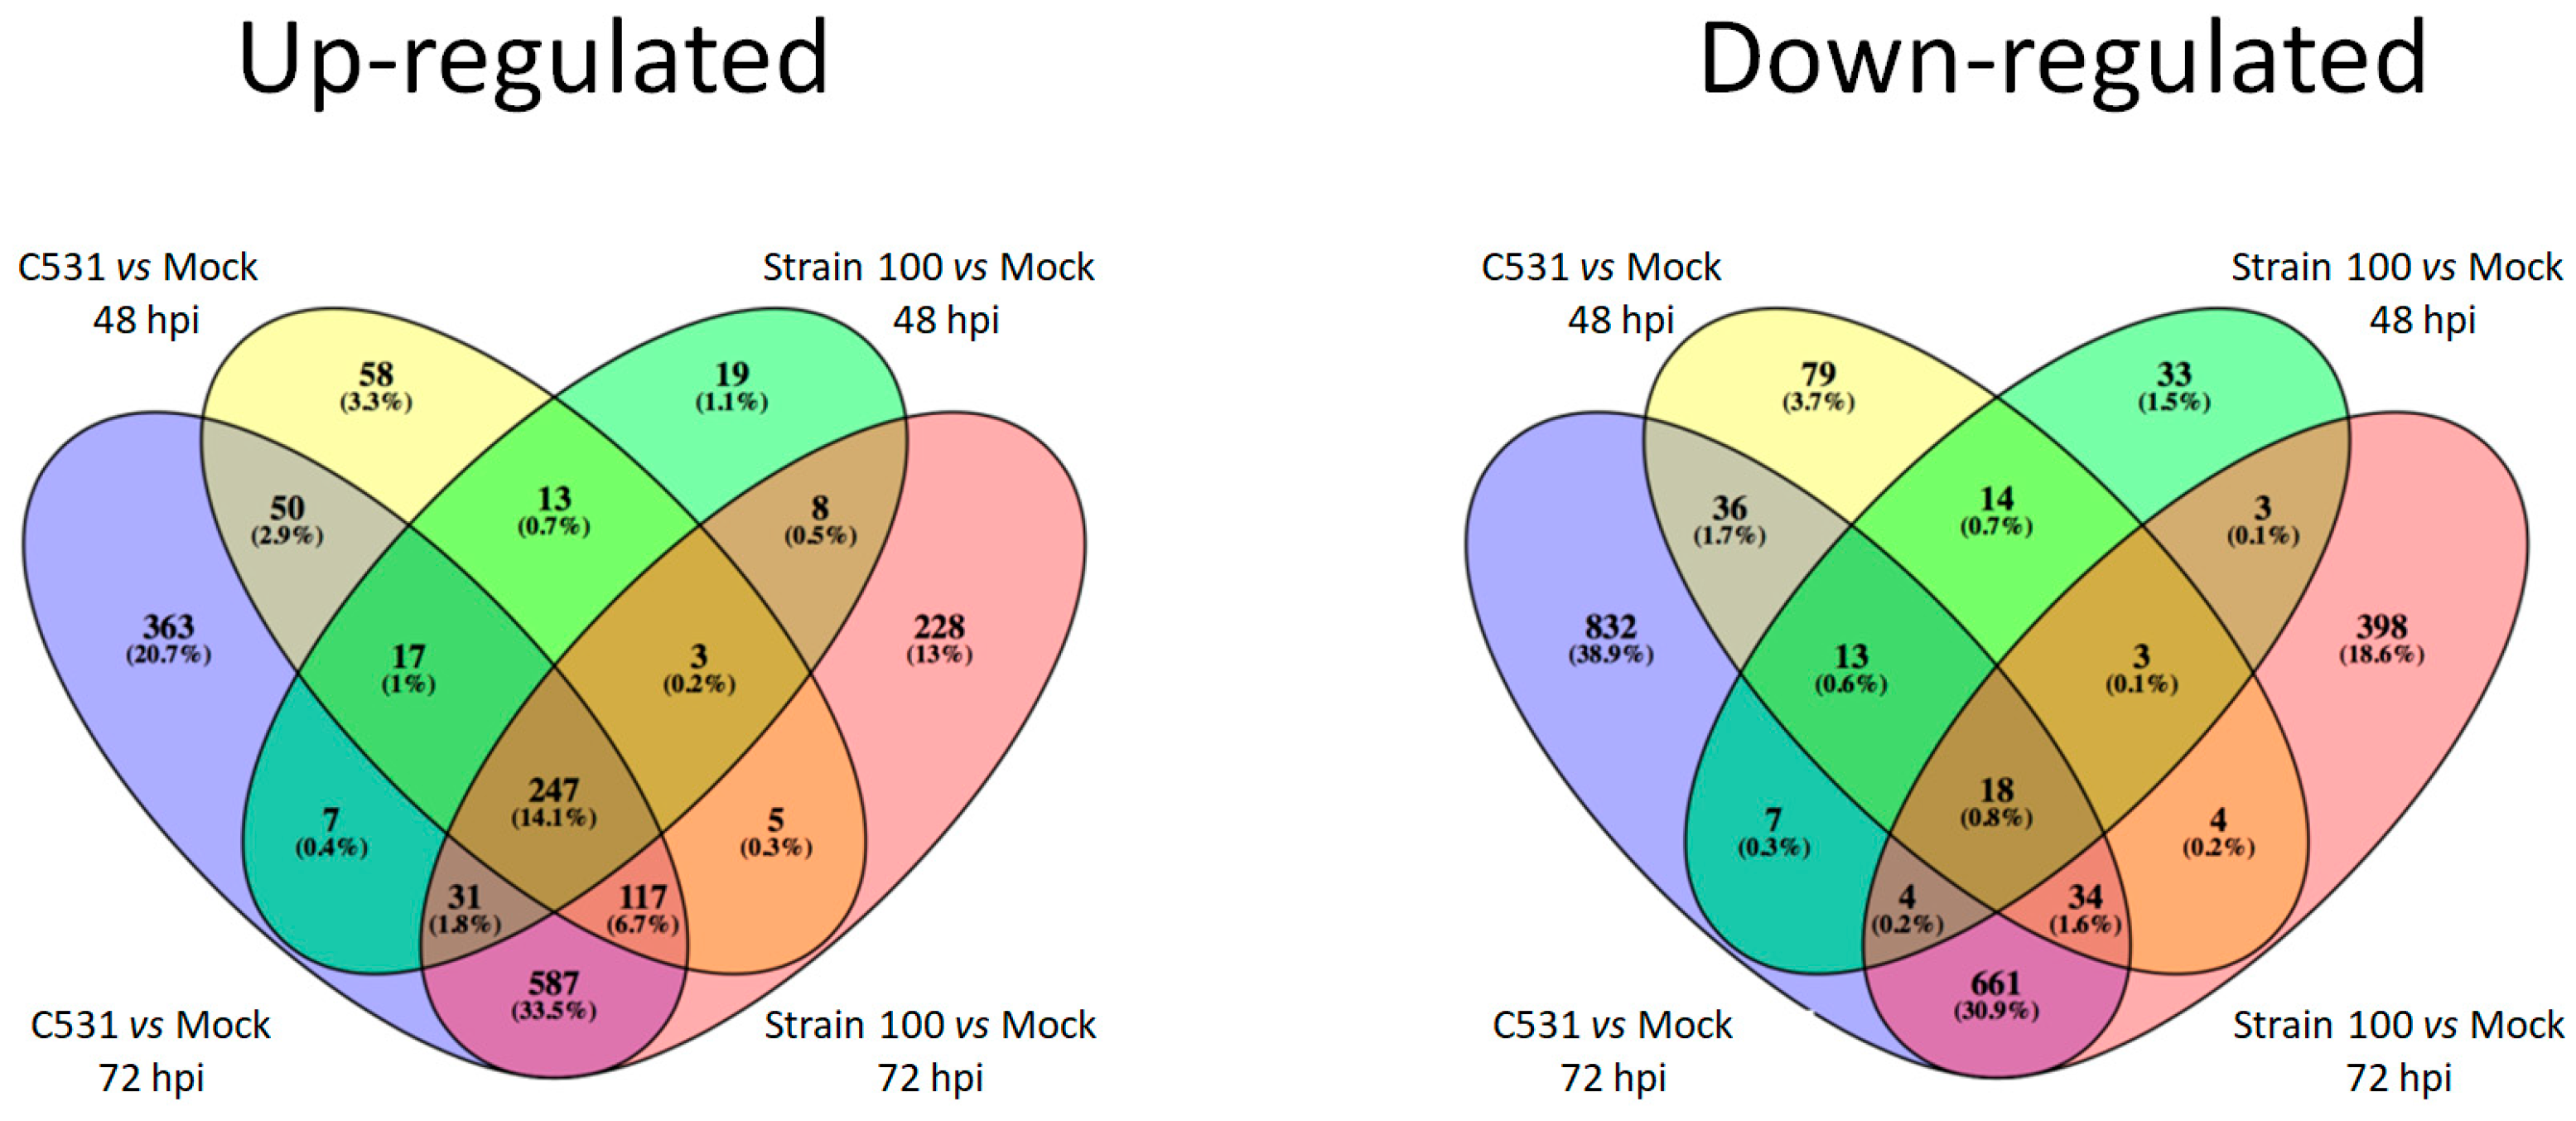
2.3. Differentially Expressed Genes in Response to C. lindemuthianum in Common Bean
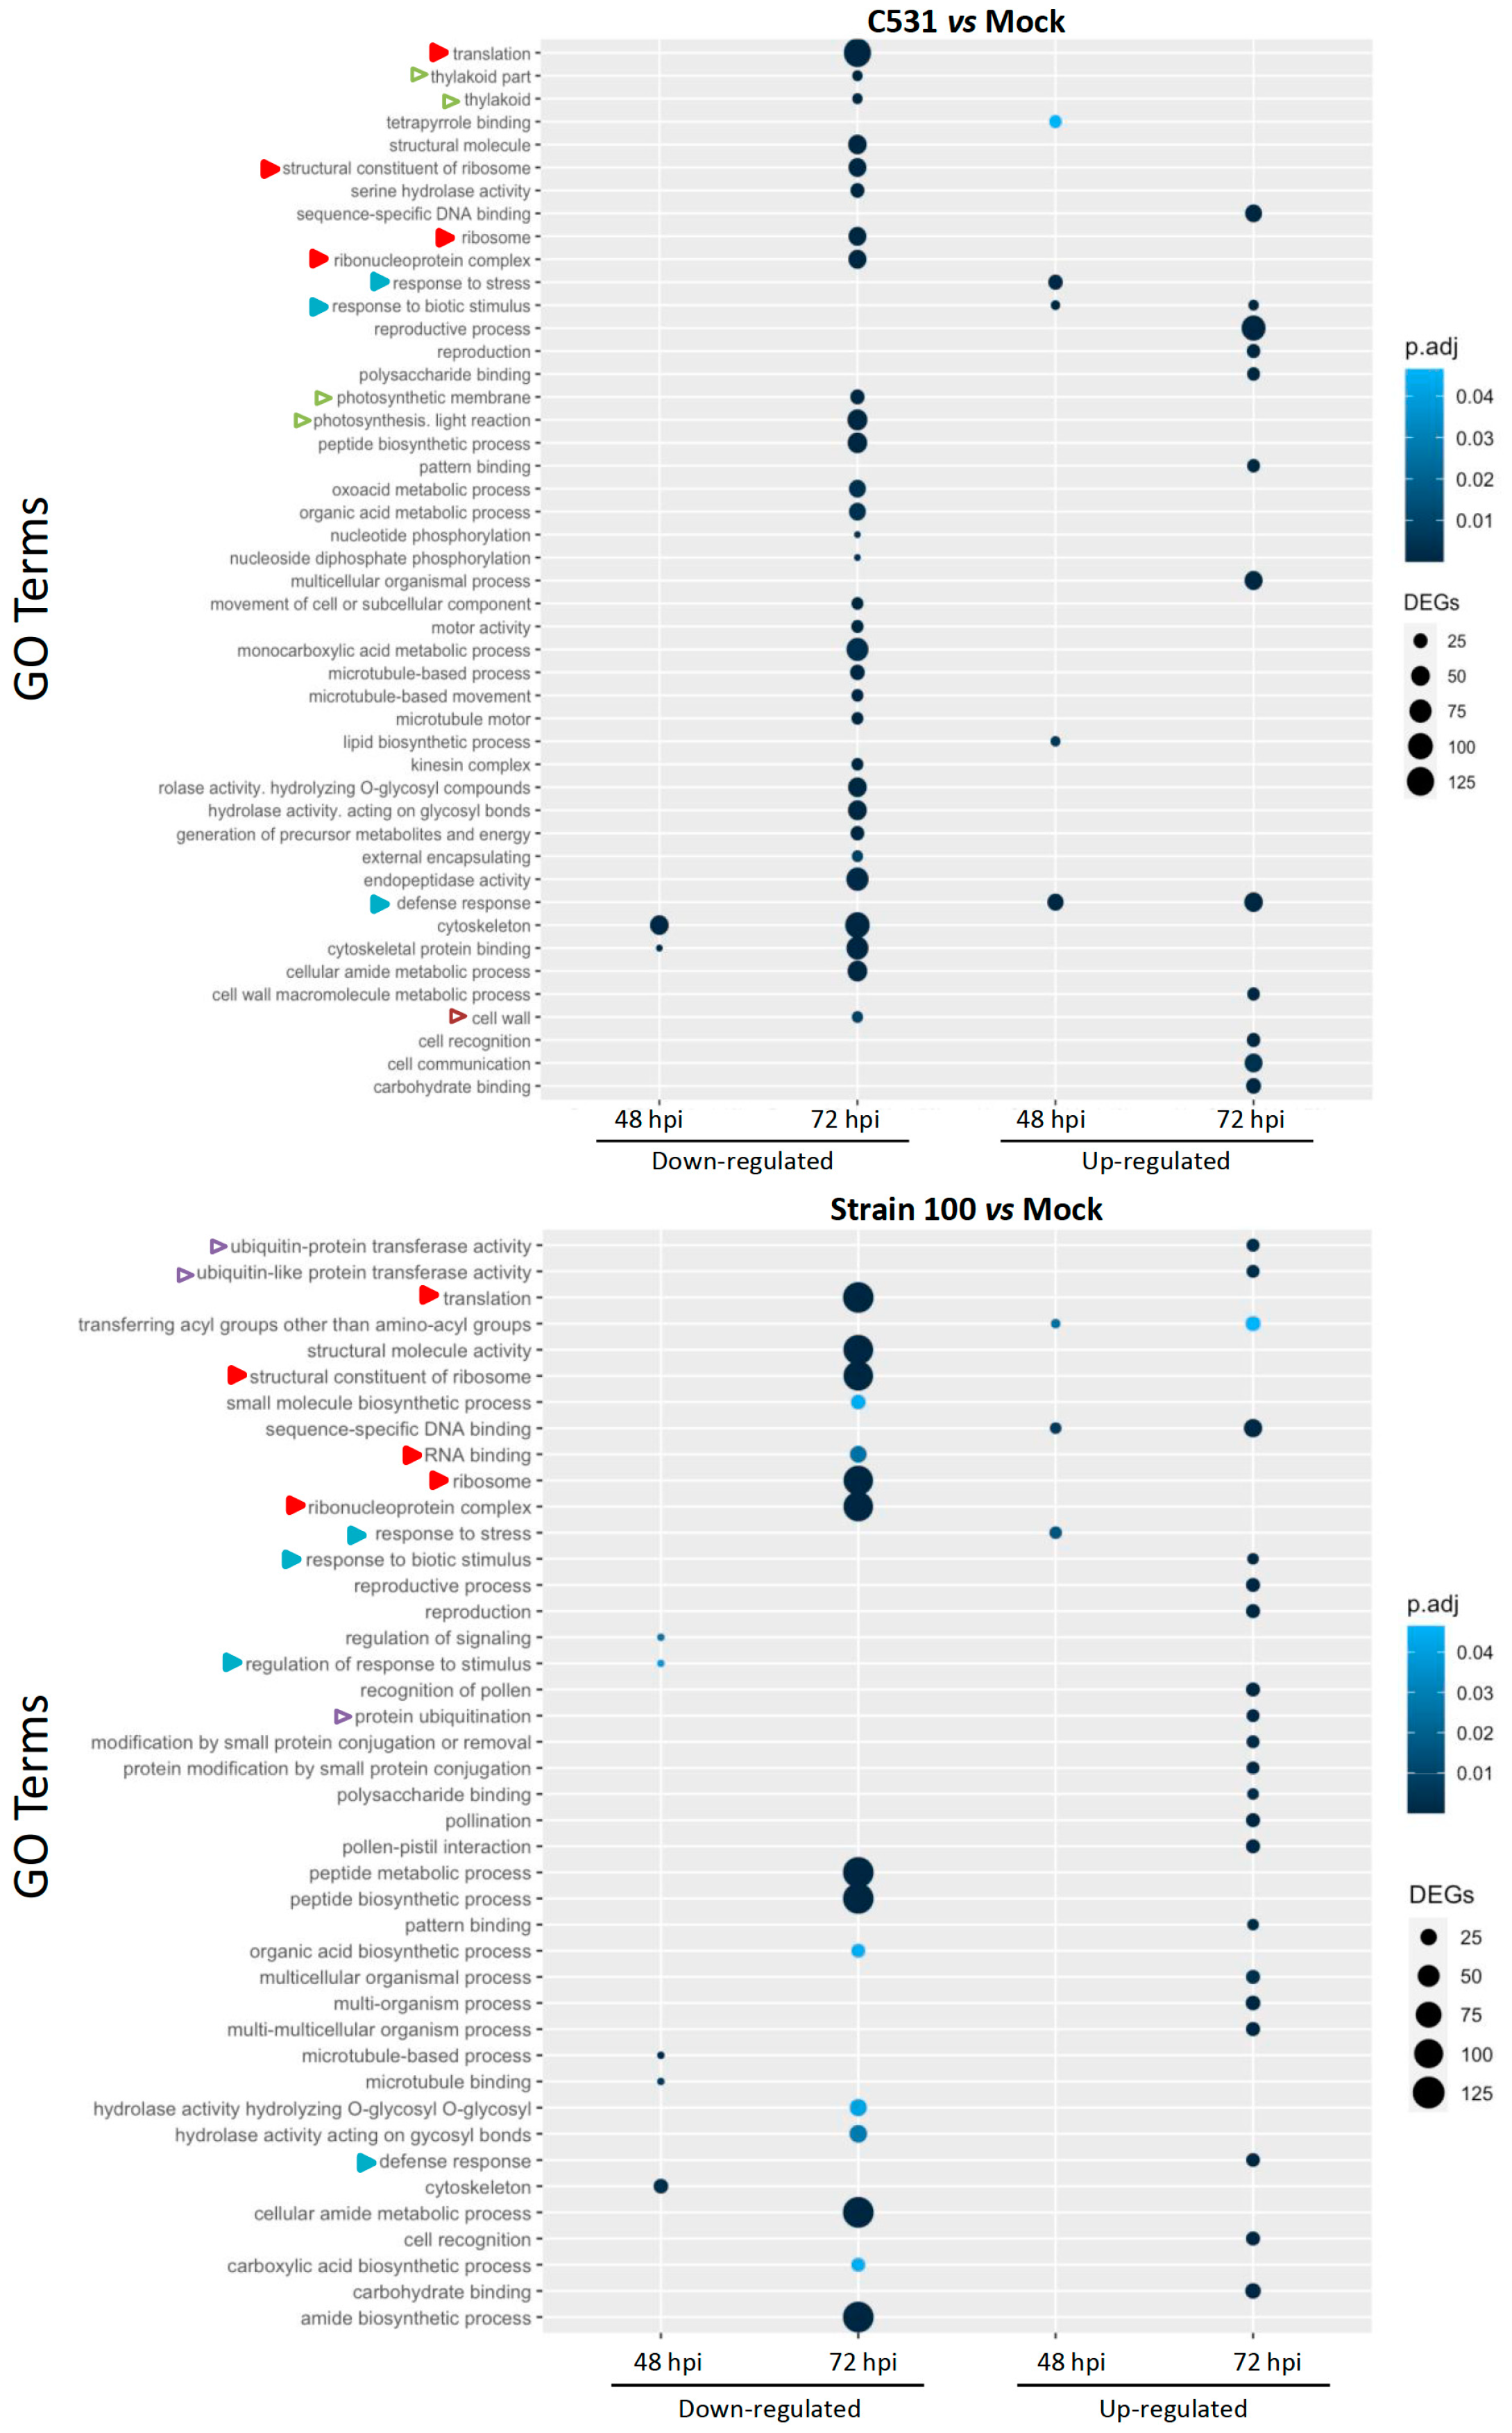
2.4. Gene Ontology (GO) Enrichment in Down-Regulated and Up-Regulated DEGs
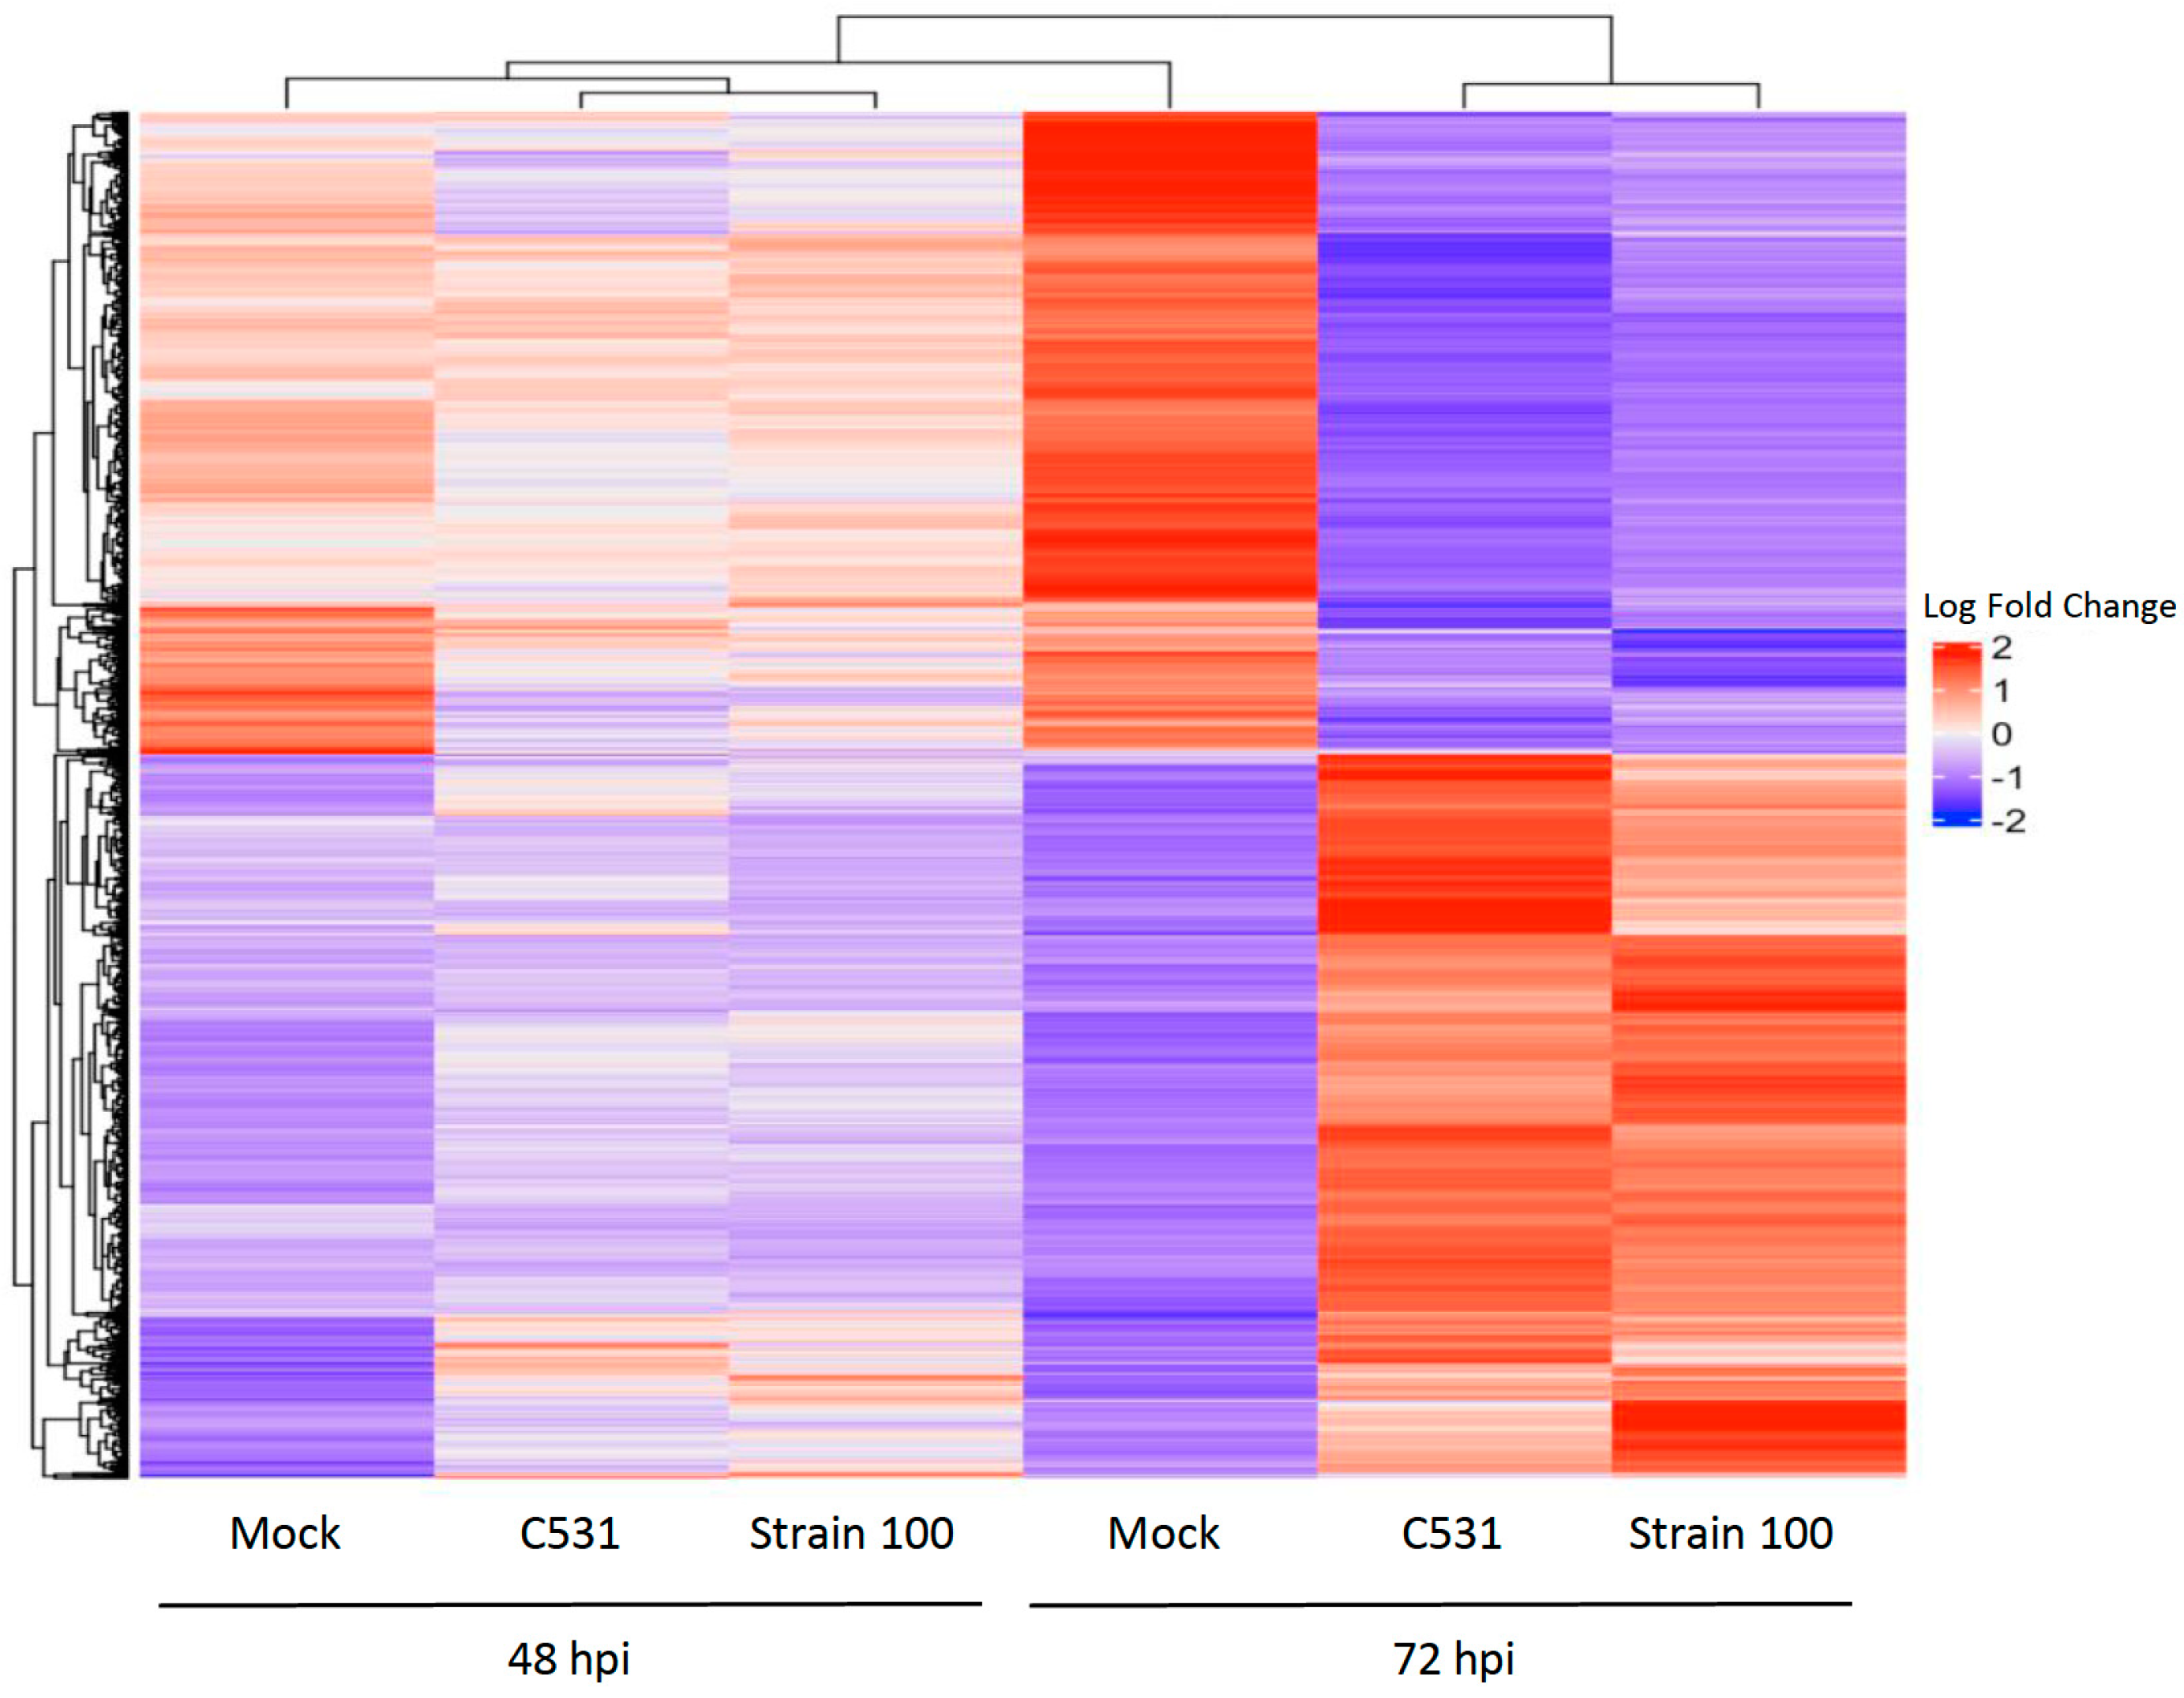
2.5. Clustering Analysis and Gene Expression Profiles
2.6. Detailed Differences between Incompatible and Compatible Interaction in Response to C. lindemuthianum in Common Bean
2.7. Expression of Pathogenesis-Related (PRs) Proteins and NLRs in Response to C. lindemuthianum
2.8. Defense-Related Plant Hormones
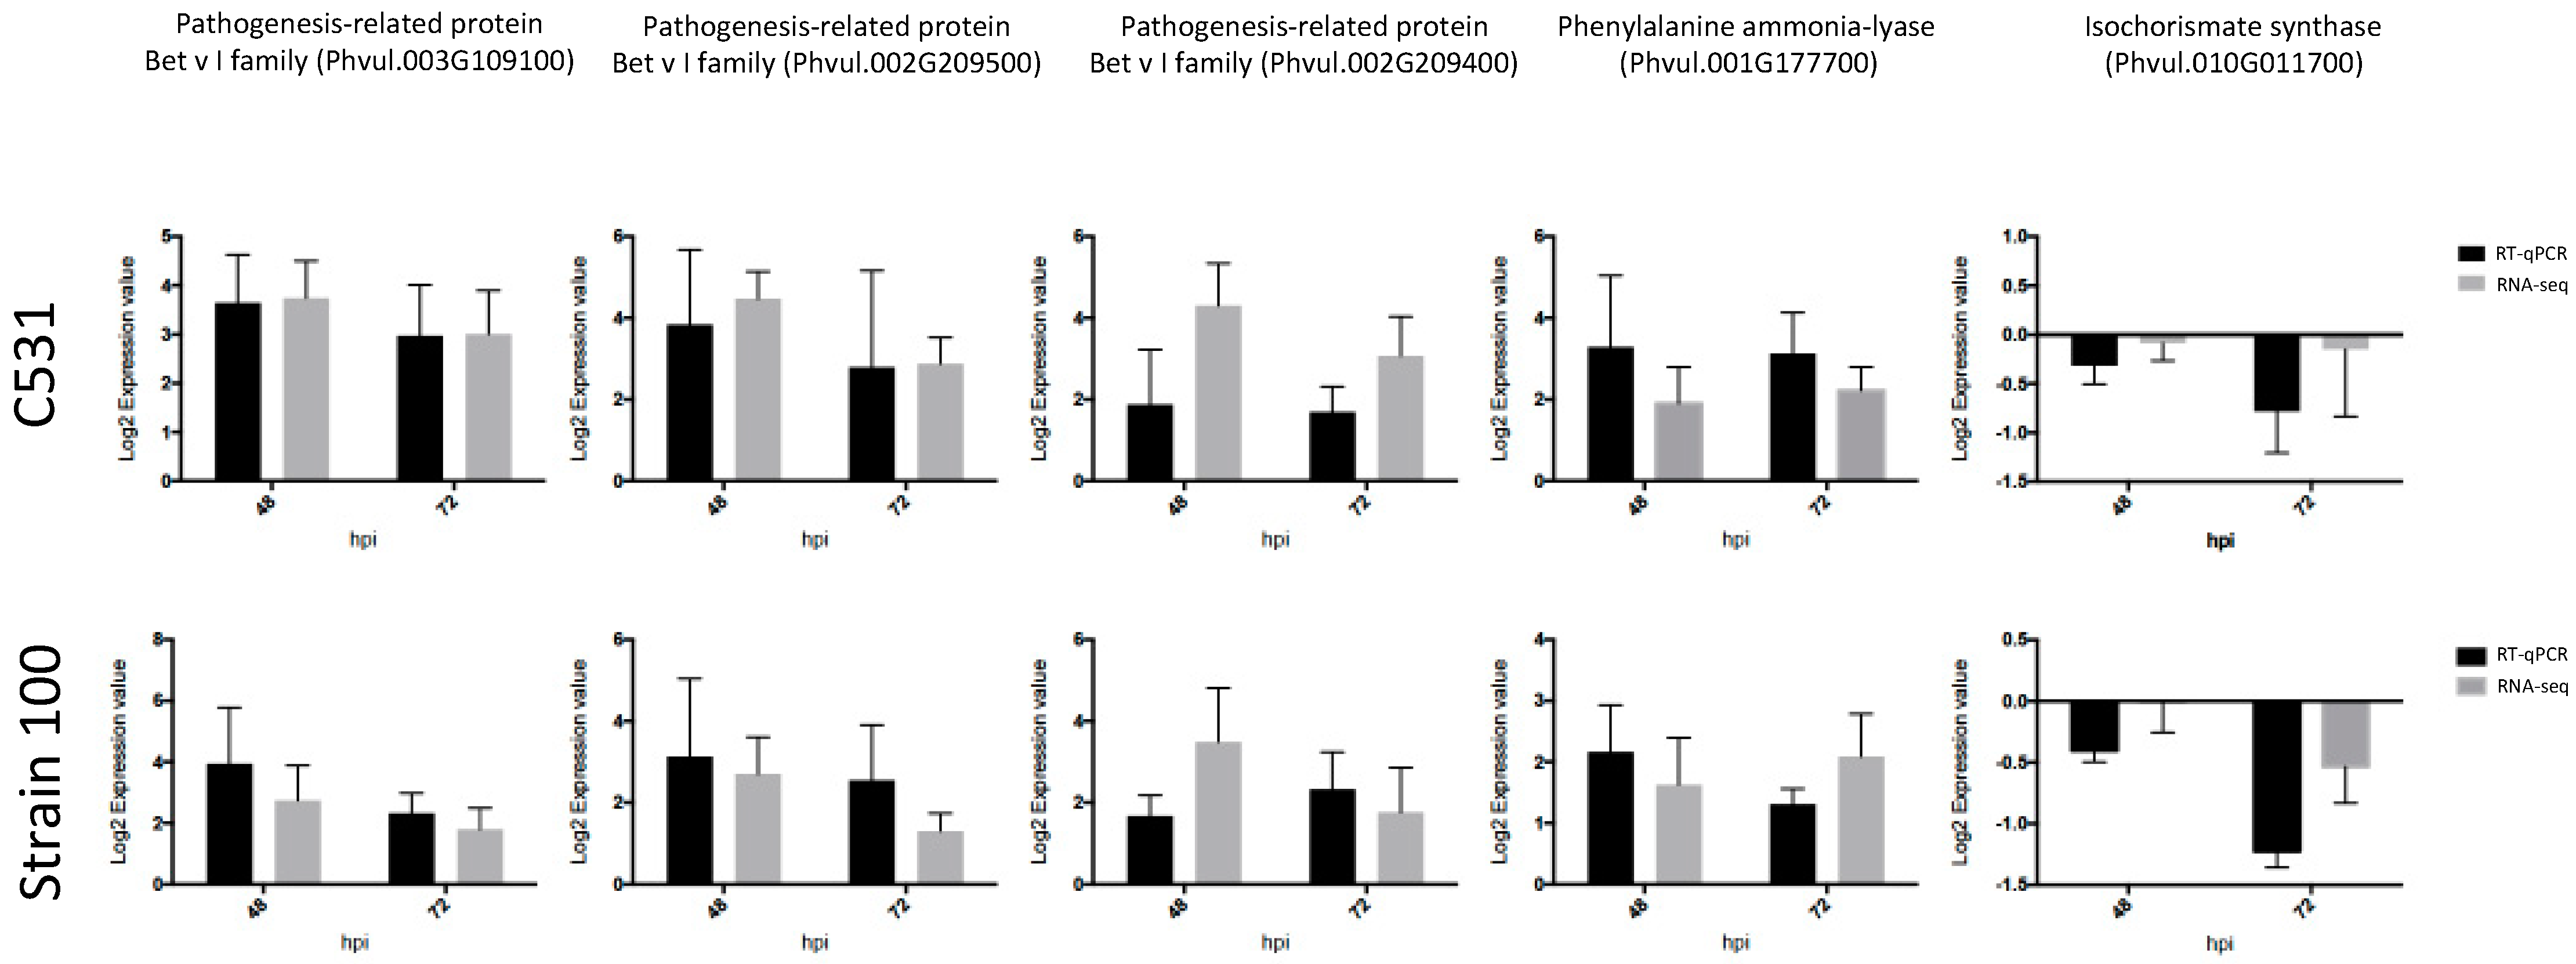
2.9. Validation of RNA-Seq Results with Quantitative Real-Time PCR (RT-qPCR)
3. Discussion
3.1. PR Proteins and Hemibiotrophic Pathogens
3.2. Importance of PR10/Bet vI in Common Bean Defense
3.3. In Infected Common Bean, SA Accumulation Is Based on the PAL Pathway
3.4. Up-Regulation of NLR after Pathogen Infection
3.5. C. lindemuthianum Resistance in Common Bean Involved Down-Regulation of Photosynthesis, Ubiquitination-Mediated Proteolysis and Cell Wall Modifications
4. Materials and Methods
4.1. Biological Material and Plant Inoculation
4.2. RNA Isolation, Library Preparation and Sequencing
4.3. Analysis of Differentially Expressed Genes
4.4. Gene Ontology Enrichment
4.5. Real-Time Quantitative PCR (RT-qPCR)
5. Conclusions
Supplementary Materials
Author Contributions
Funding
Data Availability Statement
Acknowledgments
Conflicts of Interest
References
- Arumuganathan, K.; Earle, E.D. Nuclear DNA content of some important plant species. Plant Mol. Biol. Rep. 1991, 9, 208–218. [Google Scholar] [CrossRef]
- Bennett, M.D.; Leitch, I.J. Nuclear DNA amounts in angiosperms. Ann. Bot. 1995, 76, 113–176. [Google Scholar] [CrossRef]
- Schmutz, J.; McClean, P.E.; Mamidi, S.; Wu, G.A.; Cannon, S.B.; Grimwood, J.; Jenkins, J.; Shu, S.; Song, Q.; Chavarro, C.; et al. A reference genome for common bean and genome-wide analysis of dual domestications. Nat. Genet. 2014, 46, 707–713. [Google Scholar] [CrossRef]
- Richard, M.M.S.; Gratias, A.; Thareau, V.; Kim, K.D.; Balzergue, S.; Joets, J.; Jackson, S.A.; Geffroy, V. Genomic and epigenomic immunity in common bean: The unusual features of NB-LRR gene family. DNA Res. 2018, 25, 161–172. [Google Scholar] [CrossRef] [PubMed]
- Barragan, A.C.; Weigel, D. Plant NLR diversity: The known unknowns of pan-NLRomes. Plant Cell 2021, 33, 814–831. [Google Scholar] [CrossRef] [PubMed]
- Richard, M.M.S.; Gratias, A.; Meyers, B.C.; Geffroy, V. Molecular mechanisms that limit the costs of NLR-mediated resistance in plants. Mol. Plant Pathol. 2018, 19, 2516–2523. [Google Scholar] [CrossRef] [PubMed]
- Pastor-Corrales, M.A.; Tu, J.C. Anthracnose. In Bean Production Problems in the Tropics; Centro Internacional de Agricultura Tropical (CIAT): Cali, Colombia, 1989; pp. 77–104. [Google Scholar]
- O’Connell, R.J.; Bailey, J.A.; Richmond, D.V. Cytology and physiology of infection of Phaseolus vulgaris by Colletotrichum lindemuthianum. Physiol. Plant Pathol. 1985, 27, 75–98. [Google Scholar] [CrossRef]
- Pain, N.A.; Green, J.R.; Gammie, F.; O’Connell, R.J. Immunomagnetic isolation of viable intracellular hyphae of Colletotrichum lindemuthianum (Sacc. & Magn.) Briosi & Cav. from infected bean leaves using a monoclonal antibody. New Phytol. 1994, 127, 223–332. [Google Scholar] [CrossRef]
- Dufresne, M.; Perfect, S.; Pellier, A.L.; Bailey, J.A.; Langin, T. A GAL4-like protein is involved in the switch between biotrophic and necrotrophic phases of the infection process of Colletotrichum lindemuthianum on common bean. Plant Cell 2000, 12, 1579–1589. [Google Scholar] [CrossRef]
- Bourguet, D.; Guillemaud, T. The Hidden and External Costs of Pesticide Use. In Sustainable Agriculture Reviews; Springer International Publishing: Cham, Switzerland, 2016; pp. 35–120. [Google Scholar]
- Barrus, M.F. Variation of varieties of beans in their susceptibility to anthracnose. Phytopathology 1911, 1, 190–195. [Google Scholar]
- Geffroy, V.; Sicard, D.; De Oliveira, J.C.F.; Sévignac, M.; Cohen, S.; Gepts, P.; Neema, C.; Langin, T.; Dron, M. Identification of an ancestral resistance gene cluster involved in the coevolution process between Phaseolus vulgaris and its fungal pathogen Colletotrichum lindemuthianum. Mol. Plant-Microbe Interact. 1999, 12, 774–784. [Google Scholar] [CrossRef] [PubMed]
- Nabi, A.; Lateef, I.; Nisa, Q.; Banoo, A.; Rasool, R.S.; Shah, M.D.; Ahmad, M.; Padder, B.A. Phaseolus vulgaris-Colletotrichum lindemuthianum Pathosystem in the Post-Genomic Era: An Update. Curr. Microbiol. 2022, 79, 36. [Google Scholar] [CrossRef] [PubMed]
- Costa, L.C.; Nalin, R.S.; Dias, M.A.; Ferreira, M.E.; Song, Q.; Pastor-Corrales, M.A.; Hurtado-Gonzales, O.P.; de Souza, E.A. Different loci control resistance to different isolates of the same race of Colletotrichum lindemuthianum in common bean. Theor. Appl. Genet. 2021, 134, 543–556. [Google Scholar] [CrossRef] [PubMed]
- Meziadi, C.; Richard, M.M.S.; Derquennes, A.; Thareau, V.; Blanchet, S.; Gratias, A.; Pflieger, S.; Geffroy, V. Development of molecular markers linked to disease resistance genes in common bean based on whole genome sequence. Plant Sci. 2016, 242, 351–357. [Google Scholar] [CrossRef] [PubMed]
- Flor, H. Host-parasite interactions in flax rust-its genetics and other implications. Phytopathology 1955, 45, 680–685. [Google Scholar]
- David, P.; Chen, N.W.G.; Pedrosa-Harand, A.; Thareau, V.; Sevignac, M.; Cannon, S.B.; Debouck, D.; Langin, T.; Geffroy, V. A Nomadic subtelomeric disease resistance gene cluster in common bean. Plant Physiol. 2009, 151, 1048–1065. [Google Scholar] [CrossRef]
- Richard, M.M.S.; Gratias, A.; Alvarez Diaz, J.C.; Thareau, V.; Pflieger, S.; Meziadi, C.; Blanchet, S.; William, M.; Bitocchi, E.; Papa, R.; et al. A common bean truncated CRINKLY4 kinase controls gene-for-gene resistance to the fungus Colletotrichum lindemuthianum. J. Exp. Bot. 2021, 72, 3569–3581. [Google Scholar] [CrossRef]
- Goncalves-Vidigal, M.C.; Gilio, T.A.S.; Valentini, G.; Vaz-Bisneta, M.; Vidigal Filho, P.S.; Song, Q.; Oblessuc, P.R.; Melotto, M. New Andean source of resistance to anthracnose and angular leaf spot: Finemapping of disease-resistance genes in California Dark Red Kidney common bean cultivar. PLoS ONE 2020, 15, e0235215. [Google Scholar] [CrossRef]
- Foucher, J.; Ruh, M.; Préveaux, A.; Carrère, S.; Pelletier, S.; Briand, M.; Serre, R.F.; Jacques, M.A.; Chen, N.W.G. Common bean resistance to Xanthomonas is associated with upregulation of the salicylic acid pathway and downregulation of photosynthesis. BMC Genom. 2020, 21, 566. [Google Scholar] [CrossRef]
- Martin, K.; Singh, J.; Hill, J.H.; Whitham, S.A.; Cannon, S.B. Dynamic transcriptome profiling of Bean Common Mosaic Virus (BCMV) infection in Common Bean (Phaseolus vulgaris L.). BMC Genom. 2016, 17, 613. [Google Scholar] [CrossRef]
- Chen, L.; Wu, Q.; He, W.; He, T.; Wu, Q.; Miao, Y. Combined de novo transcriptome and metabolome analysis of common bean response to Fusarium oxysporum f. Sp. phaseoli infection. Int. J. Mol. Sci. 2019, 20, 6278. [Google Scholar] [CrossRef]
- Padder, B.A.; Kamfwa, K.; Awale, H.E.; Kelly, J.D. Transcriptome profiling of the Phaseolus vulgaris—Colletotrichum lindemuthianum pathosystem. PLoS ONE 2016, 11, e0165823. [Google Scholar] [CrossRef] [PubMed]
- Niño-Sánchez, J.; Tello, V.; del Castillo, V.C.; Thon, M.R.; Benito, E.P.; Díaz-Mínguez, J.M. Gene expression patterns and dynamics of the colonization of common bean (Phaseolus vulgaris L.) by highly virulent and weakly virulent strains of Fusarium oxysporum. Front. Microbiol. 2015, 6, 234. [Google Scholar] [CrossRef] [PubMed]
- Gamero Delgado, M.C.; García-Mayorgas, A.D.; Rodríguez, F.; Ibarra, A.; Casal, M. Susceptibility and resistence of Pseudomonas aeruginosa to antimicrobial agents. Rev. Esp. Quimioter. 2007, 20, 230–233. [Google Scholar]
- Lefevere, H.; Bauters, L.; Gheysen, G. Salicylic Acid Biosynthesis in Plants. Front. Plant Sci. 2020, 11, 493–496. [Google Scholar] [CrossRef]
- Breen, S.; Williams, S.J.; Outram, M.; Kobe, B.; Solomon, P.S. Emerging Insights into the Functions of Pathogenesis-Related Protein 1. Trends Plant Sci. 2017, 22, 871–879. [Google Scholar] [CrossRef] [PubMed]
- van Loon, L.C. Pathogenesis-related proteins. Plant Mol. Biol. 1985, 4, 111–116. [Google Scholar] [CrossRef] [PubMed]
- Rigden, J.; Coutts, R. Pathogenesis-related proteins in plants. Trends Genet. 1988, 4, 87–89. [Google Scholar] [CrossRef]
- Li, N.; Han, X.; Feng, D.; Yuan, D.; Huang, L.J. Signaling crosstalk between salicylic acid and ethylene/Jasmonate in plant defense: Do we understand what they are whispering? Int. J. Mol. Sci. 2019, 20, 671. [Google Scholar] [CrossRef]
- Aerts, N.; Pereira Mendes, M.; Van Wees, S.C.M. Multiple levels of crosstalk in hormone networks regulating plant defense. Plant J. 2021, 105, 489–504. [Google Scholar] [CrossRef]
- Narusaka, Y.; Narusaka, M.; Park, P.; Kubo, Y.; Hirayama, T.; Seki, M.; Shiraishi, T.; Ishida, J.; Nakashima, M.; Enju, A.; et al. RCH1, a locus in Arabidopsis that confers resistance to the hemibiotrophic fungal pathogen Colletotrichum higginsianum. Mol. Plant-Microbe Interact. 2004, 17, 749–762. [Google Scholar] [CrossRef] [PubMed]
- De Jesus Miranda, V.; Porto, W.F.; Da Rocha Fernandes, G.; Pogue, R.; Nolasco, D.O.; Guerra Araujo, A.C.; Cota, L.V.; De Freitas, C.G.; Dias, S.C.; Franco, O.L. Comparative transcriptomic analysis indicates genes associated with local and systemic resistance to Colletotrichum graminicola in maize. Sci. Rep. 2017, 7, 2483. [Google Scholar] [CrossRef] [PubMed]
- Kawahara, Y.; Oono, Y.; Kanamori, H.; Matsumoto, T.; Itoh, T.; Minami, E. Simultaneous RNA-seq analysis of a mixed transcriptome of rice and blast fungus interaction. PLoS ONE 2012, 7, e49423. [Google Scholar] [CrossRef] [PubMed]
- Borges, A.; Melotto, M.; Tsai, S.M.; Caldas, D.G.G. Changes in spatial and temporal gene expression during incompatible interaction between common bean and anthracnose pathogen. J. Plant Physiol. 2012, 169, 1216–1220. [Google Scholar] [CrossRef]
- Mahé, A. Bean-Colletotrichum lindemuthianum Compatible Interactions: Time Course of Plant Defense Responses Depends on Race. Mol. Plant-Microbe Interact. 1992, 5, 472–478. [Google Scholar] [CrossRef]
- Mahé, A. Two Avirulent Races of Colletotrichum Iindemuthianum Trigger Different Time Courses of Plant Defense Reactions in Bean. Mol. Plant-Microbe Interact. 1993, 6, 423–428. [Google Scholar] [CrossRef]
- Joosten, M.H.A.J.; De Wit, P.J.G.M. Identification of Several Pathogenesis-Related Proteins in Tomato Leaves Inoculated with Cladosporium fulvum (syn. Fulvia fulva ) as 1,3-β-Glucanases and Chitinases. Plant Physiol. 1989, 89, 945–951. [Google Scholar] [CrossRef]
- van Kan, J.A.L.; Joosten, M.H.A.J.; Wagemakers, C.A.M.; van den Berg-Velthuis, G.C.M.; de Wit, P.J.G.M. Differential accumulation of mRNAs encoding extracellular and intracellular PR proteins in tomato induced by virulent and avirulent races of Cladosporium fulvum. Plant Mol. Biol. 1992, 20, 513–527. [Google Scholar] [CrossRef]
- Radauer, C.; Lackner, P.; Breiteneder, H. The Bet v 1 fold: An ancient, versatile scaffold for binding of large, hydrophobic ligands. BMC Evol. Biol. 2008, 8, 286. [Google Scholar] [CrossRef]
- Liu, J.J.; Ekramoddoullah, A.K.M. The family 10 of plant pathogenesis-related proteins: Their structure, regulation, and function in response to biotic and abiotic stresses. Physiol. Mol. Plant Pathol. 2006, 68, 3–13. [Google Scholar] [CrossRef]
- Pühringer, H.; Moll, D.; Hoffmann-Sommergruber, K.; Watillon, B.; Katinger, H.; Da Câmara Machado, M.L. The promoter of an apple Ypr10 gene, encoding the major allergen Mal d 1, is stress- and pathogen-inducible. Plant Sci. 2000, 152, 35–50. [Google Scholar] [CrossRef]
- Park, C.J.; Kim, K.J.; Shin, R.; Park, J.M.; Shin, Y.C.; Paek, K.H. Pathogenesis-related protein 10 isolated from hot pepper functions as a ribonuclease in an antiviral pathway. Plant J. 2004, 37, 186–198. [Google Scholar] [CrossRef]
- Breda, C.; Sallaud, C.; El-Turk, J.; Buffard, D.; De Kozak, I.; Esnault, R.; Kondorosi, A. Defense reaction in Medicago sativa: A gene encoding a class 10 PR protein is expressed in vascular bundles. Mol. Plant-Microbe Interact. 1996, 9, 713–719. [Google Scholar] [CrossRef] [PubMed]
- Robert, N.; Ferran, J.; Breda, C.; Coutos-Thévenot, P.; Boulay, M.; Buffard, D.; Esnault, R. Molecular characterization of the incompatible interaction of Vitis vinifera leaves with Pseudomonas syringae pv. pisi: Expression of genes coding for stilbene synthase and class 10 PR protein. Eur. J. Plant Pathol. 2001, 107, 249–261. [Google Scholar] [CrossRef]
- Walter, M.H.; Liu, J.W.; Grand, C.; Lamb, C.J.; Hess, D. Bean pathogenesis-related (PR) proteins deduced from elicitor-induced transcripts are members of a ubiquitous new class of conserved PR proteins including pollen allergens. MGG Mol. Gen. Genet. 1990, 222, 353–360. [Google Scholar] [CrossRef] [PubMed]
- Liu, J.J.; Ekramoddoullah, A.K.M.; Piggott, N.; Zamani, A. Molecular cloning of a pathogen/wound-inducible PR10 promoter from Pinus monticola and characterization in transgenic Arabidopsis plants. Planta 2005, 221, 159–169. [Google Scholar] [CrossRef] [PubMed]
- Jwa, N.S.; Kumar Agrawal, G.; Rakwal, R.; Park, C.H.; Prasad Agrawal, V. Molecular cloning and characterization of a novel jasmonate inducible pathogenesis-related class 10 protein gene, JIOsPR10, from rice (Oryza sativa L.) seedling leaves. Biochem. Biophys. Res. Commun. 2001, 286, 973–983. [Google Scholar] [CrossRef] [PubMed]
- Chadha, P.; Das, R.H. A pathogenesis related protein, AhPR10 from peanut: An insight of its mode of antifungal activity. Planta 2006, 225, 213–222. [Google Scholar] [CrossRef]
- Puehringer, H.M.; Zinoecker, I.; Marzban, G.; Katinger, H.; Laimer, M. MdAP, a novel protein in apple, is associated with the major allergen Mal d 1. Gene 2003, 321, 173–183. [Google Scholar] [CrossRef]
- Franz-Oberdorf, K.; Langer, A.; Strasser, R.; Isono, E.; Ranftl, Q.L.; Wunschel, C.; Schwab, W. Physical interaction between the strawberry allergen Fra a 1 and an associated partner FaAP: Interaction of Fra a 1 proteins and FaAP. Proteins 2017, 85, 1891–1901. [Google Scholar] [CrossRef]
- Mogensen, J.E.; Wimmer, R.; Larsen, J.N.; Spangfort, M.D.; Otzen, D.E. The major birch allergen, Bet v 1, shows affinity for a broad spectrum of physiological ligands. J. Biol. Chem. 2002, 277, 23684–23692. [Google Scholar] [CrossRef] [PubMed]
- Seutter von Loetzen, C.; Hoffmann, T.; Hartl, M.J.; Schweimer, K.; Schwab, W.; Rösch, P.; Hartl-Spiegelhauer, O. Secret of the major birch pollen allergen Bet v 1: Identification of the physiological ligand. Biochem. J. 2014, 457, 379–390. [Google Scholar] [CrossRef] [PubMed]
- Sliwiak, J.; Sikorski, M.; Jaskolski, M. PR-10 proteins as potential mediators of melatonin-cytokinin cross-talk in plants: Crystallographic studies of LlPR-10.2B isoform from yellow lupine. FEBS J. 2018, 285, 1907–1922. [Google Scholar] [CrossRef] [PubMed]
- Fernandes, H.; Michalska, K.; Sikorski, M.; Jaskolski, M. Structural and functional aspects of PR-10 proteins. FEBS J. 2013, 280, 1169–1199. [Google Scholar] [CrossRef] [PubMed]
- Samanani, N.; Liscombe, D.K.; Facchini, P.J. Molecular cloning and characterization of norcoclaurine synthase, an enzyme catalyzing the first committed step in benzylisoquinoline alkaloid biosynthesis. Plant J. 2004, 40, 302–313. [Google Scholar] [CrossRef] [PubMed]
- Lichman, B.R.; Gershater, M.C.; Lamming, E.D.; Pesnot, T.; Sula, A.; Keep, N.H.; Hailes, H.C.; Ward, J.M. “Dopamine-first” mechanism enables the rational engineering of the norcoclaurine synthase aldehyde activity profile. FEBS J. 2015, 282, 1137–1151. [Google Scholar] [CrossRef]
- Chen, X.; Hagel, J.M.; Chang, L.; Tucker, J.E.; Shiigi, S.A.; Yelpaala, Y.; Chen, H.-Y.; Estrada, R.; Colbeck, J.; Enquist-Newman, M.; et al. A pathogenesis-related 10 protein catalyzes the final step in thebaine biosynthesis. Nat. Chem. Biol. 2018, 14, 738–743. [Google Scholar] [CrossRef] [PubMed]
- Dastmalchi, M.; Chen, X.; Hagel, J.M.; Chang, L.; Chen, R.; Ramasamy, S.; Yeaman, S.; Facchini, P.J. Neopinone isomerase is involved in codeine and morphine biosynthesis in opium poppy. Nat. Chem. Biol. 2019, 15, 384–390. [Google Scholar] [CrossRef]
- Singh, A.; Massicotte, M.A.; Garand, A.; Tousignant, L.; Ouellette, V.; Bérubé, G.; Desgagné-Penix, I. Cloning and characterization of norbelladine synthase catalyzing the first committed reaction in Amaryllidaceae alkaloid biosynthesis. BMC Plant Biol. 2018, 18, 338. [Google Scholar] [CrossRef]
- Morris, J.S.; Caldo, K.M.P.; Liang, S.; Facchini, P.J. PR10/Bet v1-like Proteins as Novel Contributors to Plant Biochemical Diversity. Chembiochem 2021, 22, 264–287. [Google Scholar] [CrossRef]
- Shine, M.B.; Yang, J.W.; El-Habbak, M.; Nagyabhyru, P.; Fu, D.Q.; Navarre, D.; Ghabrial, S.; Kachroo, P.; Kachroo, A. Cooperative functioning between phenylalanine ammonia lyase and isochorismate synthase activities contributes to salicylic acid biosynthesis in soybean. New Phytol. 2016, 212, 627–636. [Google Scholar] [CrossRef] [PubMed]
- Li, F.; Pignatta, D.; Bendix, C.; Brunkard, J.O.; Cohn, M.M.; Tung, J.; Sun, H.; Kumar, P.; Baker, B. MicroRNA regulation of plant innate immune receptors. Proc. Natl. Acad. Sci. USA 2012, 109, 1790–1795. [Google Scholar] [CrossRef] [PubMed]
- Shivaprasad, P.V.; Chen, H.M.; Patel, K.; Bond, D.M.; Santos, B.A.C.M.; Baulcombe, D.C. A microRNA superfamily regulates nucleotide binding site-leucine-rich repeats and other mRNAs. Plant Cell 2012, 24, 859–874. [Google Scholar] [CrossRef] [PubMed]
- Zhai, J.; Jeong, D.H.; de Paoli, E.; Park, S.; Rosen, B.D.; Li, Y.; González, A.J.; Yan, Z.; Kitto, S.L.; Grusak, M.A.; et al. MicroRNAs as master regulators of the plant NB-LRR defense gene family via the production of phased, trans-acting siRNAs. Genes Dev. 2011, 25, 2540–2553. [Google Scholar] [CrossRef] [PubMed]
- Fei, Q.; Zhang, Y.; Xia, R.; Meyers, B.C. Small RNAs add zing to the zig-zag-zig model of plant defenses. Mol. Plant-Microbe Interact. 2016, 29, 165–169. [Google Scholar] [CrossRef]
- Bonfig, K.B.; Schreiber, U.; Gabler, A.; Roitsch, T.; Berger, S. Infection with virulent and avirulent P. syringae strains differentially affects photosynthesis and sink metabolism in Arabidopsis leaves. Planta 2006, 225, 1–12. [Google Scholar] [CrossRef] [PubMed]
- Scharte, J.; Schön, H.; Weis, E. Photosynthesis and carbohydrate metabolism in tobacco leaves during an incompatible interaction with Phytophthora nicotianae. Plant Cell Environ. 2005, 28, 1421–1435. [Google Scholar] [CrossRef]
- Swarbrick, P.J.; SCHULZE-LEFERT, P.; Scholes, J.D. Metabolic consequences of susceptibility and resistance (race-specific and broad-spectrum) in barley leaves challenged with powdery mildew. Plant Cell Environ. 2006, 29, 1061–1076. [Google Scholar] [CrossRef]
- Jain, S.; Chittem, K.; Brueggeman, R.; Osorno, J.M.; Richards, J.; Nelson, B.D. Comparative Transcriptome Analysis of Resistant and Susceptible Common Bean Genotypes in Response to Soybean Cyst Nematode Infection. PLoS ONE 2016, 11, e0159338. [Google Scholar] [CrossRef] [PubMed]
- Su, J.; Yang, L.; Zhu, Q.; Wu, H.; He, Y.; Liu, Y.; Xu, J.; Jiang, D.; Zhang, S. Active photosynthetic inhibition mediated by MPK3/MPK6 is critical to effector-triggered immunity. PLoS Biol. 2018, 16, e2004122. [Google Scholar] [CrossRef] [PubMed]
- Bilgin, D.D.; Zavala, J.A.; Zhu, J.I.N.; Clough, S.J.; Ort, D.R.; DeLUCIA, E.H. Biotic stress globally downregulates photosynthesis genes. Plant Cell Environ. 2010, 33, 1597–1613. [Google Scholar] [CrossRef] [PubMed]
- Naish, M.; Alonge, M.; Wlodzimierz, P.; Tock, A.J.; Abramson, B.W.; Schmücker, A.; Mandáková, T.; Jamge, B.; Lambing, C.; Kuo, P.; et al. The genetic and epigenetic landscape of the Arabidopsis centromeres. Science 2021, 374, eabi7489. [Google Scholar] [CrossRef] [PubMed]
- Wijesundera, R.L.C.; Bailey, J.A.; Byrde, R.J.W.; Fielding, A.H. Cell wall degrading enzymes of Colletotrichum lindemuthianum: Their role in the development of bean anthracnose. Physiol. Mol. Plant Pathol. 1989, 34, 403–413. [Google Scholar] [CrossRef]
- Herbert, C.; O’Connell, R.; Gaulin, E.; Salesses, V.; Esquerré-Tugayé, M.-T.; Dumas, B. Production of a cell wall-associated endopolygalacturonase by Colletotrichum lindemuthianum and pectin degradation during bean infection. Fungal Genet. Biol. 2004, 41, 140–147. [Google Scholar] [CrossRef] [PubMed]
- Trujillo, M.; Shirasu, K. Ubiquitination in plant immunity. Curr. Opin. Plant Biol. 2010, 13, 402–408. [Google Scholar] [CrossRef]
- Craig, A.; Ewan, R.; Mesmar, J.; Gudipati, V.; Sadanandom, A. E3 ubiquitin ligases and plant innate immunity. J. Exp. Bot. 2009, 60, 1123–1132. [Google Scholar] [CrossRef]
- Prator, C.A.; Chooi, K.M.; Jones, D.; Davy, M.W.; MacDiarmid, R.M.; Almeida, R.P.P. Comparison of two different host plant genera responding to grapevine leafroll-associated virus 3 infection. Sci. Rep. 2020, 10, 1–10. [Google Scholar] [CrossRef]
- Dudler, R. Manipulation of host proteasomes as a virulence mechanism of plant pathogens. Annu. Rev. Phytopathol. 2013, 51, 521–542. [Google Scholar] [CrossRef]
- Richard, M.M.S.; Pflieger, S.; Sévignac, M.; Thareau, V.; Blanchet, S.; Li, Y.; Jackson, S.A.; Geffroy, V. Fine mapping of Co-x, an anthracnose resistance gene to a highly virulent strain of Colletotrichum lindemuthianum in common bean. Theor. Appl. Genet. 2014, 127, 1653–1666. [Google Scholar] [CrossRef]
- Bolger, A.M.; Lohse, M.; Usadel, B. Trimmomatic: A flexible trimmer for Illumina sequence data. Bioinformatics 2014, 30, 2114–2120. [Google Scholar] [CrossRef]
- Kopylova, E.; Noé, L.; Touzet, H. SortMeRNA: Fast and accurate filtering of ribosomal RNAs in metatranscriptomic data. Bioinformatics 2012, 28, 3211–3217. [Google Scholar] [CrossRef] [PubMed]
- Dobin, A.; Davis, C.A.; Schlesinger, F.; Drenkow, J.; Zaleski, C.; Jha, S.; Batut, P.; Chaisson, M.; Gingeras, T.R. STAR: Ultrafast universal RNA-seq aligner. Bioinformatics 2013, 29, 15–21. [Google Scholar] [CrossRef] [PubMed]
- Robinson, M.D.; McCarthy, D.J.; Smyth, G.K. edgeR: A Bioconductor package for differential expression analysis of digital gene expression data. Bioinformatics 2009, 26, 139–140. [Google Scholar] [CrossRef] [PubMed]
- Rigaill, G.; Balzergue, S.; Brunaud, V.; Blondet, E.; Rau, A.; Rogier, O.; Caius, J.; Maugis-Rabusseau, C.; Soubigou-Taconnat, L.; Aubourg, S.; et al. Synthetic data sets for the identification of key ingredients for RNA-seq differential analysis. Brief. Bioinform. 2018, 19, 65–76. [Google Scholar] [CrossRef] [PubMed]
- Benjamini, Y.; Hochberg, Y. Controlling the False Discovery Rate: A Practical and Powerful Approach to Multiple Testing. J. R. Stat. Soc. Ser. B 1995, 57, 289–300. [Google Scholar] [CrossRef]
- R Core Team. R: A Language and Environment for Statistical Computing V. 3.6.1; R Foundation for Statistical Computing: Vienna, Austria, 2019. [Google Scholar]
- Wu, T.; Hu, E.; Xu, S.; Chen, M.; Guo, P.; Dai, Z.; Feng, T.; Zhou, L.; Tang, W.; Zhan, L.; et al. clusterProfiler 4.0: A universal enrichment tool for interpreting omics data. Innovation 2021, 2, 100141. [Google Scholar] [CrossRef] [PubMed]
- Supek, F.; Bošnjak, M.; Škunca, N.; Šmuc, T. REVIGO Summarizes and Visualizes Long Lists of Gene Ontology Terms. PLoS ONE 2011, 6, e21800. [Google Scholar] [CrossRef]
- Thimm, O.; Bläsing, O.; Gibon, Y.; Nagel, A.; Meyer, S.; Krüger, P.; Selbig, J.; Müller, L.A.; Rhee, S.Y.; Stitt, M. mapman: A user-driven tool to display genomics data sets onto diagrams of metabolic pathways and other biological processes. Plant J. 2004, 37, 914–939. [Google Scholar] [CrossRef]
- Ye, J.; Coulouris, G.; Zaretskaya, I.; Cutcutache, I.; Rozen, S.; Madden, T.L. Primer-BLAST: A tool to design target-specific primers for polymerase chain reaction. BMC Bioinform. 2012, 13, 134. [Google Scholar] [CrossRef] [PubMed]
- Borges, A.; Tsai, S.M.; Caldas, D.G.G. Validation of reference genes for RT-qPCR normalization in common bean during biotic and abiotic stresses. Plant Cell Rep. 2012, 31, 827–838. [Google Scholar] [CrossRef]
- Livak, K.J.; Schmittgen, T.D. Analysis of relative gene expression data using real-time quantitative PCR and the 2-ΔΔCT method. Methods 2001, 25, 402–408. [Google Scholar] [CrossRef] [PubMed]


| Incompatible | Compatible | ||||||||||||||||
|---|---|---|---|---|---|---|---|---|---|---|---|---|---|---|---|---|---|
| C531 vs. Mock 48 hpi | C531 vs. Mock 72 hpi | Strain 100 vs. Mock 48 hpi | Strain 100 vs. Mock 72 hpi | ||||||||||||||
| Gene ID | Annotation | Methylation Status | 24nt siRNA | LogFC | FDR | LogFC | FDR | LogFC | FDR | LogFC | FDR | ||||||
| Phvul.002G098200 | PTHR23155:SF414 LEUCINE-RICH REPEAT-CONTAINING PROTEIN | UM | None | 1.96 | 4.56E-03 | 1.95 | 9.53E-04 | 1.45 | 7.98E-02 | 1.78 | 3.97E-03 | ||||||
| Phvul.011G201900 | PTHR23155:SF414 LEUCINE-RICH REPEAT-CONTAINING PROTEIN | UM | None | 1.85 | 1.08E-02 | 0.39 | 6.31E-01 | 0.37 | 8.23E-01 | 0.57 | 4.26E-01 | ||||||
| Phvul.002G133400 | PTHR23155:SF633 LEUCINE-RICH REPEAT-CONTAINING PROTEIN | UM | None | 1.62 | 2.71E-03 | 1.46 | 2.05E-03 | 1.58 | 5.42E-03 | 1.33 | 7.01E-03 | ||||||
| Phvul.008G020700 | PTHR23155:SF497 LEUCINE-RICH REPEAT-CONTAINING PROTEIN | UM | None | 1.45 | 1.74E-02 | 2.38 | 1.40E-06 | 1.52 | 1.67E-02 | 1.94 | 1.36E-04 | ||||||
| Phvul.005G117900 | PTHR23155:SF497 LEUCINE-RICH REPEAT-CONTAINING PROTEIN | UM | None | 1.41 | 4.96E-02 | 1.93 | 3.73E-04 | 1.33 | 9.20E-02 | 1.73 | 2.47E-03 | ||||||
| Phvul.011G014400 | PTHR23155:SF402 DISEASE RESISTANCE PROTEIN RPP13-RELATED | UM | None | 1.08 | 5.96E-03 | 1.05 | 2.16E-03 | 0.92 | 3.83E-02 | 1.10 | 2.06E-03 | ||||||
| Phvul.010G024100 | PF00931//PF01582 NB-ARC domain (NB-ARC)//TIR domain (TIR) | UM | None | 0.95 | 8.43E-03 | 0.70 | 2.90E-02 | 0.64 | 1.60E-01 | 0.43 | 2.22E-01 | ||||||
| Phvul.009G233700 | PTHR23155:SF402 DISEASE RESISTANCE PROTEIN RPP13-RELATED | UM | None | 0.84 | 3.76E-02 | 1.27 | 6.95E-05 | 0.82 | 5.69E-02 | 1.35 | 2.94E-05 | ||||||
| Phvul.007G254700 | PTHR23155:SF563 LEUCINE-RICH REPEAT-CONTAINING PROTEIN | UM | None | 1.74 | 6.79E-02 | 1.75 | 1.53E-02 | 1.25 | 2.87E-01 | 2.04 | 6.30E-03 | ||||||
| Phvul.002G171400 | PTHR11945:SF169 MADS-BOX FAMILY PROTEIN | UM | None | 1.54 | 7.79E-02 | 1.78 | 1.06E-02 | 0.74 | 5.56E-01 | 1.78 | 1.36E-02 | ||||||
| Phvul.008G020900 | PTHR23155:SF497 LEUCINE-RICH REPEAT-CONTAINING PROTEIN | UM | None | 2.17 | 6.08E-02 | 1.74 | 3.75E-02 | 1.89 | 1.59E-01 | 1.40 | 1.15E-01 | ||||||
| Phvul.008G020750 | PTHR23155:SF497 LEUCINE-RICH REPEAT-CONTAINING PROTEIN | N.A | N.A | 1.33 | 1.35E-01 | 1.71 | 8.52E-03 | 1.32 | 1.83E-01 | 0.92 | 2.23E-01 | ||||||
| Phvul.003G129700 | PTHR11017:SF169 DISEASE RESISTANCE PROTEIN-RELATED | UM | None | 1.32 | 3.43E-01 | 2.33 | 1.07E-02 | 1.49 | 3.04E-01 | 2.63 | 5.49E-03 | ||||||
| Phvul.010G028200 | PF00931//PF13676 NB-ARC domain (NB-ARC) TIR domain (TIR_2) | UM | None | 1.24 | 1.03E-01 | 1.21 | 3.57E-02 | 0.81 | 4.07E-01 | 1.10 | 7.08E-02 | ||||||
| Phvul.001G132301 | PTHR23155:SF563 LEUCINE-RICH REPEAT-CONTAINING PROTEIN | N.A | N.A | 1.17 | 3.09E-01 | 1.66 | 4.42E-02 | 0.94 | 5.13E-01 | 2.21 | 6.15E-03 | ||||||
| Phvul.011G014500 | PTHR23155:SF402 DISEASE RESISTANCE PROTEIN RPP13-RELATED | UM | None | 0.92 | 1.00E-01 | 1.24 | 3.83E-03 | 0.94 | 1.12E-01 | 1.43 | 1.11E-03 | ||||||
| Phvul.002G133600 | PTHR23155:SF633 LEUCINE-RICH REPEAT-CONTAINING PROTEIN | CG-Meth | None | 0.68 | 3.15E-01 | 1.24 | 6.35E-03 | 0.55 | 4.80E-01 | 1.36 | 4.14E-03 | ||||||
| Phvul.004G048000 | PTHR23155:SF554 LEUCINE-RICH REPEAT-CONTAINING PROTEIN | C-Meth | Yes | 0.60 | 6.64E-01 | 1.94 | 1.71E-02 | 0.41 | 8.17E-01 | 2.54 | 2.22E-03 | ||||||
| Phvul.004G013300 | K00122 Formate dehydrogenase (FDH) | C-Meth | Yes | 0.59 | 2.29E-01 | 0.81 | 1.61E-02 | 0.18 | 8.26E-01 | 0.61 | 9.14E-02 | ||||||
| Phvul.003G247200 | PTHR23155:SF543 LEUCINE-RICH REPEAT-CONTAINING PROTEIN | UM | None | 0.57 | 1.32E-01 | 1.01 | 3.58E-04 | 0.50 | 2.52E-01 | 1.02 | 4.75E-04 | ||||||
| Phvul.011G136130 | K14488 SAUR family protein (SAUR) | N.A | N.A | 0.47 | 3.47E-01 | 0.75 | 2.44E-02 | 0.14 | 8.59E-01 | 0.44 | 2.35E-01 | ||||||
| Phvul.004G140700 | PF05729//PF13676 NACHT domain (NACHT)//TIR domain | UM | None | 0.42 | 3.74E-01 | 0.81 | 8.70E-03 | 0.38 | 4.65E-01 | 0.85 | 7.76E-03 | ||||||
| Phvul.003G072500 | PTHR12565:SF107 TRANSCRIPTION FACTOR BPE | UM | None | 0.35 | 3.25E-01 | 0.50 | 4.40E-02 | 0.20 | 6.79E-01 | 0.61 | 1.35E-02 | ||||||
| Phvul.010G054400 | PF01582 TIR domain (TIR) | UM | None | 0.33 | 8.02E-01 | 2.10 | 1.81E-03 | 0.60 | 6.28E-01 | 1.89 | 7.60E-03 | ||||||
| Phvul.001G134100 | PTHR23155:SF563 LEUCINE-RICH REPEAT-CONTAINING PROTEIN | C-Meth | Yes | 0.32 | 7.09E-01 | 0.94 | 4.28E-02 | 0.26 | 8.04E-01 | 0.74 | 1.37E-01 | ||||||
| Phvul.004G140800 | PTHR11017:SF171 LEUCINE-RICH REPEAT-CONTAINING PROTEIN | C-Meth | None | 0.31 | 6.65E-01 | 1.14 | 4.47E-03 | 0.23 | 7.93E-01 | 1.01 | 1.78E-02 | ||||||
| Phvul.002G131000 | PTHR23155:SF505 LEUCINE-RICH REPEAT-CONTAINING PROTEIN | C-Meth | None | 0.31 | 3.72E-01 | 0.48 | 3.37E-02 | 0.14 | 7.72E-01 | 0.54 | 1.91E-02 | ||||||
| Phvul.011G202900 | PTHR23155:SF414 LEUCINE-RICH REPEAT-CONTAINING PROTEIN | C-Meth | None | 0.30 | 5.76E-01 | 0.79 | 2.01E-02 | 0.24 | 7.14E-01 | 0.27 | 5.26E-01 | ||||||
| Phvul.001G018800 | PTHR23155:SF543 LEUCINE-RICH REPEAT-CONTAINING PROTEIN | UM | None | 0.30 | 3.21E-01 | 0.51 | 1.53E-02 | 0.36 | 2.55E-01 | 0.47 | 3.37E-02 | ||||||
| Phvul.011G172100 | PTHR23155:SF554 LEUCINE-RICH REPEAT-CONTAINING PROTEIN | C-Meth | None | 0.27 | 7.89E-01 | 0.79 | 1.77E-01 | −0.56 | 5.97E-01 | 1.21 | 2.48E-02 | ||||||
| Phvul.002G021700 | PTHR23155:SF543 LEUCINE-RICH REPEAT-CONTAINING PROTEIN | UM | None | 0.25 | 6.57E-01 | 0.79 | 1.48E-02 | 0.24 | 7.03E-01 | 0.78 | 2.15E-02 | ||||||
| Phvul.010G101200 | PTHR11017:SF174 LEUCINE-RICH REPEAT-CONTAINING PROTEIN | C-Meth | None | 0.23 | 7.79E-01 | 1.07 | 1.51E-02 | 0.11 | 9.26E-01 | 1.29 | 4.25E-03 | ||||||
| Phvul.002G166400 | PTHR23155:SF506 LEUCINE-RICH REPEAT-CONTAINING PROTEIN | UM | None | 0.22 | 5.45E-01 | 0.55 | 1.51E-02 | 0.29 | 4.27E-01 | 0.66 | 3.80E-03 | ||||||
| Phvul.003G247651 | PTHR23155:SF543 LEUCINE-RICH REPEAT-CONTAINING PROTEIN | N.A | N.A | 0.21 | 6.91E-01 | 0.78 | 1.01E-02 | 0.36 | 4.79E-01 | 0.98 | 1.48E-03 | ||||||
| Phvul.011G202966 | PTHR23155:SF414 LEUCINE-RICH REPEAT-CONTAINING PROTEIN | N.A | N.A | 0.21 | 5.19E-01 | 0.49 | 1.49E-02 | 0.08 | 8.70E-01 | 0.42 | 4.95E-02 | ||||||
| Phvul.011G014301 | PTHR23155:SF402 DISEASE RESISTANCE PROTEIN RPP13-RELATED | N.A | N.A | 0.16 | 5.14E-01 | 0.36 | 2.02E-02 | 0.16 | 5.40E-01 | 0.34 | 3.65E-02 | ||||||
| Phvul.011G195100 | PTHR23155:SF414 LEUCINE-RICH REPEAT-CONTAINING PROTEIN | C-Meth | None | 0.12 | 9.27E-01 | 1.56 | 1.68E-02 | 0.75 | 3.86E-01 | 1.29 | 6.74E-02 | ||||||
| Phvul.002G323200 | PTHR11017:SF162 LEUCINE-RICH REPEAT-CONTAINING PROTEIN | UM | None | 0.03 | 9.71E-01 | 0.33 | 3.24E-01 | −0.05 | 9.45E-01 | 0.62 | 4.08E-02 | ||||||
| Phvul.011G193600 | PF00931//PF13855 NB-ARC domain (NB-ARC)//Leucine rich repeat | C-Meth | None | 0.00 | 9.96E-01 | −0.44 | 9.41E-02 | −0.13 | 8.05E-01 | −0.53 | 4.40E-02 | ||||||
| Phvul.010G026400 | PF00931//PF13676 NB-ARC domain (NB-ARC)//TIR domain | C-Meth | None | −0.04 | 9.39E-01 | 0.58 | 2.51E-02 | −0.15 | 7.78E-01 | 0.44 | 1.12E-01 | ||||||
| Phvul.011G074800 | 1.3.99.12 2-methylacyl-CoA dehydrogenase/Branched-chain acyl-CoA | UM | None | −0.09 | 9.24E-01 | 0.90 | 2.50E-02 | −0.08 | 9.37E-01 | 0.56 | 2.06E-01 | ||||||
| Phvul.002G075400 | KOG4308 LRR-containing protein | N.A | N.A | −0.13 | 7.13E-01 | −0.31 | 1.48E-01 | −0.17 | 6.38E-01 | −0.52 | 1.26E-02 | ||||||
| Phvul.011G193100 | PTHR23155:SF414 LEUCINE-RICH REPEAT-CONTAINING PROTEIN | C-Meth | −0.20 | 5.50E-01 | −0.39 | 7.92E-02 | −0.27 | 4.25E-01 | −0.44 | 4.87E-02 | |||||||
| Phvul.011G198400 | PF00931//PF13855 NB-ARC domain (NB-ARC)//Leucine rich repeat | C-Meth | −0.28 | 4.49E-01 | −0.19 | 5.43E-01 | −0.62 | 4.66E-02 | −0.18 | 5.54E-01 | |||||||
| Phvul.008G072300 | PTHR23155:SF590 LEUCINE-RICH REPEAT-CONTAINING PROTEIN | UM | None | −0.45 | 4.26E-01 | 0.03 | 9.67E-01 | −1.00 | 3.95E-02 | −0.02 | 9.76E-01 | ||||||
| Phvul.002G075000 | PTHR23155:SF505 LEUCINE-RICH REPEAT-CONTAINING PROTEIN | UM | None | −0.47 | 6.08E-01 | −0.67 | 3.39E-01 | −1.51 | 4.62E-02 | −0.63 | 3.63E-01 | ||||||
| Phvul.011G191600 | PF13191//PF13855 AAA ATPase domain//Leucine rich repeat | C-Meth | None | −0.60 | 3.96E-02 | −0.03 | 9.38E-01 | −0.65 | 3.26E-02 | −0.18 | 5.65E-01 | ||||||
| Phvul.005G005000 | PTHR32472 P-LOOP CONTAINING NUCLEOSIDE TRIPHOSPHATE HYDROLASES SUPERFAMILY PROTEIN | UM | None | −1.81 | 3.97E-02 | −1.50 | 1.40E-01 | −2.54 | 4.87E-03 | −3.78 | 2.70E-03 | ||||||
| N.A: Not available; UM: Unmethylated; C-Meth: CHG or CHH gene-body methylated; CG-Meth: CG gene-body methylated: Underlined (purple): Methylation due to a TE inserted in an intron; Underlined (green): Methylation due to an associated repeat located in an intron. | |||||||||||||||||
| FDR | |||||||||||||||||
| 1.00E-10 | 1.00E-08 | 0.05 | 0.00 | ||||||||||||||
| Log2FC | |||||||||||||||||
| −2.50 | −1.50 | −1.00 | −0.5 | 0.00 | 0.5 | 1.00 | 1.50 | 2.50 | |||||||||
| Incompatible | Compatible | ||||||||||
|---|---|---|---|---|---|---|---|---|---|---|---|
| C531 vs. Mock 48 hpi | C531 vs. Mock 72 hpi | Strain 100 vs. Mock 48 hpi | Strain 100 vs. Mock 72 hpi | ||||||||
| Gene ID | Annotation | LogFC | FDR | LogFC | FDR | LogFC | FDR | LogFC | FDR | ||
| Phvul.002G209500 * | PF00407—Pathogenesis-related protein Bet v I family (PR10) | 4.53 | 2.34E-19 | 2.80 | 3.29E-08 | 3.06 | 2.94E-08 | 1.91 | 3.09E-04 | ||
| Phvul.003G109603 | PF00407—Pathogenesis-related protein Bet v I family (PR10) | 4.31 | 4.94E-04 | 2.99 | 3.98E-03 | 3.51 | 1.48E-02 | 2.21 | 4.48E-02 | ||
| Phvul.003G109200 | PF00407—Pathogenesis-related protein Bet v I family (PR10) | 4.18 | 8.46E-10 | 2.94 | 1.54E-05 | 2.69 | 5.41E-04 | 2.30 | 1.31E-03 | ||
| Phvul.002G209400 | PF00407—Pathogenesis-related protein Bet v I family (PR10) | 4.15 | 6.68E-10 | 2.84 | 9.35E-06 | 3.02 | 1.03E-04 | 2.14 | 1.57E-03 | ||
| Phvul.003G109800 | PF00407—Pathogenesis-related protein Bet v I family (PR10) | 3.63 | 2.12E-03 | 2.84 | 1.29E-03 | 1.68 | 4.46E-01 | 1.92 | 6.28E-02 | ||
| Phvul.003G109000 | PTHR31339—PECTIN LYASE-LIKE SUPERFAMILY PROTEIN (Bet v 1) (PR10) | 3.46 | 7.35E-05 | 2.52 | 1.14E-03 | 2.81 | 3.85E-03 | 2.85 | 3.11E-04 | ||
| Phvul.003G109100 | PTHR22847:SF361—JOUBERIN Bet v I family (PR10) | 3.44 | 6.18E-09 | 2.62 | 1.13E-05 | 2.66 | 7.18E-05 | 1.83 | 3.14E-03 | ||
| Phvul.002G155500 | PF00314—Thaumatin family (Thaumatin) Pathogenesis-related (PR5) | 2.23 | 9.47E-07 | 1.89 | 2.78E-05 | 1.84 | 2.63E-04 | 1.55 | 1.02E-03 | ||
| Phvul.006G196900 ** | K13449—pathogenesis-related protein 1 (PR1) | 2.21 | 2.31E-05 | 1.28 | 1.19E-02 | 1.88 | 1.00E-03 | 0.99 | 6.97E-02 | ||
| Phvul.002G286600 | KOG4837—Uncharacterized conserved protein Pathogenesis-related (PR5) | 1.97 | 2.35E-01 | 2.15 | 2.43E-02 | 1.71 | 3.75E-01 | 2.28 | 2.30E-02 | ||
| Phvul.006G197500 | PTHR10334—CYSTEINE-RICH SECRETORY PROTEIN (PR1) | 1.37 | 3.91E-02 | 0.41 | 5.58E-01 | 0.90 | 2.96E-01 | 0.63 | 3.13E-01 | ||
| Phvul.011G183900 | PF00407—Pathogenesis-related protein Bet v I family (PR10) | 0.95 | 5.62E-02 | 0.94 | 2.09E-02 | 0.73 | 2.20E-01 | 0.97 | 2.33E-02 | ||
| Phvul.011G183766 | PF00407—Pathogenesis-related protein Bet v I family (PR10) | 0.94 | 1.02E-01 | 0.86 | 6.71E-02 | 0.78 | 2.45E-01 | 1.03 | 2.97E-02 | ||
| Phvul.011G183700 | PF00407—Pathogenesis-related protein Bet v I family (PR10) | 0.88 | 4.05E-02 | 0.86 | 1.79E-02 | 0.70 | 1.66E-01 | 0.83 | 2.80E-02 | ||
| Phvul.011G183832 | PF00407—Pathogenesis-related protein Bet v I family (PR10) | 0.83 | 8.87E-02 | 0.89 | 2.25E-02 | 0.71 | 2.08E-01 | 0.92 | 2.39E-02 | ||
| Phvul.002G286500 | PF00314—Thaumatin family (Thaumatin) (PR5) | 0.79 | 4.56E-01 | 2.01 | 3.32E-03 | 0.51 | 7.00E-01 | 2.15 | 2.57E-03 | ||
| Phvul.011G184200 | PF00407—Pathogenesis-related protein Bet v I family (PR10) | 0.77 | 1.00E-02 | 0.86 | 9.60E-04 | 0.62 | 7.75E-02 | 0.78 | 4.18E-03 | ||
| Phvul.011G183400 | PF00407—Pathogenesis-related protein Bet v I family (PR10) | 0.53 | 2.24E-02 | 0.27 | 2.33E-01 | 0.40 | 1.49E-01 | 0.30 | 1.78E-01 | ||
| Phvul.006G197200 | PTHR10334—CYSTEINE-RICH SECRETORY PROTEIN (PR1) | 0.20 | 9.41E-01 | 2.34 | 4.93E-02 | 0.20 | 9.54E-01 | 2.62 | 3.09E-02 | ||
| Phvul.011G183000 | PF00407—Pathogenesis-related protein Bet v I family (PR10) | 0.15 | 9.29E-01 | 0.76 | 3.94E-01 | −0.39 | 8.07E-01 | 1.82 | 2.40E-02 | ||
| Phvul.008G166500 | [NAD(+)], CYTOPLASMIC Pathogenesis-related (PR5) | −0.72 | 1.21E-01 | −1.06 | 1.65E-02 | −0.52 | 3.45E-01 | −0.27 | 5.96E-01 | ||
| Phvul.009G082100 | Pathogenesis-related protein p14a (PR1-like) | −0.76 | 2.41E-01 | −1.73 | 1.89E-04 | −0.65 | 3.79E-01 | −1.44 | 2.73E-03 | ||
| Phvul.011G182900 | PF00407—Pathogenesis-related protein Bet v I family (PR10) | −0.89 | 2.05E-02 | −1.05 | 3.12E-03 | −0.82 | 5.06E-02 | −0.60 | 1.16E-01 | ||
| Phvul.001G016700 | PTHR31048:SF10—PATHOGENESIS-RELATED PROTEIN 5-RELATED (PR5) | −0.93 | 2.16E-01 | −2.26 | 1.62E-04 | −0.64 | 4.84E-01 | −1.27 | 3.64E-02 | ||
| Phvul.011G034200 | PROTEIN AGD2-RELATED Pathogenesis-related (PR5) | −0.98 | 3.90E-01 | −2.19 | 6.17E-03 | −0.60 | 6.76E-01 | −1.48 | 7.49E-02 | ||
| *; **: Bet v I (PR10) and PR1 are presented in bold and underlined, respectively, while PR5 encoding genes appears in normal character. | |||||||||||
| FDR | |||||||||||
| 1.00E-10 | 1.00E-08 | 0.05 | 0.00 | ||||||||
| Log2FC | |||||||||||
| −2.50 | −1.50 | −1.00 | −0.5 | 0.00 | 0.5 | 1.00 | 1.50 | 2.50 | |||
| Incompatible | Compatible | ||||||||||
|---|---|---|---|---|---|---|---|---|---|---|---|
| C531 vs. Mock 48 hpi | C531 vs. Mock 72 hpi | Strain 100 vs. Mock 48 hpi | Strain 100 vs. Mock 72 hpi | ||||||||
| Gene ID | Annotation | LogFC | FDR | LogFC | FDR | LogFC | FDR | LogFC | FDR | ||
| Auxins | |||||||||||
| Phvul.009G103800 | K14488—SAUR family protein (SAUR) | 2.45 | 4.37E-02 | 0.26 | 8.47E-01 | 2.01 | 1.59E-01 | 0.16 | 9.15E-01 | ||
| Phvul.006G186600 | PTHR11772//PTHR11772:SF19—ASPARAGINE SYNTHETASE | 1.10 | 9.08E-02 | 1.03 | 5.09E-02 | 0.92 | 2.24E-01 | 1.13 | 3.62E-02 | ||
| Phvul.009G001800 | K14488—SAUR family protein (SAUR) | 1.02 | 1.72E-01 | 2.39 | 3.71E-05 | 1.12 | 1.52E-01 | 2.41 | 4.03E-05 | ||
| Phvul.006G142300 | PTHR23130:SF80-AUXIN-INDUCED IN ROOT CULTURES PROTEIN 12 | 0.85 | 4.61E-02 | 1.38 | 5.42E-05 | 0.91 | 3.76E-02 | 1.44 | 3.37E-05 | ||
| Phvul.009G001500 | K14488—SAUR family protein (SAUR) | 0.65 | 5.15E-01 | 1.31 | 5.46E-02 | −0.08 | 9.65E-01 | 1.59 | 2.06E-02 | ||
| Phvul.011G108500 | PTHR10641//PTHR10641—MYB-LIKE DNA-BINDING PROTEIN MYB | 0.51 | 6.36E-01 | 1.28 | 4.44E-02 | 0.50 | 6.76E-01 | 1.12 | 9.11E-02 | ||
| Phvul.010G117500 | K14488—SAUR family protein (SAUR) | 0.41 | 5.20E-01 | 1.10 | 3.96E-03 | 0.19 | 8.32E-01 | 0.99 | 1.52E-02 | ||
| Phvul.001G147300 | K14487—auxin responsive GH3 gene family (GH3) | 0.34 | 8.10E-01 | 1.57 | 3.47E-02 | −0.34 | 8.43E-01 | 0.79 | 3.60E-01 | ||
| Phvul.007G219500 | PTHR12899//PTHR12899:SF4—39S RIBOSOMAL PROTEIN L18 | 0.34 | 6.94E-01 | 0.99 | 4.84E-02 | 0.47 | 5.83E-01 | 1.41 | 4.67E-03 | ||
| Phvul.011G037300 | PTHR23334—CCAAT/ENHANCER BINDING PROTEIN | 0.11 | 9.10E-01 | −1.39 | 1.16E-02 | −0.19 | 8.46E-01 | −0.40 | 4.98E-01 | ||
| Phvul.002G209300 | PTHR23335:SF12—CALMODULIN-BINDING TRANSCRIPTION ACTIVATOR 1 | 0.05 | 8.70E-01 | 0.26 | 9.24E-02 | 0.01 | 9.80E-01 | 0.44 | 2.91E-03 | ||
| Phvul.011G037900 | PTHR24015:SF364—ATPASE EXPRESSION PROTEIN 3 | −0.22 | 8.14E-01 | −1.18 | 1.58E-02 | −0.10 | 9.41E-01 | −0.93 | 7.20E-02 | ||
| Phvul.002G147300 | PTHR31933:SF3—O-FUCOSYLTRANSFERASE FAMILY PROTEIN | −0.26 | 3.65E-01 | −0.44 | 2.80E-02 | −0.29 | 3.46E-01 | −0.39 | 6.39E-02 | ||
| Phvul.008G286600 | PF03188//PF04526—Eukaryotic cytochrome b561 (Cytochrom B561) | −0.30 | 6.39E-01 | −0.94 | 5.06E-02 | −0.23 | 7.54E-01 | −1.05 | 3.26E-02 | ||
| Phvul.010G125400 | PF02519—Auxin responsive protein (Auxin inducible) | −0.36 | 6.75E-01 | −0.93 | 7.57E-02 | −0.18 | 8.70E-01 | −1.17 | 2.67E-02 | ||
| Phvul.003G190900 | PF03634—TCP family transcription factor (TCP) | −0.37 | 2.34E-01 | −0.61 | 7.03E-03 | −0.31 | 3.93E-01 | −0.42 | 8.54E-02 | ||
| Phvul.003G127801 | PTHR31374:SF22—AUXIN-RESPONSIVE PROTEIN-LIKE PROTEIN | −0.50 | 4.07E-01 | −1.12 | 7.57E-03 | −0.26 | 7.45E-01 | −0.95 | 3.01E-02 | ||
| Phvul.009G188100 | PF03634—TCP family transcription factor (TCP) | −0.50 | 2.34E-01 | −0.65 | 4.12E-02 | −0.37 | 4.60E-01 | −0.54 | 1.06E-01 | ||
| Phvul.006G113100 | PF13639//PF13947//PF14380—Ring finger domain (zf-RING 2) | −1.02 | 1.63E-02 | −0.84 | 6.39E-02 | −0.62 | 2.45E-01 | −0.02 | 9.76E-01 | ||
| Brassinosteroids | |||||||||||
| Phvul.003G187200 | PF00069//PF00560//PF08263—Protein kinase domain (Pkinase) | 2.12 | 7.49E-03 | 1.99 | 2.30E-03 | 2.14 | 9.73E-03 | 2.09 | 2.40E-03 | ||
| Phvul.002G207000 | K13416—brassinosteroid insensitive 1-associated receptor kinase 1 | 1.39 | 1.98E-02 | 1.80 | 2.92E-04 | 1.47 | 1.75E-02 | 1.87 | 2.77E-04 | ||
| Phvul.002G158800 | PTHR14155—RING FINGER DOMAIN-CONTAINING | 0.51 | 1.13E-01 | 0.12 | 7.38E-01 | 0.70 | 2.17E-02 | 0.30 | 2.96E-01 | ||
| Phvul.009G184500 | PF00069//PF00560//PF08263—Protein kinase domain (Pkinase) | 0.43 | 6.22E-01 | 1.05 | 4.16E-02 | 0.70 | 3.92E-01 | 1.17 | 2.65E-02 | ||
| Phvul.006G208100 | K13416—brassinosteroid insensitive 1-associated receptor kinase 1 | 0.28 | 5.13E-01 | 0.56 | 4.35E-02 | 0.23 | 6.55E-01 | 0.60 | 3.50E-02 | ||
| Phvul.002G216900 | Squalene monooxygenase/Squalene epoxidase | 0.04 | 9.81E-01 | −1.82 | 8.58E-03 | −0.44 | 7.44E-01 | −1.24 | 8.65E-02 | ||
| Phvul.004G067300 | no data | 0.00 | 9.97E-01 | −0.79 | 1.24E-02 | −0.16 | 8.18E-01 | −0.88 | 6.79E-03 | ||
| Phvul.009G056400 | K14503—brassinosteroid resistant 1/2 (BZR1 2) | −0.21 | 6.34E-01 | −0.52 | 5.11E-02 | −0.05 | 9.43E-01 | −0.59 | 3.16E-02 | ||
| Phvul.007G223700 | PTHR10015:SF164—HEAT STRESS TRANSCRIPTION FACTOR A-3 | −0.37 | 2.47E-01 | −0.54 | 2.36E-02 | −0.26 | 5.06E-01 | −0.47 | 6.13E-02 | ||
| Phvul.011G031700 | PTHR31388:SF37—PEROXIDASE 4-RELATED | −0.50 | 3.99E-01 | −1.06 | 7.79E-03 | −0.45 | 4.93E-01 | −1.05 | 1.09E-02 | ||
| Phvul.009G020000 | Cycloartenol 24-C-methyltransferase/Sterol C-methyltransferase | −0.52 | 2.28E-01 | −0.66 | 4.08E-02 | −0.09 | 9.05E-01 | −0.45 | 1.97E-01 | ||
| Phvul.002G291800 | PF00651—BTB/POZ domain (BTB) | −0.83 | 2.68E-01 | −2.01 | 1.17E-03 | −0.32 | 7.56E-01 | −0.82 | 1.84E-01 | ||
| Phvul.010G064300 | K02728—20S proteasome subunit alpha 3 (PSMA4) | −1.57 | 4.87E-02 | −2.23 | 2.24E-03 | −1.70 | 3.67E-02 | −2.21 | 2.72E-03 | ||
| Abscisic acid | |||||||||||
| Phvul.011G096800 | KOG0725—Reductases with broad range of substrate specificities | 5.47 | 1.30E-02 | 3.10 | 2.02E-02 | 2.86 | 3.51E-01 | 2.10 | 1.43E-01 | ||
| Phvul.009G218800 | PTHR11926:SF242—UDP-GLYCOSYLTRANSFERASE 71B2-RELATED | 1.54 | 5.86E-03 | 1.45 | 2.20E-03 | 1.35 | 3.08E-02 | 1.14 | 2.62E-02 | ||
| Phvul.004G138600 | PF02893—GRAM domain (GRAM) | 1.02 | 4.17E-01 | 1.83 | 3.34E-02 | 1.33 | 2.91E-01 | 2.11 | 1.89E-02 | ||
| Phvul.008G209900 | K00423—L-ascorbate oxidase (E1.10.3.3) | 0.91 | 9.81E-02 | 1.05 | 1.53E-02 | 0.81 | 1.94E-01 | 1.06 | 1.90E-02 | ||
| Phvul.001G153200 | PF04570—zinc-finger of the FCS-type, C2-C2 (zf-FLZ) | 0.56 | 4.41E-01 | 1.28 | 6.08E-03 | 0.30 | 7.60E-01 | 0.83 | 1.02E-01 | ||
| Phvul.001G087100 | Pleckstrin-homology domain (PH domain) | 0.54 | 7.67E-02 | 0.54 | 3.23E-02 | 0.37 | 3.44E-01 | 0.75 | 2.35E-03 | ||
| Phvul.011G097200 | KOG0725—Reductases with broad range of substrate specificities | 0.48 | 1.39E-01 | 0.73 | 2.86E-03 | 0.62 | 4.72E-02 | 0.53 | 4.50E-02 | ||
| Phvul.002G122200 | PTHR24286:SF10—ABSCISIC ACID 8’-HYDROXYLASE 1-RELATED | 0.15 | 8.58E-01 | 1.06 | 6.51E-03 | 0.33 | 6.45E-01 | 1.13 | 5.44E-03 | ||
| Phvul.003G191100 | PTHR12300:SF52—HVA22-LIKE PROTEIN A-RELATED | −0.30 | 4.45E-01 | −0.74 | 5.03E-03 | −0.42 | 2.80E-01 | −0.55 | 5.38E-02 | ||
| Phvul.002G086700 | PTHR12300:SF51—HVA22-LIKE PROTEIN C | −0.39 | 5.77E-01 | −1.03 | 1.99E-02 | −0.16 | 8.70E-01 | −0.84 | 7.18E-02 | ||
| Phvul.001G007300 | PTHR12300:SF26—HVA22-LIKE PROTEIN G-RELATED | −0.48 | 1.91E-01 | −1.07 | 9.85E-05 | −0.51 | 1.90E-01 | −0.75 | 9.87E-03 | ||
| Phvul.008G190500 | PTHR12300:SF27—HVA22-LIKE PROTEIN F | −0.54 | 3.84E-01 | −1.32 | 3.11E-03 | −0.58 | 3.77E-01 | −1.28 | 5.12E-03 | ||
| Ethylene | |||||||||||
| Phvul.007G273000 | PTHR31190:SF15—ETHYLENE-RESPONSIVE TRANSCRIPTION FACTOR 1B | 3.66 | 1.42E-02 | 2.21 | 1.88E-02 | 3.00 | 1.19E-01 | 2.77 | 3.24E-03 | ||
| Phvul.001G160100 | PTHR31190:SF26—ETHYLENE-RESPONSIVE TRANSCRIPTION FACTOR | 2.62 | 1.16E-03 | 1.51 | 2.97E-02 | 1.94 | 5.00E-02 | 0.23 | 8.06E-01 | ||
| Phvul.002G326600 | PTHR18934:SF112—DEA(D/H)-BOX RNA HELICASE FAMILY PROTEIN | 2.29 | 5.13E-04 | 2.25 | 2.29E-04 | 2.31 | 8.01E-04 | 2.44 | 8.86E-05 | ||
| Phvul.010G003300 | no data | 1.95 | 1.13E-02 | 2.72 | 3.41E-05 | 2.02 | 9.54E-03 | 3.37 | 2.34E-07 | ||
| Phvul.007G127800 | PTHR31153:SF3—HISTONE H1FLK-LIKE PROTEIN-RELATED | 1.94 | 9.04E-05 | 1.34 | 4.47E-03 | 1.65 | 2.51E-03 | 1.06 | 3.46E-02 | ||
| Phvul.004G081900 | PTHR13690:SF86—TRANSCRIPTION FACTOR VIP1 | 1.90 | 3.97E-04 | 1.82 | 1.62E-04 | 1.40 | 3.11E-02 | 1.43 | 5.37E-03 | ||
| Phvul.004G081900 | PTHR13690:SF86—TRANSCRIPTION FACTOR VIP1 | 1.90 | 3.97E-04 | 1.82 | 1.62E-04 | 1.40 | 3.11E-02 | 1.43 | 5.37E-03 | ||
| Phvul.003G020100 | PTHR10209- OXIDOREDUCTASE, 2OG-FE II OXYGENASE | 1.67 | 8.68E-03 | 1.42 | 9.56E-03 | 1.10 | 1.76E-01 | 1.29 | 2.38E-02 | ||
| Phvul.003G020000 | 2,4-dihydroxy-1,4-benzoxazin-3-one-glucoside dioxygenase/ | 1.13 | 1.11E-01 | 1.65 | 2.01E-03 | 0.82 | 3.46E-01 | 1.52 | 6.29E-03 | ||
| Phvul.009G066980 | PTHR31729:SF0—ETHYLENE-RESPONSIVE TRANSCRIPTION FACTOR | 1.06 | 7.49E-03 | 0.79 | 2.74E-02 | 1.13 | 4.87E-03 | 0.81 | 2.84E-02 | ||
| Phvul.003G020200 | PTHR10209—OXIDOREDUCTASE, 2OG-FE II OXYGENASE FAMILY PROTEIN | 1.05 | 1.92E-01 | 1.18 | 5.48E-02 | 0.97 | 2.76E-01 | 1.47 | 1.85E-02 | ||
| Phvul.008G127500 | PTHR15898:SF1—GLUCOSE-INDUCED DEGRADATION PROTEIN 4 | 1.01 | 7.54E-02 | 1.27 | 4.09E-03 | 0.82 | 2.26E-01 | 0.88 | 6.61E-02 | ||
| Phvul.009G003400 | PTHR10209:SF107 FE(II)-DEPENDENT OXYGENASE-LIKE PROTEIN-RELATED | 0.93 | 2.96E-01 | 1.50 | 1.11E-02 | 1.02 | 2.85E-01 | 1.34 | 3.11E-02 | ||
| Phvul.006G183100 | PF00847—AP2 domain (AP2) | 0.86 | 1.59E-02 | 1.05 | 5.42E-04 | 0.75 | 6.43E-02 | 0.57 | 9.01E-02 | ||
| Phvul.003G020300 | PTHR10209//PTHR10209:SF148—OXIDOREDUCTASE, 2OG-FE II | 0.81 | 1.34E-01 | 0.94 | 2.76E-02 | 0.75 | 2.20E-01 | 0.94 | 3.16E-02 | ||
| Phvul.011G125200 | no data | 0.73 | 3.90E-02 | 0.65 | 2.54E-02 | 0.70 | 6.39E-02 | 0.63 | 3.61E-02 | ||
| Phvul.001G225300 | PF00582—Universal stress protein family (Usp) | 0.69 | 1.23E-01 | 0.75 | 2.57E-02 | 0.41 | 4.92E-01 | 0.55 | 1.32E-01 | ||
| Phvul.007G241600 | K06228—fused (FU) | 0.63 | 1.18E-01 | 0.86 | 5.28E-03 | 0.80 | 4.05E-02 | 0.79 | 1.58E-02 | ||
| Phvul.002G055800 | K09286—EREBP-like factor (EREBP) | 0.54 | 7.35E-02 | 0.84 | 2.93E-04 | 0.79 | 3.33E-03 | 0.85 | 3.09E-04 | ||
| Phvul.002G293000 | K11135—Pin2-interacting protein X1 (PINX1) | 0.52 | 5.51E-01 | 1.22 | 2.66E-02 | 0.59 | 5.20E-01 | 1.33 | 2.07E-02 | ||
| Phvul.004G120700 | Deacetoxyvindoline 4-hydroxylase/Desacetyoxyvindoline-17-hydroxylase | 0.42 | 3.34E-01 | 0.65 | 2.94E-02 | 0.20 | 7.33E-01 | 0.50 | 1.15E-01 | ||
| Phvul.002G055700 | PTHR31190:SF30—ETHYLENE-RESPONSIVE TRANSCRIPTION FACTOR 15 | 0.41 | 2.09E-01 | 0.69 | 3.15E-03 | 0.70 | 1.35E-02 | 0.68 | 5.09E-03 | ||
| Phvul.003G223624 | K09286—EREBP-like factor (EREBP) | 0.33 | 3.16E-01 | 0.73 | 9.51E-04 | 0.59 | 3.47E-02 | 0.88 | 5.54E-05 | ||
| Phvul.003G223686 | PTHR31190:SF30—ETHYLENE-RESPONSIVE TRANSCRIPTION FACTOR 15 | 0.32 | 4.19E-01 | 0.81 | 1.53E-03 | 0.57 | 9.77E-02 | 0.69 | 1.12E-02 | ||
| Phvul.003G150900 | K19044—E3 ubiquitin-protein ligase XBAT32/33 (XBAT32 33) | 0.09 | 7.77E-01 | 0.36 | 4.76E-02 | 0.08 | 8.30E-01 | 0.36 | 5.50E-02 | ||
| Phvul.002G209300 | PTHR23335:SF12—CALMODULIN-BINDING TRANSCRIPTION ACTIVATOR 1 | 0.05 | 8.70E-01 | 0.26 | 9.24E-02 | 0.01 | 9.80E-01 | 0.44 | 2.91E-03 | ||
| Phvul.006G179800 | PF00847—AP2 domain (AP2) | −0.07 | 9.15E-01 | 0.64 | 3.41E-02 | 0.21 | 7.26E-01 | 0.84 | 5.53E-03 | ||
| Phvul.004G121000 | Deacetoxyvindoline 4-hydroxylase | −0.30 | 5.72E-01 | −0.77 | 2.09E-02 | −0.24 | 7.02E-01 | −0.40 | 2.64E-01 | ||
| Phvul.003G241700 | PTHR31729:SF0- ETHYLENE-RESPONSIVE TRANSCRIPTION FACTOR | −0.34 | 4.94E-01 | −0.65 | 4.84E-02 | −0.20 | 7.54E-01 | −0.63 | 6.26E-02 | ||
| Salicylic acid | |||||||||||
| Phvul.008G057600 | Caffeine synthase/Dimethylxanthine methyltransferase | 5.07 | 2.40E-05 | 2.95 | 1.04E-03 | 4.41 | 1.11E-03 | 1.77 | 7.16E-02 | ||
| Phvul.001G177700 | K10775—Phenylalanine ammonia-lyase (PAL) | 1.61 | 6.78E-03 | 2.19 | 2.35E-05 | 1.55 | 1.37E-02 | 2.45 | 3.25E-06 | ||
| Phvul.001G177800 | K10775—Phenylalanine ammonia-lyase (PAL) | 1.59 | 2.83E-02 | 2.27 | 1.72E-04 | −0.13 | 1.00E+00 | 2.28 | 2.39E-04 | ||
| Phvul.010G011700 | 5.4.4.2—Isochorismate synthase/Isochorismate synthetase | −0.02 | 9.77E-01 | −0.60 | 6.19E-02 | −0.08 | 1.00E+00 | −0.61 | 6.64E-02 | ||
| Jasmonic acid | |||||||||||
| Phvul.010G134700 | K15718—linoleate 9S-lipoxygenase (LOX1 5) | 1.70 | 1.99E-02 | 2.25 | 2.48E-04 | 1.52 | 6.13E-02 | 1.84 | 3.96E-03 | ||
| Phvul.006G016900 | no data | 1.43 | 1.85E-04 | 1.44 | 5.50E-05 | 1.18 | 5.46E-03 | 1.23 | 1.02E-03 | ||
| Phvul.001G000800 | PTHR22893//PTHR22893:SF62- NADH OXIDOREDUCTASE-RELATED | 0.98 | 1.58E-01 | 1.03 | 4.90E-02 | 0.98 | 1.91E-01 | 1.01 | 6.17E-02 | ||
| Phvul.005G156800 | K15718—linoleate 9S-lipoxygenase (LOX1 5) | 0.88 | 6.18E-01 | −2.52 | 2.72E-02 | 0.19 | 9.46E-01 | −1.01 | 4.37E-01 | ||
| Phvul.009G262900 | PTHR11771:SF38—LIPOXYGENASE 3, CHLOROPLASTIC-RELATED | 0.86 | 1.27E-01 | 1.20 | 4.91E-03 | 0.70 | 2.92E-01 | 1.04 | 2.11E-02 | ||
| Phvul.003G021000 | PTHR33077:SF7—PROTEIN TIFY 6A-RELATED | 0.70 | 6.11E-02 | 0.34 | 3.54E-01 | 0.56 | 2.06E-01 | 0.81 | 1.25E-02 | ||
| Phvul.003G111500 | Delta(4)-3-oxosteroid 5-beta-reductase | 0.55 | 9.25E-02 | 0.64 | 1.21E-02 | 0.54 | 1.28E-01 | 0.42 | 1.30E-01 | ||
| Phvul.005G156900 | K15718—linoleate 9S-lipoxygenase (LOX1 5) | 0.31 | 8.49E-01 | −1.89 | 2.13E-02 | −0.15 | 9.44E-01 | −0.86 | 3.63E-01 | ||
| Phvul.003G129200 | PTHR33077:SF13—PROTEIN TIFY 10A-RELATED | 0.19 | 8.87E-01 | 0.29 | 7.73E-01 | 0.39 | 7.54E-01 | 1.72 | 9.46E-03 | ||
| Phvul.009G225300 | PTHR33077:SF13—PROTEIN TIFY 10A-RELATED | 0.18 | 6.26E-01 | 0.62 | 5.05E-03 | 0.24 | 5.20E-01 | 0.78 | 4.37E-04 | ||
| Phvul.003G131600 | PTHR22893:SF67—12-OXOPHYTODIENOATE REDUCTASE 3 | −0.39 | 2.89E-01 | −0.58 | 2.82E-02 | −0.19 | 7.10E-01 | −0.25 | 4.15E-01 | ||
| Phvul.002G175500 | PTHR11771:SF60—LIPOXYGENASE 6, CHLOROPLASTIC | −0.47 | 3.22E-01 | −0.71 | 4.38E-02 | −0.39 | 4.76E-01 | −0.33 | 4.10E-01 | ||
| Phvul.004G072000 | PTHR31942:SF29—MLO-LIKE PROTEIN 12-RELATED | −0.60 | 9.00E-02 | −0.62 | 3.84E-02 | −0.36 | 4.23E-01 | −0.59 | 5.63E-02 | ||
| Phvul.010G032300 | PTHR11771//PTHR11771:SF59—LIPOXYGENASE | −1.26 | 4.20E-03 | −0.48 | 3.32E-01 | −0.34 | 6.23E-01 | −0.14 | 8.13E-01 | ||
| FDR | |||||||||||
| 1.00E-10 | 1.00E-08 | 0.05 | 0.00 | ||||||||
| Log2FC | |||||||||||
| −2.50 | −1.50 | −1.00 | −0.5 | 0.00 | 0.5 | 1.00 | 1.50 | 2.50 | |||
Publisher’s Note: MDPI stays neutral with regard to jurisdictional claims in published maps and institutional affiliations. |
© 2022 by the authors. Licensee MDPI, Basel, Switzerland. This article is an open access article distributed under the terms and conditions of the Creative Commons Attribution (CC BY) license (https://creativecommons.org/licenses/by/4.0/).
Share and Cite
Alvarez-Diaz, J.C.; Laugé, R.; Delannoy, E.; Huguet, S.; Paysant-Le Roux, C.; Gratias, A.; Geffroy, V. Genome-Wide Transcriptomic Analysis of the Effects of Infection with the Hemibiotrophic Fungus Colletotrichum lindemuthianum on Common Bean. Plants 2022, 11, 1995. https://doi.org/10.3390/plants11151995
Alvarez-Diaz JC, Laugé R, Delannoy E, Huguet S, Paysant-Le Roux C, Gratias A, Geffroy V. Genome-Wide Transcriptomic Analysis of the Effects of Infection with the Hemibiotrophic Fungus Colletotrichum lindemuthianum on Common Bean. Plants. 2022; 11(15):1995. https://doi.org/10.3390/plants11151995
Chicago/Turabian StyleAlvarez-Diaz, Juan C., Richard Laugé, Etienne Delannoy, Stéphanie Huguet, Christine Paysant-Le Roux, Ariane Gratias, and Valérie Geffroy. 2022. "Genome-Wide Transcriptomic Analysis of the Effects of Infection with the Hemibiotrophic Fungus Colletotrichum lindemuthianum on Common Bean" Plants 11, no. 15: 1995. https://doi.org/10.3390/plants11151995
APA StyleAlvarez-Diaz, J. C., Laugé, R., Delannoy, E., Huguet, S., Paysant-Le Roux, C., Gratias, A., & Geffroy, V. (2022). Genome-Wide Transcriptomic Analysis of the Effects of Infection with the Hemibiotrophic Fungus Colletotrichum lindemuthianum on Common Bean. Plants, 11(15), 1995. https://doi.org/10.3390/plants11151995