Article

Visible Foliar Injury and Ecophysiological Responses to Ozone and Drought in Oak Seedlings

1
Institute of Research on Terrestrial Ecosystems (IRET), National Research Council of Italy (CNR), Via Madonna del Piano 10, 50019 Sesto Fiorentino, Italy
2
“Marin Drăcea“ National Institute for Research and Development in Forestry, 128 Eroilor Blvd., 077190 Voluntari, Romania
3
Faculty of Silviculture and Forest Engineering, “Transilvania” University of Brasov, 1, Ludwig van Beethoven Str., 500123 Braşov, Romania
4
Department of Agriculture, Food, Environmental and Forestry Sciences, Section Woody Plants, University of Florence, 50019 Sesto Fiorentino, Italy
*
Author to whom correspondence should be addressed.
Plants 2022, 11(14), 1836; https://doi.org/10.3390/plants11141836
Submission received: 22 May 2022 / Revised: 8 July 2022 / Accepted: 11 July 2022 / Published: 13 July 2022

Abstract

:
To verify the responses of visible foliar injury (VFI), we exposed seedlings of three oak species for 4.5 months in an open air facility, using differing ozone (O3) and drought treatments: O3 (three levels from ambient to ×1.4 ambient), and drought (three levels of irrigation from 40% to 100% field capacity). We related the accumulated phytotoxic O3 dose (POD1) and cumulative drought index (CDI) to the O3 and drought VFI and assessed growth increment (height, diameter, leaf number), biomass (of all organs), and physiological parameters: net photosynthesis per plant (Pn), photosynthetic nitrogen (PNUE) and phosphorus use efficiency (PPUE)). The results indicated that an increase in POD1 promoted O3 VFI in Quercus robur and Quercus pubescens, while Quercus ilex was asymptomatic. The POD1-based critical level at the onset of O3 VFI was lower for Q. robur than for Q. pubescens (12.2 vs. 15.6 mmol m−2 POD1). Interestingly, drought reduced O3 VFI in Q. robur but increased it in Q. pubescens. Both O3 and drought were detrimental to the plant biomass. However, Q. robur and Q. pubescens invested more in shoots than in roots, while Q. ilex invested more in roots, which might be related to a hormetic mechanism. Pn, PNUE and PPUE decreased in all species under drought, and only in the sensitive Q. robur (PPUE) and Q. pubescens (PNUE) under O3. This study confirms that POD1 is a good indicator to explain the development of O3 VFI and helps a differential diagnosis of co-occurring drought and O3 VFI in oak forests.

Graphical Abstract

1. Introduction

Tropospheric ozone (O3) is an oxidative pollutant harmful to plants [1]. Ozone enters the leaves through the stomata, reacts in the mesophyll, and triggers the formation of reactive oxidative species (ROS) with a cascade of events eventually promoting cell death and, finally, the appearance of visible foliar injury (VFI), physiological impairment, and growth reduction [2,3,4]. Furthermore, O3 inhibits the efficient use of nutrients such as nitrogen (N) and phosphorus (P) and thereby causes a reduction of photosynthetic N and P use efficiency (PNUE and PPUE, respectively) [5,6]. Therefore, critical levels (CL) have been investigated to assess the O3 negative impacts on several plant species, especially those related to biomass loss [7,8]. CLs are based on cumulative O3 indexes, e.g., AOT40, defined as the accumulated exposure over 40 ppb hourly concentrations, and PODy, defined as the phytotoxic O3 dose above an hourly threshold y of stomatal O3 uptake [9]. PODy is considered the most realistic index with a high correlation with the detrimental effects of O3 [10,11]. Ozone VFI is a forest-health indicator in forest monitoring programs [12]. The estimation of CL based on O3 VFI has been proposed as a not destructive and easily repeated observation over long-term monitoring studies [13,14].
Ozone alone can affect plant growth and development, but its effect usually occurs in combination with other factors, such as drought, which is known as the most critical environmental factor limiting plant productivity worldwide [15,16]. The adverse effects of drought are progressive and, thus, are often evaluated by the cumulative drought index (CDI), defined as the accumulated difference of soil moisture relative to field capacity [17]. Drought stress also promotes the formation of specific VFI, which can be distinguished from O3-induced foliar injury. While O3 VFI is usually indicated by interveinal, irregular-border, yellow to dark-brown stippling [18,19], drought VFI consists in gradients of leaf margin necrosis increasing in severity from the base to the top of a plant [20], with the injury co-occurring when plants are exposed to a combination of these stress factors.
Both O3 and drought can limit plant carbon fixation, and the effect of both stress factors has been reported as the cause of biomass loss for Quercus species [21,22], which are significant components of temperate forests. Previous papers from the same experiment presented here showed that the interacting factorial impacts of O3 and drought were species-specific, and the order of O3 sensitivity was Q. robur > Q. pubescens > Q. ilex from the point of view of total biomass [22] and leaf gas exchange [23,24]. Although physiological acclimations to O3 and drought are not fully elucidated, diverse adaptation strategies were observed for tolerating stress in different oak species. One of the reasons for the variability of strategies is related to gas exchange regulation depending on their water use strategy (isohydric and anisohydric) [24]. Under elevated O3 with sufficient water availability, the isohydric Q. robur limited O3 uptake by stomatal closure, while the anisohydric Q. ilex and the intermediate Q. pubescens activated tolerance mechanisms and did not actively show a closing response of stomata. In particular, Pellegrini et al. [25] found that Q. ilex had a well-regulated antioxidative defense system through phenylpropanoid pathways. However, in the combination of O3 and drought, the anisohydric Q. ilex and the intermediate Q. pubescens exhibited stomatal closure to prevent severe oxidative damage due to excess generation of ROS.
The present study aimed to characterize the VFI induced by O3, drought, and their combination and assess their related effects on biomass, biometry, and physiological parameters. The results will help a differential diagnosis of co-occurring drought and O3 VFI in oak forests. In detail, we addressed the following hypotheses: (1) the development of O3 VFI may be better explained by PODy than by AOT40, (2) the reduction in soil water availability may reduce or exacerbate the negative impacts of O3 on VFI, and (3) O3 VFI may be an indicator to explain biomass reduction or physiological damage in Mediterranean oaks. We postulated that the effects on the development of VFI are modulated by the plant species-specific sensitivity to oxidative stressors.

2. Materials and Methods

2.1. Plant Material and Experimental Setting

The experiment was conducted in an O3 Free-Air Controlled Exposure (FACE) facility at Sesto Fiorentino, Italy (43°48′59″ N, 11°12′01″ E, 55 m a.s.l.). Two-year-old plants of Q. robur L., Q. pubescens Willd., and Q. ilex L. were obtained from nurseries and transplanted into 10-L plastic pots. They were exposed to three levels of O3 (1.0, 1.2, and 1.4 times the ambient air concentration, denoted as AA, ×1.2, and ×1.4, respectively: 24-h averaged concentration, AA = 35.2 ppb, ×1.2 = 42.9 ppb, ×1.4 = 48.9 ppb) and three levels of water irrigation [100, 80, and 40% of field capacity (0.295 m3 m−3, Paoletti et al., 2017) on average, denoted as WW-treated (well-watered), MD-treated (moderate drought) and SD-treated (severe drought), respectively]. Three replicated plots were assigned to each treatment, with three plants per combination of species, drought, and O3. The experiment lasted for 4.5 months, from 1 June to 15 October.
The details of the FACE facility are described in Paoletti et al. [26], and the details of the experimental design are published in Hoshika et al. [27].

2.2. Evaluation of O3 and Drought Visible Foliar Injury

Two well-trained observers evaluated the presence of O3 and drought VFI during the experimental period for all plants for a total of 6 evaluation dates (Table 1). We applied photo guides to verify whether O3 and/or drought VFI was present [28,29,30]. VFI incidence (INC = number of injured plants/total number of plants × 100) was calculated according to Chappelka et al. [31]. POD1-based CLs and CDI-based CLs were calculated for the corresponding day when O3 and drought VFI onset was observed.

2.3. Measure of Growth Parameters

The assessment of total annual biomass production during the experiment was performed based on dry weight per plant (DW) as described in Hoshika et al. [22], additionally discriminating the below-(roots) and above-ground biomass (stem and leaves) to calculate the ratio of root to shoot biomass (Ratio R/S). Furthermore, the total number of leaves, plant height increment (measured with a metric tape) and stem caliber increment (measured just above soil level) were expressed as the absolute values relative to the values at the beginning and end of the experiment.

2.4. Assessment of Photosynthetic Parameters

The net photosynthetic rate (Pn) was previously reported for mid-summer (July: [24]) and early and late summer and autumn (June, August, and October: [23]). Here, these published data of Pn were re-analyzed to address the cumulative effects of O3 and drought on the photosynthetic activity. The target leaves were fully sun-exposed leaves (4–6th from the shoot tip) of the plant main shoot (one representative leaf per plant, 1 to 3 plants per replicated plot per each O3 and W treatment). Measurements were made under light-saturated conditions (1500 μmol m−2 s−1 PPFD [photosynthetic photon flux density]) with constant CO2 concentration (400 μmol mol−1), relative humidity (40 to 50%), and leaf temperature (25 °C) using a commercial gas exchange system (CIRAS-2 PP Systems, Herts, UK). Measurements were carried out in two campaigns (8–10 June and 27 September–6 October) for all O3 treatments and an additional campaign (6–9 August) for two O3 levels (1.2, and ×1.4) on days with clear sky between 9:00 and 12:00 a.m. CET. The other detailed specifications for the photosynthetic measurements were described in our previous studies [23,24].
After the measurement of Pn in August and October, leaves were collected to examine the nitrogen (N) content. Nitrogen content per unit mass (Nmass) was determined by the dry combustion method using a LECO TruSpec C/N analyzer (Leco Corporation, St. Joseph, MI, USA). In October, the foliar phosphorus (P) content was also determined. Phosphorus content per unit mass (Pmass) was examined by an inductively coupled plasma-optical emission spectroscopy (ICP-OES) (iCAP7000, Thermo Fisher Scientific, Waltham, MA, USA). We calculated photosynthetic N use efficiency (PNUE) as the product of Nmass and mass-based net photosynthetic rate and photosynthetic P use efficiency (PPUE) as the product of Pmass and mass-based net photosynthetic rate.

2.5. Calculation of Accumulated Drought and Ozone Indexes

The accumulated drought index (CDI) was calculated from the beginning of the experimental period to the date of observation as follows:
CDI = S m F c
where, Sm is soil moisture, and Fc is field capacity (0.295 m3 m−3) [26]; drought stress is considered severe when Sm values are lower than Fc.
AOT40 and POD1 for each O3 and drought treatment were calculated following the parameters applied by Hoshika et al. [22] according to the methodology designed by CLRTAP (Convention on Long-range Transboundary Air Pollution) [9].

2.6. Statistical Analysis

Multiple Linear Regression (MLR) analysis was used to estimate the relationship between the O3 indexes (AOT40 and POD1) and CDI versus growth (height, diameter, and N. leaves), biomass (Leaf, Shoot, Root, Total, and R/S), VFI (O3 and Drought) and physiological parameters (Pn, PNUE, and PPUE). Two models were compared, i.e., Model 1 (POD1 and CDI as predictor variables) and Model 2 (AOT40 and CDI as predictor variables). The statistical analyses were performed using the R software (R version 4.1.2 [32]), considering a significance of p < 0.05. Principal component analysis (PCA) was conducted by using OriginPro 2021b software. The PCA was applied considering VFI (O3 and drought), growth (Height, Diameter, and N. of leaves), biomass (Leaf, Shoot, Root; Total and R/S), and physiological (Pn, PNUE, and PPUE) parameters in order to distinguish the groups of parameters better related to each symptomatic species; in this analysis, the asymptomatic Q. ilex species was not included.

3. Results

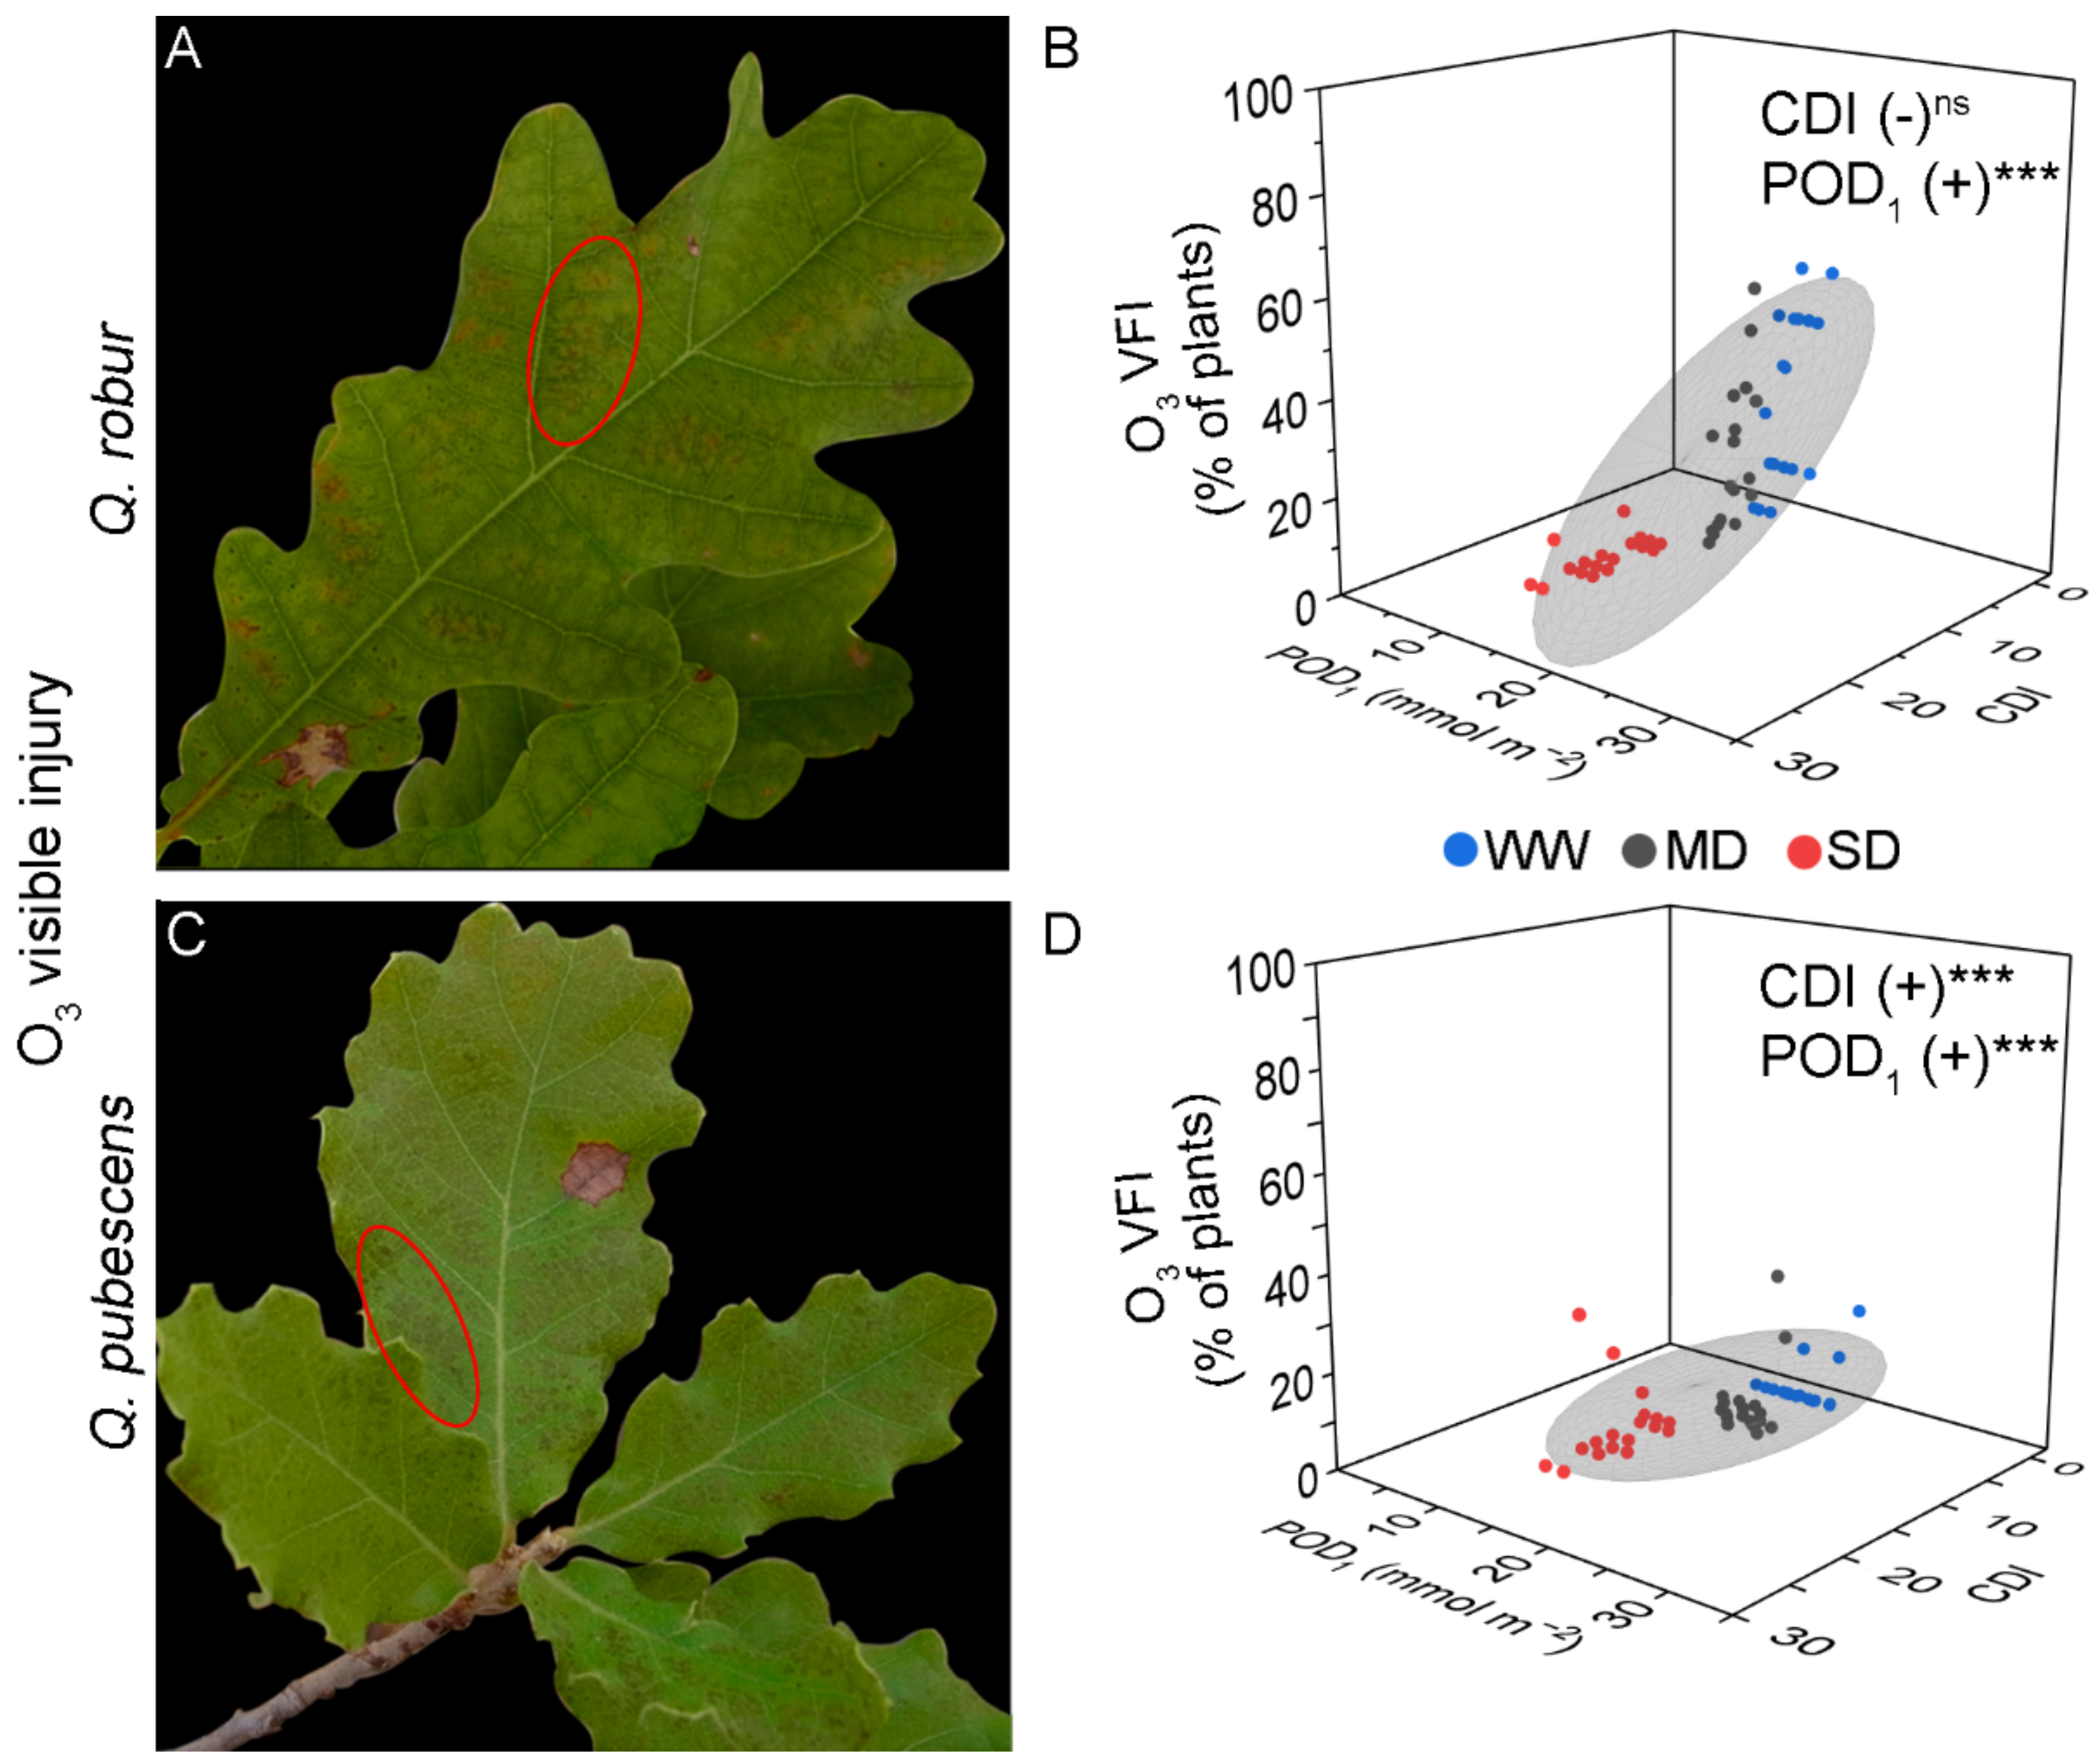
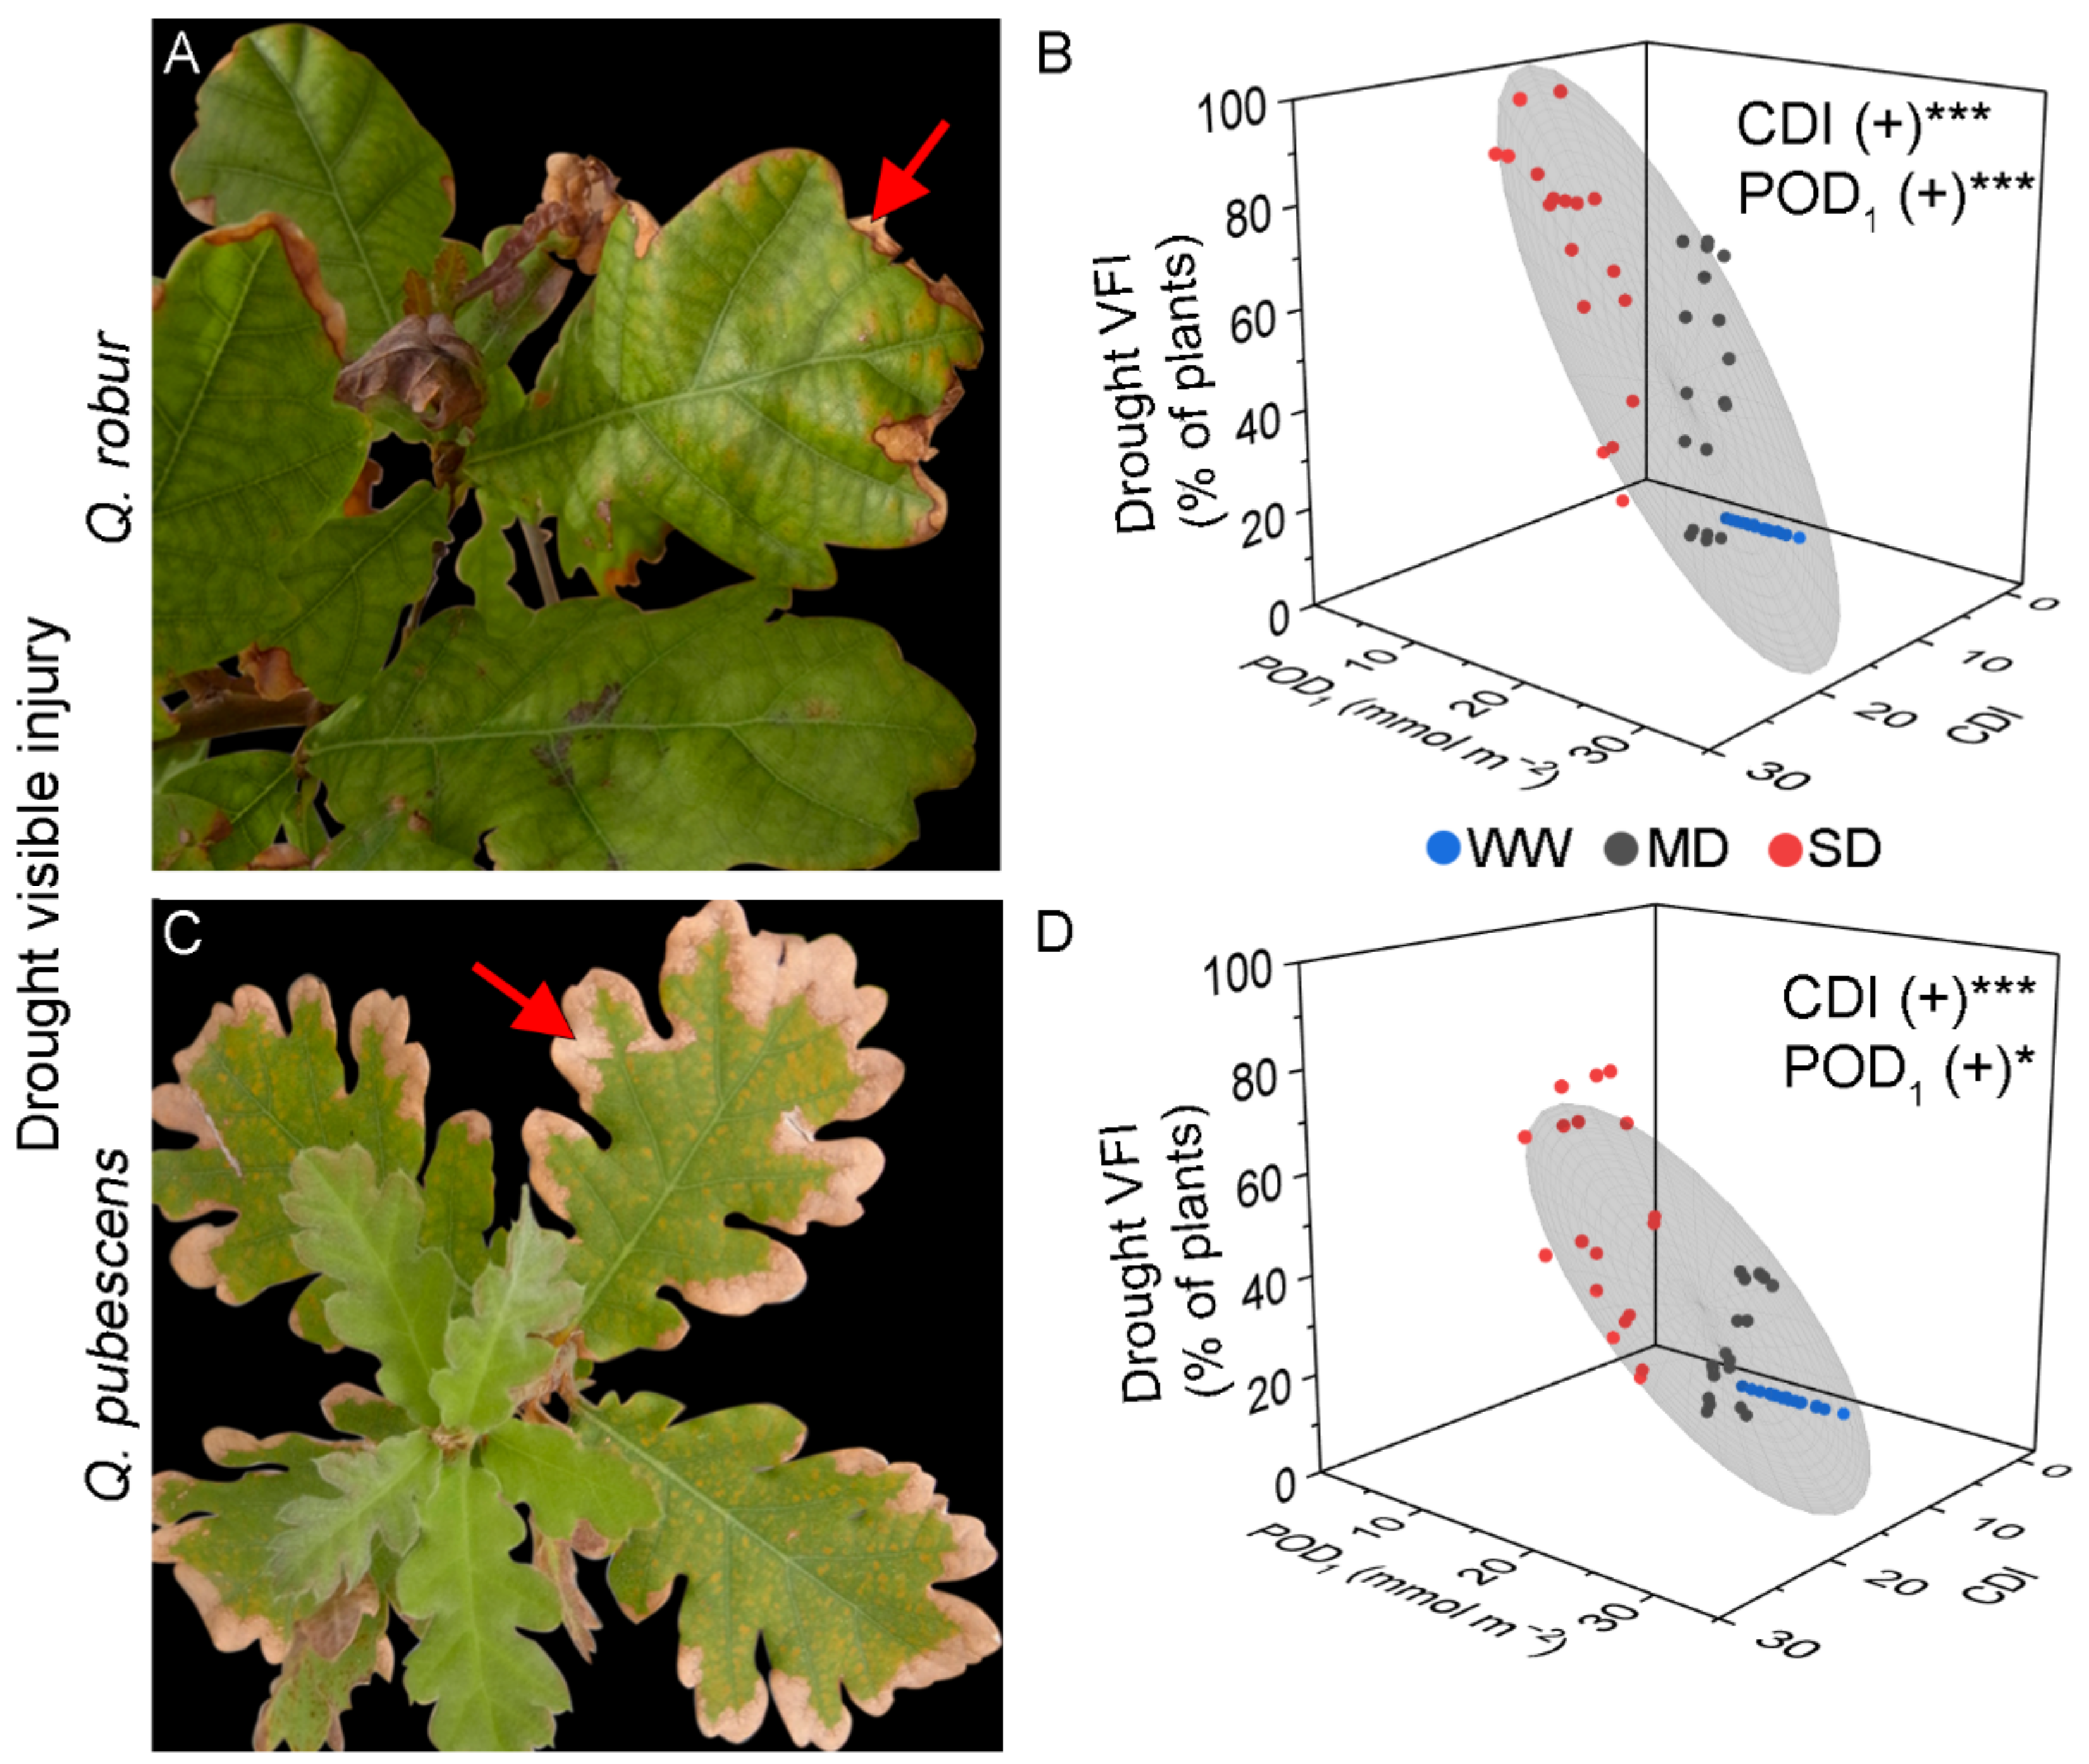
3.1. Visible Foliar Injury

The O3 VFI in Q. robur was characterized by small homogeneously distributed dots between the primary leaf veins (Figure 1A). Q. robur plants from all water regimes but SD (AA and ×1.2) presented O3 VFI (Table 1 and Table 2). In fact, 11% of the SD-treated plants developed O3 VFI at the end of the experiment, relative to 56% of the WW-treated plants (Table 2).
There were individual-specific differences on the day of VFI onset. The POD1 values calculated for the O3 VFI onset in Q. robur were similar across O3 treatments (approximately 10.7 to 13.0 mmol m−2 POD1, average = 12.1 mmol m−2 POD1), while the AOT40 values corresponding to the O3 VFI onset increased from 15-16 ppm h to 26.2 ppm h; for SD-treated plants, the O3 VFI onset occurred only in ×1.4 (10.7 ppm h, Table 1). In addition, the MLR revealed a positive regression of O3 VFI with POD1 or AOT40 and a negative regression with CDI when tested with AOT40 (Model 2), but the effect was not significant when tested with POD1 (Model 1) (Figure 1B; Table 3).
The O3 VFI in Q. pubescens was similar to that developed by Q. robur (Figure 1C). Independently of the water regime, plants from AA did not show O3 VFI, while plants from ×1.2 and ×1.4 treatments presented O3 VFI (Table 1 and Table 2). The percentage of plants presenting VFI was lower than for Q. robur, with a maximum of 33% presenting VFI (Table 2). VFI occurred for the first time at DOY 247 or 266, i.e., around the end of the experiment. The POD1 and AOT40 values for the O3 VFI onset were 12.8–20.46 mmol m−2 POD1 (average = 16.8 mmol m−2 POD1) and 24–33 ppm h AOT40, respectively (Table 1). The MLR revealed a positive regression with the O3 indexes (POD1 and AOT40; Figure 1D, Table 3). Interestingly, CDI positively affected the O3 VFI when tested with POD1 (Model 1), but the effect was not significant when tested with AOT40 (Model 2) (Table 3).
The drought VFI of Q. robur was evident exclusively on the leaf edge that became dry and brownish (Figure 2A). The VFI progressively increased in MD- and SD-treated plants until the end of the experimental period, while WW-treated plants did not show any injury (Table 2). At the end of the experiment, 89–100% of the SD-treated plants showed drought VFI, relative to 63–67% of the MD-treated plants (Table 2). The CDI calculated at the drought VFI onset was the same for all SD-treated plants (CDI = 10.20 for all AA, ×1.2, ×1.4 treatments, Table 1) and similar for MD-treated plants (CDI= 4.96 to 6.10, Table 1). The MLR revealed a strong positive regression between the Q. robur drought VFI and CDI, although POD1 or AOT40 also increased the extent of drought VFI (Figure 2B, Table 3).
The drought VFI of Q. pubescens was similar to that developed by Q. robur (Figure 2C). At the end of the experimental period, Q. pubescens presented 44–78% of the SD-treated plants with VFI, 11–33% of the MD-treated plants, and no VFI for the WW-treated plants. As found in Q. robur, the CDI calculated at the drought VFI onset was the same for all SD-treated plants (CDI = 10.20 for all AA, ×1.2, ×1.4 treatments) and similar for MD-treated plants (CDI= 4.04 to 6.52, Table 1). Interestingly, the CDI values at drought VFI onset were similar in Q. robur and Q. pubescens within the same O3 and drought treatments (Table 1). In addition, the MLR revealed a positive regression with CDI, POD1, and AOT40 (Table 3, Figure 2D). The evergreen Q. ilex did not present O3 or drought VFI.

3.2. Physiological Responses

In both Q. robur and Q. pubescens, Pn was negatively affected by POD1 and CDI (Table 3, Figure S1B and D), but it unexpectedly increased with increasing AOT40 (Table 3). Furthermore, PNUE and PPUE were negatively related to CDI and POD1 except for PNUE in Q. robur (Table 3).
For Q. ilex, the MLR revealed that CDI negatively affected Pn (Figure S1F), PNUE, and PPUE, with no significant relationship with the O3 indexes (POD1 and AOT40, Table 3).

3.3. Growth and Biomass

The MLR indicated that height increment was positively affected by POD1 or AOT40 in Q. robur, while increments of diameter and number of leaves were negatively affected by CDI (Table 3). As confirmed by negative regression coefficients with CDI, most biomass parameters of Q. robur were reduced by drought. On the other hand, POD1 or AOT40 positively affected leaf biomass and negatively affected root biomass, indicating a reduction of the R/S ratio under elevated O3 exposure (Table 3, Figure S1A).
In Q. pubescens, the O3 indexes (POD1 and AOT40) were positively related to plant height increment, while CDI was negatively related to height only when tested with AOT40 (Table 3). Increments in shoot diameter and number of leaves in this species were negatively related to POD1 and AOT40, while they were negatively related to CDI when tested with POD1 (Model 1, Table 3). Regarding the biomass parameters, leaf biomass was not affected by any factor, while shoot biomass was negatively affected by both O3 indexes (POD1 and AOT40) and CDI (Table 3). Root and total biomass were negatively related to CDI, and the R/S ratio was negatively influenced by CDI and POD1 (Table 3, Figure S1C).
In Q. ilex, plant height increment was not affected by any factors, while a positive relationship between diameter increments and O3 indexes was found (Table 3). The increment in the number of leaves was positively affected by POD1 and AOT40 and positively affected by CDI when tested together with POD1 (Table 3), although leaf and total biomass were not significantly affected by those factors. Shoot biomass was negatively affected by CDI only when tested with AOT40, and root biomass was positively affected only by POD1 (Table 1). The R/S ratio was positively related only to POD1 (Table 3, Figure S1E).
The raw data off all growth parameters for the species Q. robur, Q. pubescens, and Q. ilex are avaible in Table S1.

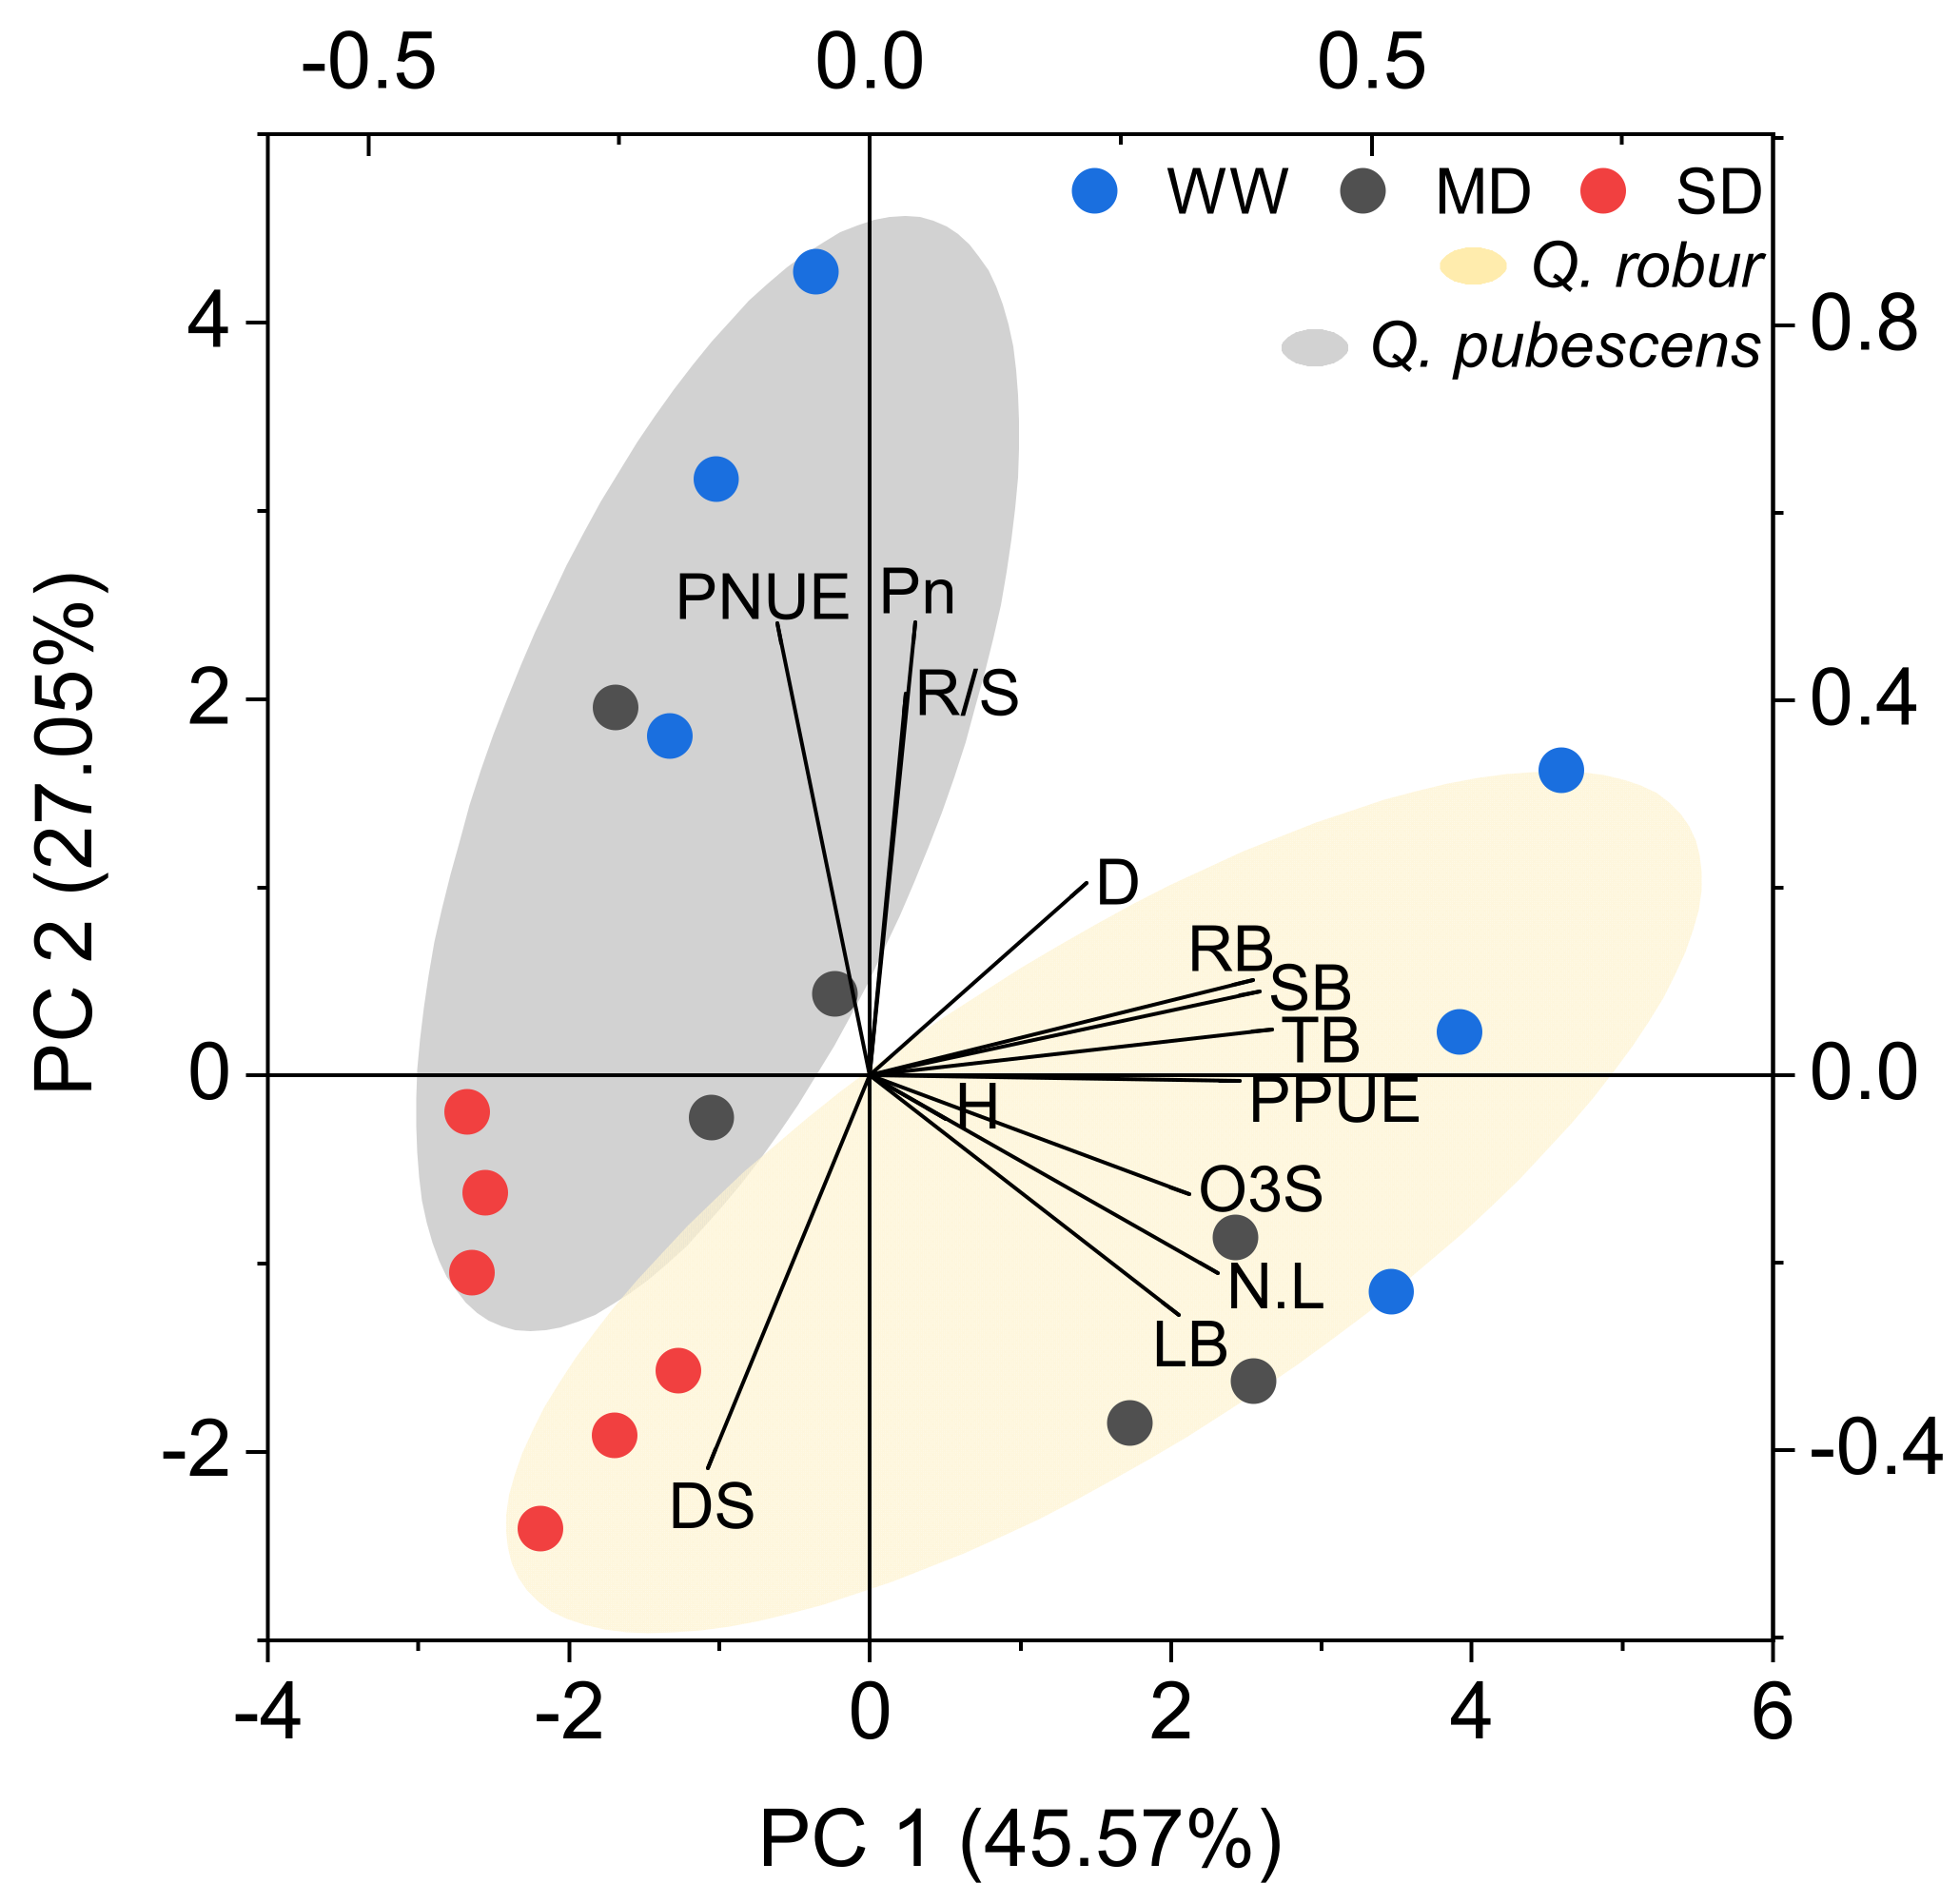
3.4. Principal Component Analysis

The PCA detected separate multivariate spaces between the two symptomatic species as groups related to different growth, biomass, and physiological parameters related to O3 or drought VFI (Figure 3).
Since Q. ilex did not show VFI, this species was not included in the analysis. The first two components of the PCA explained 45.57 and 27.05% of the variances. The SD-treated plants of both species were grouped near the drought VFI (DS) with no other parameter following the same vector direction. The individuals of Q. robur (especially MD-treated plants) were grouped near the vectors of the growth parameters number of leaves and height, leaf biomass, and O3 VFI, which presented the same direction, thus indicating that when O3 VFI increased, these parameters also increased. The individuals of Q. pubescens (specially WW-treated plants) were grouped near Pn, PNUE, and R/S, with the vectors in the opposite direction of O3 and drought VFI, thus indicating that when O3 and drought VFI increased, these parameters decreased.

4. Discussion

4.1. Development of Visible Injury Due to Ozone and Drought Stress

The POD1 values corresponding to the onset of O3 VFI for the two symptomatic deciduous oaks (on average, 14.4 mmol m−2) were similar to those estimated for broadleaf species under field conditions in Italy and France (10 mmol m−2 s−1) [10]. However, the CL for the VFI onset was lower for Q. robur than for Q. pubescens, indicating its higher sensitivity to O3, possibly related to its lower antioxidative capacity and inability to protect the cell structure [25]. Furthermore, O3 VFI increased with increasing POD1 in the two deciduous oaks. This suggests that PODy is a key indicator to describe the development of O3 VFI [33] once it is well known that O3 damage is closely related to stomatal O3 uptake [1]. In fact, the absence of O3 VFI in Q. ilex might be related to its low gmax (165 mmol O3 m−2 s−1, compared to 225 mmol O3 m−2 s−1 and 200 mmol O3 m−2 s−1 of Q. pubescens and Q. robur, respectively, [22] suggesting that the development of VFI might be discussed in terms of the specific-species patterns of stomatal conductance.
For both injured species (Q. robur and Q. pubescens) at the end of the experimental period, the severe drought treatment reduced POD1 by 30 to 40% [22], which would be expected to decrease the O3-induced VFI in plants as reported before for ecophysiological responses in poplars [34]. In Q. robur, the presence of O3 VFI was decreased under drought. On the contrary, drought stress aggravated the O3 VFI in Q. pubescens. Drought has been reported to have the potential to aggravate the harmful effects of O3 [35]. Furthermore, Hoshika et al. [24] found that the combination of O3 and drought altered the activity of the antioxidant system so that Q. pubescens was not protected from the severe oxidative stress resulting from the combined stress of O3 and drought.
For the symptomatic species (Q. robur and Q. pubescens), the progression of drought VFI could be attributed to the obstruction of conducting tissue [20], conferring to both species a high sensitivity. In the asymptomatic Q. ilex, this phenomenon might not happen due to its capacity to increase the cell wall thickness by reinforcing the strength and rigidity of the secondary cell walls with hemicellulose and lignin deposition (data not published). Changes in lignin might function as physical desiccation tolerance and maintenance of protein integrity in drought-tolerant species [36], thus helping the photosynthetic recovery activity after re-watering from severe drought episodes [37]. The CDI threshold for the appearance of drought VFI in the two symptomatic species was higher in SD-treated than MD-treated plants, possibly due to the interaction with leaf aging, which is an important physiological and biochemical defense factor against drought stress [38]. In fact, most plants showed drought VFI in mid- or late-summer in both SD-treated and MD-treated plants when leaves were relatively old.

4.2. Effects of Ozone and Drought Stress on Growth and Biomass Parameters

For both deciduous species (Q. robur and Q. pubescens), height increment was higher when exposed to O3 treatment. This phenomenon was verified in other species, such as Populus sp. [39], and it is possibly related to promoting a new leaf development as a compensative response against O3 damage. However, the decrease in the number of leaves was eventually found to be due to O3 exposure, which might be related to the potential O3 phytotoxicity that triggers programmed cell death, promoting an increase in leaf senescence [40]. When combined with drought stress, the effect can be more substantial once the lack of water and nutrients promotes a decrease in new leaf development.
Both O3 and drought stresses were detrimental to the plant biomass increment in all the oak species. In fact, the reduction of biomass due to drought stress is reported for many species and is related to the reduction of water content, diminished leaf water potential and turgor loss, promotion of stomatal closure, and decreased cell enlargement growth [41,42]. As previously revealed by Alonso et al. [21], drought stress does not protect holm oak from O3 effects when considering the whole plant response. However, differences between the species responses must be considered when comparing the species sensitivity. For example, we observed that Q. robur and Q. pubescens invested more in shoots than in roots when exposed to both stresses, while Q. ilex performed the opposite, which might be another strategy of Q. ilex indicating a hormetic mechanism of tolerance for increasing conducting tissue and maintaining the water flow. These tolerance mechanisms may be associated with morphological/anatomical adjustments, such as a versatile root system, conservative growth and carbon allocation patterns, and diverse adaptations in the leaf morphology [20,43]. This might increase the apoplastic water fraction [44] and promote the species tolerance to O3 and drought stress.

4.3. Effects of Ozone and Drought Stress on Physiological Parameters

The O3 and drought stress negatively affected the physiological parameters. Drought stress induced a decrease of Pn regardless of the different species, as confirmed by a negative relationship with CDI. A decrease in Pn with increasing POD1 was verified for both sensitive species (Q. robur and Q. pubescens), while no such reduction was found in Q. ilex. The present discussion is based on the species responses to POD1 once the flux-based index is more realistic [9]. In fact, AOT40 was positively related to Pn in the two deciduous oaks, which does not agree with a consensus about O3 negatively affecting photosynthetic capacity [45]. In fact, the regression coefficient was very low (=0.000), although the regression slope was numerically significant. Even though data was generated from an underlying distribution, the significance is a rather unlikely biological sense. The data suggest that a biological-sound index such as POD1 is superior to AOT40 for the studies of the O3 effects on vegetations because it can consider the principal physiological cause of O3 damage, i.e., stomatal O3 uptake.
Drought stress decreased PNUE and PPUE for all three species, while O3 stress negatively affected PNUE for Q. pubescens and PPUE for the sensitive species Q. robur and Q. pubescens. Drought stress is directly related to changes in the allocation of N and P to leaves, no matter the species sensitivity to O3 stress. However, a reduced allocation of N and P to the photosynthetic apparatus [5,6,46] is more pronounced in O3 sensitive species. The N-uptake efficiency and leaf N efficiency are important traits to improve growth under drought [47]; thus, the decline in root biomass might explain the decrease in PNUE and PPUE for those species, once reduced quantity of absorptive roots reduces water and nutrient uptake as verified for the same oak species in a previous study [48].

4.4. Is the Ozone Visible Injury an Indicator to Explain Biomass Reduction or Physiological Damage in Mediterranean Oaks?

The PCA biplot contains the strength of VFI, physiology, and growth relationships, along with the species-specific sensitivity to drought and O3 stress. Relationships between O3 VFI and biomass growth were discussed by other authors [49,50]. In the present study, we observed that the vector of O3 VFI injury (O3S) and total biomass (TB) were crossing at the right angle of each other, suggesting a weak association between these two parameters in Mediterranean oaks. However, the O3S vector shows the same direction as those of leaf parameters (number of leaves [N.L] and leaf biomass [LB]) in plants presenting more O3 VFI, which may indicate the promotion of carbon allocation to leaves as a compensation response against O3 injury. In addition, opposite directions of the vectors were found for O3 VFI (O3S) and net photosynthesis (Pn), PNUE, and the R/S ratio, highlighting a negative correlation between O3 VFI and these parameters. The results indicate that O3 VFI was not a direct indicator of biomass reduction under elevated O3 in these oaks but provides important insights regarding the impairment of photosynthetic capacity and biomass partitioning to roots. Mediterranean oak species generally develop taproots that grow deep into the soil, enhancing resistance to abiotic stress such as drought [51]. However, small amounts of roots due to O3 exposure imply a loss of water and nutrient uptake, suggesting that O3 VFI should be considered a bioindicator in forests exposed to the combination of O3 pollution and drought.

5. Conclusions

We examined O3- and drought-induced VFI and their effects on growth, biomass, and physiological parameters by using cumulative indexes and oak species known for showing differential sensitivity to these stressors. The increase in POD1 promoted the development of specific O3 VFI in the isohydric Q. robur and the intermediate Q. pubescens, while the anisohydric Q. ilex was asymptomatic. In Q. robur, the presence of O3 VFI was decreased under drought probably because drought-induced stomatal closure reduced O3 uptake and thus limited O3 damage. However, drought stress aggravated O3 VFI in Q. pubescens. This result indicates the importance of the protective role of antioxidant activity under the combination of O3 and drought, which may be weakened by the combined stress factors and become a dominant factor in species that are not strictly isohydric. On the other hand, the drought VFI was clearly distinguished from the O3-induced VFI, and it developed with increasing CDI in Q. robur and Q. pubescens but not in Q. ilex, suggesting a high tolerance of Q. ilex to drought stress. Therefore, we suggest using the specific O3 or drought VFI as a bioindicator, especially for establishing the onset injury CL.
We also confirmed that Pn was decreased progressively with POD1 and CDI in the two deciduous oaks, in tandem with PNUE decline, suggesting a cumulative effect of O3 and drought on photosynthetic capacity. As a result, both stress factors showed a deleterious effect on the development of VFI and biomass growth. Interestingly, the two deciduous oaks increased the allocation to shoot growth rather than to root growth when exposed to both stresses, while an opposite result was found in Q. ilex. The imbalance in carbon allocation to roots may reduce the stability against strong winds and impair water uptake under the warming climate expected in future climate change [52,53].

Supplementary Materials

The following supporting information can be downloaded at: https://www.mdpi.com/article/10.3390/plants11141836/s1, Figure S1: Results of the multiple linear regression for shoot/root (Ratio R/S) and Photosynthesis (Pn) parameters; Table S1: Raw data of growth parameters.

Author Contributions

Conceptualization, E.P. and Y.H.; methodology, E.P., Y.H. and B.B.M.; formal analysis, Y.H. and B.B.M.; investigation, E.P., Y.H.; resources, E.P, F.F. and O.B.; data curation, Y.H. and B.B.M.; writing—original draft preparation, Y.H. and B.B.M.; writing—review and editing, E.P, O.B., F.F. and Y.H.; visualization, B.B.M.; supervision, E.P., O.B. and F.F.; project administration, E.P. and Y.H.; funding acquisition, E.P. All authors have read and agreed to the published version of the manuscript.

Funding

This research was funded by Fondazione Cassa di Risparmio di Firenze (2013/7956), the LIFE15 ENV/IT/000183 project MOTTLES and the APC was funded by LIFE: MODERN(NEC) (LIFE20 GIE_IT_000091).

Data Availability Statement

The data presented in this study are available on request from the corresponding author. The data are not publicly available due to technical limitations and other restrictions.

Acknowledgments

We want to thank Alessandro Materassi and Gianni Fasano for designing and maintaining the ozone FACE; Moreno Lazzara for support during fieldwork; Cristina Mascalchi for administrative and logistic support; Marcello Vitale for providing the Q. ilex seedlings; Giulia Carriero for help during the biomass assessment; the Fondazione Cassa di Risparmio di Firenze (2013/7956) for supporting the ozone FACE installation; and the NEC Italy and MODERN(NEC) (LIFE20 GIE_IT_000091) projects coordinated by CUFAA for supporting the ozone FACE maintenance.

Conflicts of Interest

The authors declare no conflict of interest.

References

  1. Mills, G.; Pleijel, H.; Malley, C.S.; Sinha, B.; Cooper, O.R.; Schultz, M.G.; Neufeld, H.S.; Simpson, D.; Sharps, K.; Feng, Z.; et al. Tropospheric Ozone Assessment Report: Present-Day Tropospheric Ozone Distribution and Trends Relevant to Vegetation. Elementa 2018, 6, 47. [Google Scholar] [CrossRef]
  2. Paoletti, E. Ozone Impacts on Forests. CAB Rev. Perspect. Agric. Vet. Sci. Nutr. Nat. Resour. 2007, 2, 13. [Google Scholar] [CrossRef]
  3. Dusart, N.; Gandin, A.; Vaultier, M.N.; Joffe, R.; Cabané, M.; Dizengremel, P.; Jolivet, Y. Importance of Detoxification Processes in Ozone Risk Assessment: Need to Integrate the Cellular Compartmentation of Antioxidants? Front. For. Glob. Chang. 2019, 2, 45. [Google Scholar] [CrossRef] [Green Version]
  4. Grulke, N.E.; Heath, R.L. Ozone Effects on Plants in Natural Ecosystems. Plant Biol. 2020, 22, 12–37. [Google Scholar] [CrossRef] [PubMed]
  5. Watanabe, M.; Hoshika, Y.; Inada, N.; Wang, X.; Mao, Q.; Koike, T. Photosynthetic Traits of Siebold’s Beech and Oak Saplings Grown under Free Air Ozone Exposure in Northern Japan. Environ. Pollut. 2013, 174, 50–56. [Google Scholar] [CrossRef] [PubMed] [Green Version]
  6. Hoshika, Y.; Brilli, F.; Baraldi, R.; Fares, S.; Carrari, E.; Zhang, L.; Badea, O.; Paoletti, E. Ozone Impairs the Response of Isoprene Emission to Foliar Nitrogen and Phosphorus in Poplar. Environ. Pollut. 2020, 267, 115679. [Google Scholar] [CrossRef]
  7. Büker, P.; Feng, Z.; Uddling, J.; Briolat, A.; Alonso, R.; Braun, S.; Elvira, S.; Gerosa, G.; Karlsson, P.E.; Le Thiec, D.; et al. New Fl Ux Based Dose e Response Relationships for Ozone for European Forest Tree Species. Environ. Pollut. 2015, 206, 163–174. [Google Scholar] [CrossRef]
  8. Hoshika, Y.; Paoletti, E.; Agathokleous, E.; Sugai, T.; Koike, T. Developing Ozone Risk Assessment for Larch Species. Front. For. Glob. Chang. 2020, 3, 45. [Google Scholar] [CrossRef]
  9. CLRTAP. Mapping Critical Levels for Vegetation, Chapter III. Manual on Methodologies and Criteria for Modelling and Mapping Critical Loads and Levels and Air Pollution Effects, Risks and Trends. In UNECE Convention on Long-Range Transboundary Air Pollution; UNECE: Geneva, Switzerland, 2017. [Google Scholar]
  10. Sicard, P.; De Marco, A.; Carrari, E.; Dalstein-Richier, L.; Hoshika, Y.; Badea, O.; Pitar, D.; Fares, S.; Conte, A.; Popa, I.; et al. Epidemiological Derivation of Flux-Based Critical Levels for Visible Ozone Injury in European Forests. J. For. Res. 2020, 31, 1509–1519. [Google Scholar] [CrossRef]
  11. Bagard, M.; Jolivet, Y.; Hasenfratz-Sauder, M.-P.; Gérard, J.; Dizengremel, P.; Le Thiec, D. Ozone Exposure and Flux-Based Response Functions for Photosynthetic Traits in Wheat, Maize and Poplar. Environ. Pollut. 2015, 206, 411–420. [Google Scholar] [CrossRef]
  12. Schaub, M.; Calatayud, V.; Ferretti, M.; Brunialti, G.; Lövblad, G.; Krause, G.; Sanz, M.J. Part VIII: Monitoring of Ozone Injury. In Manual on Methods and Criteria for Harmonized Sampling, Assessment, Monitoring and Analysis of the Effects of Air Pollution on Forests; UNECE ICP Forests Programme Coordinating Centre, Ed.; Thünen Institute of Forest Ecosystems: Eberswalde, Germany, 2016; p. 14. [Google Scholar]
  13. Sicard, P.; De Marco, A.; Dalstein-Richier, L.; Tagliaferro, F.; Renou, C.; Paoletti, E. An Epidemiological Assessment of Stomatal Ozone Flux-Based Critical Levels for Visible Ozone Injury in Southern European Forests. Sci. Total Environ. 2016, 541, 729–741. [Google Scholar] [CrossRef]
  14. Sicard, P.; Hoshika, Y.; Carrari, E.; De Marco, A.; Paoletti, E. Testing Visible Ozone Injury within a Light Exposed Sampling Site as a Proxy for Ozone Risk Assessment for European Forests. J. For. Res. 2021, 32, 1351–1359. [Google Scholar] [CrossRef]
  15. Hanjra, M.A.; Qureshi, M.E. Global Water Crisis and Future Food Security in an Era of Climate Change. Food Policy 2010, 35, 365–377. [Google Scholar] [CrossRef]
  16. Xu, C.; McDowell, N.G.; Fisher, R.A.; Wei, L.; Sevanto, S.; Christoffersen, B.O.; Weng, E.; Middleton, R.S. Increasing Impacts of Extreme Droughts on Vegetation Productivity under Climate Change. Nat. Clim. Chang. 2019, 9, 948–953. [Google Scholar] [CrossRef] [Green Version]
  17. Peters, M.P.; Iverson, L.R.; Matthews, S.N. Spatio-Temporal Drought Trends by Forest Type in the Conterminous United States, 1960–2013; US Department of Agriculture, Forest Service, Northern Research Station: Madison, WI, USA, 2014.
  18. Vollenweider, P.; Ottiger, M.; Günthardt-Goerg, M.S. Validation of Leaf Ozone Symptoms in Natural Vegetation Using Microscopical Methods. Environ. Pollut. 2003, 124, 101–118. [Google Scholar] [CrossRef]
  19. Moura, B.B.; Alves, E.S.; Marabesi, M.A.; de Souza, S.R.; Schaub, M.; Vollenweider, P. Ozone Affects Leaf Physiology and Causes Injury to Foliage of Native Tree Species from the Tropical Atlantic Forest of Southern Brazil. Sci. Total Environ. 2018, 610–611, 912–925. [Google Scholar] [CrossRef]
  20. Vollenweider, P.; Menard, T.; Arend, M.; Kuster, T.M.; Günthardt-Goerg, M.S. Structural Changes Associated with Drought Stress Symptoms in Foliage of Central European Oaks. Trees—Struct. Funct. 2016, 30, 883–900. [Google Scholar] [CrossRef]
  21. Alonso, R.; Elvira, S.; González-Fernández, I.; Calvete, H.; García-Gómez, H.; Bermejo, V. Drought Stress Does Not Protect Quercus Ilex L. from Ozone Effects: Results from a Comparative Study of Two Subspecies Differing in Ozone Sensitivity. Plant Biol. 2014, 16, 375–384. [Google Scholar] [CrossRef]
  22. Hoshika, Y.; Moura, B.; Paoletti, E. Ozone Risk Assessment in Three Oak Species as Affected by Soil Water Availability. Environ. Sci. Pollut. Res. 2018, 25, 8125–8136. [Google Scholar] [CrossRef]
  23. Cocozza, C.; Paoletti, E.; Mrak, T.; Zavadlav, S.; Levanič, T.; Kraigher, H.; Giovannelli, A.; Hoshika, Y. Isotopic and Water Relation Responses to Ozone and Water Stress in Seedlings of Three Oak Species with Different Adaptation Strategies. Forests 2020, 11, 864. [Google Scholar] [CrossRef]
  24. Hoshika, Y.; Fares, S.; Pellegrini, E.; Conte, A.; Paoletti, E. Water Use Strategy Affects Avoidance of Ozone Stress by Stomatal Closure in Mediterranean Trees—A Modelling Analysis. Plant Cell Environ. 2020, 43, 611–623. [Google Scholar] [CrossRef]
  25. Pellegrini, E.; Hoshika, Y.; Dusart, N.; Cotrozzi, L.; Gérard, J.; Nali, C.; Vaultier, M.N.; Jolivet, Y.; Lorenzini, G.; Paoletti, E. Antioxidative Responses of Three Oak Species under Ozone and Water Stress Conditions. Sci. Total Environ. 2019, 647, 390–399. [Google Scholar] [CrossRef] [PubMed]
  26. Paoletti, E.; Carriero, G. A New-Generation 3D Ozone FACE (Free Air Controlled Exposure). Sci. Total Environ. 2017, 575, 1407–1414. [Google Scholar] [CrossRef] [PubMed]
  27. Moura, B.B.; Hoshika, Y.; Ribeiro, R.V.; Paoletti, E. Exposure- and Flux-Based Assessment of Ozone Risk to Sugarcane Plants. Atmos. Environ. 2018, 176, 252–260. [Google Scholar] [CrossRef]
  28. Innes, J.L.; Skelly, J.M.; Schaub, M. Ozone and Broadleaved Species: A Guide to the Identification of Ozone-Induced Foliar Injury/ Ozon, Laubholz-Und Krautpflanzen: Ein Fuhrer Zum Bestimmen von Ozonsymptomen; Haupt: Bern, Switzerland, 2001. [Google Scholar]
  29. Vollenweider, P.; Gunthardtgoerg, M. Erratum to “Diagnosis of Abiotic and Biotic Stress Factors Using the Visible Symptoms in Foliage”. Environ. Pollut. 2006, 140, 562–571. [Google Scholar] [CrossRef]
  30. Günthardt-Goerg, M.S.; Kuster, T.M.; Arend, M.; Vollenweider, P. Foliage Response of Young Central European Oaks to Air Warming, Drought and Soil Type. Plant Biol. 2013, 15, 185–197. [Google Scholar] [CrossRef]
  31. Chappelka, A.; Renfro, J.; Somers, G.; Nash, B. Evaluation of Ozone Injury on Foliage of Black Cherry (Prunus Serotina) and Tall Milkweed (Asclepias Exaltata) in Great Smoky Mountains National Park. Environ. Pollut. 1997, 95, 13–18. [Google Scholar] [CrossRef]
  32. Team R Development Core. A Language and Environment for Statistical Computing. 2018. Available online: https://www.R-project.org/ (accessed on 21 May 2022).
  33. Fernandes, F.F.; Moura, B.B. Foliage Visible Injury in the Tropical Tree Species, Astronium Graveolens Is Strictly Related to Phytotoxic Ozone Dose (PODy). Environ. Sci. Pollut. Res. 2021, 28, 41726–41735. [Google Scholar] [CrossRef]
  34. Gao, F.; Catalayud, V.; Paoletti, E.; Hoshika, Y.; Feng, Z. Water Stress Mitigates the Negative Effects of Ozone on Photosynthesis and Biomass in Poplar Plants. Environ. Pollut. 2017, 230, 268–279. [Google Scholar] [CrossRef]
  35. Grulke, N.E. The Physiological Basis of Ozone Injury Assessment Attributes in Sierran Conifers. Dev. Environ. Sci. 2003, 2, 55–81. [Google Scholar] [CrossRef]
  36. Yoshimura, K. Programmed Proteome Response for Drought Avoidance / Tolerance in the Root of a C 3 Xerophyte (Wild Watermelon) Under Water Deficits. Plant Cell Physiol. 2008, 49, 226–241. [Google Scholar] [CrossRef] [Green Version]
  37. Le Gall, H.; Philippe, F.; Domon, J.M.; Gillet, F.; Pelloux, J.; Rayon, C. Cell Wall Metabolism in Response to Abiotic Stress. Plants 2015, 4, 112. [Google Scholar] [CrossRef]
  38. Pinheiro, C.; Chaves, M.M. Photosynthesis and Drought: Can We Make Metabolic Connections from Available Data? J. Exp. Bot. 2011, 62, 869–882. [Google Scholar] [CrossRef] [Green Version]
  39. Pell, E.J.; Sinn, J.P.; Johansen, C.V. Nitrogen Supply as a Limiting Factor Determining the Sensitivity of Populus Tremuloides Michx. to Ozone Stress. New Phytol. 1995, 130, 437–446. [Google Scholar] [CrossRef]
  40. Matyssek, R.; Sandermann, H. Impact of Ozone on Trees: An Ecophysiological Perspective. In Progress in Botany; Esser, K., Lüttge, U., Beyschlag, W., Hellwig, F., Eds.; Springer: Berlin/Heidelberg, Germany, 2003; ISBN 978-3-642-55819-1. [Google Scholar]
  41. Jaleel, C.A.; Manivannan, P.; Wahid, A.; Farooq, M.; Al-Juburi, H.J.; Somasundaram, R.; Panneerselvam, R. Drought Stress in Plants: A Review on Morphological Characteristics and Pigments Composition. Int. J. Agric. Biol. 2009, 11, 100–105. [Google Scholar]
  42. Chaturvedi, R.K.; Tripathi, A.; Raghubanshi, A.S.; Singh, J.S. Functional Traits Indicate a Continuum of Tree Drought Strategies across a Soil Water Availability Gradient in a Tropical Dry Forest. For. Ecol. Manag. 2021, 482, 118740. [Google Scholar] [CrossRef]
  43. Moura, B.B.; Alves, E.S. Climatic Factors Influence Leaf Structure and Thereby Affect the Ozone Sensitivity of Ipomoea Nil “Scarlet O’Hara”. Environ. Pollut. 2014, 194, 11–16. [Google Scholar] [CrossRef]
  44. Serrano, L.; Peñuelas, J. Contribution of Physiological and Morphological Adjustments to Drought Resistance in Two Mediterranean Tree Species. Biol. Plant. 2005, 49, 551–559. [Google Scholar] [CrossRef]
  45. Watanabe, M.; Agathokleous, E.; Anav, A.; Araminiene, V.; Carrari, E.; De Marco, A.; Hoshika, Y.; Proietti, C.; Sicard, P.; Paoletti, E. Impacts of Ozone on the Ecophysiology of Forest Tree Species. In Tropospheric Ozone—A Hazard for Vegetation and Human Health; Agrawal, S.B., Agrawal, M., Singh, A., Eds.; Cambridge Scholars: Newcastle, UK, 2021; pp. 277–306. [Google Scholar]
  46. Shang, B.; Xu, Y.; Dai, L.; Yuan, X.; Feng, Z. Elevated Ozone Reduced Leaf Nitrogen Allocation to Photosynthesis in Poplar. Sci. Total Environ. 2019, 657, 169–178. [Google Scholar] [CrossRef]
  47. Weih, M.; Bonosi, L.; Ghelardini, L.; Rönnberg-Wästljung, A.C. Optimizing Nitrogen Economy under Drought: Increased Leaf Nitrogen Is an Acclimation to Water Stress in Willow (Salix Spp.). Ann. Bot. 2011, 108, 1347–1353. [Google Scholar] [CrossRef] [Green Version]
  48. Mrak, T.; Štraus, I.; Grebenc, T.; Gričar, J.; Hoshika, Y.; Carriero, G.; Paoletti, E.; Kraigher, H. Different Belowground Responses to Elevated Ozone and Soil Water Deficit in Three European Oak Species (Quercus Ilex, Q. Pubescens and Q. Robur). Sci. Total Environ. 2019, 651, 1310–1320. [Google Scholar] [CrossRef]
  49. Somers, G.L.; Chappelka, A.H.; Rosseau, P.; Renfro, J.R. Empirical Evidence of Growth Decline Related to Visible Ozone Injury. For. Ecol. Manag. 1998, 104, 129–137. [Google Scholar] [CrossRef]
  50. Marzuoli, R.; Gerosa, G.; Bussotti, F.; Pollastrini, M. Assessing the Impact of Ozone on Forest Trees in an Integrative Perspective: Are Foliar Visible Symptoms Suitable Predictors for Growth Reduction? A Critical Review. Forests 2019, 10, 1144. [Google Scholar] [CrossRef] [Green Version]
  51. Chirino, E.; Vilagrosa, A.; Hernández, E.I.; Matos, A.; Vallejo, V.R. Effects of a Deep Container on Morpho-Functional Characteristics and Root Colonization in Quercus Suber L. Seedlings for Reforestation in Mediterranean Climate. For. Ecol. Manag. 2008, 256, 779–785. [Google Scholar] [CrossRef]
  52. Giovannelli, A.; Traversi, M.L.; Anichini, M.; Hoshika, Y.; Fares, S.; Paoletti, E. Effect of Long-Term vs. Short-Term Ambient Ozone Exposure on Radial Stem Growth, Sap Flux and Xylem Morphology of O3-Sensitive Poplar Trees. Forests 2019, 10, 396. [Google Scholar] [CrossRef] [Green Version]
  53. Agathokleous, E.; Saitanis, C.J.; Wang, X.; Watanabe, M.; Koike, T. A Review Study on Past 40 Years of Research on Effects of Tropospheric O3 on Belowground Structure, Functioning, and Processes of Trees: A Linkage with Potential Ecological Implications. Water. Air. Soil Pollut. 2016, 227, 33. [Google Scholar] [CrossRef]
Figure 1. Illustrative examples of O3 visible foliar injury in Quercus robur (A) and Q. pubescens (C) characterized by small homogeneously distributed dots between the primary leaf veins (ellipse). (B,D) Results from the linear multiple regression of O3 visible foliar injury with Cumulative Drought Index (CDI) and phototoxic O3 dose (POD1) as predictor factors in Quercus robur (B) and Q. pubescens (D). Colored dots represent well-watered (WW-blue), moderate drought (MD-grey), and severe drought (SD-red). The grey ellipsoid represents a confidence level of 75%. (+) positive regression, *** = p < 0.001, ns = not significant.
Plants 11 01836 g001
Figure 2. Illustrative examples of drought visible foliar injury in Q. robur (A) and Q. pubescens (C) characterized by dry and brownish leaf edges (arrow). (B,D) Results from the linear multiple regression of drought visible foliar injury with Cumulative Drought Index (CDI) and phototoxic O3 dose (POD1) as predictor factors in Q. robur (B) and Q. pubescens (D). Colored dots represent well-watered (WW—blue), moderate drought (MD—grey), and severe drought (SD—red). The grey ellipsoid represents a confidence level of 75%. (+) positive regression, * = p < 0.05, *** = p < 0.001, ns = not significant.
Plants 11 01836 g002
Figure 3. Bi-plot of the principal component analysis on Growth: Plant height increment (H), Stem diameter increment (S), and leaf number increment (N.L); Biomass: Leaf (L), Shoot (S), root (R), Total biomass (TB), and shoot/root ratio (R/S); Visible foliar O3 (O3S) and drought injury (DS); Physiological parameters: Photosynthesis (Pn), Photosynthetic nitrogen use efficiency (PNUE) and Photosynthetic phosphorus use efficiency (PPUE).
Plants 11 01836 g003
Table 1. Phytotoxic O3 dose (POD1, mmol m−2) and accumulated exposure over 40 ppb hourly concentrations (AOT40, ppm h) calculated at the O3 visible foliar injury onset, and Cumulative Drought Index (CDI) calculated at the drought visible foliar injury onset for Q. robur and Q. pubescens.
Water RegimeO3 Treat.Onset O3 InjuryOnset Drought Injury
POD1AOT40CDI
Q. roburQ. pubescensQ. roburQ. pubescensQ. roburQ. pubescens
WW-treatedAA12.07Asymp.17.78Asymp.Asymp.Asymp.
×1.212.4015.6916.4123.77Asymp.Asymp.
×1.411.6220.4615.1533.38Asymp.Asymp.
MD-treatedAA13.02Asymp.21.74Asymp.6.106.52
×1.212.1318.4116.4130.436.104.04
×1.413.0720.0421.5933.384.966.10
SD-treatedAAAsymp.Asymp.Asymp.Asymp.10.2010.20
×1.2Asymp.13.13Asymp.30.4310.2010.20
×1.410.7212.8126.2326.2310.2010.20
Table 2. Evaluation of O3 and drought incidence of visible foliar injury (VFI) along the experimental period for Q. robur and Q. pubescens exposed to different levels of O3 and drought.
Water RegimeO3 Treat./DOYQ. roburQ. pubescens
209218232240247266209218232240247266
O3 VFI incidenceWW-treat.AA--11111150------
×1.2-1144444444----1111
×1.4223333445656-----22
MD-treat.AA---112244------
×1.2-2222224456-----33
×1.4--22333333-----22
SD-treat.AA------------
×1.2-----------22
×1.4----1111----1133
Drought VFI incidenceWW-treat.AA------------
×1.2------------
×1.4------------
MD-treat.AA--33335067---111111
×1.2--22586767111111223333
×1.4-4433445063--22333333
SD-treat.AA222267788389222239676767
×1.2115661787889111122334444
×1.433567878100100444467787878
Table 3. Regression coefficients of the multiple linear regression for the species Q. robur, Q. pubescens, and Q. ilex, considering Cumulative Drought Index (CDI) and phototoxic O3 dose (POD1) for Model 1, and CDI and accumulated exposure over 40 ppb hourly concentrations (AOT40) for Model 2 as predictor factors, and Growth: Plant height increment (cm), Stem diameter increment (cm), and leaf number increment (N. leaves—n); Biomass: Leaf (g), Shoot (g), Root (g), Total biomass (g), and Ratio root/shoot (Ratio R/S); Visible foliar injury (O3 and drought—% of plants); Physiological parameters: Photosynthesis (Pn—µmol m−2s−1), Photosynthetic nitrogen use efficiency (PNUE—µmol m−2s−1) and Photosynthetic phosphorus use efficiency (PPUE—µmol m−2s−1) as dependent parameters. Levels of significance (p), intercepts and determination coefficients (R2) are shown.
Parameters Model 1 (POD1, CDI)Model 2 (AOT40, CDI)
POD1pCDIpInterceptpR2AOT40pCDIpInterceptpR2
Q. roburInjuryO36.736***−0.043n.s−64.967***0.7170.002***−2−027***−20.600***0.738
Drought4.802***5.882***−68.059***0.8870.001***4.524***−31.350***0.861
GrowthHeight0.316**0.035n.s−1.197n.s0.3080.159***−0.041n.s−0.213n.s0.501
Diameter0.032n.s−0.051**5.182***0.3230.019n.s−0.059***5.214***0.338
N. Leaves0.068n.s−2.338***190.955***0.5210.003n.s−2.351***191.913***0.521
BiomassLeaf0.240***0.013n.s1.741n.s0.4040.068*−0.040n.s3.743***0.191
Shoot−0.043n.s−0.176***12.517***0.404−0.017n.s−0.166***12.268***0.404
Root−0.784**−0.568***40.098***0.508−0.287*−0.391***35.097***0.476
Total−0.588n.s−0.732***54.357***0.428−0.236n.s−0.597***51.108***0.427
Ratio R/S−0.063***−0.019***2.600***0.692−0.022***−0.005n.s2.163***0.491
PhysiologyPn−0.629***−0.283***14.579***0.8240.000***−0.152**11.930***0.738
PNUE−0.569n.s−0.307*14.724*0.558−0.152n.s−0.175*10.032**0.558
PPUE−3.751*−1.560**82.525**0.916−0.668n.s−0.671*41.067*0.767
Q. pubescensInjuryO31.827 *** 0.645 *** −26.982 *** 0.329 0.876 *** 0.090 n.s −16.377 ***0.387
Drought1.279*3.658***−23.673*0.7870.660*3.259***−17.183**0.792
GrowthHeight0.241***−0.001n.s−0.472n.s0.3730.115***−0.060*1.039n.s0.371
Diameter−0.151***−0.052***8.020***0.485−0.052**−0.017n.s6.595***0.244
N. Leaves−4.901***−1.801**175.047***0.390−2.011**−0.644n.s136.376***0.283
BiomassLeaf−0.019n.s−0.012n.s4.183***−0.070−0.001n.s−0.008n.s3.865***−0.075
Shoot−0.205**−0.130***13.137***0.511−0.091**−0.081**11.687***0.474
Root−0.054n.s−0.223***22.085***0.366−0.039n.s−0.208***22.072***0.372
Total−0.278n.s−0.364***39.404***0.400−0.132n.s−0.297***37.625***0.398
Ratio R/S−0.022*−0.017***2.132***0.316−0.009n.s−0.012**1.955***0.277
PhysiologyPn−0.370***−0.255***13.500***0.7950.000***−0.179***12.290***0.771
PNUE−0.485*−0.286**14.671**0.741−0.173*−0.172**10.622***0.757
PPUE−2.385*−1.389**70.714**0.954−0.575n.s−0.788**41.724**0.901
Q. ilexInjuryO3
Drought
GrowthHeight0.127n.s0.004n.s15.423***−0.0500.051n.s−0.026n.s15.623***−0.357
Diameter0.153**0.031*0.799n.s0.3050.042**−0.003n.s1.483***0.229
N. Leaves3.238**1.194**17.246n.s0.3291.218***0.445n.s23.955**0.468
BiomassLeaf−0.151n.s−0.035n.s5.825***0.022−0.029n.s−0.002n.s4.846***−0.037
Shoot0.011n.s−0.053n.s7.619***0.158−0.000n.s−0.055*7.750***0.157
Root0.453**0.064n.s7.027***0.2300.072n.s−0.031n.s10.315***0.013
Total0.313n.s0.024n.s20.471***0.0380.043n.s−0.089n.s22.911***−0.005
Ratio R/S0.095*0.012n.s0.158n.s0.2940.022n.s−0.008n.s0.7669n.s0.068
PhysiologyPn0.094n.s−0.173***9.090***0.6300.000n.s−0.196***9.380***0.624
PNUE−0.014n.s−0.122**5.768**0.840−0.014n.s−0.118***5.939***0.846
PPUE−3.036n.s−1.870*96.073*0.814−0.478n.s−1.124*71.158*0.772
* = p < 0.05, ** = p < 0.01, *** = p < 0.001, n.s = not significant.
Publisher’s Note: MDPI stays neutral with regard to jurisdictional claims in published maps and institutional affiliations.

