Article

Foliar Spraying of Solanum tuberosum L. with CaCl2 and Ca(NO3)2: Interactions with Nutrients Accumulation in Tubers

by
Ana Rita F. Coelho
1,2,*,
José Cochicho Ramalho
2,3,
Fernando Cebola Lidon
1,2,
Ana Coelho Marques
1,2,
Diana Daccak
1,2,
Cláudia Campos Pessoa
1,2,
Inês Carmo Luís
1,2,
Mauro Guerra
4,
Roberta G. Leitão
4,
José Manuel N. Semedo
2,5,
Maria Manuela Silva
2,6,
Isabel P. Pais
2,5,
Nuno Leal
1,2,
Carlos Galhano
1,2,
Ana Paula Rodrigues
3,
Paulo Legoinha
1,2,
Maria José Silva
2,3,
Maria Simões
1,2,
Paula Scotti Campos
2,5,
Maria Fernanda Pessoa
1,2 and
Fernando Henrique Reboredo
1,2
add Show full author list remove Hide full author list
1
Departamento Ciências da Terra, Faculdade de Ciências e Tecnologia, Universidade NOVA de Lisboa, Campus da Caparica, 2829-516 Caparica, Portugal
2
Unidade de Geobiociências, Geoengenharias e Geotecnologias (GeoBioTec), Faculdade de Ciências e Tecnologia, Universidade NOVA de Lisboa, Campus da Caparica, 2829-516 Caparica, Portugal
3
PlantStress & Biodiversity Lab, Centro de Estudos Florestais (CEF), Instituto Superior Agronomia (ISA), Universidade de Lisboa (ULisboa), Quinta do Marquês, Av. República, 2784-505 Lisboa, Portugal
4
LIBPhys-UNL, Departamento de Física, Faculdade de Ciências e Tecnologia, Universidade NOVA de Lisboa, 2829-516 Caparica, Portugal
5
INIAV—Instituto Nacional de Investigação Agrária e Veterinária, Quinta do Marquês, 2784-505 Oeiras, Portugal
6
ESEAG-COFAC, Avenida do Campo Grande 376, 1749-024 Lisboa, Portugal
*
Author to whom correspondence should be addressed.
Plants 2022, 11(13), 1725; https://doi.org/10.3390/plants11131725
Submission received: 24 May 2022 / Revised: 20 June 2022 / Accepted: 27 June 2022 / Published: 29 June 2022
(This article belongs to the Section Plant Nutrition)

Abstract

:
Calcium is essential for plants, yet as its mobility is limited, the understanding of the rate of Ca2+ accumulation and deposition in tissues of tubers, as well as the interactions with other critical nutrients prompted this study. To assess the interactions and differential accumulation of micro and macronutrients in the tissues of tubers, Solanum tuberosum L. varieties Agria and Rossi were cultivated and, after the beginning of tuberization, four foliar sprayings (at 8–10 day intervals) with CaCl2 (3 and 6 kg ha−1) or Ca(NO3)2 (2 and 4 kg ha−1) solutions were performed. It was found that both fertilizers increased Ca accumulation in tubers (mostly in the parenchyma tissues located in the center of the equatorial region). The functioning of the photosynthetic apparatus was not affected until the 3rd application but was somewhat affected when approaching the end of the crop cycle (after the 4th application), although the lower dose of CaCl2 seemed to improve the photochemical use of energy, particularly when compared with the greater dose of Ca(NO3)2. Still, none of these impacts modified tuber height and diameter. Following the increased accumulation of Ca, in the tubers of both varieties, the mean contents of P, K, Na, Fe, and Zn revealed different accumulation patterns. Moreover, accumulation of K, Fe, Mn, and Zn prevailed in the epidermis, displaying a contrasting pattern relative to Ca. Therefore, Ca accumulation revealed a heterogeneous trend in the different regions analyzed, and Ca enrichment of tubers altered the accumulation of other nutrients.

1. Introduction

Calcium is an essential macronutrient for plant growth and development, providing stability and integrity to the cell wall [1], performing a central role in stress responses [2], and acting as a cofactor of several enzymes involved in the catabolism of ATP and phospholipids [3].
Calcium fluxes from the soil solution, in the form of Ca2+, largely occur from the root apex and/or regions of lateral root initiation to the shoot, through the apoplasm (which is relatively non-selective between divalent ions) in regions where Casparian bands are absent, or via the cytoplasm of unsuberized endodermal cells where Casparian bands are present [4,5]. In the apoplasm, cell water space Ca2+ binds to negatively charged residues, being taken up by cells down the electrochemical gradient for Ca2+, or passing through the water-free space of the cell wall to the xylem [6]. In the xylem, the translocation of Ca2+ (or complexed with the organic acid transport pathway) occurs via water mass flow with the transpiration stream [7,8], which determines that Ca transport is inhibited by stomatal closure and that it cannot be readily remobilized in points downstream of the transpirational flow [9]. Indeed, some controversy prevails about Ca redistribution through the phloem, since several authors reported that it is immobile [5,10,11,12], while others pointed out a low kinetics rate [13,14,15,16], namely in potato tubers [17].
To achieve maximum yields, Ca fertilization is required if the soil cannot provide enough nutrients to feed the plant. Nevertheless, Ca fertilization must be adjusted to the final destination because, above the upper threshold, toxic symptoms can develop (namely leaf necrosis, which limits the mobilization of photoassimilates). Besides, unbalanced nutrient interactions that implicate Ca can originate complexes. These complexes can be at the root surface, within the plant organs, and can compete for the sites of uptake, absorption, transport, and function in those tissues (on plant root surfaces or within all plant tissues). In fact, unbalanced nutrients can promote contrasting or similar patterns of interactions with Ca due to the similarities in size, geometry of coordination, and electronic configuration [16,18,19,20,21,22,23,24,25].
As Ca2+ is remobilized at a low rate from mature to active growing plant tissues [9], which can ultimately result in local tissue deficits [9], to surpass the imbalance of minerals, foliar spraying can overtake the use of soil as an intermediary for plant nutrition [26]. Moreover, the addition of Ca to the soil can alter tuberization and during this period can also reduce the number of tubers (suppressing tuberization) [27], but the supplemental foliar application of CaCl2 and Ca(NO3)2 at a Ca rate of 0.5–1 kg ha−1 (two to four applications, two weeks apart to avoid deficiencies, with the first application occurring at full bloom) is beneficial [28]. Indeed, under this workflow, El-Hadidi et al. (2017) [29] found that, through foliar pulverization, the Ca levels significantly increased in potato leaves and tubers. El-Zohiri and Asfour (2009) [30], through pulverization with Ca(NO3)2, also found an increased content of Ca in potato tubers, and Seifu and Deneke (2017) [31], spraying with CaCl2 and Ca(NO3)2, obtained a similar trend.
C assimilation is of crucial importance for crop productivity. In fact, photosynthesis is among the first processes affected by environmental constraints, leading to a decline in the growth and productivity of crops, usually to a greater extent when superimposed stresses do occur [32,33,34]. Calcium is implicated in a wide number of physiological processes, including growth and development, as well as tolerance to environmental stresses. Additionally, Ca2+ is involved in the regulation of photosynthetic performance, with a wide number of impacts, namely at the levels of stomatal closure, photosystem efficiency, non-photochemical quenching regulation and the xanthophyll cycle [35,36,37]. Fluorescence analysis is a fast, non-destructive, and accurate method to evaluate the functioning of the photosynthetic pathway, including the photochemical use of energy and the photoprotective dissipation processes, and has been extensively used to assess the performance of the photosynthetic apparatus under stressful environmental conditions [34,38,39,40].
Considering previous research [17,41,42], as well as the low kinetic mobility of Ca in the phloem and the limited redistribution in plants, Agria and Rossi varieties were used as a test system to assess the interactions of foliar fertilization with increasing concentrations of CaCl2 and Ca(NO3)2 and the accumulation of mineral elements (Ca, P, K, Na, Fe, Zn, C, H, O, Mn and Cu) in the different tissues of tubers.

2. Results

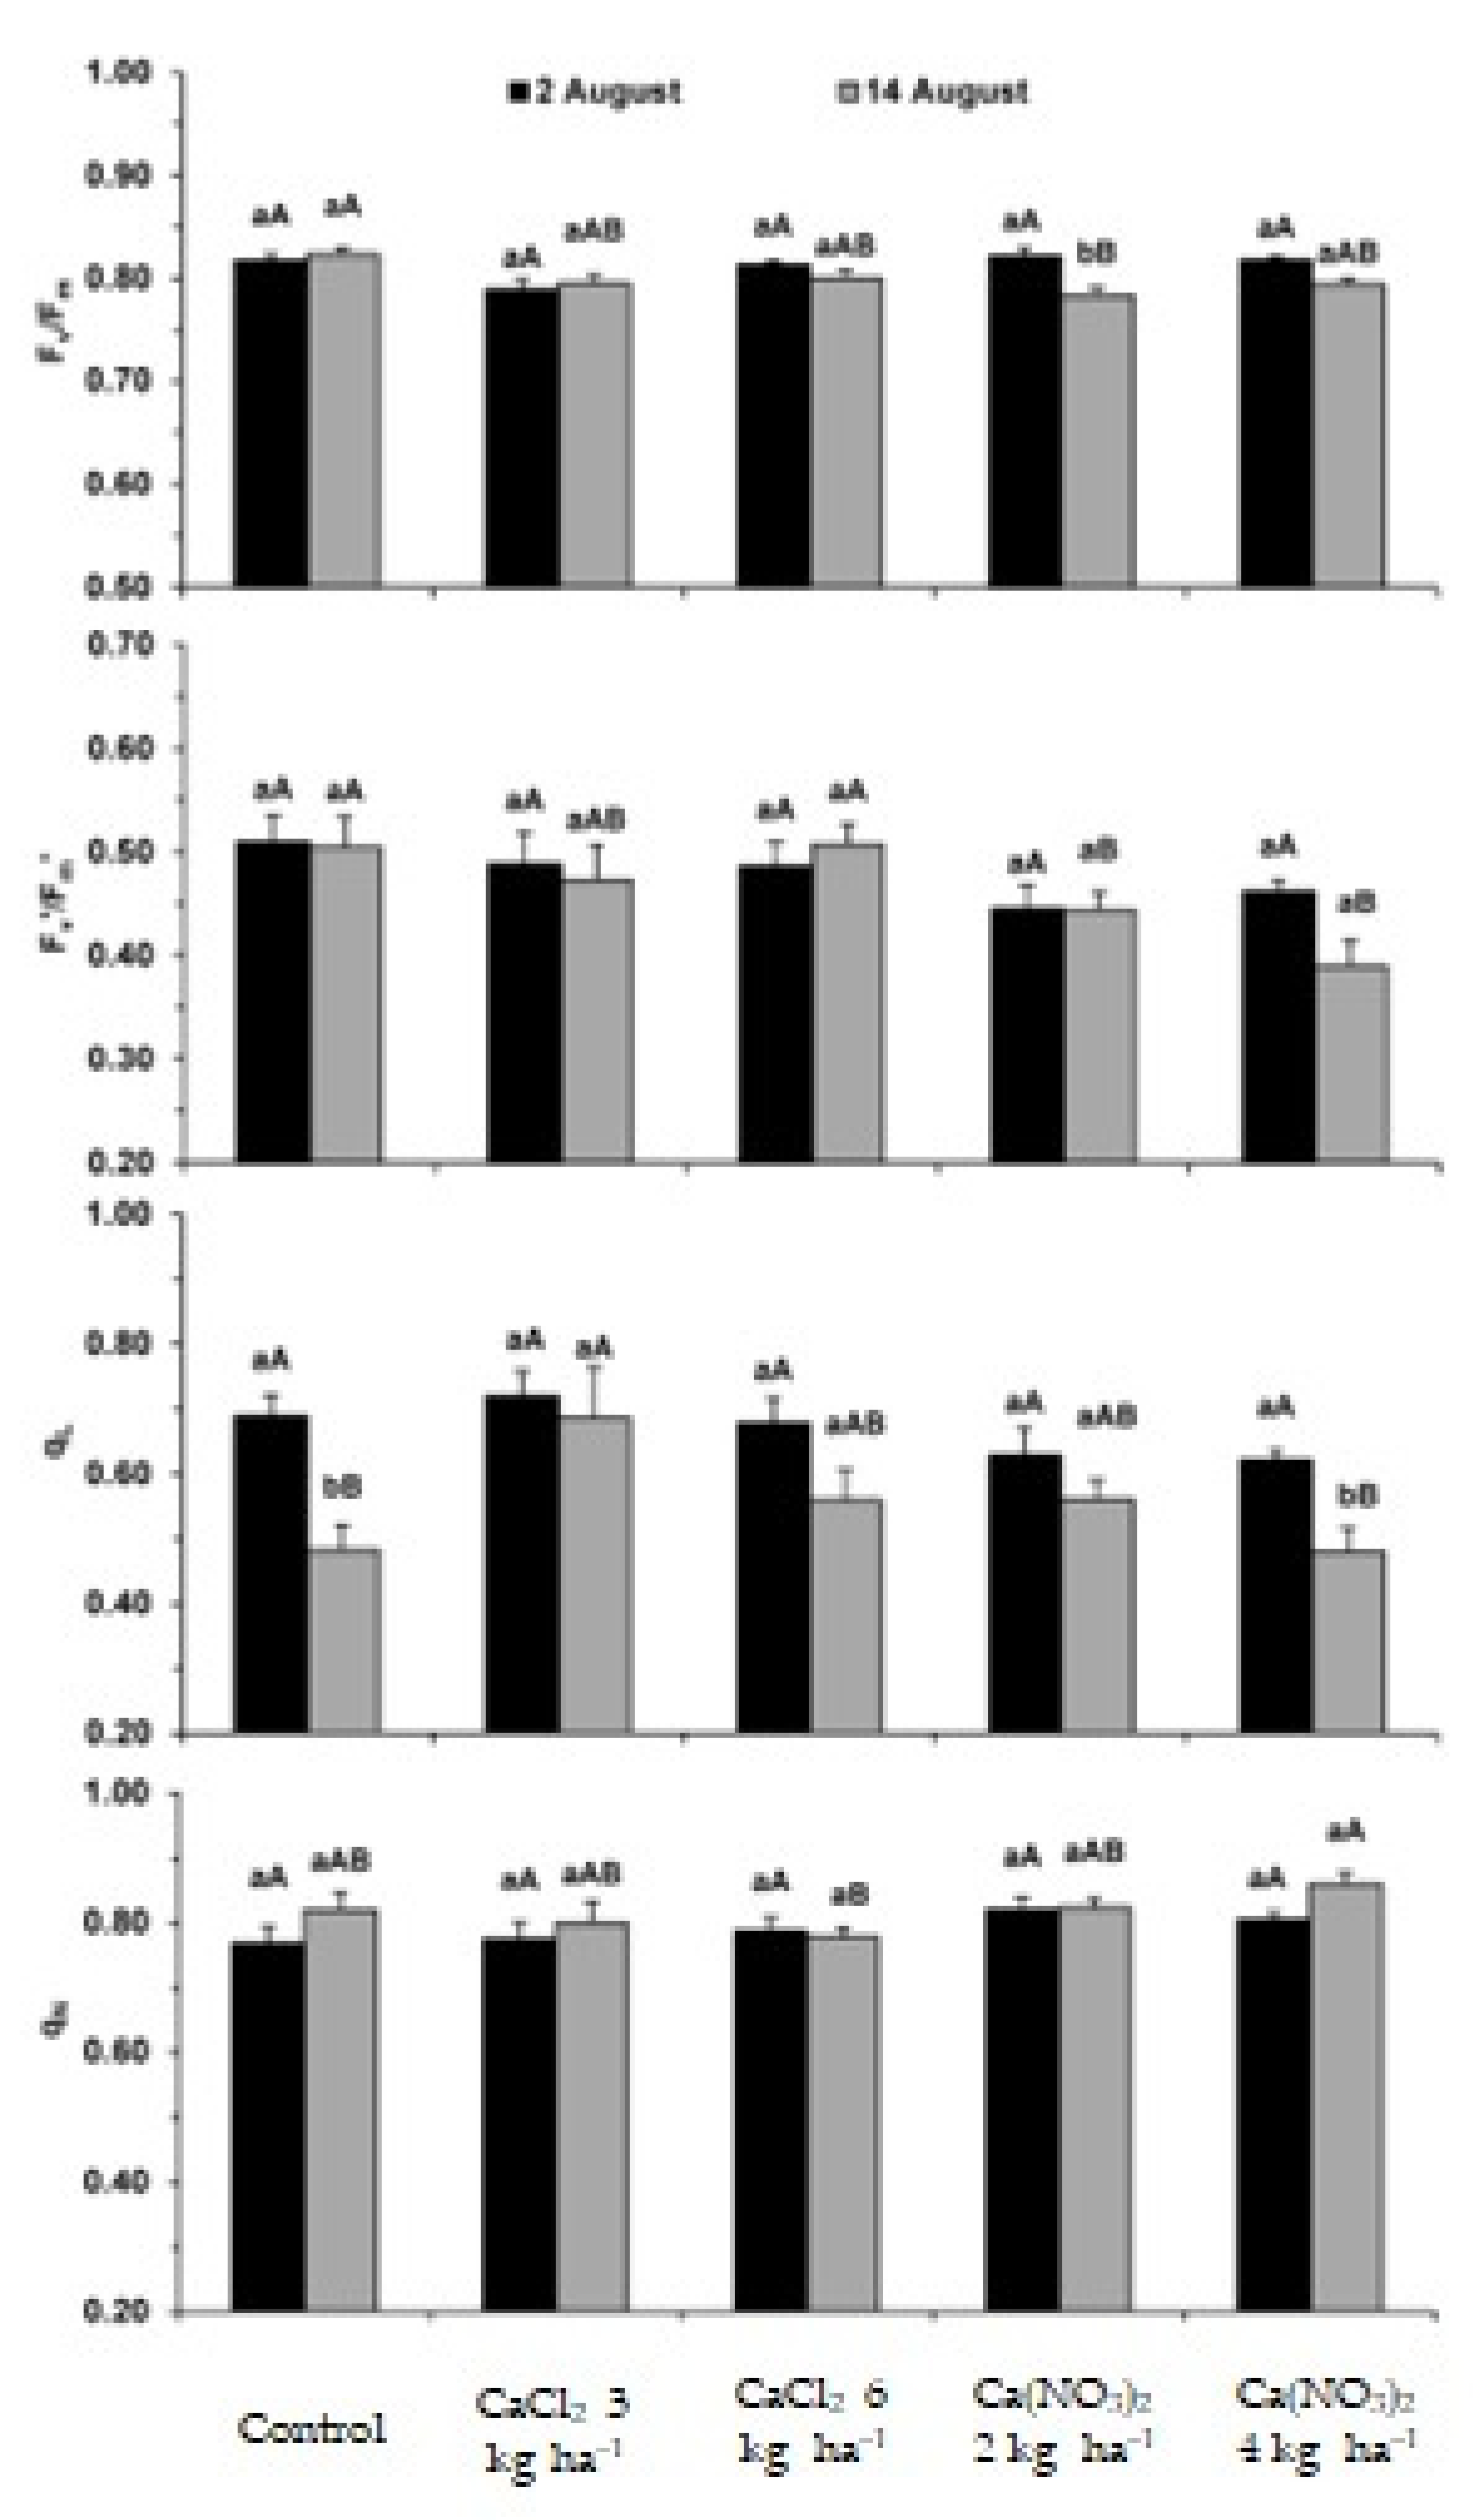
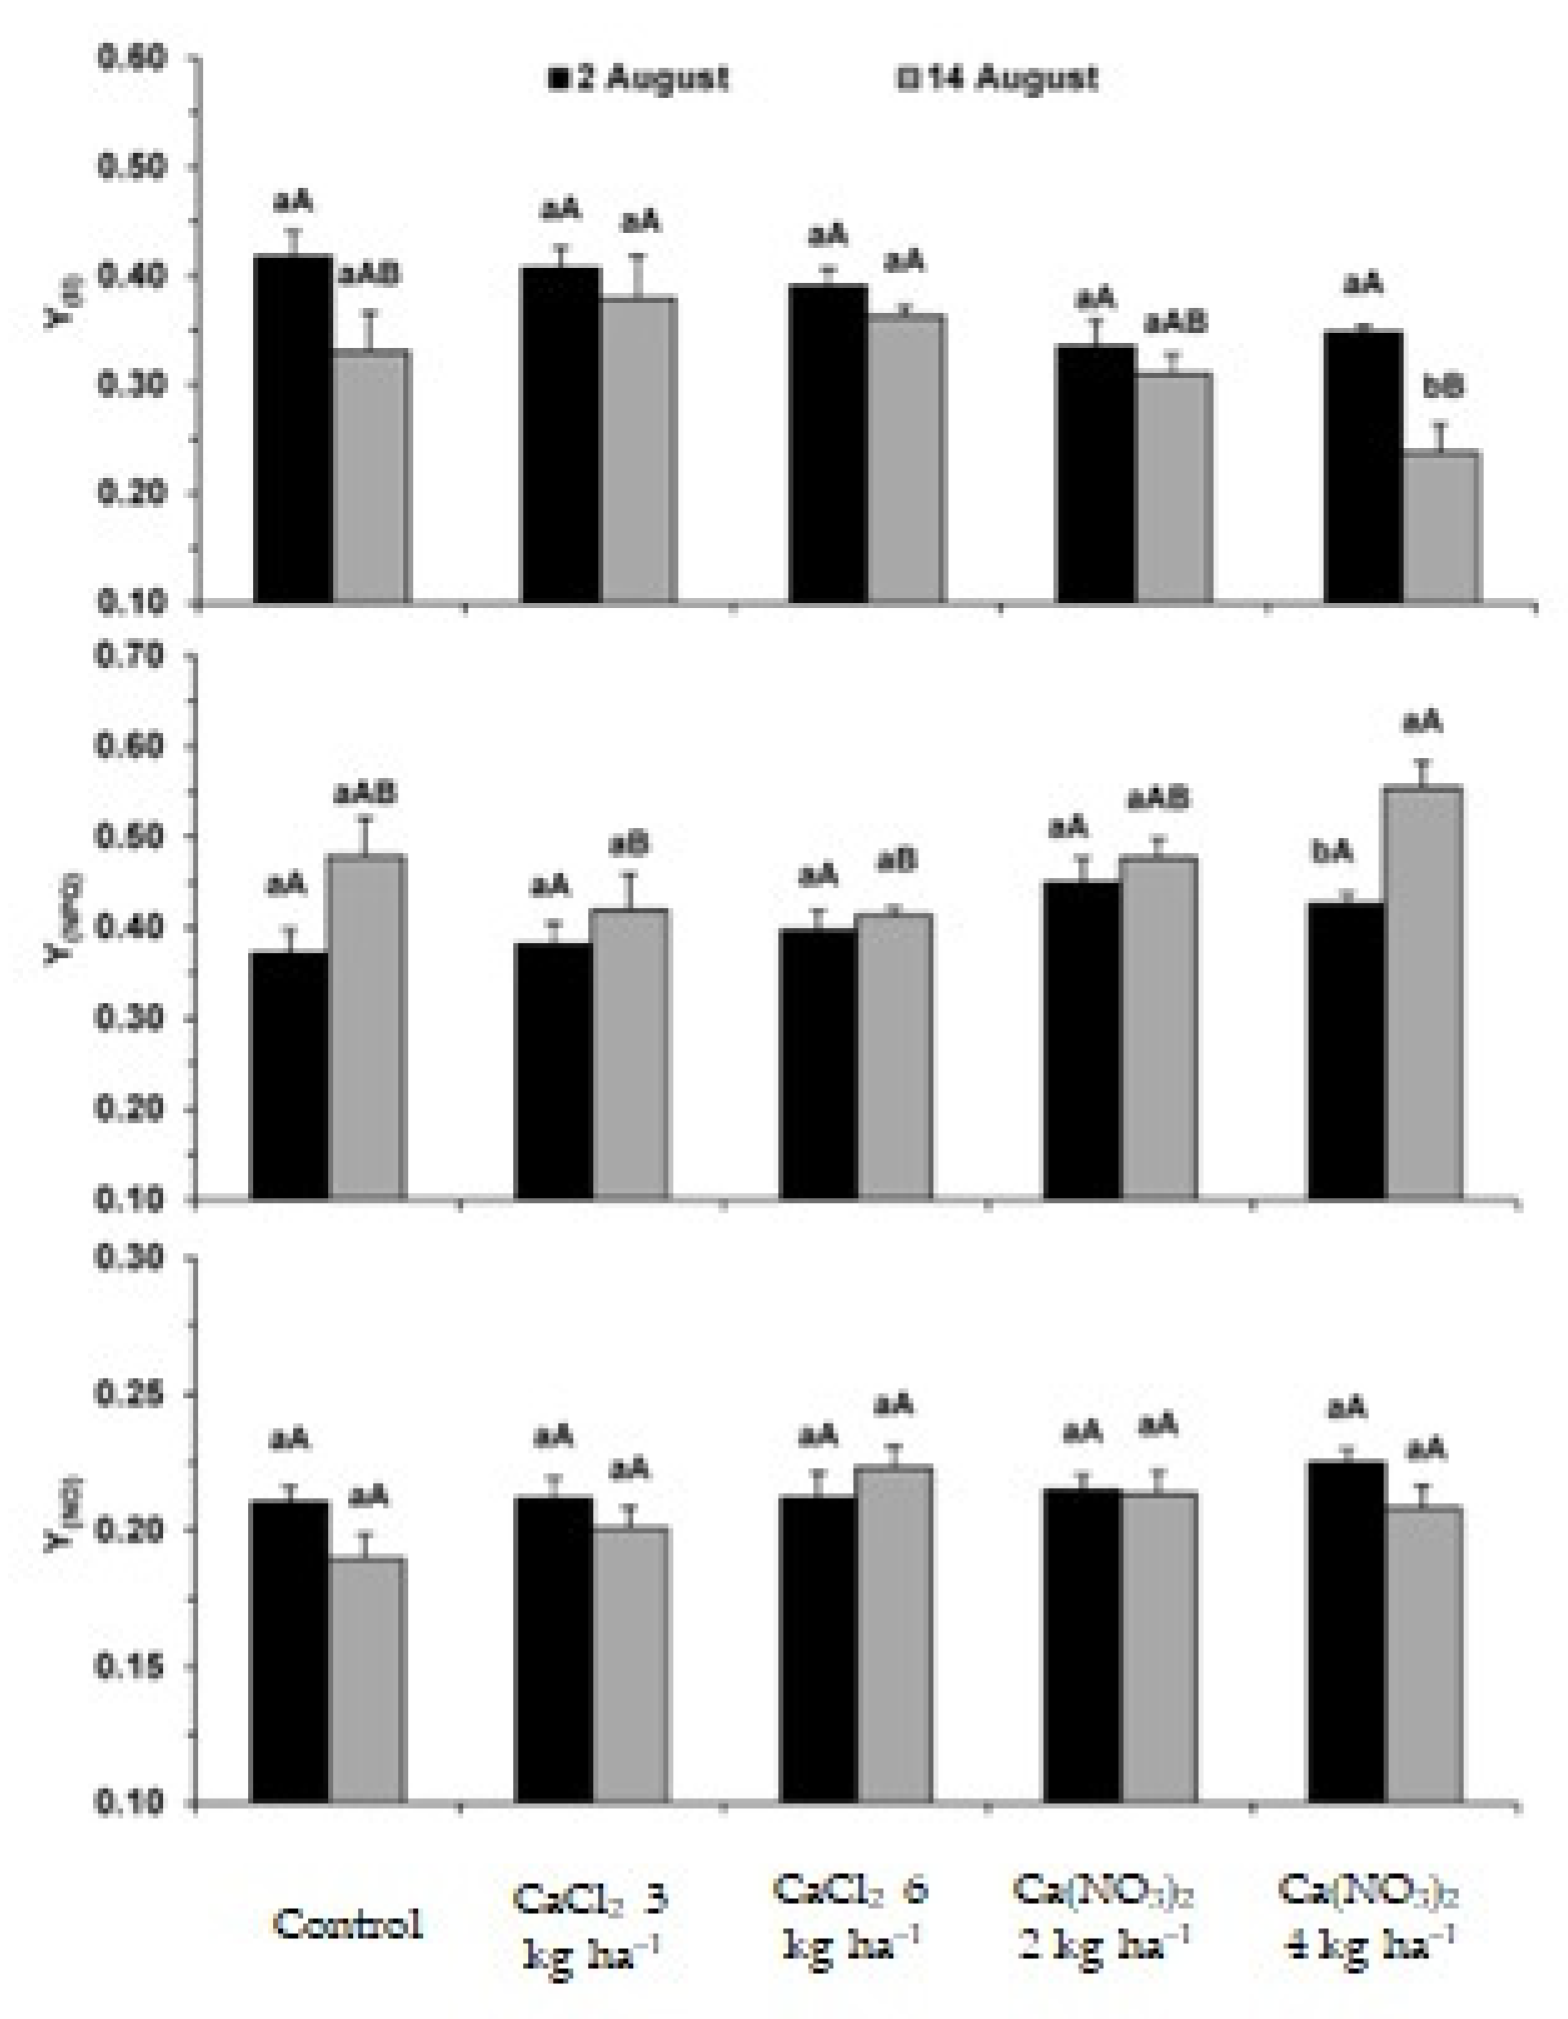
2.1. Photosynthetic Apparatus Performance

Within the scope of the functioning of the photosynthetic apparatus, it was found that after the 3rd Ca application, no significant differences were observed in all parameters, regardless of treatment, as compared to the control (Figure 1 and Figure 2). However, after the 4th application, the PSII photochemical efficiency (Fv/Fm, Fv′/Fm′) was usually reduced only in the Ca(NO3)2 treatments. At this time, the use of energy through photochemistry (qL, Y(II)) was not affected as compared with the control. Additionally, the photoprotective dissipation processes (Y(NPQ), qN) followed the opposite trend (Figure 1 and Figure 2).
As regards the comparison between the two dates of analysis, a global decline in the use of energy through photochemistry was observed (qL, Y(II)), likely to be associated with plants approaching the end of their life cycle. However, at this latter developmental stage, some relevant differences were observed regarding the applied Ca products and doses. In fact, the 3 and 6 kg ha−1 CaCl2 doses promoted the maintenance of Fv/Fm and Fv′/Fm′, and somewhat enhanced photosynthetic performance (qL, Y(II)), denoting as well a marginally lower need of dissipation mechanisms (qN, Y(NPQ)), always as compared with control plants. In contrast, although qL was not negatively affected by Ca application, and the highest Ca(NO3)2 treatment (4 kg ha−1) reduced the actual PSII photochemical efficiency (Fv′/Fm′) and photochemical use of energy (Y(II)), the latter, was accompanied by an increase in the photoprotective thermal dissipation of energy (Y(NPQ)), although Y(NO) remained largely unchanged regardless of date and applied Ca products/doses, thus reflecting an absence of aggravated non-regulated dissipation processes, that is, showing an absence of photoinhibition.

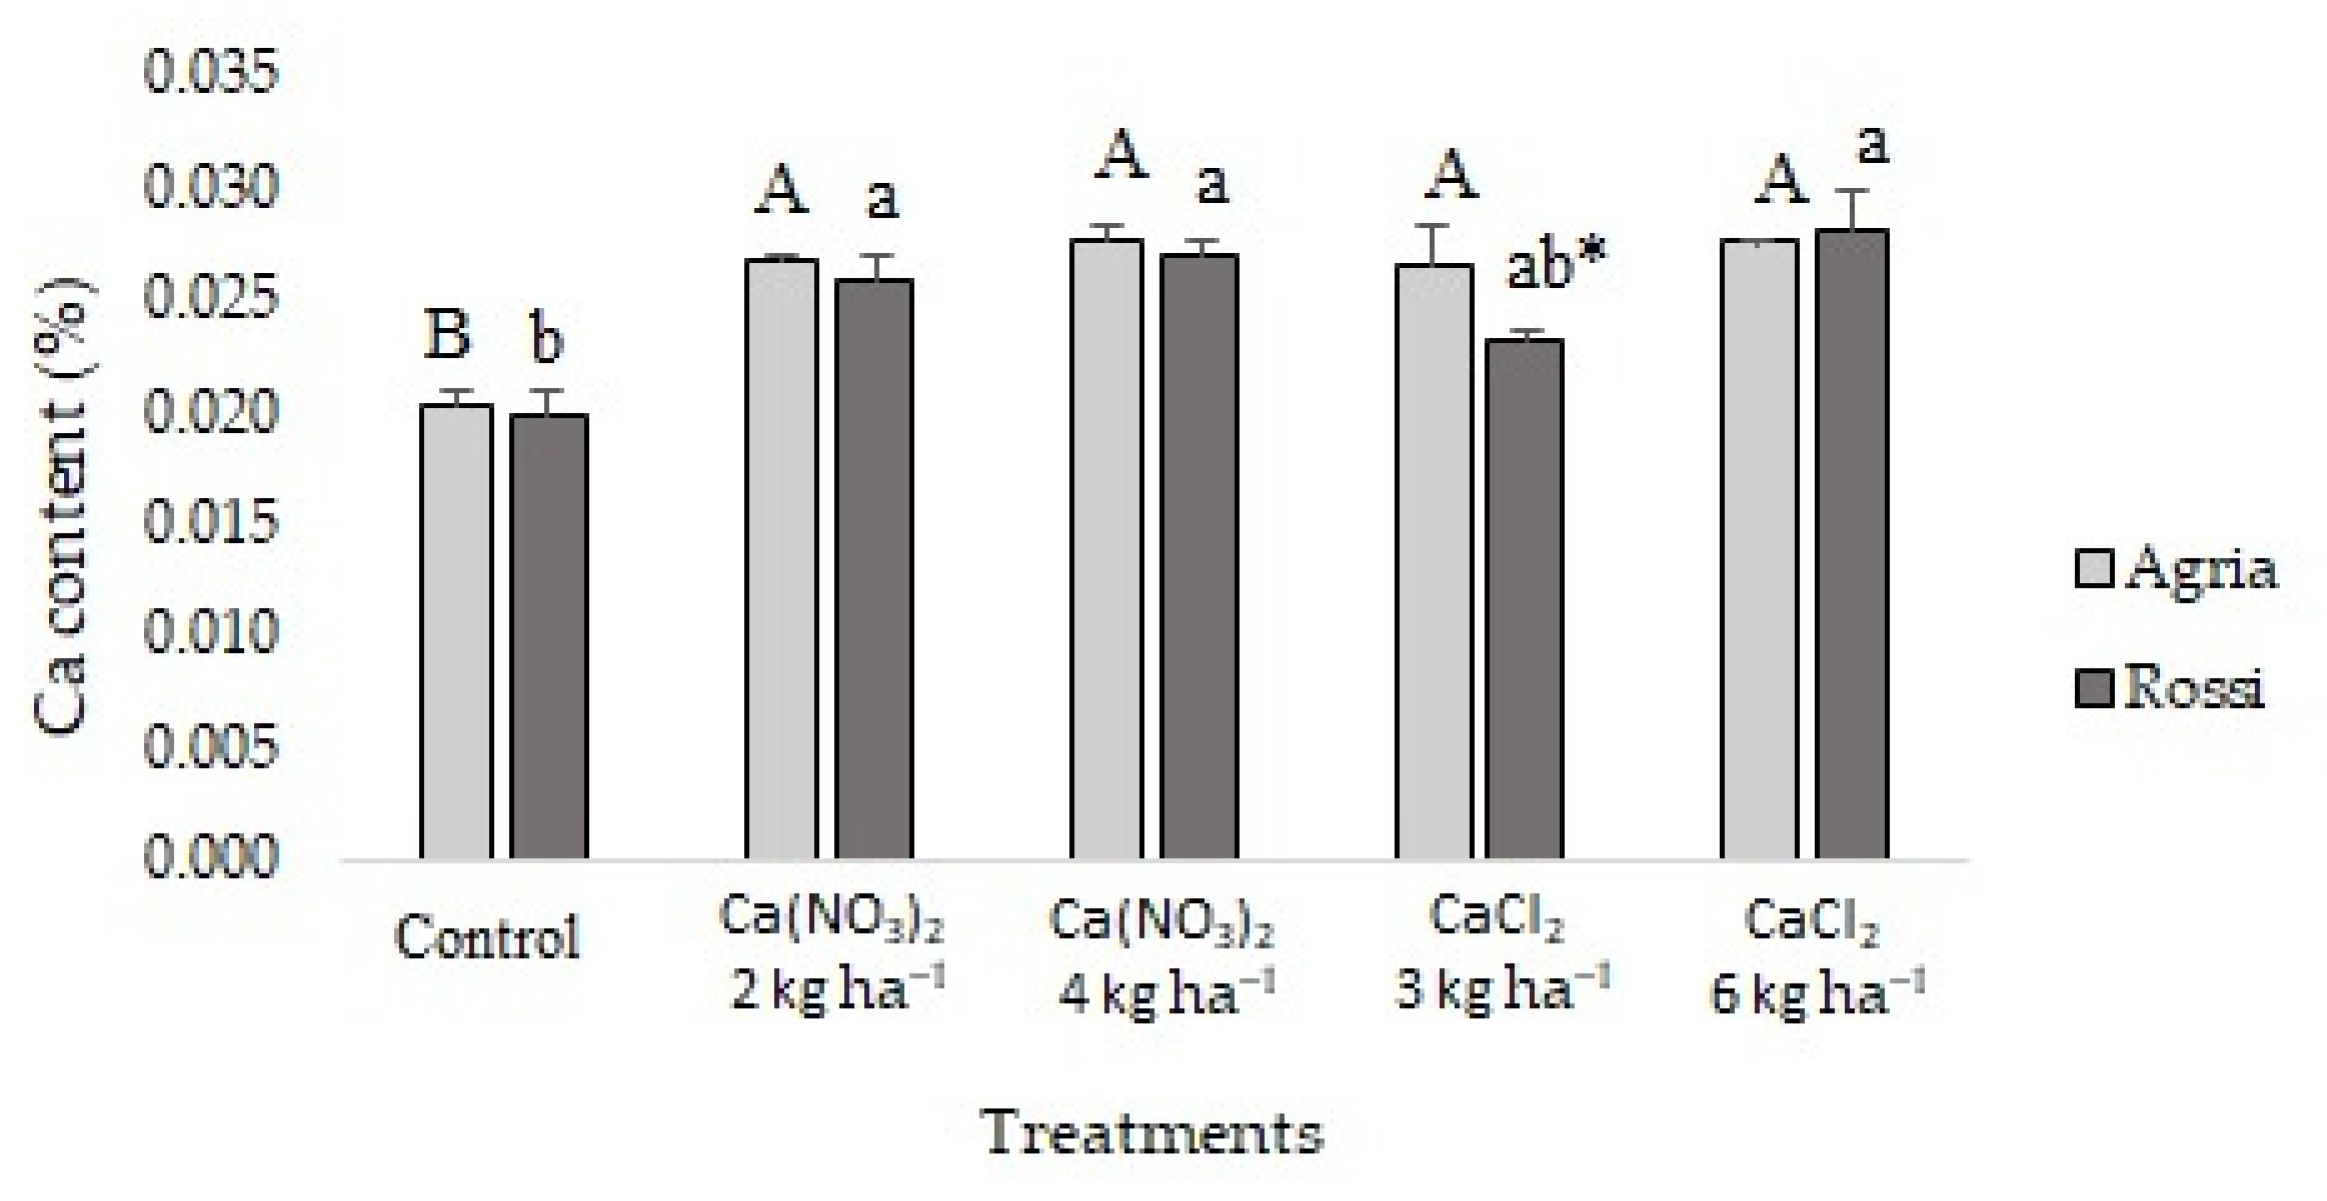
2.2. Mineral Content in Tubers

Compared to the control, in tubers of Agria, the average value of Ca increased significantly, with values ranging between 5–40% (Figure 3). Relative to the control, in tubers of Rossi, Ca content also showed 1.35 and 1.40 fold increases (maximum levels with CaCl2—6 kg ha−1 and Ca(NO3)2—4 kg ha−1) (Figure 3).
In tubers of Agria and Rossi, the levels of P among the different treatments did not vary significantly, yet values varied between 0.588–1.080% and 0.433–0.820% (with the control mostly showing the lowest values) (Table 1). In the controls of Agria and Rossi, for both Ca foliar fertilizers, the content of K in the tubers showed the lowest values; however, whereas Agria had significantly higher values for all the remaining treatments, Rossi only displayed significantly higher levels through application of CaCl2 (Table 1). In the tubers of Agria, Na content revealed the maximum values in the control and minimum values through fertilization with CaCl2—6 kg ha−1, while increasing concentrations of Ca(NO3)2 promoted significant and progressive decreases (Table 1). Concerning tubers of Rossi, the amount of Na followed a similar trend after application of increasing concentrations of Ca(NO3)2, but CaCl2 revealed the minimum value through application of CaCl2—6 kg ha−1 (Table 1). The content of Fe in Agria and Rossi tubers did not vary significantly among treatments (except in CaCl2—6 kg ha−1), but Zn showed the highest concentration in the Agria control, whereas in the remaining treatments, significant variations were not found (Table 1). Moreover, in tubers of Rossi, the content of Zn did not vary significantly among treatments (Table 1).

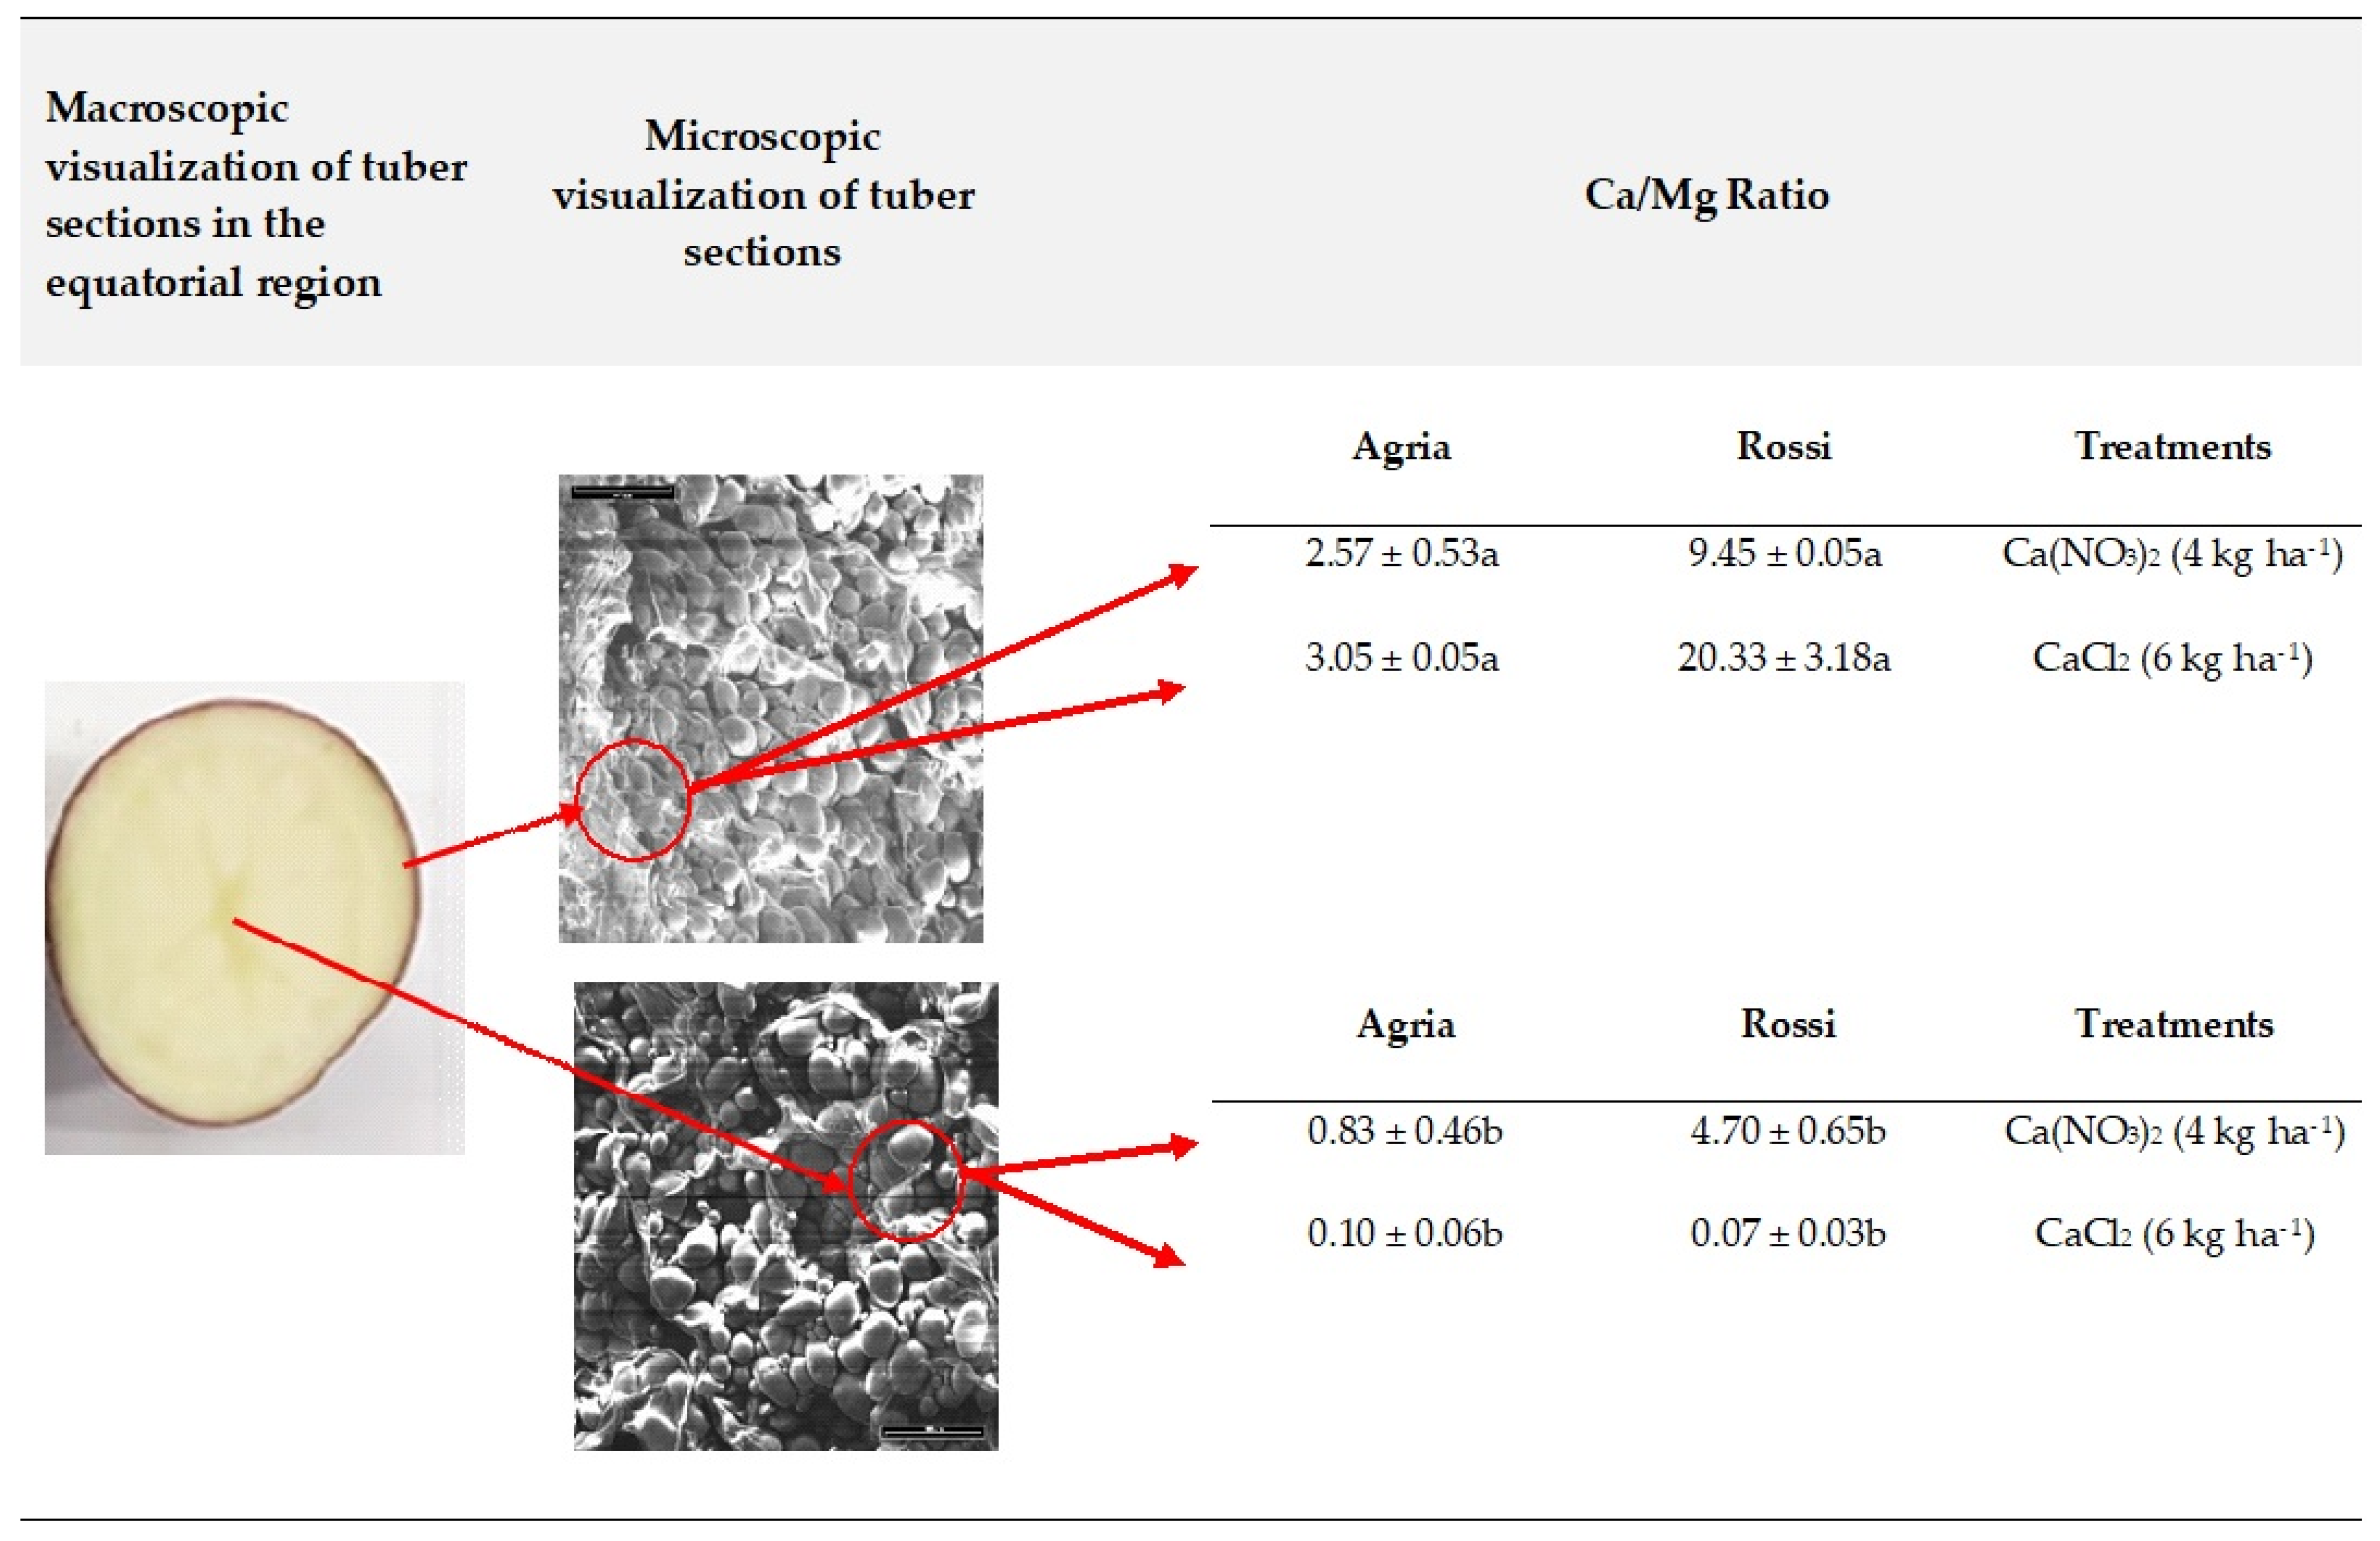
2.3. Tissue Localization of Mineral Elements in Tubers

Considering that Mg content remained similar among treatments (data not shown), the ratio of Ca/Mg from tubers of Agria and Rossi revealed that Ca prevailed in the center of the equatorial region of the parenchyma tissue (Figure 4).
Although in each treatment significant differences could not be found for C, H and, O contents among tissues from the epidermis to the center of Agria and Rossi tubers (Table 2), in general, the application of CaCl2 promoted the lowest values (except in Rossi, treatments of 3 kg ha−1 for C and O, and of 6 kg ha−1 for C). Additionally, among treatments of both varieties, each region of the tubers displayed similar contents of C, H and O (except in the middle region under treatment with 4 kg ha−1 of Ca(NO3)2).
In each treatment, the control tubers of both varieties revealed the lowest values of K in the epidermis. After Ca spraying with both fertilizers, in each treatment of Agria, a slight increase in K was found (in most cases non-significant) from the epidermis to the center of the tubers. In tubers of Rossi, significant differences were found, but a clear tendency was not observed (Table 2). In the different treatments of both varieties, the lowest content of K occurred in the epidermis (except in the treatment with 4 kg ha−1 Ca(NO3)2); however, for the other regions, a clear trend could not be found (Table 2). Nevertheless, in the center of the tubers, the values of K increased in Agria with CaCl2 treatments but decreased in Rossi. Moreover, in the middle and center regions of Rossi, decreases were found with 4 kg ha−1 Ca(NO3)2 treatment, and an increase in the center with 2 kg ha−1 of Ca(NO3)2 treatment (Table 2).
In each treatment of Agria and Rossi, the concentrations of Fe in the tubers remained significantly higher in the epidermis (except for Rossi with 6 kg ha−1 CaCl2). Among treatments of Agria, the middle region of tubers showed the highest value in the control, whereas the center displayed similar values (Table 2). Concerning the treatments of Rossi, the content of Fe did not vary in the center of tuber, but significantly higher values were found with the 3 kg ha−1 CaCl2 treatment (Table 2).
In each treatment of Agria, the levels of Mn in the tubers also showed the highest values in the epidermis, but in Rossi a clear trend could not be found (Table 2). Nevertheless, among treatments, a clear trend for Mn accumulation could not be found in the epidermis of Agria, but in Rossi treated with Ca(NO3)2, an increase was observed (Table 2). In the middle region of tubers from Agria, a decrease in Mn was found with Ca(NO3)2, but an increase was detected in the center of the parenchyma tissues with CaCl2 treatments (Table 2). In the center of the parenchyma tissue of Rossi, relative to the control, Mn content further increased with Ca(NO3)2 treatments but decreased through the application of CaCl2 (Table 2).
In each treatment of Agria, relative to the epidermis, the amount of Zn showed higher values in the center of the tubers (except with the 4 kg ha−1 Ca(NO3)2 and 6 kg ha−1 CaCl2 treatments), but in Rossi, although in the control a similar tendency occurred, in the remaining treatments, the opposite trend was found (except with 2 kg ha−1 Ca(NO3)2) (Table 2). Among treatments of both varieties, relative to the control, the levels of Zn increased in the epidermis with the Ca(NO3)2 or CaCl2 treatments (Table 2). Among treatments, in the middle region of the tubers from Agria, relative to the control, the content of Zn did not vary significantly with Ca(NO3)2, but in Rossi, a decrease was found (Table 2). Moreover, in the center of the parenchyma of Agria, a significant increase in Zn was found with CaCl2 treatments, but a significant decrease was detected in Rossi treated with either of these fertilizers (Table 2).
In each treatment, the content of Cu did not reveal a clear trend between the epidermis and the center of the tubers (Table 2). Among treatments of Agria, relative to the control, the amount of Cu in the epidermis increased significantly, whereas in the middle region of the tubers, it showed the minimum and higher values with 4 kg ha−1 Ca(NO3)2 and 6 kg ha−1 CaCl2, respectively (Table 2). In the center of the Agria tubers, minimum values were also found with the 4 kg ha−1 Ca(NO3)2 treatment (Table 2). Among treatments, the Rossi control showed minimum values of Cu in all tuber regions, and among the remaining treatments the Cu content in the center of the parenchyma did not vary significantly (Table 2). Moreover, in the epidermis, treatments with the highest concentrations of Ca(NO3)2 and the lowest of CaCl2 had the highest concentrations of Cu (Table 2). Among all treatments with both fertilizers, the middle region of the parenchyma tubers displayed the highest Cu content with 3 kg ha−1 CaCl2 (Table 2).

2.4. Size and Colorimetric Characteristics

The height and diameter of tubers from both varieties did not vary significantly among treatments (mean values ranged between 9.30–11.80 cm and 4.50–6.24 cm, respectively—Table 3). Regarding the color, parameters L, a* and b* values of tubers of Agria did not vary significantly among treatments. Moreover, in Rossi, parameter a* (red—green transitions) showed significantly higher values through the application of CaCl2 relative to the Ca(NO3)2 treatments and control.

3. Discussion

3.1. Impact on the Performance of the Photosynthetic Apparatus

Plant species are frequently subjected to an imbalance of nutrients, which adversely affects several metabolic processes, namely those associated with the synthesis of photoassimilates and, therefore, productivity [36,37]. The increase in external Ca concentrations through foliar spraying can modify the photosynthetic performance by reducing stomatal aperture associated with the Ca2+-sensing receptor (CAS) protein [43]. This is in line with the significant gs decline previously observed in S. tuberosum var. Agria under the same Ca biofortification treatments, although that usually promoted only a (consistent) tendency to reduce the net C assimilation rate after the 3rd application [17]. Calcium is also involved in the cyclic electron flow and non-photochemical quenching [36,37]. In this context, our findings showed (Figure 1 and Figure 2) that after the 3rd application, no impacts were observed regarding the photochemical performance of the photosynthetic machinery or the photoprotective dissipation processes, despite the already mentioned tendency to lower photosynthetic rates [17]. This means that until this stage, the potential functioning of the photosynthetic apparatus was preserved, irrespective of the applied Ca form and doses (Figure 1 and Figure 2), but a marginal impact was observed in C assimilation. The latter was associated with a large decline in gs that restricted the CO2 supply (as reflected in the lowered Ci) to the carboxylation sites [17]. However, after the 4th application of CaCl2, the photosynthetic performance was maintained or marginally improved, in contrast with the impact of the Ca(NO3)2 doses, mainly the highest one. Both Ca(NO3)2 doses reduced to some extent the PSII photochemical efficiency (Fv/Fm, Fv′/Fm′), but the highest one additionally reduced the photochemical use of energy (Y(II)), with a concomitant increase in the thermal dissipation processes (Y(NPQ)). These results suggested a negative impact on the photosynthetic apparatus performance, although without increases in deregulated energy dissipation usually associated with photoinhibition (Y(NO)) [40]. Nevertheless, the application of Ca solutions had a neutral effect, considering the absence of significant negative changes in the size of tubers (Table 3) and in the tuber yield of both varieties (data not shown), which indicates that the threshold of toxicity was not reached.

3.2. Calcium Accumulation and Interaction with Other Nutrients

After tuberization, Ca accumulation in tubers occurred through foliar spraying with both foliar fertilizers (Figure 3). Agria and Rossi varieties showed, relative to the control, similar upper build-up indexes in the higher treatments (Figure 2). Nonetheless, independently of the accumulation extent of Ca in the potato tubers of both varieties, our data also reinforced that Ca2+ mass flow translocated from roots, in the xylem, through the transpiration stream [6,8,10,17,44,45] was accompanied by phloem redistribution of Ca [13,14,15] provided by foliar spraying.
Moreover, the accumulation of Ca determined relevant changes in the accumulation of nutrients and distribution among tissues of tubers. Although in several plant species Ca might stimulate the absorption of P under defined concentration ranges of ions [20,46], at harvest, Ca accumulation promoted by both fertilizers in the tubers of both varieties did not significantly affect the content of P (Table 1). These data indicate the absence of competitive interactions through the development of a linkage bridge between root respiration, ion affinities, and precipitation of calcium phosphates. In fact, during root respiration, hydrogen carbonate ions might keep Ca ions away from the root growing points, whereas uptake and translocation of phosphate from the soil to these growing points secure the uptake and supply of Ca. Thereafter, accumulation of Ca ions at root surfaces may precipitate phosphates and thereby hinder uptake of not only phosphate but also of Ca at harvest [47]. Moreover, Ca accumulation in tubers of both varieties increased K content (although not significantly in Rossi with Ca(NO3)2), providing evidence of a similar accumulation pattern (Table 1). Thus, our data strongly point out that, as Ca and K have somewhat similar chemical properties (size, charge, geometry of coordination and electronic configuration [48]), competition prevails for the same sites of transport within the tissues of tubers [46]. This trend in potato tubers might link intracellular Ca levels, determining that Ca channels located within the root epidermis and root hair zone can be activated by hyperpolarization of plasma membrane controlling K content through Ca sensing, namely calmodulin, calmodulin-like protein, calcium-dependent protein kinase, and calcineurin B-like protein [25]. In addition, as external Ca2+ alters the selectivity of nonselective cation channels, favoring the uptake of K+, which is one of the main competitors of Na+ entrance into the roots [49], our data suggested the development of a contrasting interaction for Na+ accumulation in both varieties (Table 1). Indeed, although salinity reduces Ca2+ uptake and translocation, the increasing supply of Ca to both potato varieties ameliorated the deleterious effects of Na+ [50,51], favoring plant growth [52,53]. Micronutrients such as Fe and Zn play very important roles in the physiological processes of plant species [54,55,56]. Nevertheless, although in some plant species a contrasting interaction prevails between Ca or K and Fe accumulations [24,57,58], it was interesting to notice that the increasing contents of Ca and K in the potato tubers did not determine significant changes in Fe in all treatments of each variety (except with 6 kg ha−1 Ca(NO3)2) (Table 1). Thus, according to our data, potato tubers pointed to the absence of relations of a competitive nature between Ca and Fe, eventually driven by isolated or combined interactions with these macronutrients. Additionally, Zn content also did not vary significantly through the application of both fertilizers in Rossi tubers (Table 1); however, as previously found in soybean and wheat [24], relative to the control, in Agria tubers, the significantly lower levels of Zn mediated by both fertilizers suggested the potential occurrence of a contrasting pattern of interaction with Ca (Table 1). However, following a multi-level nutritional interaction approach, it is known that Zn deficiency induces the expression of several P assimilation-related genes [59], while P deficiency activates the expression of the genes involved in Zn and Fe homeostasis [60,61]. Thus, in Ca-treated tubers of both varieties P, Fe, and Zn in general did not vary significantly; it can be further assumed that the mechanisms involved in coordinating these interactions of nutrients and nutrient-stress signaling were not activated by Ca.

3.3. Accumulation in Tuber Tissue

The higher accumulation of Ca in the center of tubers of both varieties was related to the low translocation rate of Ca to the tubers after the application of both fertilizers (Figure 3). Indeed, a high translocation rate of Ca2+ (or complexed with the organic acid transport pathway) was driven in the xylem by water mass flow via the transpiration stream [7,8], to the areal part of the plants. Moreover, once uploaded from the xylem, and in particular to points downstream of transpirational flow, Ca transport cannot be readily remobilized [9] to the tubers and diffused to the peripheral regions.
The differential accumulation of Ca in tubers of both varieties, through foliar pulverization with CaCl2 and Ca(NO)3)2, did not determine significant variations in C, H, and O among tissues (Table 2). Moreover, in terms of the similar heights and diameters of tubers (Table 3), our data pointed to the absence of inhibitory interactions between Ca and these chemical elements, despite the impact observed in some photosynthesis-related parameters after the 4th Ca(NO3)2 treatment (Figure 1 and Figure 2). Indeed, C, H, and O are building blocks for proteins, lipids, starch, and other carbohydrates, lignins, and celluloses, mediated by the synthesis and mobilization of photoassimilates, determining the rate of plant growth.
The lower values of K accumulation in the epidermis of tubers (Table 3) suggest a predominant participation of this nutrient in the inner parts of the tubers, where it determines the metabolic accumulation of phytonutrients or bioactive compounds [62,63]. Indeed, unlike other nutrients, K is not incorporated into structures of organic compounds, remaining in an ionic form (K+), in a solution of cells, and has many functions in plant nutrition and growth that influence both yield and quality. These include the facilitation of cell division and growth through participation in the mobilization of starches and proteins between plant parts.
The contrasting pattern between Ca and Fe accumulation among tissues of tubers in all treatments (epidermis and the central region of the tubers, respectively—Table 2; Figure 4) followed a pattern previously found in other plant species [64] for both Fe uptake and transport between plant organs. Indeed, Fe uptake prevails in the root tips and is metabolically controlled, its translocation being largely mediated by Ca citrate chelates [4,64,65].
Uptake and translocation of Mn, like Ca, is also metabolically controlled [65,66,67,68], yet the differential concentrations in the tissues of tubers from both varieties (i.e., higher levels of Mn and Ca in the epidermis and the parenchyma tissues in the center, respectively—Table 2; Figure 4) also suggest a contrasting pattern of accumulation between these chemical elements. Indeed, it was interesting to notice a similar pattern, at organ levels, among these nutrients in other plant species [69,70]. Moreover, the absence of a clear trend of Mn accumulation within each treatment additionally suggests the parallel occurrence of a passive transport within tissues. Indeed, generally, Mn is known to be rapidly transported within plant tissues without being bound to insoluble organic ligands [65].
Root uptake of Zn is mostly metabolically controlled (although a non-metabolic process might also occur), having high translocation rates in the form of both hydrated Zn and Zn2+, eventually also bound to light organic compounds [65,71]. In this context, the increasing accumulation of Zn in the epidermis of Ca-treated tubers in most treatments (4 kg ha−1 Ca(NO3)2 and 6 kg ha−1 CaCl2 for both varieties and in the 3 kg ha−1 CaCl2 treatment for Rossi), in parallel with the lowest levels of Ca (Table 1; Figure 3), suggests an increasing rate of passive Zn absorption. Moreover, the decreasing accumulation of Zn from the epidermis to the center of tubers in each Ca treatment (except for the control and the 2 kg ha−1 Ca(NO3)2 treatment in both varieties and the 3 kg ha−1 CaCl2 treatment in Agria), seems to indicate a contrasting pattern of accumulation, prevailing in the center of tubers (Figure 3). In fact, this interaction was previously found in the organs of several plant species [46].
Depending on plant species, active or passive Cu uptake mechanisms can prevail, conditioning the metabolic pathways [65,72,73]. In this context, the interactions between Cu and Ca are highly complex and apparently are cross-linked with the accumulation kinetics of other nutrients in the different regions of the tubers. Nevertheless, the well-known affinity of carbonates to precipitate Cu and its relatively low mobility within root cells [65,73,74] seem to determine a higher accumulation of Cu in the epidermis, whereas Ca prevails in the center of tubers among treatments and in both varieties (Table 1; Figure 3).
It has long been known that differential mineral concentrations might be causing variations in color intensity or different coloring in potato tubers, namely black by ferrous compounds, discoloration by K or Mg deficiency, and reddish-brown color mediated by Cu treatments [75,76]. Nevertheless, it was interesting to notice that Ca, directly or through interactions with other nutrient accumulations, or via differential deposition in the tissues of potato tubers, did not promote color changes in either variety treated with either fertilizer (except in the a* parameter for the Rossi variety).

4. Materials and Methods

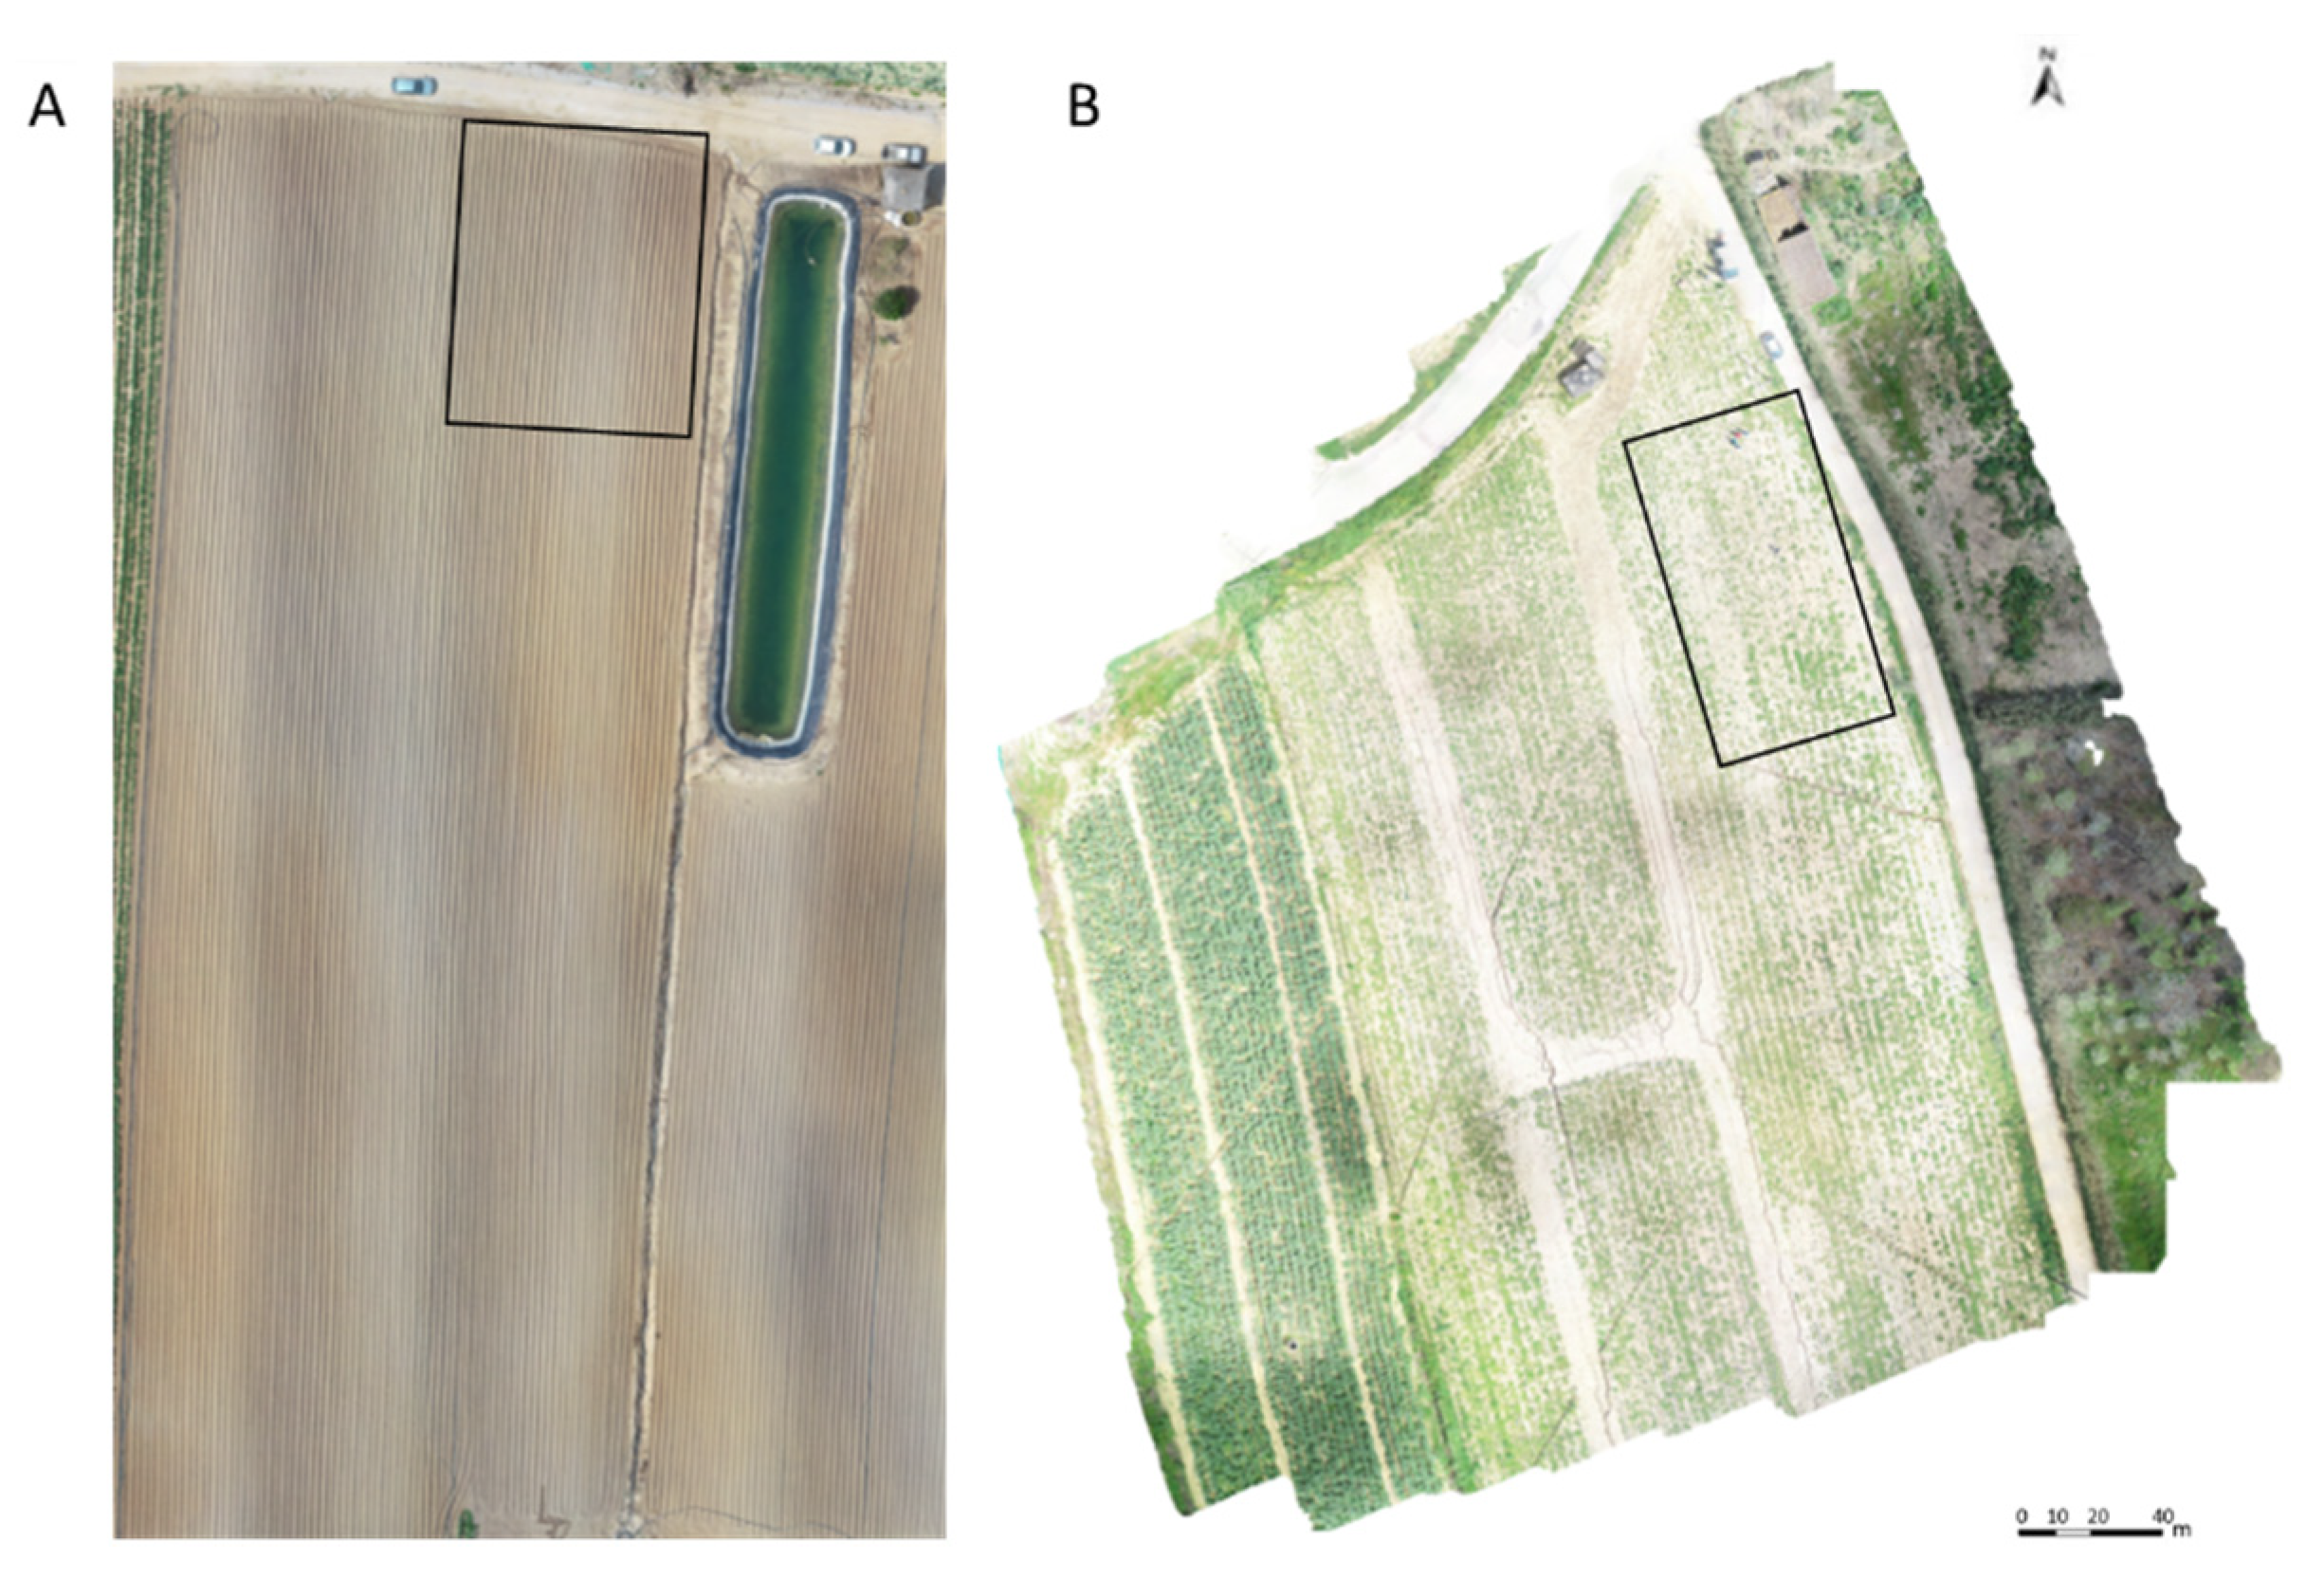
4.1. Experimental Fields

Solanum tuberosum L. varieties Agria and Rossi were cultivated in a potato production region of the west of Portugal (GPS coordinates 39°16′38.77″ N; 9°15′8.294″ W for Agria variety; 38°16′31.76″ N; 9°13′46.77″ W for Rossi variety). Both fields were situated 133 m above sea level, having soils with pH of 7.4, a clay loam texture and an electrical conductivity of 205 and 349 µS cm−1 and 0% and 4% of carbonates (for Agria and Rossi, respectively). The contents of nutrients in the soils for Agria and Rossi cultivation were: 0.39% and 0.71% of Ca, 2.20% and 2.64% of K, 0.15% and 0.24% of Mg, 0.23% and 0.19% of P, 1.19% and 0.50% of Fe, 55.9 and 66.6 ppm of S, 19.6 and 41.7 ppm of Zn, and 318 and 270 ppm of Mn, respectively. Additionally, organic matter content was 1.18% and 4.13% for the Agria and Rossi fields, respectively. Under adequate irrigation conditions (provided by sprinkler systems according to weather conditions), the production of tubers took place from 4 May to 24 September 2018. Maximum and minimum average air temperatures were 23 °C and 15 °C (with maximum and minimum values of 41 °C and 6 °C, respectively), respectively. The average rainfall was 0.41 mm, with a daily maximum of 18.03 mm and an accumulation of 60.4 mm. There were no periods of rain after any of the foliar applications in both fields.
After the beginning of tuberization (in the beginning of July for Agria and end of July for Rossi), four foliar sprayings with CaCl2 (3 and 6 kg ha−1) or Ca(NO3)2 (2 and 4 kg ha−1) solutions were performed (Table 4).
Control plants were sprayed with water. The experimental plots for Agria and Rossi (Figure 5) contained all treatments (control included), having been carried out in quadruplicate (compass, 60–80 cm).

4.2. Chlorophyll a Fluorescence Parameters

Agria plants were used as a test system to monitor leaf chlorophyll (Chl) a fluorescence parameters evaluated after the 3rd (7 days after the foliar application) and 4th (11 days after the foliar application) leaf applications. The analysis was carried out using a PAM-2000 system (H. Walz, Germany) as previously described [40], following the formulae discussed elsewhere for calculations [38,77,78]. Measurements were carried out in 5 independent leaves of 5 different plants per treatment. Measurements of minimal fluorescence (F0), maximal fluorescence (Fm), and maximal photochemical efficiency of photosystem (PS) PSII (Fv/Fm), were performed on overnight dark-adapted leaves. F0 was assessed using a weak light (<0.5 μmol m−2 s−1) beam, while Fm was obtained using a saturation flash of ca. 7500 μmol m−2 s−1 of actinic light for 0.8 s.
Another group of parameters were determined under photosynthetic steady-state conditions (with at least 3 to 4 h of light exposure), under natural irradiance (ca. 1200–1400 μmol m−2 s−1) and superimposed saturating flashes: Fv′/Fm′, qL, qN, Y(II), Y(NPQ), Y(NO) [38,66,67]. F0′, which was required for the quenching calculations, was measured in the dark, immediately after the actinic light was switched off and before the first fast phase of the fluorescence relaxation kinetics. Fv′/Fm′ expresses the PSII photochemical efficiency of energy conversion under light exposure. qL is the photochemical quenching based on the concept of interconnected PSII antennae, and represents the proportion of energy captured by open PSII centers and driven to photochemical events. Estimates of photosynthetic quantum yields of non-cyclic electron transfer (Y(II)), photoprotective regulated energy dissipation of PSII (Y(NPQ)), and non-regulated energy dissipation (heat and fluorescence) of PSII (Y(NO)) were also calculated, where Y(II) + Y(NPQ) + Y(NO) = 1.

4.3. Analysis of Total Nutrients by Atomic Absorption Spectrophotometry

After harvest in the experimental potato-producing fields, eight randomized samples of tubers (of similar size) from each treatment were washed, dried at 60 °C until constant weight, and ground in an agate mortar. The homogenates were further divided into four samples (n = 4), and an acid digestion procedure was performed with a mixture of HNO3-HClO4 (4:1) according to [79,80]. After filtration, total Ca, P, K, Na, Fe and Zn contents were measured in triplicate by atomic absorption spectrophotometry, using a model Perkin Elmer AAnalyst 200 (Waltham, MA, USA), and the absorbance in mg/L was determined with coupled AA WinLab software (version 32) program.

4.4. Analysis of Ca/Mg by Scanning Electron Microscope Coupled to X-ray Dispersive Energy Spectroscopy

At harvest, the tubers from all treatments, after washing with deionized water, were cut transversely at the equatorial region, and the slices dehydrated and dried in CO2, using a Balzers Union CPD 020 system. Samples thereafter were adhered to 13 mm aluminum stubs with conductive carbon adhesive pads and sputter-coated with gold to an approximate thickness of 10–15 nm, using a Polaron equipment coating unit. The Ca/Mg ratio was then determined using a scanning electron microscope (SEM) JEOL JSM-T330A model, coupled to an X-ray dispersive energy spectroscopy (EDS) device (acceleration voltage of 25 kV, beam current of 4–6 mÅ, 200 s pre-set time for spectrum acquisition, 2048 channels, 10 eV/channel, 20 keV width, Si crystal detector, protective window with Al coating) and a Tracor Northern Series II microanalyzer (Series TN5502N EDS System). To capture images, the AnalySIS 3.0 version software from Soft Imaging System GmbH (Munster, Germany) was used. The semi-quantitative chemical analyses were performed using the Quest SpectraPlus software from Thermo Noran (Karlsruhe, German). Each measurement was carried out in quadruplicate on four different potatoes cut transversely.

4.5. Analysis of Nutrients in Tissues through Fluorescence Detection

Slices with a width of 4 mm (three replicates from three independent series) from harvested tubers from all treatments were washed with deionized water, cut transversely at the equatorial region, and dried at 60 °C. Quantification of C, H, O, K, P, Fe, Mn, Zn and Cu was further carried out (four measurements per treatment in three regions of the tubers, between the peel and the core) following [81]. A µ-EDXRF system (M4 Tornado™, Bruker, Germany) was used. The X-ray generator was operated at 50 kV and 100 µA without the use of filters, to enhance the ionization of low-Z elements. All of the measurements with filters were performed with 600 µA voltage. Detection of fluorescence radiation was performed by an energy-dispersive silicon drift detector, XFlash™, with 30 mm2 sensitive area and energy resolution of 142 eV for Mn Kα. Measurements were carried out under 20 mbar vacuum conditions. These point spectra were acquired during 200 s. The measurements were performed in three replicates of three independent series.

4.6. Height, Diameter, and Colorimetric Parameters

Height and diameter were measured considering 10 randomized tubers per treatment (10 samples from each treatment) and from three independent plant series (10 × 10 × 3 measurements). The measurement of colorimetric parameters, using fixed wavelength, was carried out according to [82]. Brightness (L) and chromaticity parameters (a* and b* coordinates) were obtained with a Minolta CR 300 colorimeter (Minolta Corp., Ramsey, NJ, USA) coupled to a sample vessel (CR-A504). The system of the Commission Internationale de I’Éclaire (CIE) was applied using the illuminant D65. Parameter L represents the brightness of the sample, indicating the variation in the tonality between dark and light (range between 0—black and 100—white). Parameters a* and b* indicate color variations between red (+60) and green (−60), and between yellow (+60) and blue (−60), respectively. The null value approximation of these coordinates indicates neutral colors such as white, gray, and black. Measurements were carried out at harvest, in triplicates from three independent series.

4.7. Statistical Analysis

Data were statistically analyzed using one-way or two-way ANOVA (p ≤ 0.05) through IBM SPSS software, to assess differences between treatments and experimental periods and, based on the results, a Tukey’s test for mean comparison was performed, considering a 95% confidence level.

5. Conclusions

During tuberization, foliar spraying with CaCl2 or Ca(NO3)2 at maximum concentrations of 6 kg ha−1 and 4 kg ha−1, respectively, increased Ca accumulation in tubers (mostly in the parenchyma tissues located in the center of the equatorial region) of Agria and Rossi varieties. The Ca applications promoted minor impacts in the C assimilation pathway until the 3rd application, likely associated with a CO2 restriction to the carboxylation sites due to a clear gs decline (in all Ca treatments). In tubers of both varieties, Ca accumulation promoted a similar pattern of accumulation with K, as well as the absence of competitive interactions with P and Fe and a contrasting pattern relative to Na. Moreover, the interaction between Ca and Zn seemed to depend on the potato variety, since through application of both fertilizers, Zn content did not vary significantly in Agria, but a potential contrasting pattern occurred in Rossi. Regarding the tissues of tubers, the accumulation of K, Fe, Mn, and Zn prevailed in the epidermis, displaying a contrasting pattern relative to Ca. Moreover, the interaction between Ca and Cu accumulation was apparently cross-linked with the accumulation kinetics of other nutrients in the different regions of the tubers. Additionally, CaCl2 or Ca(NO3)2 applications did not alter colorimetric parameters in either variety.

Author Contributions

Conceptualization, A.R.F.C., J.C.R. and F.C.L.; methodology, J.C.R., F.C.L., J.M.N.S., M.S., N.L., C.G., P.L., M.F.P. and F.H.R.; software, A.R.F.C. and M.J.S.; formal analysis, A.R.F.C., M.G., R.G.L., N.L. and C.G.; investigation, A.R.F.C., A.C.M., D.D., C.C.P. and I.C.L.; resources, M.M.S., I.P.P., A.P.R. and P.S.C.; writing—original draft preparation, A.R.F.C. and F.C.L.; writing—review and editing, A.R.F.C. and F.C.L.; supervision, F.C.L.; project administration, F.C.L.; funding acquisition, F.C.L. All authors have read and agreed to the published version of the manuscript.

Funding

This work received funding from PDR2020-101-030719 and Fundação para a Ciência e a Tecnologia, I.P. (FCT), Portugal, through the research units UIDP/04035/2020 (GeoBioTec), UIDB/00239/2020 (CEF) and UID/FIS/04559/2013 (LIBPhys). This work was further supported by the grant of Fundação para a Ciência e Tecnologia (FCT) UI/BD/150806/2020.

Institutional Review Board Statement

Not applicable.

Informed Consent Statement

Not applicable.

Data Availability Statement

Not applicable.

Acknowledgments

The authors are grateful to Louricoop—Cooperativa de Apoio e Serviços do Concelho da Lourinhã—CRL—Portugal for technical assistance in the production fields.

Conflicts of Interest

The authors declare no conflict of interest.

References

  1. Wei, S.; Qin, G.; Zhang, H.; Tao, S.; Wu, J.; Wang, S.; Zhang, S. Calcium treatments promote the aroma volatiles emission of pear (Pyrus ussuriensis “Nanguoli”) fruit during post-harvest ripening process. Sci. Hortic. 2017, 215, 102–111. [Google Scholar] [CrossRef] [Green Version]
  2. Hocking, B.; Tyerman, S.D.; Burton, R.A.; Gilliham, M. Fruit calcium: Transport and physiology. Front. Plant Sci. 2016, 7, 569. [Google Scholar] [CrossRef] [PubMed] [Green Version]
  3. Taiz, L.; Zeiger, E. Plant Physiology, 3rd ed.; Sinauer Associates, Inc.: Sunderland, UK, 2002; p. 665. [Google Scholar]
  4. White, P.J. The pathways of calcium movement to the xylem. J. Exp. Bot. 2001, 52, 891–899. [Google Scholar] [CrossRef]
  5. Moore, C.A.; Bowen, H.C.; Scrase-Field, S.; Knight, M.R.; White, P.J. The deposition of suberin lamellae determines the magnitude of cytosolic Ca2+ elevation in root endodermal cells subjected to cooling. Plant J. 2002, 30, 457–466. [Google Scholar] [CrossRef] [PubMed] [Green Version]
  6. White, P.J.; Broadley, M.R. Calcium in plants. Ann. Bot. 2003, 92, 487–511. [Google Scholar] [CrossRef] [PubMed]
  7. Welch, R.M.; Shuman, L. Micronutrient nutrition of plants. CRC Crit. Rev. Plant Sci. 1995, 14, 49–82. [Google Scholar] [CrossRef]
  8. Barthakur, N.N.; Donnelly, D.J.; Habib, A. Transfer of strontium-90 and Ca-45 from medium to plant and their translocation in micropropagated potato. In Proceedings of the International Congress on the Radioecology and Ecotoxicology of Continental and Estuarine Environments, Aix en Provence, France, 1 September 2001–31 January 2003; pp. 3–7. [Google Scholar]
  9. Dayod, M.; Tyerman, S.D.; Leigh, R.A.; Gilliham, M. Calcium storage in plants and the implications for calcium biofortification. Protoplasma 2010, 247, 215–231. [Google Scholar] [CrossRef]
  10. Ziegler, H. Nature of transported substances. In Transport in Plants I: Phloem Transport. Encyclopedia of Plant Physiology; Zimmermann, M.H., Milburn, J.A., Eds.; Springer: New York, NY, USA, 1975; Volume 1, pp. 59–100. [Google Scholar] [CrossRef]
  11. Welch, R.M. Importance of seed mineral nutrition reserves in crop growth and development. In Mineral Nutrition of Crops: Fundamental Mechanisms and Implications; Rengel, Z., Ed.; Food Products Press: New York, NY, USA, 1999; pp. 2005–2226. [Google Scholar]
  12. Ho, L.; White, P.J. A cellular hypothesis for the induction of blossom and rot in tomato fruit. Ann. Bot. 2005, 95, 571–581. [Google Scholar] [CrossRef] [Green Version]
  13. Davies, H.V.; Millard, P. Fractionation and distribution of calcium in sprouting and non-sprouting potato tubers. Ann. Bot. 1985, 56, 745–754. [Google Scholar] [CrossRef]
  14. Oparka, K.J.; Davies, H.V. Subcellular localization of calcium in potato tubers. Potato Res. 1988, 31, 297–304. [Google Scholar] [CrossRef]
  15. Nelson, D.P.; Pan, W.L.; Franceschi, V.R. Xylem and phloem transport of mineral nutrients from Solanum tuberosum roots. J. Exp. Bot. 1990, 41, 1143–1148. [Google Scholar] [CrossRef]
  16. Bonomelli, C.; Gil, P.M.; Schaffer, B. Effect of soil type on calcium absorption and partitioning in young avocado (Persea americana Mill.) trees. Agronomy 2019, 9, 837. [Google Scholar] [CrossRef] [Green Version]
  17. Coelho, A.R.F.; Lidon, F.C.; Pessoa, C.C.; Marques, A.C.; Luís, I.C.; Caleiro, J.C.; Simões, M.; Kullberg, J.; Legoinha, P.; Brito, G.; et al. Can foliar pulverization with CaCl2 and Ca(NO3)2 trigger Ca enrichment in Solanum Tuberosum L. tubers? Plants 2021, 10, 245. [Google Scholar] [CrossRef] [PubMed]
  18. Lundergardh, H. Mineral Nutrition of Plants. Annu. Rev. Biochem. 1934, 3, 485–498. [Google Scholar] [CrossRef]
  19. Wall, M.E. The role of potassium in plants: III. Nitrogen and carbohydrate metabolism in potassium-deficient plants supplied with either nitrate or ammonium nitrogen. Soil Sci. 1940, 49, 393–408. [Google Scholar] [CrossRef]
  20. Ishizuka, Y.; Tanaka, A. Studies on the metabolism of nutritional elements in rice plants. J. Sci. Soil Manure 1960, 31, 491–494. [Google Scholar]
  21. Soliman, M.F.; Kostandi, S.F.; van Beusichem, M.L. Influence of sulfur and nitrogen fertilizer on the uptake of iron, manganese, and zinc by corn plants grown in calcareous soil. Commn. Soil Sci. Plant Anal. 1992, 23, 1289–1300. [Google Scholar] [CrossRef]
  22. Kawasaki, T. Metabolism and physiology of calcium and magnesium. Sci. Rice Plant. Tokyo Food Agric. Policy Res. Cent. 1995, 2, 412–419. [Google Scholar]
  23. Fageria, N.K. Ionic interactions in rice plants from dilute solutions. Plant Soil 1983, 70, 309–316. [Google Scholar] [CrossRef]
  24. Fageria, N.K.; Baligar, V.C. Growth and nutrient concentrations of common bean, lowland rice, corn soybean, and wheat at different soil pH on an Inceptisol. J. Plant Nutr. 1999, 22, 1495–1507. [Google Scholar] [CrossRef]
  25. Wang, Y.; Zhang, X.; Wang, Y.; Yang, S.; Qu, H. The changes of intracellular calcium concentration and distribution in the hard end pear (Pyrus pyrifolia cv. “Whangkeumbae”) fruit. Cell Calcium 2018, 71, 15–23. [Google Scholar] [CrossRef] [PubMed]
  26. de Valença, A.W.; Bake, A.; Brouwer, I.D.; Giller, K.E. Agronomic biofortification of crops to fight hidden hunger in sub-Saharan Africa. Glob. Food Sec. 2017, 12, 8–14. [Google Scholar] [CrossRef]
  27. Ozgen, S.; Palta, J.P. Supplemental calcium application influences potato tuber number and size. HortScience 2004, 40, 102–105. [Google Scholar] [CrossRef] [Green Version]
  28. PEI-Nutrient Management, Prince Edward Island, Canada. 2014. Available online: www.gov.pe.ca/agriculture/labservices (accessed on 1 June 2021).
  29. El-Hadidi, E.M.; El-Dissoky, R.A.; Abdelhafez, A.A.H. Foliar calcium and magnesium application effect on potato crop grown in clay loam soils. JSSAE 2017, 8, 1–8. [Google Scholar] [CrossRef]
  30. El-Zohiri, S.S.M.; Asfour, H.E. Effects of foliar sprays of potassium, magnesium and calcium on yield, quality and storageability of potato. In Proceedings of the Fifth International Congress of Suastain Agriculture Development 2009, Fayoum, Egypt, 21–23 December 2009; Faculty of Agriculture, Fayoum University: Faiyum, Egypt, 2009; pp. 57–71. [Google Scholar]
  31. Seifu, Y.W.; Deneke, S. Effect of calcium chloride and calcium nitrate on potato (Solanum tuberosum L.) growth and yield. J. Hortic 2017, 4, 207. [Google Scholar] [CrossRef] [Green Version]
  32. Sehgal, A.; Sita, K.; Kumar, J.; Kumar, S.; Singh, S.; Siddique, K.H.M.; Nayyar, H. Effects of drought, heat and their interaction on the growth, yield and photosynthetic function of lentil (Lens culinaris Medikus) genotypes varying in heat and drought sensitivity. Front. Plant Sci. 2017, 8, 1776. [Google Scholar] [CrossRef] [Green Version]
  33. Urban, O.; Hlaváčová, M.; Klem, K.; Novotná, K.; Rapantová, B.; Smutná, P.; Horáková, V.; Hlavinka, P.; Trnka, M. Combined effects of drought and high temperature on photosynthetic characteristics in four winter wheat genotypes. Field Crop. Res. 2018, 223, 137–149. [Google Scholar] [CrossRef]
  34. Dubberstein, D.; Lidon, F.C.; Rodrigues, A.P.; Semedo, J.N.; Marques, I.; Rodrigues, W.P.; Gouveia, D.; Armengaud, J.; Semedo, M.C.; Martins, S.; et al. Resilient and sensitive key points of the photosynthetic machinery of Coffea spp. to the single and superimposed exposure to severe drought and heat stresses. Front. Plant Sci. 2020, 11, 1049. [Google Scholar] [CrossRef]
  35. Ramalho, J.C.; Rebelo, M.C.; Santos, M.E.; Antunes, M.L.; Nunes, M.A. Effects of calcium deficiency on Coffea arabica. Nutrient changes and correlation of calcium levels with some photosynthetic parameters. Plant Soil 1995, 172, 87–96. [Google Scholar] [CrossRef]
  36. Hochmal, A.K.; Schulze, S.; Trimpelt, K.; Hippler, M. Calcium-dependent regulation of photosynthesis. Biochim. Biophys. Acta 2015, 1847, 993–1003. [Google Scholar] [CrossRef] [Green Version]
  37. Wang, X.; Hao, L.; Zhu, B.; Jiang, Z. Plant Calcium signaling in response to potassium deficiency. Int. J. Mol. Sci. 2019, 19, 3456. [Google Scholar] [CrossRef] [PubMed] [Green Version]
  38. Schreiber, U. Pulse-Amplitude-Modulation (PAM) fluorometry and saturation pulse method: An overview. Chlorophyll Fluoresc. 2004, 19, 279–319. [Google Scholar] [CrossRef]
  39. Ramalho, J.C.; Zlatev, Z.S.; Leitão, A.E.; Pais, I.P.; Fortunato, A.; Lidon, F.C. Moderate water stress causes different stomatal and non-stomatal changes in the photosynthetic functioning of Phaseolus vulgaris L. genotypes. Plant Biol. 2014, 16, 133–146. [Google Scholar] [CrossRef] [PubMed]
  40. Rodrigues, W.P.; Martins, M.Q.; Fortunato, A.S.; Rodrigues, A.P.; Semedo, J.N.; Simões-Costa, M.C.; Pais, I.P.; Leitão, A.E.; Colwell, F.; Goulao, L.; et al. Long-term elevated air [CO2] strengthens photosynthetic functioning and mitigates the impact of supra-optimal temperatures in tropical Coffea arabica and C. canephora species. Glob. Chang. Biol. 2016, 22, 415–431. [Google Scholar] [CrossRef]
  41. Coelho, A.R.F.; Pessoa, C.C.; Marques, A.C.; Luís, I.C.; Daccak, D.; Silva, M.M.; Simões, M.; Reboredo, F.H.; Pessoa, M.F.; Legoinha, P.; et al. Natural mineral enrichment in Solanum tuberosum L. cv. Agria: Accumulation of Ca and interaction with other nutrients by XRF analysis. Biol. Life Sci. Forum 2021, 4, 77. [Google Scholar] [CrossRef]
  42. Coelho, A.; Marques, A.; Campos Pessoa, C.; Daccak, D.; Carmo Luís, I.; Silva, M.; Simões, M.; Reboredo, F.; Pessoa, M.; Legoinha, P.; et al. Natural enrichment of Solanum tuberosum L. with calcium—Monitorization of mineral interactions in Plant Tissues. Biol. Life Sci. Forum 2022, 11, 28. [Google Scholar] [CrossRef]
  43. Weinl, S.; Held, K.; Schlücking, K.; Steinhorst, L.; Kuhlgert, S.; Hippler, M.; Kudla, J. A plastid protein crucial for Ca2+ regulated stomatal responses. New Phytol. 2008, 179, 675–686. [Google Scholar] [CrossRef]
  44. Subramanian, N.K.; White, P.J.; Broadley, M.R.; Ramsay, G. The three-dimensional distribution of minerals in potato tubers. Ann. Bot. 2011, 107, 681–691. [Google Scholar] [CrossRef] [Green Version]
  45. Drazeta, L.; Lang, A.; Hall, A.J.; Volz, R.K.; Jameson, P.E. Causes and effects of changes in xylem functionality in apple fruit. Ann. Bot. 2004, 93, 275–282.0. [Google Scholar] [CrossRef] [Green Version]
  46. Fageria, N.K. Nutrients interactions in crop plants. J. Plant Nutr. 2001, 24, 1269–1290. [Google Scholar] [CrossRef]
  47. Jacobsen, S.T. Interaction between phosphate and calcium in nutrient uptake by plant roots. Comm. Soil Sci. Plant Anal. 1979, 10, 141–152. [Google Scholar] [CrossRef]
  48. Robson, A.D.; Pitman, J.B. Interactions between Nutrients in Higher Plants; Springer: Berlin/Heidelberg, Germany, 1983; pp. 147–180. [Google Scholar]
  49. Tester, M.; Davenport, R. Na+ tolerance and Na+ transport in higher plants. Ann. Bot. 2003, 91, 503–527. [Google Scholar] [CrossRef] [PubMed]
  50. Cramer, G.R.; Läuchli, A.; Polito, V.S. Displacement of Ca2+ by Na+ from the plasmalemma of root cells: A primary response to salt stress? Plant Physiol. 1985, 79, 207–211. [Google Scholar] [CrossRef] [PubMed] [Green Version]
  51. Rengel, Z. The role of calcium in salt toxicity. Plant Cell Environ. 1992, 15, 625–632. [Google Scholar] [CrossRef]
  52. LaHaye, P.A.; Epstein, E. Salt toleration by plants: Enhancement with calcium. Science 1969, 166, 395–396. [Google Scholar] [CrossRef]
  53. Cramer, G. Sodium-calcium interactions under salinity stress. In Salinity: Environment—Plants—Molecules; Springer: Dordrecht, The Netherlands, 2002; pp. 205–227. [Google Scholar] [CrossRef]
  54. Berg, J.M.; Shi, Y. The galvanization of biology: A growing appreciation for the roles of zinc. Science 1996, 271, 1081–1085. [Google Scholar] [CrossRef]
  55. Coleman, J.E. Zinc enzymes. Curr. Opin. Chem. Biol. 1998, 2, 222–234. [Google Scholar] [CrossRef]
  56. Zhao, K.; Wu, Y. Effects of Zn deficiency and bicarbonate on the growth and photosynthetic characteristics of four plant species. PLoS ONE 2017, 12, e0169812. [Google Scholar] [CrossRef]
  57. Madero, P.; Pequerul, A.; Perez, C.; Val, J.; Monge, E. Specificity of iron in some aspects of soybean (Glicine max L.). In Optimization of Plant Nutrition; Springer: Dordrecht, The Netherlands, 1993; pp. 497–502. [Google Scholar]
  58. Lu, A.; Jing, G.; Wu, P.; Ni, J.; Jiang, S.; Zhang, Y. Rice genotype differences in nutrient status under excessive ferric iron conditions. J. Plant Nutr. 1997, 20, 1361–1373. [Google Scholar] [CrossRef]
  59. van de Mortel, J.E.; Almar, V.L.; Schat, H.; Kwekkeboom, J.; Coughlan, S.; Moerland, P.D.; Themaat, E.; Koornneef, M.; Aarts, M. Large expression differences in genes for iron and zinc homeostasis, stress response, and lignin biosynthesis distinguish roots of Arabidopsis thaliana and the related metal hyperaccumulator Thlaspi caerulescens. Plant Physiol. 2006, 142, 1127–1147. [Google Scholar] [CrossRef] [Green Version]
  60. Misson, J.; Raghothama, K.G.; Jain, A.; Jouhet, J.; Block, M.A.; Bligny, R.; Ortet, P.; Creff, A.; Somerville, S.; Rolland, N.; et al. A genome-wide transcriptional analysis using Arabidopsis thaliana Affymetrix gene chips determined plant responses to phosphate deprivation. Proc. Natl. Acad. Sci. USA 2005, 102, 11934–11939. [Google Scholar] [CrossRef] [PubMed] [Green Version]
  61. Bustos, R.; Castrillo, G.; Linhares, F.; Puga, M.I.; Rubio, V.; Pérez-Pérez, J.; Solano, R.; Leyva, A.; Paz-Ares, J. A central regulatory system largely controls transcriptional activation and repression responses to phosphate starvation in Arabidopsis. PLoS Genet. 2010, 6, e1001102. [Google Scholar] [CrossRef] [PubMed] [Green Version]
  62. Jifon, J.L.; Lester, G.E. Foliar potassium fertilization improves fruit quality of field grown muskmelon on calcareous soils in South Texas. J. Sci. Food Agric. 2009, 89, 2452–2460. [Google Scholar] [CrossRef]
  63. Lester, G.E.; Jifon, J.L.; Makus, D.J. Impact of potassium nutrition on postharvest fruit quality: Melon (Cucumis melo L.) case study. Plant Soil 2010, 335, 117–131. [Google Scholar] [CrossRef]
  64. Prajapati, J. The essential nutrient element for the crop. IJARW 2019, 1, 17–22. [Google Scholar]
  65. Pendias, A.K.; Pendias, H. Trace Elements in Soils and Plants, 3rd ed.; CRC Press LLC: Boca Raton, FL, USA; London, UK; New York, NY, USA; Washington, DC, USA, 2010; ISBN 0-8493-1575-1. [Google Scholar]
  66. Klughammer, C.; Schreiber, U. Complementary PS II quantum yields calculated from simple fluorescence parameters measured by PAM fluorometry and the saturation pulse method. PAM Appl. Notes 2008, 1, 27–35. [Google Scholar]
  67. Huang, W.; Zhang, S.; Cao, K. Cyclic electron flow plays an important role in photoprotection of tropical trees illuminated at temporal chilling temperature. Plant Cell Physiol. 2011, 52, 297–305. [Google Scholar] [CrossRef]
  68. Lidon, F.C.; Teixeira, M.G. Rice tolerance to excess Mn: Implications in the chloroplast lamellae and synthesis of a novel Mn protein. PPB 2000, 38, 969–978. [Google Scholar] [CrossRef]
  69. Foy, C.D. Plant adaptation to mineral stress problem in soils. ISJR 1983, 57, 339–392. [Google Scholar]
  70. Nazrul-Islam, A.K.M. Effects of interaction of calcium and manganese on the growth and nutrition of Epilobium hirsutum. Soil Sci. Plant Nutr. 1986, 32, 161–168. [Google Scholar] [CrossRef] [Green Version]
  71. Gupta, N.; Ram, H.; Cakmak, I. Micronutrients: Soil to SeedI. In Biofortification of Staple Crops; Kumar, S., Dikshit, H.K., Mishara, G.P., Singh, A., Eds.; Springer: Singapore, 2022; pp. 519–549. [Google Scholar] [CrossRef]
  72. Lidon, F.C.; Henriques, F.S. Effects of increasing concentrations of Cu on metal uptake kinetics and biomass yields. Soil Sci. 1992, 154, 44–49. [Google Scholar] [CrossRef]
  73. Lidon, F.C.; Henriques, F.S. Changes in the thylakoid membrane polypeptide patterns triggered by excess Cu in rice. Photosynthetica 1993, 28, 109–117. [Google Scholar]
  74. Morsch, L.; Somavilla, L.M.; Trentin, E.; Silva, K.R.; Oliveiraa, J.M.S.; Brunetto, G.; Simão, D.G. Root system structure as a criterion for the selection of grapevine genotypes that are tolerant to excess copper and the ability of phosphorus to mitigate toxicity. Plant Physiol. Biochem. 2022, 171, 147–156. [Google Scholar] [CrossRef]
  75. Lidon, F.C.; Henriques, F.S. Subcellular localisation of copper and partial isolation of copper proteins in roots from rice plants exposed to excess copper. Funct. Plant Biol. 1994, 21, 427–436. [Google Scholar] [CrossRef]
  76. Mulder, E.G. Mineral nutrition in relation to the biochemistry and physiology of potatoes: I. Effect of nitrogen, phosphate, potassium, magnesium, and copper nutrition on the tyrosine content and tyrosinase activity with particular reference to blackening of the tubers. Plant Soil 1949, 1, 59–121. [Google Scholar] [CrossRef]
  77. Kramer, D.; Johnson, G.; Kiirats, O.; Edwards, G. New flux parameters for the determination of QA redox state and excitation fluxes. Photosynth. Res. 2004, 79, 209–218. [Google Scholar] [CrossRef]
  78. Krause, G.H.; Jahns, P. Non-photochemical energy dissipation determined by chlorophyll fluorescence quenching: Characterization and function. In Papageorgiou GC, Govindjee, Chlorophyll a Fluorescence: A Signature of Photosynthesis; Springer: Dordrecht, The Netherlands, 2004; pp. 463–495. [Google Scholar]
  79. Lidon, F.C. Modulation of macronutrients uptake and translocation in Mn-treated rice in early stages of vegetative growth. J. Plant Nutr. 2001, 24, 61–74. [Google Scholar] [CrossRef]
  80. Lidon, F.C. Micronutrient uptake and translocation in Mn-treated rice. J. Plant Nutr. 2002, 25, 757–768. [Google Scholar] [CrossRef]
  81. Marques, A.C.; Lidon, F.C.; Coelho, A.R.F.; Pessoa, C.C.; Luís, I.C.; Campos, P.S.; Simões, M.; Almeida, A.S.; Pessoa, M.F.; Galhano, G.; et al. Effect of rice grain (Oryza sativa L.) enrichment with selenium on foliar leaf gas exchanges and accumulation of nutrients. Plants 2021, 10, 288. [Google Scholar] [CrossRef]
  82. Pessoa, C.C.; Lidon, F.C.; Coelho, A.R.F.; Caleiro, J.C.; Marques, A.C.; Luís, I.C.; Kullberg, J.C.; Legoinha, P.; Brito, M.G.; Ramalho, J.C.; et al. Calcium biofortification of Rocha pears, tissues accumulation and physicochemical implications in fresh and heat-treated fruits. Sci. Hortic. 2021, 277, 109834. [Google Scholar] [CrossRef]
Figure 1. Leaf chlorophyll a fluorescence parameters in S. tuberosum L. cv. Agria after the 3rd (2 August) and 4th (14 August) calcium applications. Parameters include the maximum (Fv/Fm) and actual (Fv′/Fm′) PSII photochemical efficiency, photochemical quenching coefficient (qL), and non-photochemical quenching (qN). For each parameter, the different letters after the mean values ± S.E. (n = 5) express significant differences between Ca treatments within each date (A, B), or between dates for each Ca treatment (a, b).
Plants 11 01725 g001
Figure 2. Leaf chlorophyll a fluorescence parameters in S. tuberosum L. cv. Agria after the 3rd (2 August) and 4th (14 August) calcium applications. Parameters include: the estimate of quantum yields of non-cyclic electron transport (Y(II)) of regulated energy dissipation in PSII (Y(NPQ)) and of non-regulated energy dissipation in PSII (Y(NO)). For each parameter, the different letters after the mean values ± S.E. (n = 5) express significant differences between Ca treatments within each date (A, B), or between dates for each Ca treatment (a, b).
Plants 11 01725 g002
Figure 3. Calcium concentration in S. tuberosum L. cv. Agria and Rossi at harvest, submitted to four foliar spraying applications (at 8–10 day intervals) of CaCl2 (3 and 6 kg ha−1) or Ca(NO3)2 (2 and 4 kg ha−1). Different letters after the mean values ± S.E. (three replicates of three independent series) express significant differences between Ca treatments in Agria variety (A, B), or between Ca treatments in Rossi variety (a, b). There was only a significant difference in Ca content between Agria and Rossi varieties in CaCl2 (3 kg ha−1), with Rossi content being significantly lower (*).
Plants 11 01725 g003
Figure 4. Ca/Mg ratio in the epidermis and center, in the equatorial region of tubers of S. tuberosum L. cv. Agria and Rossi at harvest, after four foliar sprayings with Ca(NO3)2 (4 kg ha−1) and CaCl2 (6 kg ha−1). The mean values (±S.E.) of Mg in Agria after spraying with Ca(NO3)2 (4 kg ha−1) and CaCl2 (6 kg ha−1) were 192 ± 8 and 192 ± 2 ppm, respectively, and in Rossi were 194 ± 4 and 194 ± 6 ppm, respectively. For each variety and treatment, corresponds to the mean of 3 replicates from 3 independent series ± S.E. Letters a, b represent significant differences between the epidermis and center of tubers of each variety and treatment (statistical analysis using the single factor ANOVA test, p ≤ 0.05).
Plants 11 01725 g004
Figure 5. Orthophoto maps of the fields in which the varieties were implemented and the biofortification treatments were carried out (Agria—(A); Rossi—(B)). The images were obtained by UAV on 18 May 2018 and 12 May 2018, respectively, for fields A and B.
Plants 11 01725 g005
Table 1. Mineral element concentrations in S. tuberosum L. cv. Agria and Rossi at harvest, submitted to four foliar sprayings (at 8–10 day intervals) with CaCl2 (3 and 6 kg ha−1) or Ca(NO3)2 (2 and 4 kg ha−1). Mean values ± S.E. (three replicates of three independent series).
TreatmentsPKNaFeZn
%%ppmppmppm
Agria
Control0.588 ± 0.209a0.272 ± 0.006c87.5 ± 1.81a114 ± 2.97a53.6 ± 9.29a
Ca(NO3)22 kg ha−10.845 ± 0.053a0.312 ± 0.003b76.6 ± 0.81b135 ± 3.22a31.8 ± 1.55b
4 kg ha−10.448 ± 0.196a0.337 ± 0.010ab69.1 ± 2.79b134 ± 6.32a29.9 ± 1.83b
CaCl23 kg ha−10.903 ± 0.114a0.370 ± 0.009a58.2 ± 1.38c123 ± 6.52a33.9 ± 0.81ab
6 kg ha−11.08 ± 0.26a0.368 ± 0.004a63.9 ± 0.84b131 ± 5.35a31.4 ± 3.51b
Rossi
Control0.433 ± 0.096a0.270 ± 0.006b86.0 ± 2.47a71 ± 15.8b26.5 ± 0.39a
Ca(NO3)22 kg ha−10.820 ± 0.052a0.279 ± 0.006b80.9 ± 1.76ab106 ± 6.13b27.2 ± 1.39a
4 kg ha−10.451 ± 0.064a0.286 ± 0.007b71.5 ± 1.57b107 ± 4.48b27.6 ± 0.43a
CaCl23 kg ha−10.811 ± 0.140a0.340 ± 0.009a72.6 ± 1.58b108 ± 3.31b26.8 ± 0.72a
6 kg ha−10.705 ± 0.284a0.362 ± 0.016a39.5 ± 3.25c183 ± 27.7a31.0 ± 1.59a
Letters a–c represent significant differences between treatments for each variety (statistical analysis using the single factor ANOVA test, p ≤ 0.05).
Table 2. Chemical element content in different parts of the equatorial region, ranging from the epidermis (1) to the center (3) in tubers of S. tuberosum L. cv. Agria and Rossi at harvest, submitted to four foliar sprayings (at 8–10 day intervals) with CaCl2 (3 and 6 kg ha−1) or Ca(NO3)2 (2 and 4 kg ha−1). Mean values ± S.E. (three replicates of three independent series).
TreatmentsRegionsCHOKFeMnZnCu
g kg−1mg kg−1
Agria
Control1419 ± 21Aa58.6 ± 2.9Aa465 ± 23Aa40.1 ± 2.0Bb1.12 ± 0.10Aa35.7 ± 1.8Ab17.5 ± 0.9Bc5.74 ± 0.29Cc
2392 ± 20Aa54.8 ± 2.7Aa435 ± 22Aa74.2 ± 3.7Ab0.15 ± 0.00Ba6.10 ± 0.31Cb22.6 ± 1.1Bb7.03 ± 0.35Bbc
3386 ± 19Aa54.0 ± 2.7 Aa429 ± 21Aa72.4 ± 3.6Ab0.10 ± 0.00Ca8.43 ± 0.42Bc27.9 ± 1.4Ab9.90 ± 0.49Aab
Ca(NO3)22 kg ha−11428 ± 21Aa59.9 ± 3.0Aa475 ± 24Aa27.9 ± 1.4Bc0.40 ± 0.00Ac37.23 ± 0.36Ab12.9 ± 0.7Bc4.17 ± 0.21Bc
2418 ± 21Aa58.4 ± 2.9Aa464 ± 23Aa50.2 ± 2.5Ac0.10 ± 0.00Bb3.27 ± 0.16Cc23.4 ± 1.2Ab8.01 ± 0.40Ab
3404 ± 20Aa56.4 ± 2.8 Aa448 ± 22Aa56.9 ± 2.9Ac0.10 ± 0.00Ba10.1 ± 0.5Bbc30.9 ± 1.5Ab10.1 ± 0.50Aab
4 kg ha−11400 ± 20Aa56.0 ± 2.8Aa445 ± 22Aa76.2 ± 3.8Aa1.42 ± 0.10Aa52.1 ± 2.6Aa37.4 ± 1.9Aa9.67 ± 0.48Ab
2328 ± 16Bb45.9 ± 2.3Aa365 ± 18Aa85.5 ± 4.3Ab0.10 ± 0.00Bb4.41 ± 0.22Cc25.1 ± 1.3Bb5.33 ± 0.27Bc
3369 ± 19Bab51.6 ± 2.6 Aa410 ± 21Aa72.1 ± 3.6Ab0.10 ± 0.00Ba6.71 ± 0.34Bc18.2 ± 0.9Cc7.83 ± 0.39Bc
CaCl23 kg ha−11375 ± 19Aa52.5 ± 2.6Aa416 ± 21ABa50.0 ± 2.5Bb0.50 ± 0.00Ab22.1 ± 1.1Ac25.3 ± 1.3ABb7.45 ± 0.37Bb
2416 ± 21Aa58.3 ± 2.9Aa462 ± 23Aa55.1 ± 2.8Bc0.10 ± 0.00Bb10.7 ± 0.5Ba19.7 ± 1.0Bb8.67 ± 0.43Bb
3363 ± 18Aa50.7 ± 2.5 Aa402 ± 20Ba76.0 ± 3.8Ab0.10 ± 0.00Ba12.1 ± 0.6Bb29.8 ± 1.5Ab13.1 ± 0.70Aa
6 kg ha−11383 ± 19Aa53.6 ± 2.7Aa426 ± 21Aa78.2 ± 3.9Ba0.80 ± 0.00Ab38.0 ± 1.9Ab40.1 ± 2.0Aa25.0 ± 1.30Aa
2363 ± 18Aab50.8 ± 2.5Aa403 ± 20Aa99.2 ± 5.0AABa0.12 ± 0.01Bb9.37 ± 0.5Ca37.6 ± 1.9Aa26.7 ± 1.30Aa
3344 ± 17Aa49.1 ± 2.4 Aa382 ± 19Aa110 ± 50BAa0.12 ± 0.01Ba18.3 ± 0.9Ba37.9 ± 1.9Aa10.7 ± 0.50Bab
Rossi
Control1425 ± 21Aa59.5 ± 3.0Aa472 ± 24Aa30.4 ± 1.5Cc0.70 ± 0.03Ab13.8 ± 0.7Ad8.77 ± 0.4Cdn.d.
2394 ± 20Aa55.1 ± 2.8Aa438 ± 22Aa65.4 ± 3.3Bb0.07 ± 0.01Bb11.5 ± 0.6Ac23.7 ± 1.2Bb0.14 ± 0.01c
3379 ± 19Aa53.1 ± 2.7 Aa421 ± 21Aa103 ± 5.0Aa0.06 ± 0.01 Ba13.2 ± 0.7Ab35.5 ± 1.8Aan.d.
Ca(NO3)22 kg ha−11426 ± 21Aa59.5 ± 3.0Aa472 ± 24Aa36.5 ± 1.8Bc0.63 ± 0.03Ab28.9 ± 1.4Ac18.3 ± 0.9ABc6.42 ± 0.32Bc
2420 ± 21Aa58.8 ± 3.0Aa467 ± 23Aa48.5 ± 2.4Bc0.04 ± 0.01Bb5.7 ± 0.28Cd15.6 ± 0.8Bc6.20 ± 0.31Bb
3371 ± 19a51.8 ± 2.6Aa411 ± 21Aa60.0 ± 3.0Ab0.08 ± 0.01Ba21.8 ± 1.1Ba25.6 ± 1.3Aa9.25 ± 0.46Aa
4 kg ha−11350 ± 18Aa49.0 ± 2.5Aa389 ± 19Aa88.0 ± 4.4Aa1.34 ± 0.07Ab71.1 ± 3.6Aa68.7 ± 3.4Aa23.00 ± 1.2Ab
2370 ± 19Aa51.7 ± 2.6Aa410 ± 21Aa29.4 ± 1.5Bd0.08 ± 0.01Bb19.7 ± 1.0Bb16.3 ± 0.8Bc5.83 ± 0.29Bb
3371 ± 19Aa51.9 ± 2.6 Aa412 ± 21Aa28.1 ± 1.4Bd0.09 ± 0.01Ba25.9 ± 1.3Ba14.3 ± 0.7Bb7.67 ± 0.38Ba
CaCl23 kg ha−11362 ± 18Aa50.6 ± 2.5Aa401 ± 20Aa80.1 ± 4.0Ba2.26 ± 0.11Aa53.2 ± 2.7Ab61.1 ± 3.1Aa32.60 ± 1.6Aa
2363 ± 18Aa50.7 ± 2.5Aa403 ± 20Aa117.0 ± 6.0Aa0.15 ± 0.01Ba57.0 ± 2.9Aa53.1 ± 2.7Aa21.10 ± 1.1Ba
3390 ± 20Aa54.6 ± 2.7 Aa433 ± 22Aa38.5 ± 1.9Ca0.06 ± 0.01Ca8.98 ± 0.45Bc18.5 ± 0.9Bb9.07 ± 0.50Ca
6 kg ha−11413 ± 21Aa57.8 ± 2.9Aa458 ± 23Aa51.3 ± 2.6Ab0.11 ± 0.01Ac13.0 ± 0.7Ad25.3 ± 0.0Ab9.83 ± 0.46Ac
2363 ± 18Aa50.8 ± 2.5Aa403 ± 20Aa30.6 ± 1.5Bd0.09 ± 0.01Aab4.9 ± 0.25Cd13.3 ± 4.4Bc8.61 ± 0.43Ab
3382 ± 19Aa53.4 ± 2.7 Aa423 ± 21Aa36.1 ± 1.8Bc0.10 ± 0.01Aa8.9 ± 0.44Bc14.2 ± 0.7Bb9.22 ± 0.46Aa
Different letters express significant differences (p < 0.05) among different tissues of each treatment (A, B, C), or within each tissue from different treatments of the same genotype (a–d). “n.d.” means not detected.
Table 3. Height, diameter, and colorimeter parameters of the fresh pulp from tubers of S. tuberosum L. cv. Agria and Rossi at harvest, submitted to four foliar sprayings (at 8–10 day intervals) with CaCl2 (3 and 6 kg ha−1) or Ca(NO3)2 (2 and 4 kg ha−1). Mean values ± S.E. (10 randomized tubers per treatment (10 samples of each treatment) and from three independent plant series).
TreatmentsHeight
(cm)
Diameter
(cm)
Color Parameters
La*b*
Agria
Control9.30 ± 0.19a5.60 ± 0.09a54.4 ± 1.31a−2.89 ± 0.17a20.5 ± 0.22a
Ca(NO3)22 kg ha−111.80 ± 0.31a5.47 ± 0.13a56.8 ± 0.86a−2.90 ± 0.13a21.3 ± 0.49a
4 kg ha−111.40 ± 0.91a4.77 ± 0.15a59.5 ± 0.36a−3.31 ± 0.07a22.3 ± 0.33a
CaCl2 3 kg ha−19.50 ± 0.19a5.70 ± 0.12a58.8 ± 0.50a−2.95 ± 0.21a22.0 ± 0.29a
6 kg ha−19.90 ± 0.68a4.73 ± 0.28a55.8 ± 1.29a−2.85 ± 0.08a21.7 ± 1.39a
Rossi
Control9.60 ± 0.32a6.24 ± 0.15a65.9 ± 1.19a−2.52 ± 0.14c16.3 ± 0.30a
Ca(NO3)22 kg ha−17.03 ± 0.53a4.50 ± 0.22a63.3 ± 0.73a−2.64 ± 0.12c14.2 ± 0.27a
4 kg ha−19.32 ± 1.58a5.50 ± 0.26a63.3 ± 1.12a−2.75 ± 0.07c15.7 ± 0.24a
CaCl23 kg ha−19.30 ± 0.32a5.65 ± 0.21a59.9 ± 2.55a−2.15 ± 0.09a15.1 ± 0.77a
6 kg ha−18.91 ± 1.17a5.61 ± 0.49a61.4 ± 1.88a−2.34 ± 0.05b15.1 ± 0.65a
Letters a–c represent significant differences between treatments for each variety (statistical analysis using the single-factor ANOVA test, p ≤ 0.05).
Table 4. Planting, foliar application, and harvest dates in Agria and Rossi varieties.
VarietiesPlantingFoliar ApplicationsHarvestTreatments
Agria4 May 20186 July 201816 July 201826 July 20183 August 20184 September 2018CaCl2 (3 and 6 kg ha−1) or, Ca(NO3)2 (2 and 4 kg ha−1)
Rossi11 May 201825 July 20183 August 201814 August 201824 September 201824 September 2018
Publisher’s Note: MDPI stays neutral with regard to jurisdictional claims in published maps and institutional affiliations.

