Article

Detection of Genomic Regions Controlling the Antioxidant Enzymes, Phenolic Content, and Antioxidant Activities in Rice Grain through Association Mapping

by
Priyadarsini Sanghamitra
1,†,
Saumya Ranjan Barik
1,†,
Ramakrushna Bastia
1,
Shakti Prakash Mohanty
1,
Elssa Pandit
1,2,
Abhisarika Behera
1,
Jyotirmayee Mishra
1,
Gaurav Kumar
1 and
Sharat Kumar Pradhan
1,*,†
1
ICAR-National Rice Research Institute, Cuttack 753006, Odisha, India
2
Department of Biosciences and Biotechnology, Fakir Mohan University, Balasore 756020, Odisha, India
*
Author to whom correspondence should be addressed.
These authors contributed equally to this work.
Plants 2022, 11(11), 1463; https://doi.org/10.3390/plants11111463
Submission received: 3 May 2022 / Revised: 23 May 2022 / Accepted: 25 May 2022 / Published: 30 May 2022
(This article belongs to the Special Issue Advances in Genetics and Breeding of Grain Crops)

Abstract

:
Because it is rich in antioxidant compounds, the staple food of rice provides many health benefits. Four antioxidant traits in rice grain, viz., catalase, CUPRAC, DPPH, FRAP and peroxidase, were mapped in a representative panel population containing 117 germplasm lines using 131 SSR markers through association mapping. Donor lines rich in multiple antioxidant properties were identified from the mapping population. The population was classified into three genetic groups and each group showed reasonable correspondence with the antioxidant traits. The presence of linkage disequilibrium in the population was confirmed from the estimated Fst values. A strong positive correlation of DPPH was established with TPC, FRAP and CUPRAC. A moderate to high mean gene diversity was observed in the panel population. Eleven significant marker-trait associations for antioxidant traits were mapped, namely, qACD2.1, qACD11.1 and qACD12.2 for DPPH; qCAT8.1 and qCAT11.1 for catalase; qFRAP11.1, qFRAP12.1 and qFRAP12.2 for FRAP; and qCUPRAC3.1, qCUPRAC11.1 and qCUPRA12.1 regulating CUPRAC. Co-localization of the QTLs for qACD11.1, qFRAP11.1 and qCUPRAC11.1 were detected, which may act as antioxidant hotspots regulating DPPH, FRAP and CUPRAC activities, respectively, while qACD12.2 and qFRAP12.1 remained close on the chromosome 12. These detected QTLs will be useful in antioxidant improvement programs in rice.

1. Introduction

Antioxidants protect the plant cell from damage and act as a defense system for maintaining the structural and functional integrity of cell [1,2]. Antioxidants also influence the seed viability, vigor and longevity by preventing seed deterioration [2,3,4]. Further, several antioxidants of rice have impressive health benefits [5,6,7]. Consumption of whole grain rice enriched with antioxidant compounds improves human health by reducing the risk of a number of chronic diseases [8,9]. Rice is used as a staple food for more than two billion people globally, and enriching grain with antioxidant compounds may be the best option to utilize rice as a health-promoting food. Moreover, improvement in antioxidants will lead to development of superior quality seeds, which will enhance rice production because good seed is a basic and vital input for crop production [10]. In addition, rice seed enriched with antioxidants (catalase and peroxidase) also enhances resilience in rice crop to stress situation [11,12,13,14]. The antioxidant traits are complex, polygenic in nature and quantitatively inherited [15]. There is a need to develop molecular markers for enhancing these phytochemicals in rice through molecular breeding approach.
In rice, ascorbate peroxidase (APx) was reported to be encoded by eight APx genes: two cytosolic isoforms encoded by OsAPx1 and OsAPx2, two peroxisome/glyoxysome isoforms encoded by OsAPx3 and OsAPx4, and chloroplastidic isoforms encoded by OsAPx5, OsAPx6, OsAPx7 and OsAPx8 [13,16]. The catalase (CAT) is encoded by a small family of three genes: CatA, CatB and CatC [13,17]. Reports on suitable marker loci for identifying these genes for catalase (CAT) and peroxidase (PEROX) are not available. However, several reports on QTL mapping are available on total phenolics content (TPC) and activity of antioxidants such as DPPH (2,2’diphenyl picryl hydrazyl), FRAP (ferric reducing antioxidant power) and CUPRAC (cupric reducing antioxidant capacity) [8,10,18,19,20]. For better understanding of these complex traits, more genes/loci need to be identified that will lead to development of trait-specific markers, which will accelerate the efforts to breed high-yielding antioxidant-rich rice varieties. The present study mainly aimed at QTL mapping of antioxidant traits, such as CAT, PEROX, TPC, DPPH, FRAP and CUPRAC activity, in rice.
Association mapping has emerged as a powerful alternative strategy for identifying genes or QTLs for various complex traits in plants in a natural variable population by examining the marker–trait associations. Mapping of complex antioxidant compounds and antioxidant activity by exploiting the naturally occurring variations through association mapping will provide QTLs that regulate the phytochemicals in rice. The genetic diversity and structure of the population in association mapping will be helpful for detecting marker–trait associations that may be useful for trait enhancement in molecular breeding programs. In order to avoid spurious marker–phenotype association, population structure (Q) with relative kinship (K) analyses are used to check and correct the panel population composition for linkage disequilibrium (LD) mapping analyses [21,22,23,24]. The association estimates based on both the generalized linear model (GLM) and mixed linear model (MLM) are considered appropriate for mapping complex traits, and have been shown to perform better than other model analysis.
In the present investigation, association mapping was performed in a panel population containing 117 genotypes (64 white and 53 red grain) shortlisted through phenotyping of six phytochemical traits (CAT, PEROX, TPC, DPPH, FRAP and CUPRAC) from 270 shortlisted diverse genotypes of India. The population was studied for the population genetic structure, diversity and association of molecular markers with these phytochemical traits.

2. Results

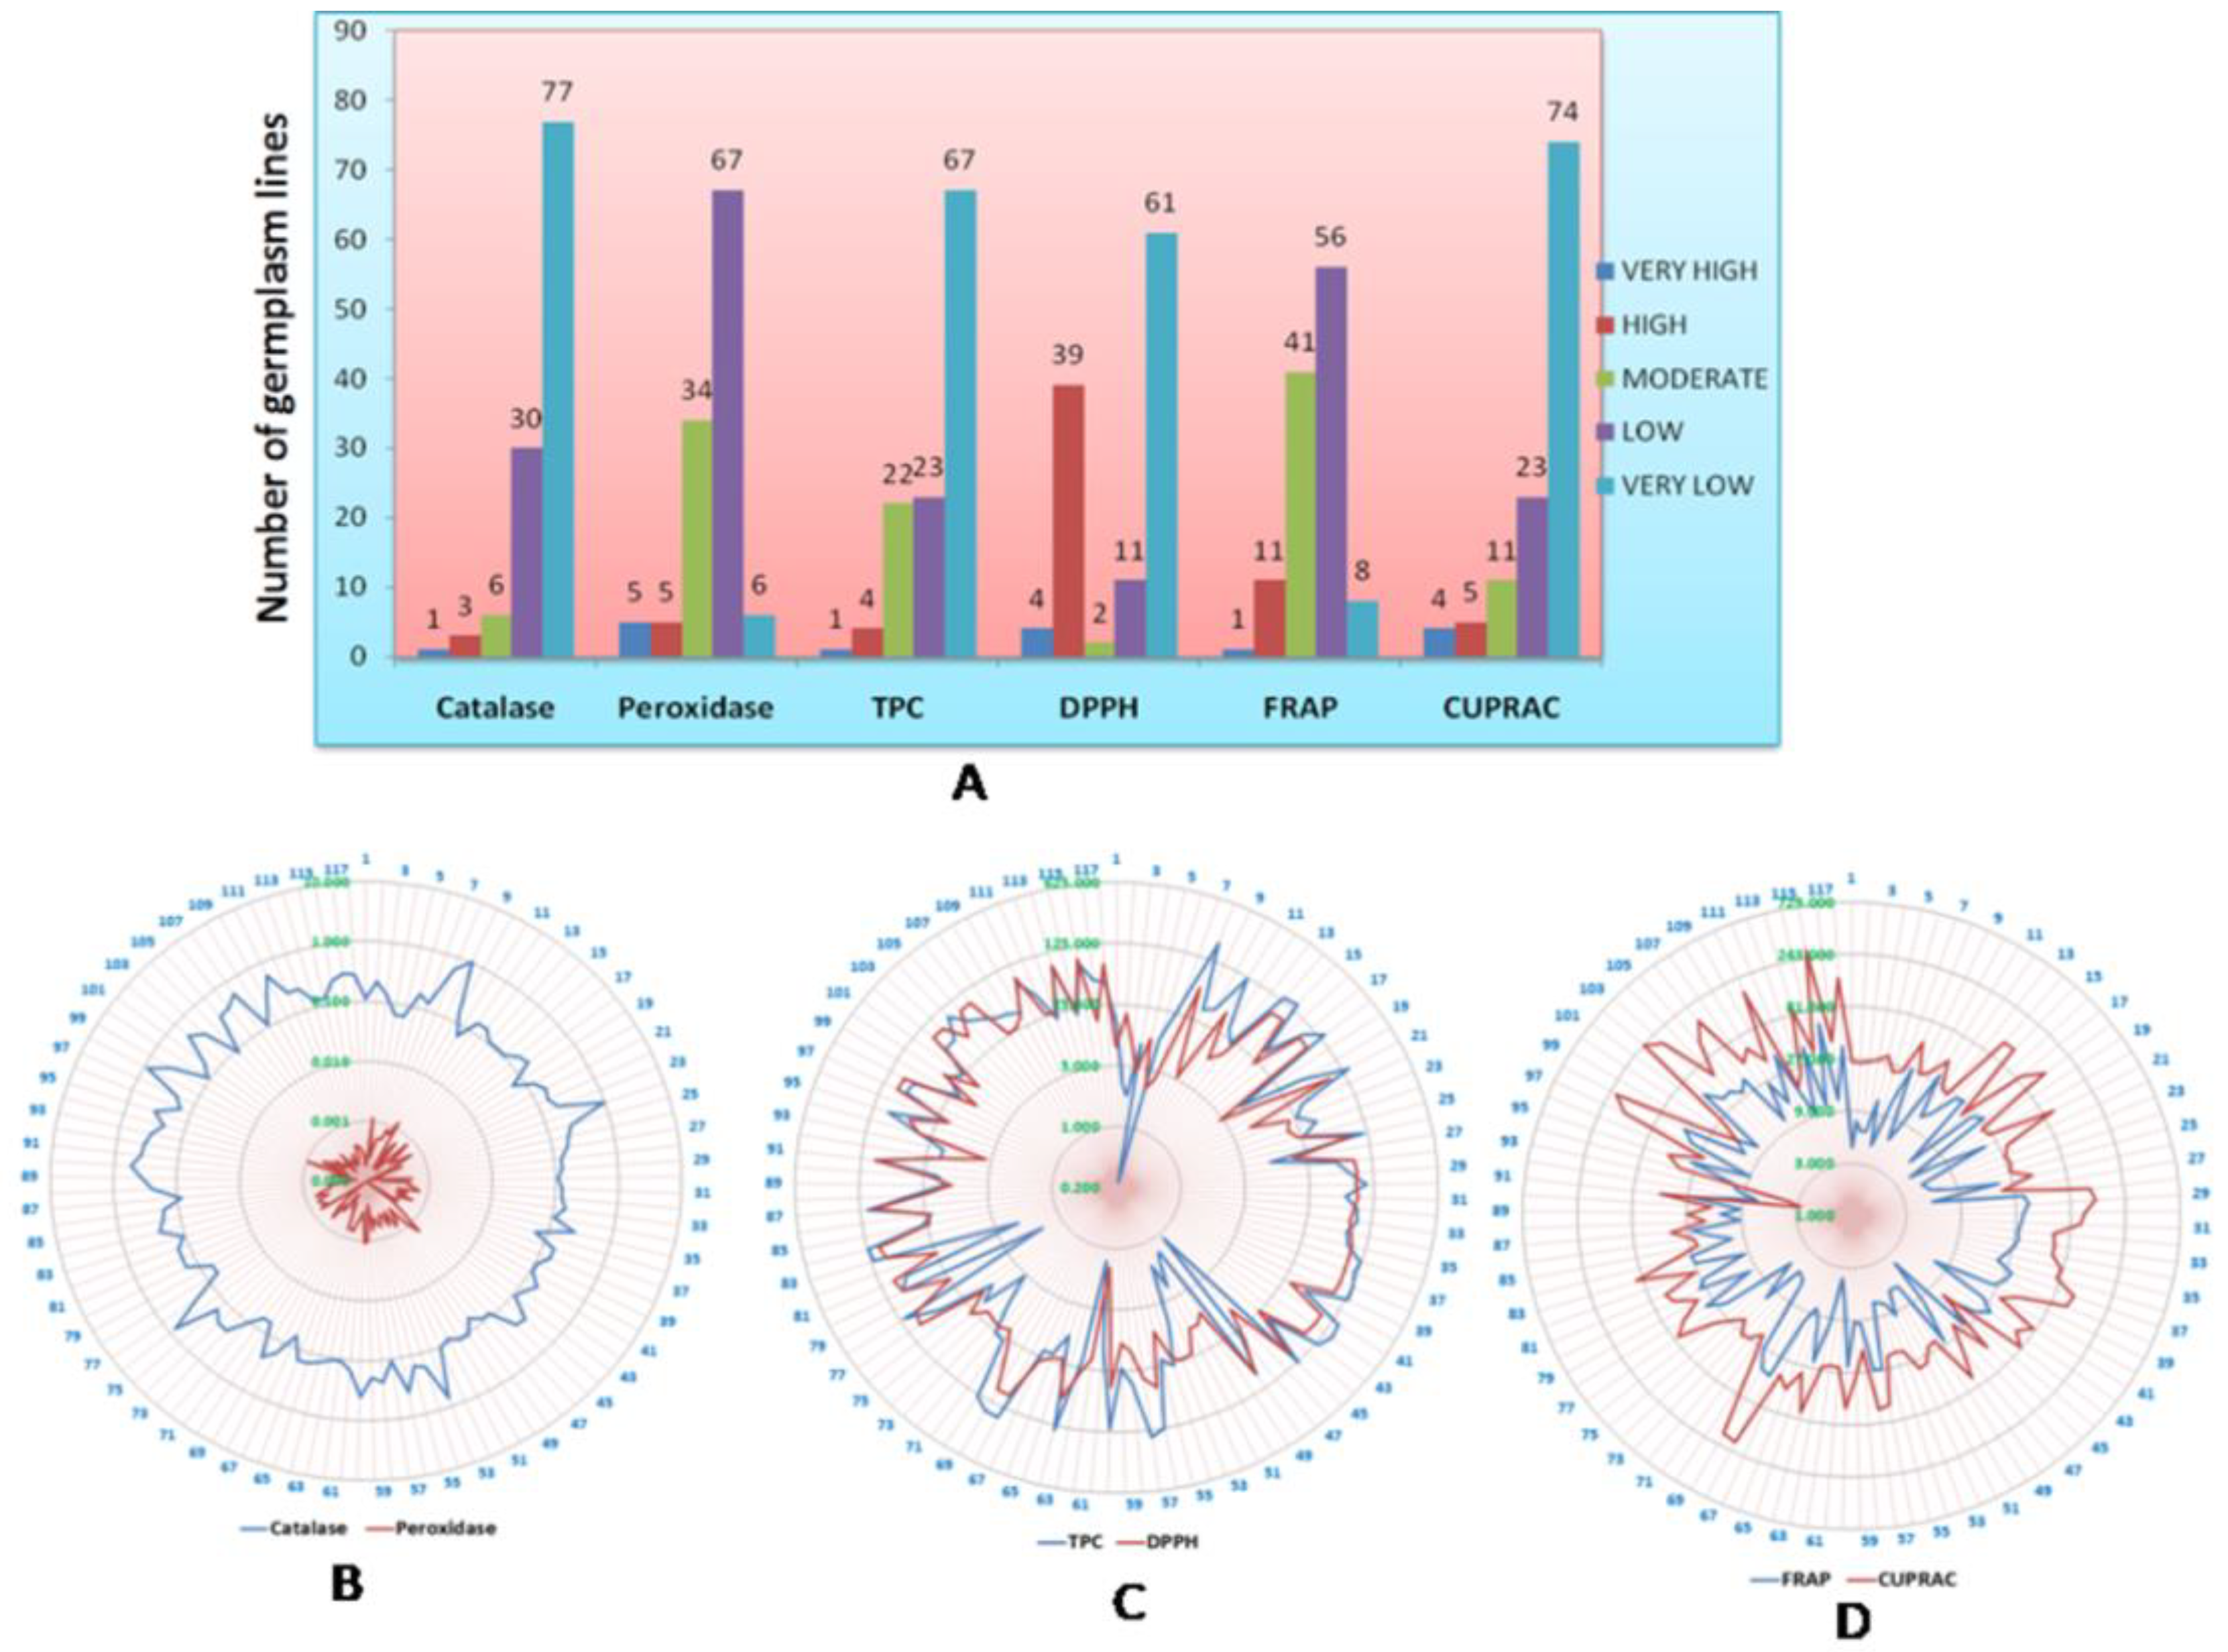
2.1. Phenotyping of the Population for Antioxidant Traits in Rice

A total of five antioxidant traits of rice grain, namely, catalase, peroxidase, DPPH, FRAP and CUPRAC, along with antioxidant compounds and phenolic content, were estimated from 270 genotypes during the wet season of 2018 (Supplementary Table S1). Wide variation was observed for the six antioxidant traits among the germplasm lines. Each antioxidant trait in the population was grouped into five classes and the germplasm lines were classified into various groups (Figure 1). The frequency distribution of each group or population is presented in Figure 1. A representative mapping population for the six antioxidant traits was developed by shortlisting 117 germplasm lines from all groups and traits from the initial 270 germplasm lines (Table 1; Figure 2). The average values of the six antioxidant traits estimated from the panel population exhibited wide variation among the germplasm lines for the studied traits (Table 1). Very high values for catalase content were observed in the germplasm lines AC.9030, Shayam, AC.9093, AC.20282, Sugandha-2, AC.44646, AC.43660 and AC.43732. Moreover, very high peroxidase concentration was estimated from the germplasm lines AC.9028, AC.9035, AC.20845, Latachaunri, AC.10608, AC.7282, AC.9053A and AC.44585. Genotypes such as Kundadhan, AC.9063 and AC.20282 showed higher phenolic content in the seeds of the panel population. The DPPH enzyme activity was found to be the predominant antioxidant enzyme activity present in the population, representing 39.32% of the population. High activity of FRAP was noticed in the seeds of the genotypes, namely, AC.20282, AC.20246, AC.44646, AC.44595, AC.44588 and AC.43660. The potential donors identified from the population containing a high level of CUPRAC for total antioxidant capacity were found in the germplasm lines AC.20282, AC.44646, AC.44595, AC.44588 and AC.43660. However, a higher level of antioxidant properties for more than 2 traits was detected in the germplasm lines Kundadhan, Latachaunri, AC.20282, AC.20246, AC.44646, AC.44595, AC.43737, AC.43660, AC.43732, AC.43738 and AC.43670.

2.2. Genotype-by-Trait Biplot Analysis for Relatedness among the Germplasm Lines for the Antioxidant Traits

The genotype-by-trait biplot diagram was generated using the first two principal components of the six antioxidant properties estimated from the mapping population of the panel containing 117 germplasm lines (Figure 3). A total of 53.14 and 19.57% of the total variability, and eigen values of 3.189 and 1.17, were estimated for the 1st and 2nd principal components, respectively (Supplementary Figure S1). Peroxidase contributed maximum diversity followed by catalase and FRAP among the six antioxidant traits studied using the panel population (Figure 3). The distribution pattern of germplasm lines in the four quadrants of the biplot indicate that genotypes carrying high concentrations of antioxidants are seen in the 1st (top right) and 2nd (bottom right) quadrants. Higher concentrations of multiple antioxidant compounds and enzymes containing germplasm lines are depicted in the circle located in these two quadrants (Figure 3). The top right (1st quadrant) and bottom right (2nd quadrant) quadrants showed the majority of the genotypes containing high antioxidant traits in the germplasm lines. The 3rd (bottom left) quadrant accommodated most of the genotypes with high catalase activity and poor activity in other antioxidants. The 4th quadrant (top left) showed a majority of the germplasm lines that were rich in DPPH activity and poor in other antioxidant enzymes and compounds (Figure 3).

2.3. Nature of Association among Antioxidant Traits

The association among six antioxidant traits revealed a strong positive correlation (r ≥ 0.7) of DPPH with TPC, FRAP and CUPRAC. Moreover, a strong correlation was noticed in FRAP with CUPRAC (Figure 4). However, TPC showed a moderate positive correlation (r: 0.5–0.7) with FRAP, but with CUPRAC a weak positive correlation (r < 0.5) was observed. Although CAT and CUPRAC showed a negative correlation with PEROX, the association was not significant (Figure 4). These positively or negatively correlated antioxidant traits may be controlled by the closely linked genes or because they may be structurally related. Therefore, a variety that accumulates high concentrations of one antioxidant may contain higher quantities of other correlated antioxidants.

2.4. Genetic Diversity Parameters Analysis

The representative mapping population containing 117 germplasm lines that exhibited wide variation for the six antioxidant traits was genotyped using 131 SSR markers. The genetic diversity parameters assessed from the panel population are shown in the Supplementary Table S2. The population showed a total of 508 marker alleles with mean alleles of 3.74 per locus detected by the genotyping results using 131 SSR markers. The number of detected alleles varied from 2 to 7 per marker per locus. The highest number of alleles was produced by the marker RM493 in the studied population for antioxidant contents in rice. The major allele frequency parameter was used for detection of variation by a marker in the population. The average major allele frequency linked to the polymorphic markers was computed to be 0.5598, with a range of 0.282 (RM493 and RM8044) to 0.923 (RM6054) (Supplementary Table S2). Informative genetic markers were detected by the PIC values. These showed a range of 0.142 (RM6054) to 0.789 (RM493), with a mean value of 0.496. The mean heterozygosity (Ho) observed from the population was 0.111, and heterozygosity varied from 0.00 to 0.957 (RM3735). A total of 23 marker loci showed a heterozygosity (Ho) value of 0.00 in the panel population. The mean gene diversity (He), which gives a measure of genetic diversity in the panel population, was 0.556, and gene diversity varied from 0.145 (RM6054) to 0.814 (RM493).

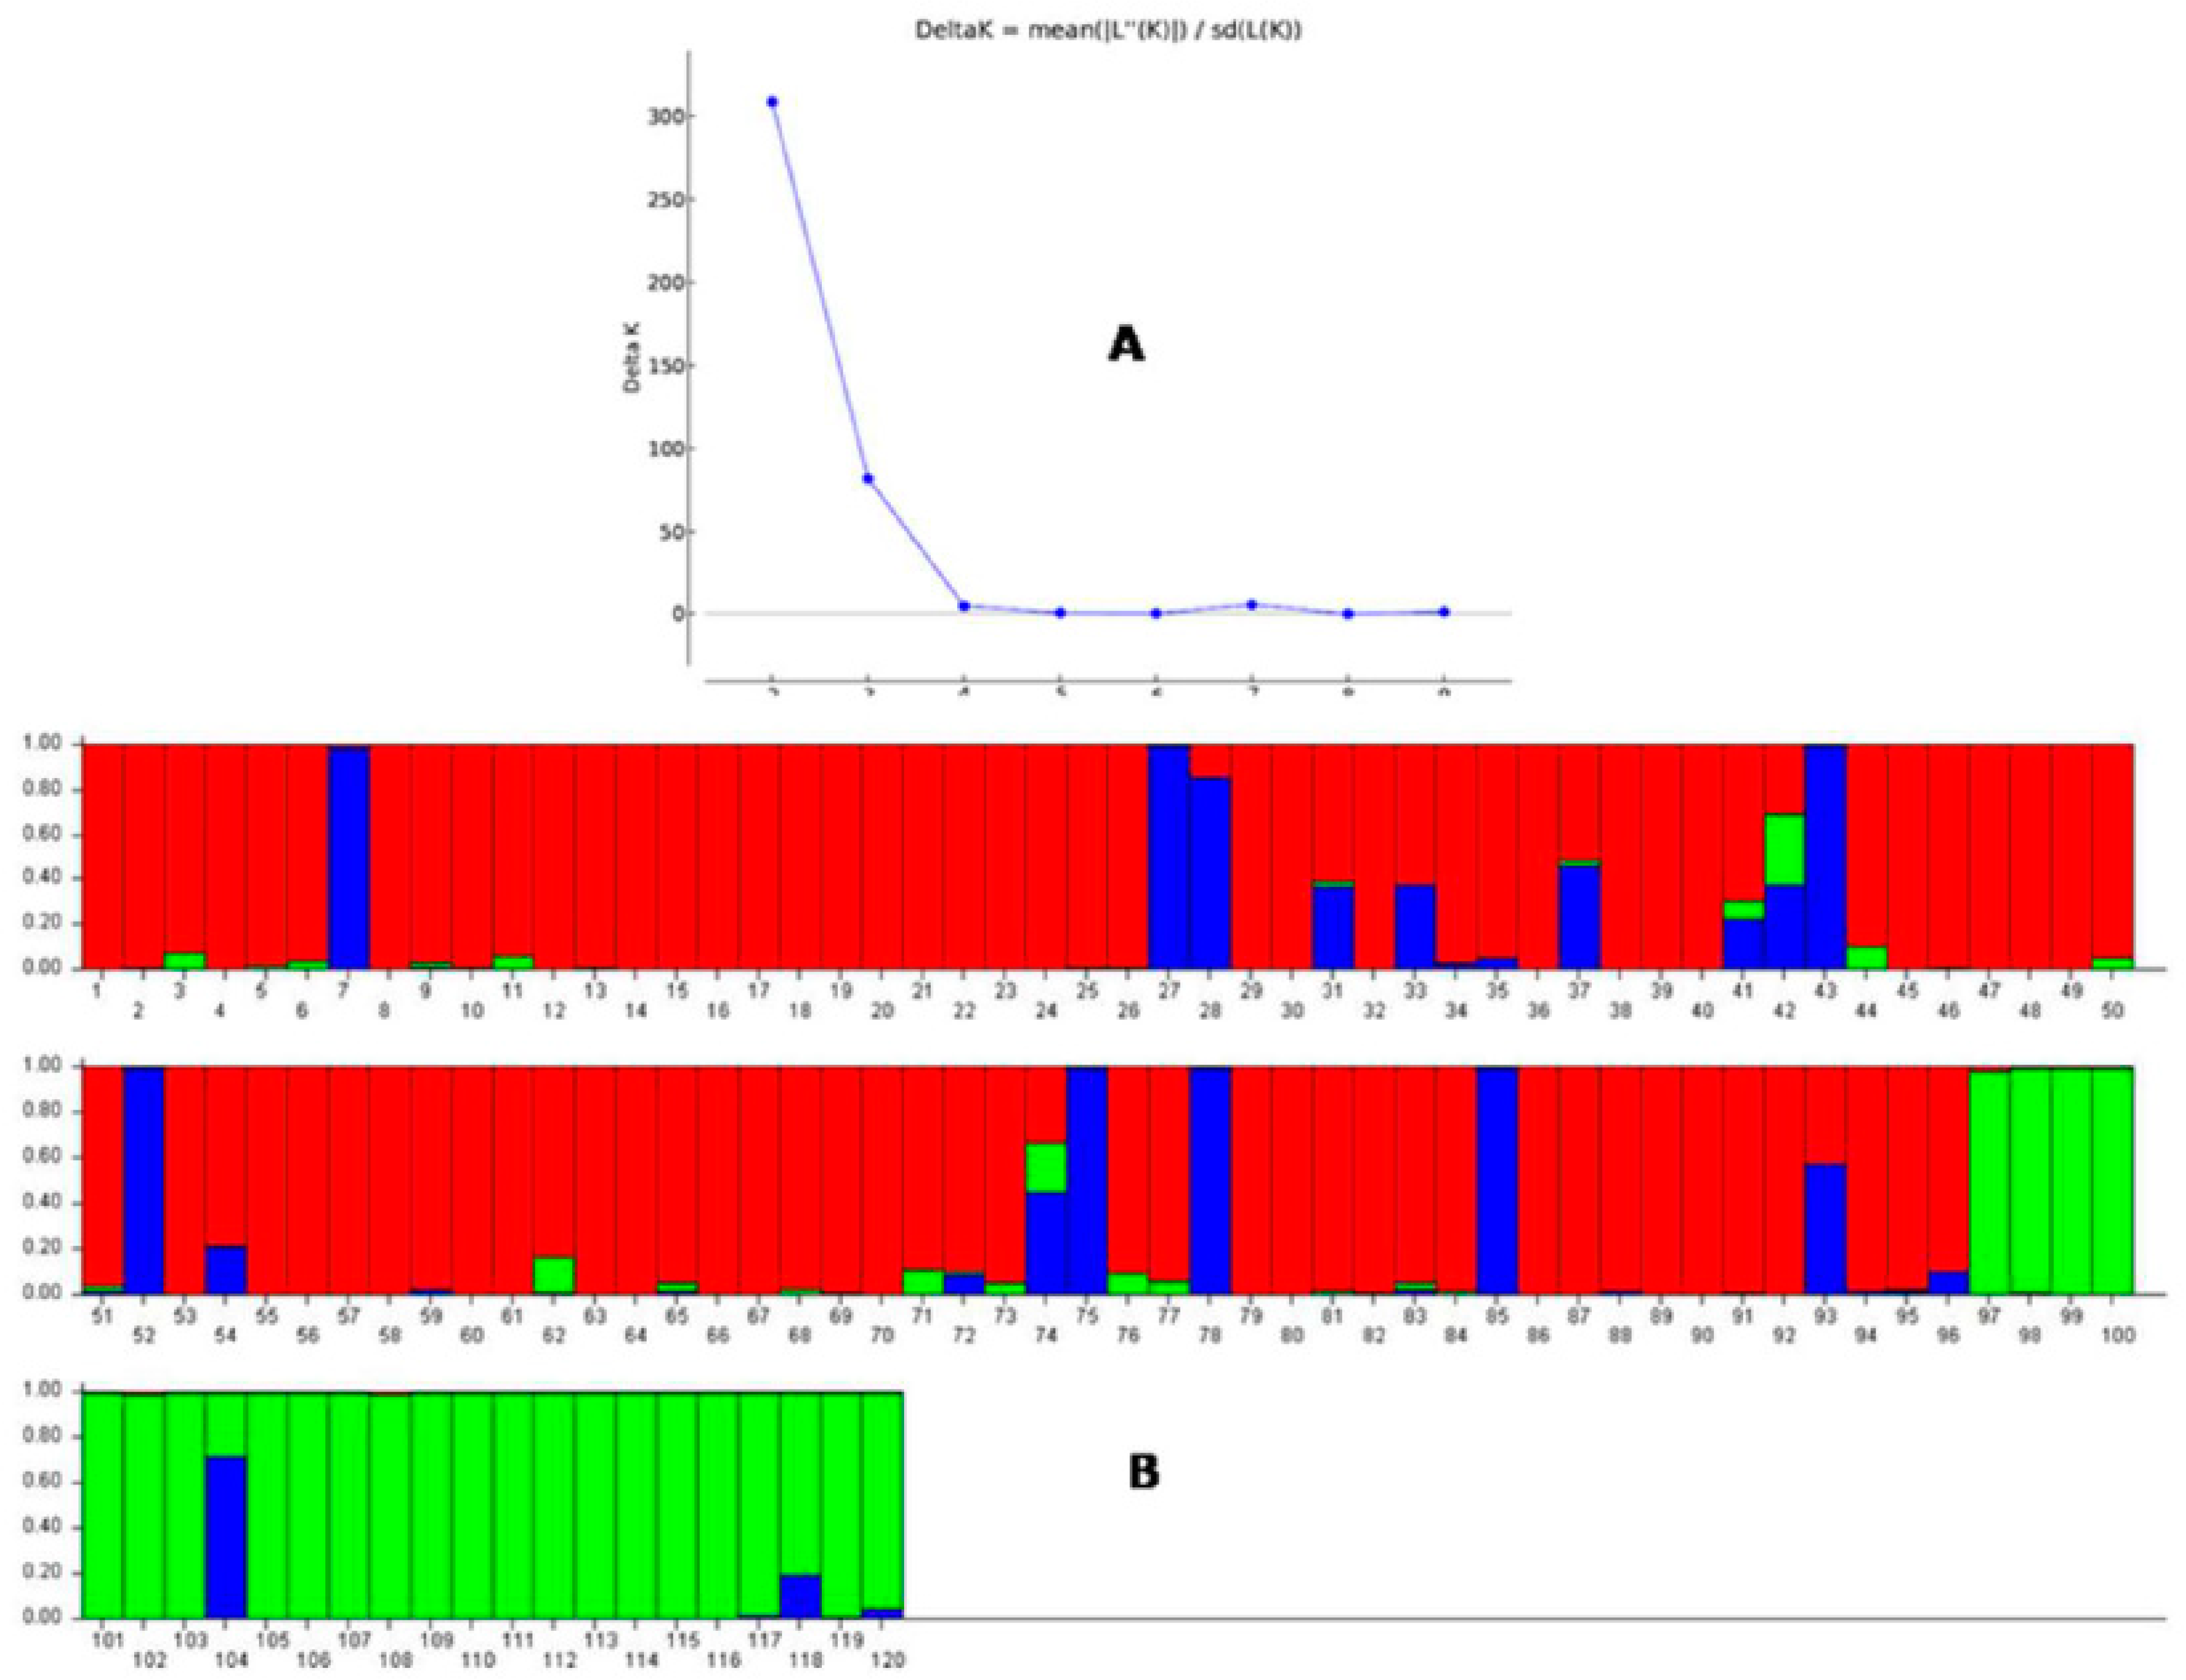
2.5. Population Genetic Structure Analysis

STRUCTURE 2.3.6 software was used for analysis of genetic structure by applying probable subpopulations (K) at a higher delta K-value in the used diverse population for the six antioxidant traits. The rate of change in the log probability of data between successive K values was the delta K value used in the analysis. The panel population was classified into two subpopulations by assuming K = 2 and using a ∆K peak value of 309.09 (Supplementary Table S3; Supplementary Figure S2). The two subpopulations were in the proportions of 0.727 and 0.273 for population 1 and population 2, respectively. The two subpopulations showed correspondence with antioxidant traits carrying genotypes present in the studied population; however, many germplasm lines were also included that did not show a correspondence with the six antioxidant traits. Therefore, the next ∆K peak value of 81.79 at K = 3 was compared, in which the population was classified into three subpopulations, and each subpopulation showed a reasonable correspondence with the majority of the members, and comparatively better correspondence than at K = 2 for the correlation of the germplasm lines with the six antioxidant traits. The three subpopulations showed proportions of the inferred cluster value of 0.69, 0.206 and 0.104 for the subpopulations 1, 2 and 3, respectively. The Fst1, Fst2 and Fst3 values were 0.168, 0.356 and 0.362 for the subpopulations 1, 2 and 3, respectively (Supplementary Table S3; Supplementary Figure S3). The ancestry value of ≥80% obtained in a genotype categorized the genotype into the particular subpopulation.
The majority of the germplasm lines with high to very high antioxidant traits were present in the subpopulation 2. The moderate value antioxidant properties containing germplasm lines were present in the subpopulation 3. The majority of the germplasm lines showing poor to moderate values for antioxidants were in subpopulation 1 (Table 2; Figure 5). A low alpha value (α = 0.0441) was estimated for the panel population by the structure analysis at K = 3. Positively skewed leptokurtic distributions were observed for the mean alpha value, whereas normally skewed leptokurtic distributions detected for each of the three Fst values of the three subpopulations showed a distinct variation in the distribution among the Fst values (Supplementary Figure S4).

2.6. Molecular Variance (AMOVA) and LD Decay Plot Analysis

Plants related by ancestry or by traits in a population are grouped into different population structures. The genetic variations within and between the subpopulations were computed at K = 3 for the analysis of molecular variance (AMOVA) (Table 3). The genetic variation among the populations estimated at K = 3 was computed to be 1%; among individuals it was 4%, and there was 95% variation within individuals in the panel population. Wright’s F statistic was used to determine the deviation from Hardy–Weinberg’s prediction. The parameter FIT for individuals within the total population for differentiation and FIS for the uniformity of individuals within the subpopulation in a population were computed. The FIS and FIT values within the population and the total population estimated on the basis of 131 marker loci were 0.045 and 0.051, respectively, whereas the total population had an FST value of 0.006 between the three subpopulations. Fst is used to indicate the subpopulations or population differentiation within the total population. A clear differentiation between the three subpopulations was observed from their distribution pattern based on the Fst values (Supplemental Figure S4).
The association of alleles by different loci in a nonrandom manner is utilized in the marker–trait association analysis. The existence of marker–trait association is dependent on the LD decay rate in a population over a time period. The LD decay rate indicates the possibility of new genes or allelic variants controlling the antioxidant compounds associated with molecular markers for these traits. The syntenic r2 value was used to plot the linkage disequilibrium decay of the population versus the physical distance in million base pairs (Figure 6A). Tightly linked markers had a higher r2 value and the average r2 values rapidly decreased as the linkage distance increased. In the LD plot, it is observed that the LD decay in the beginning was delayed in the studied panel populations. However, a decline in the LD decay can be noted in the curve for the associated markers at about 1–2 megabase pairs and, thereafter, a gradual and very slow decay can be noted. The graph clearly indicates the continuance of linkage disequilibrium decay in the population for the studied antioxidant properties in the rice population. The limitation for the LD decay depends on non-random mating, mutation, selection, migration or admixture, and genetic drift influences the estimates of LD. This LD decay plot also provides clues about the creation of genetic admixture groups for various antioxidant compounds in the normal population. A similar trend was also noted in the marker ‘P’ versus marker ‘F’, and the marker R2 (Figure 6B) curve. The detected markers from this study indicate the strength of the markers for the studied antioxidant traits.

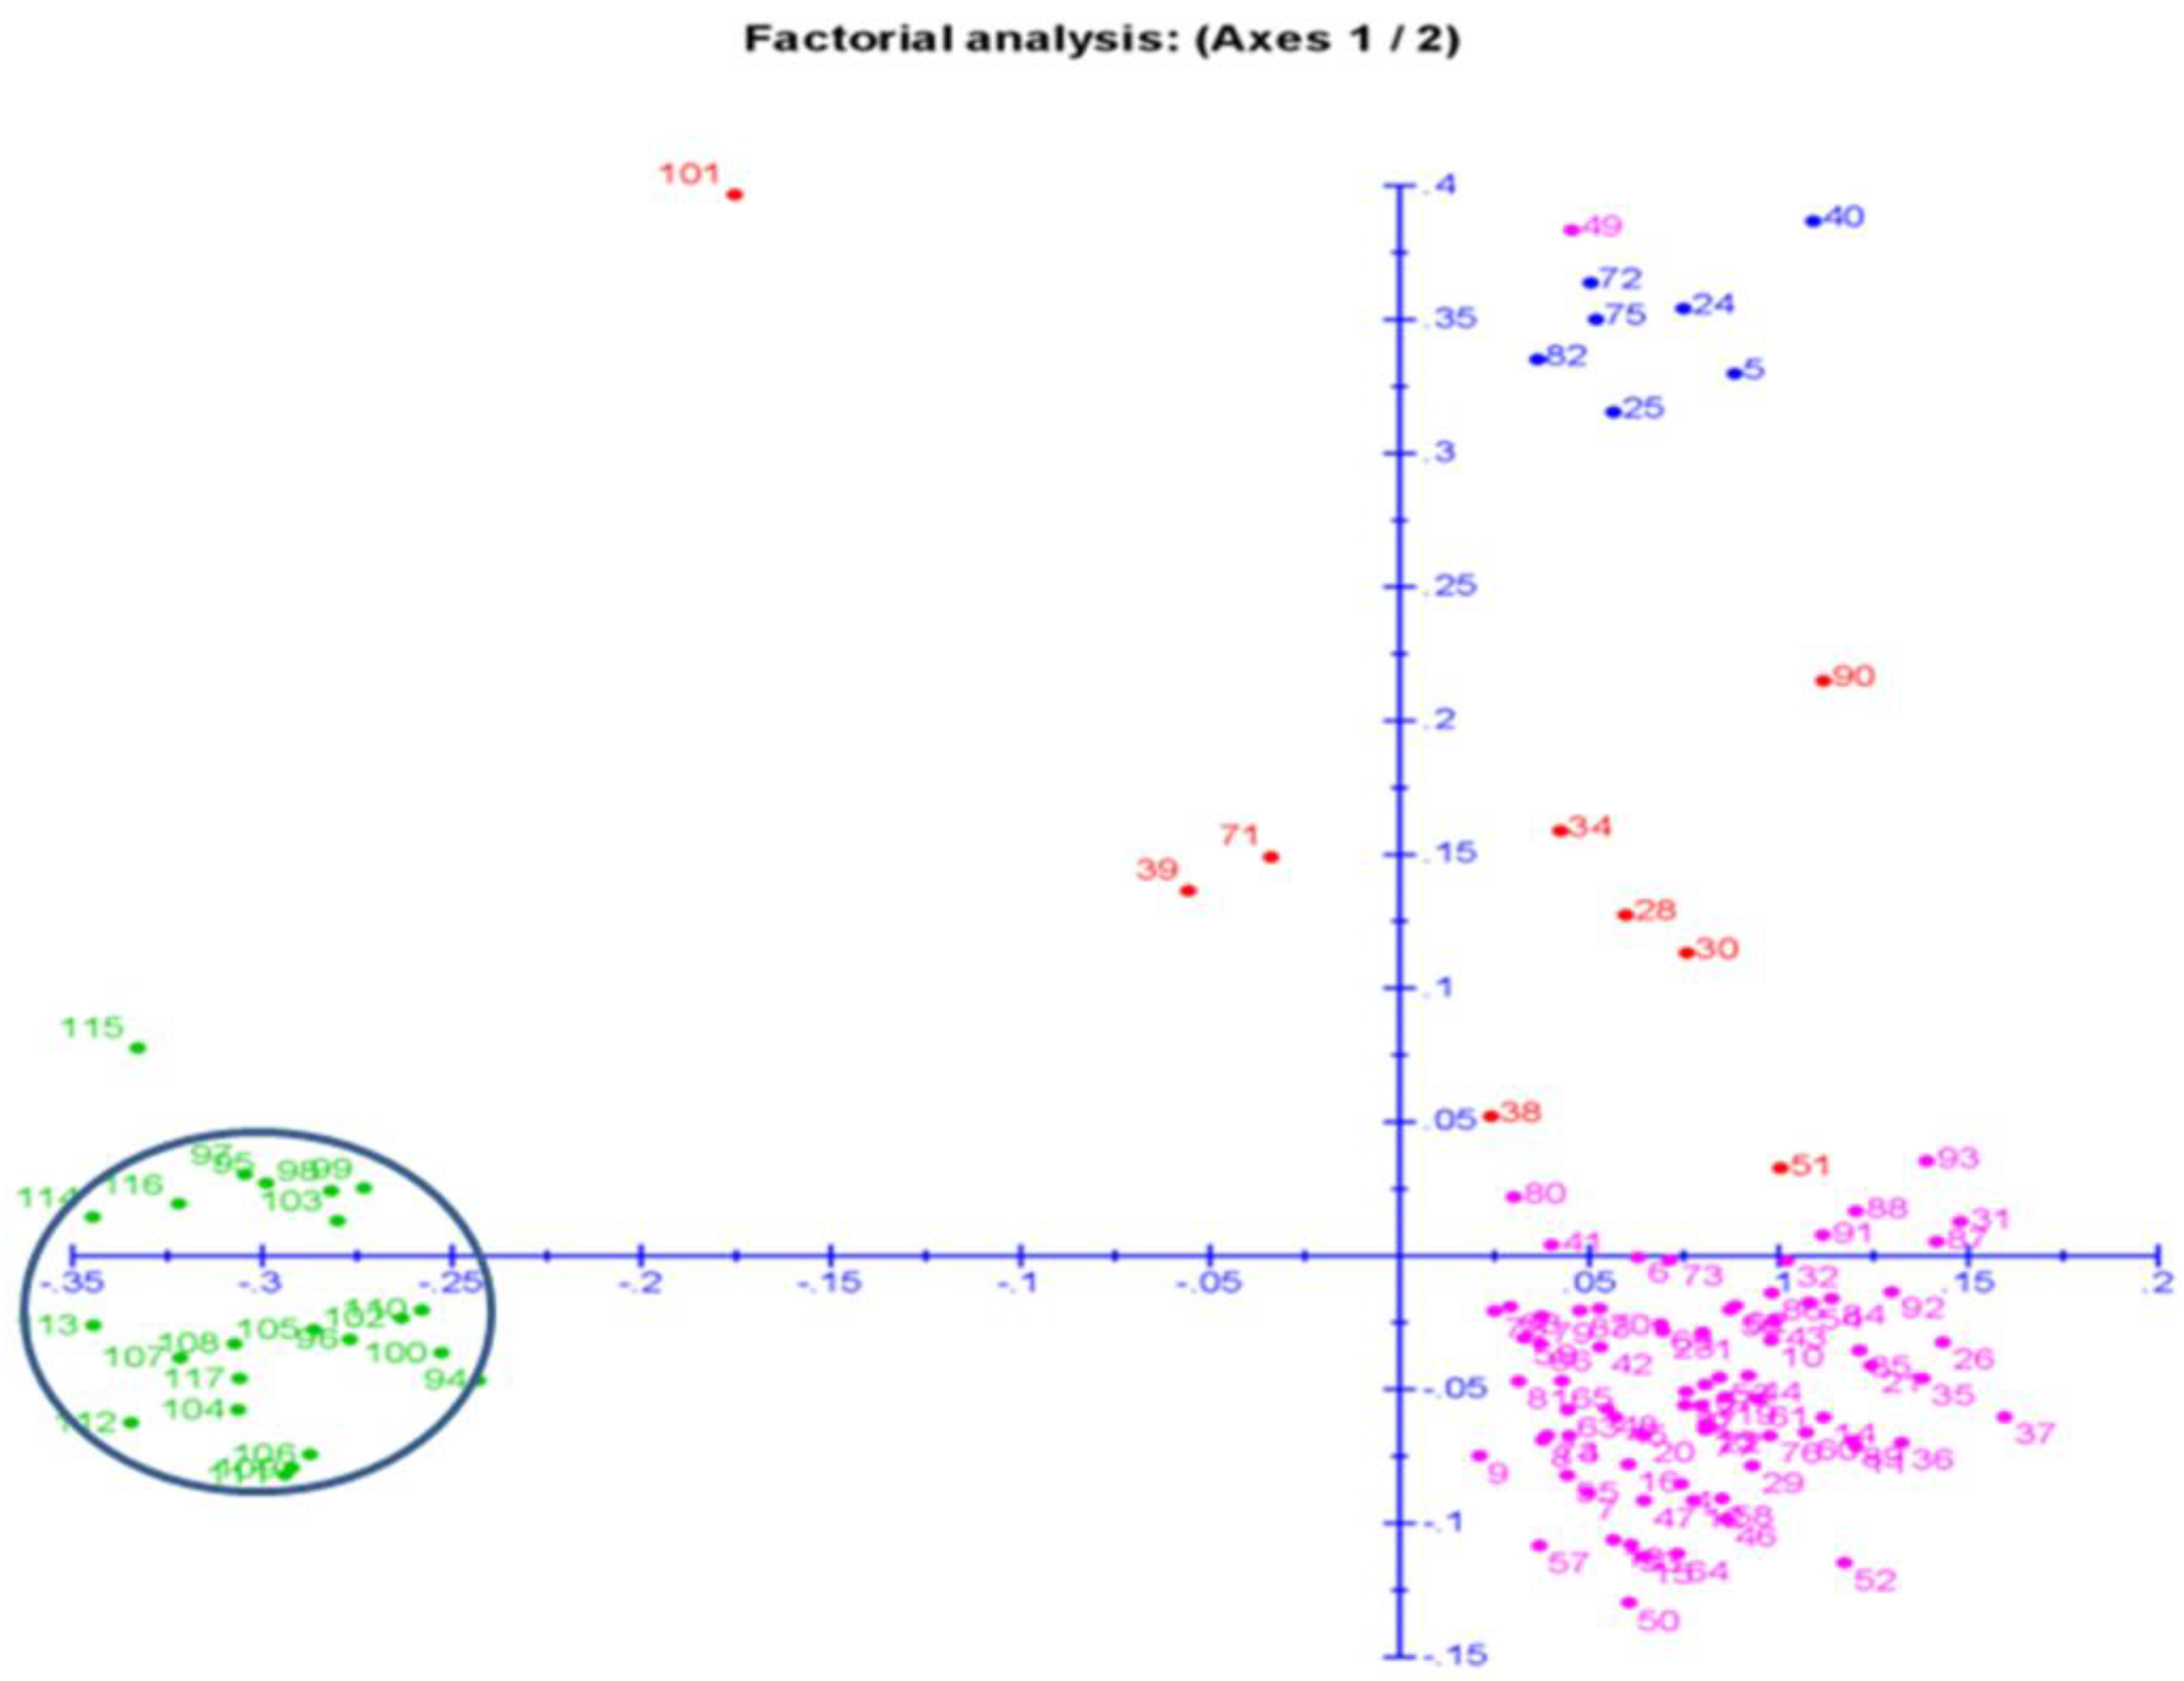
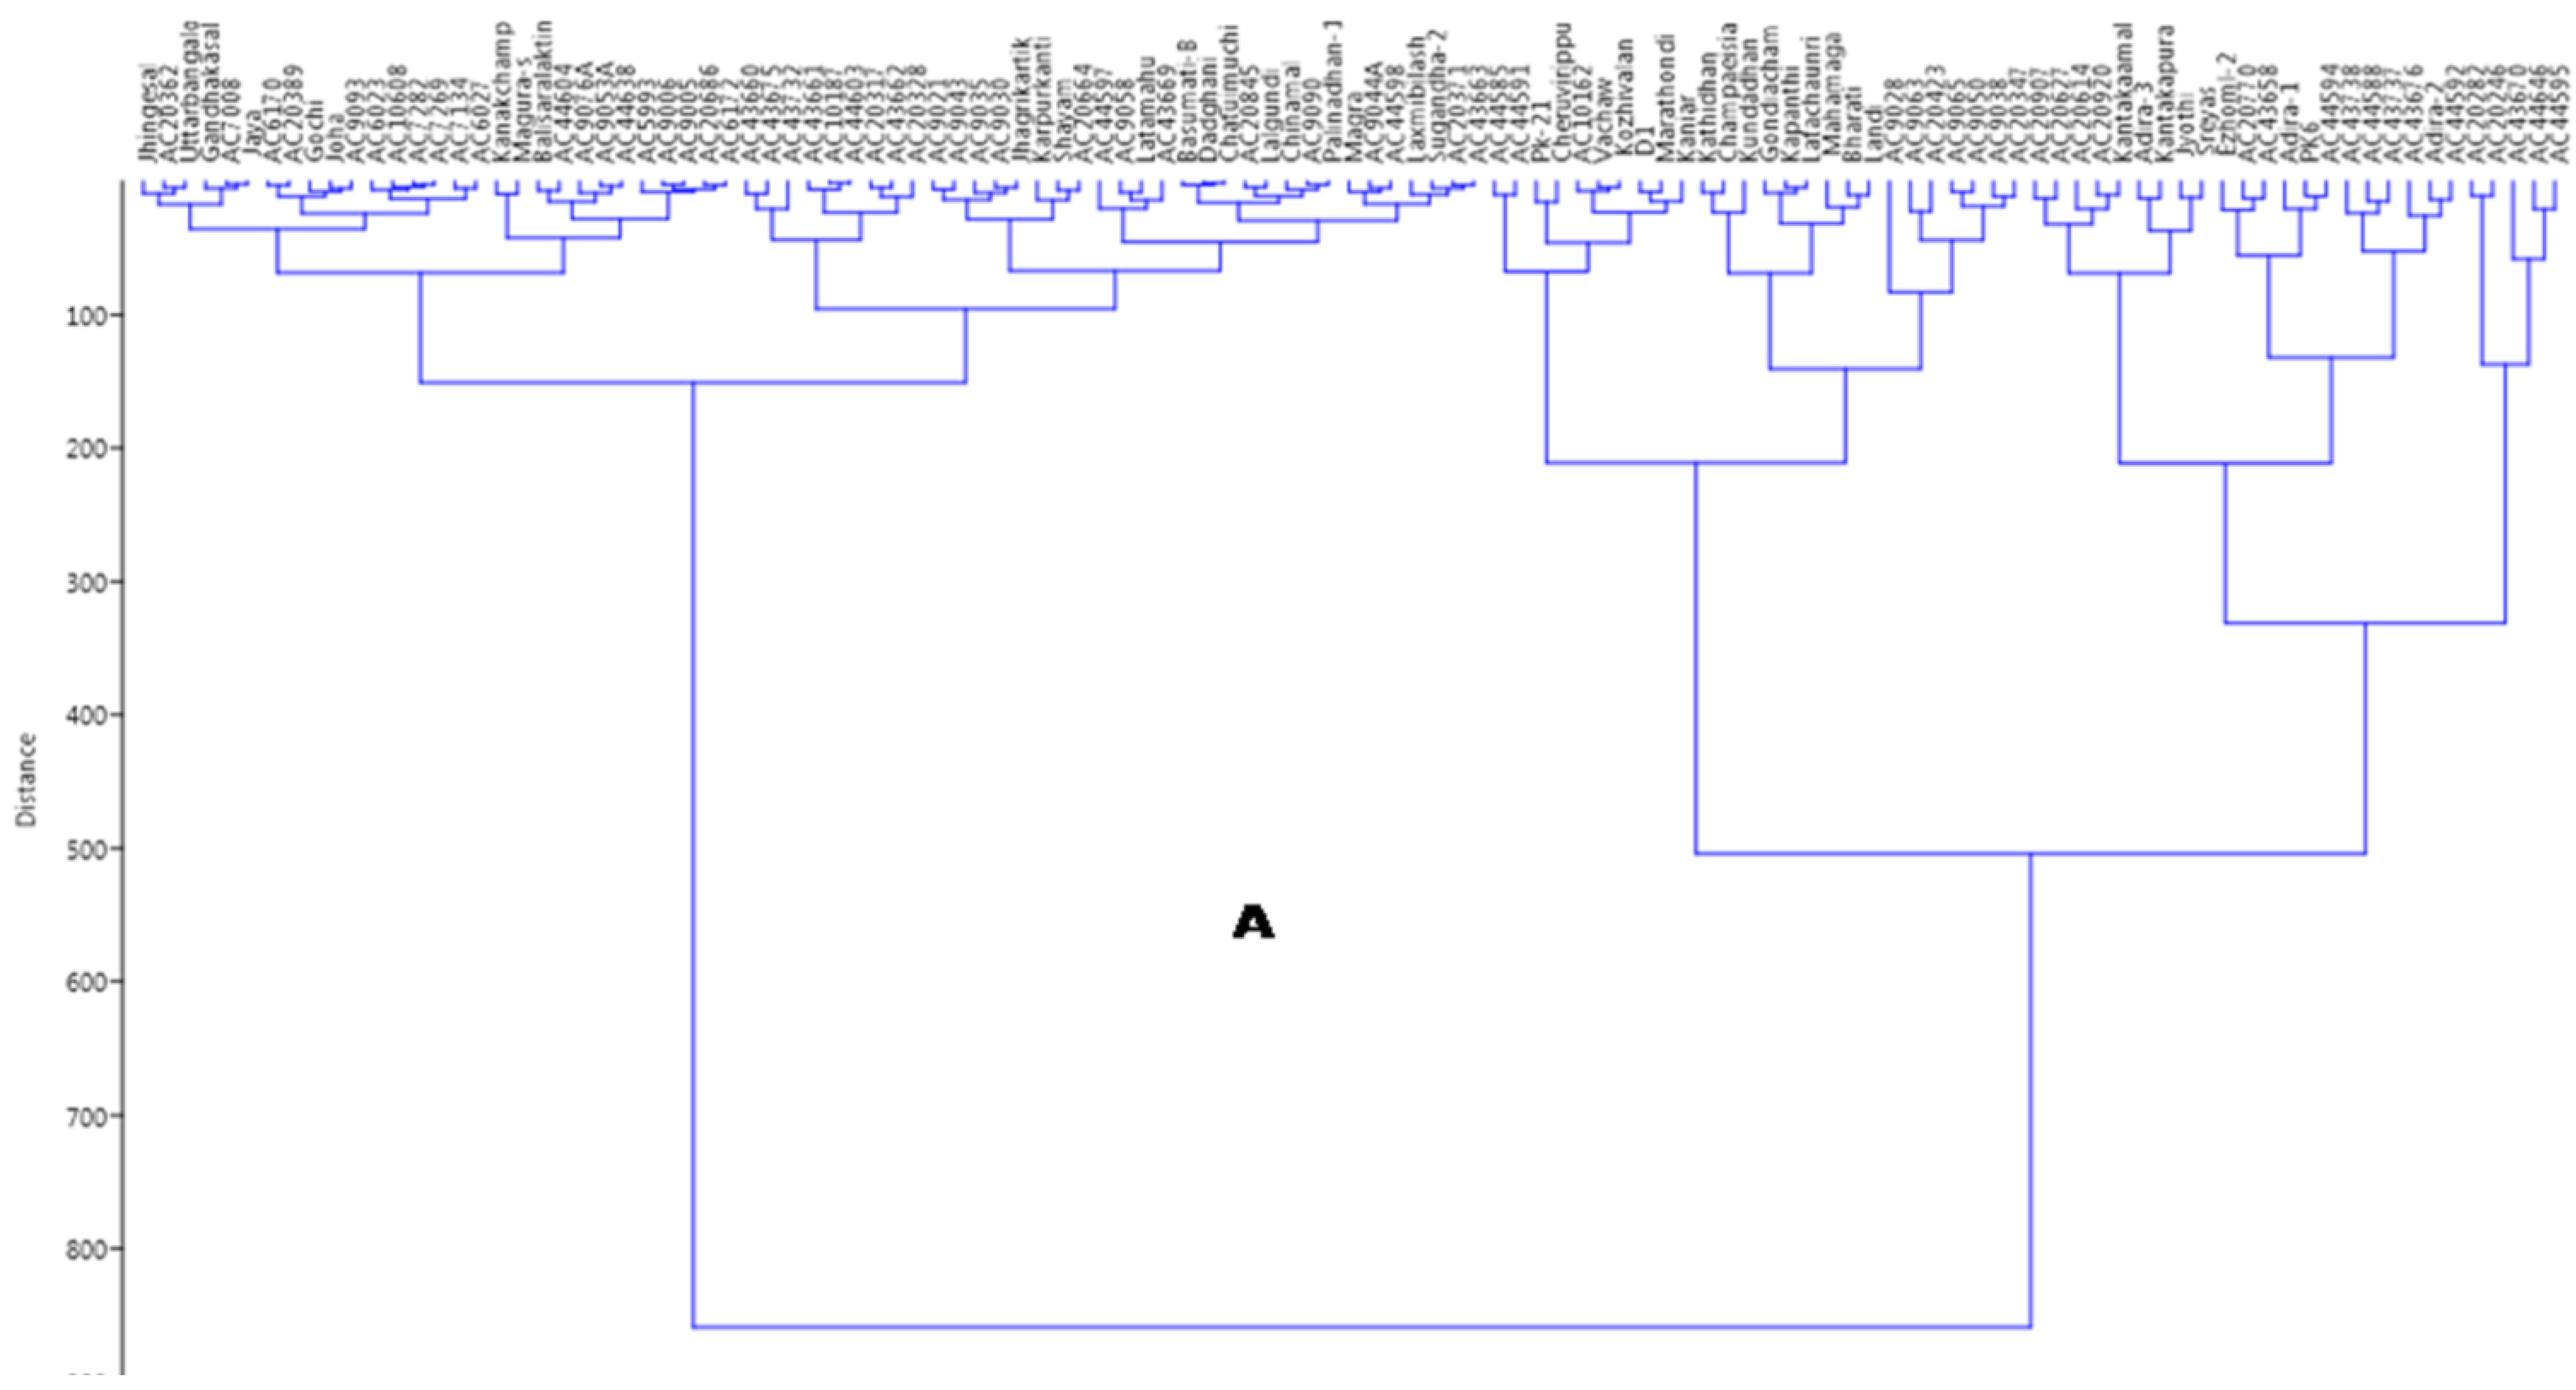
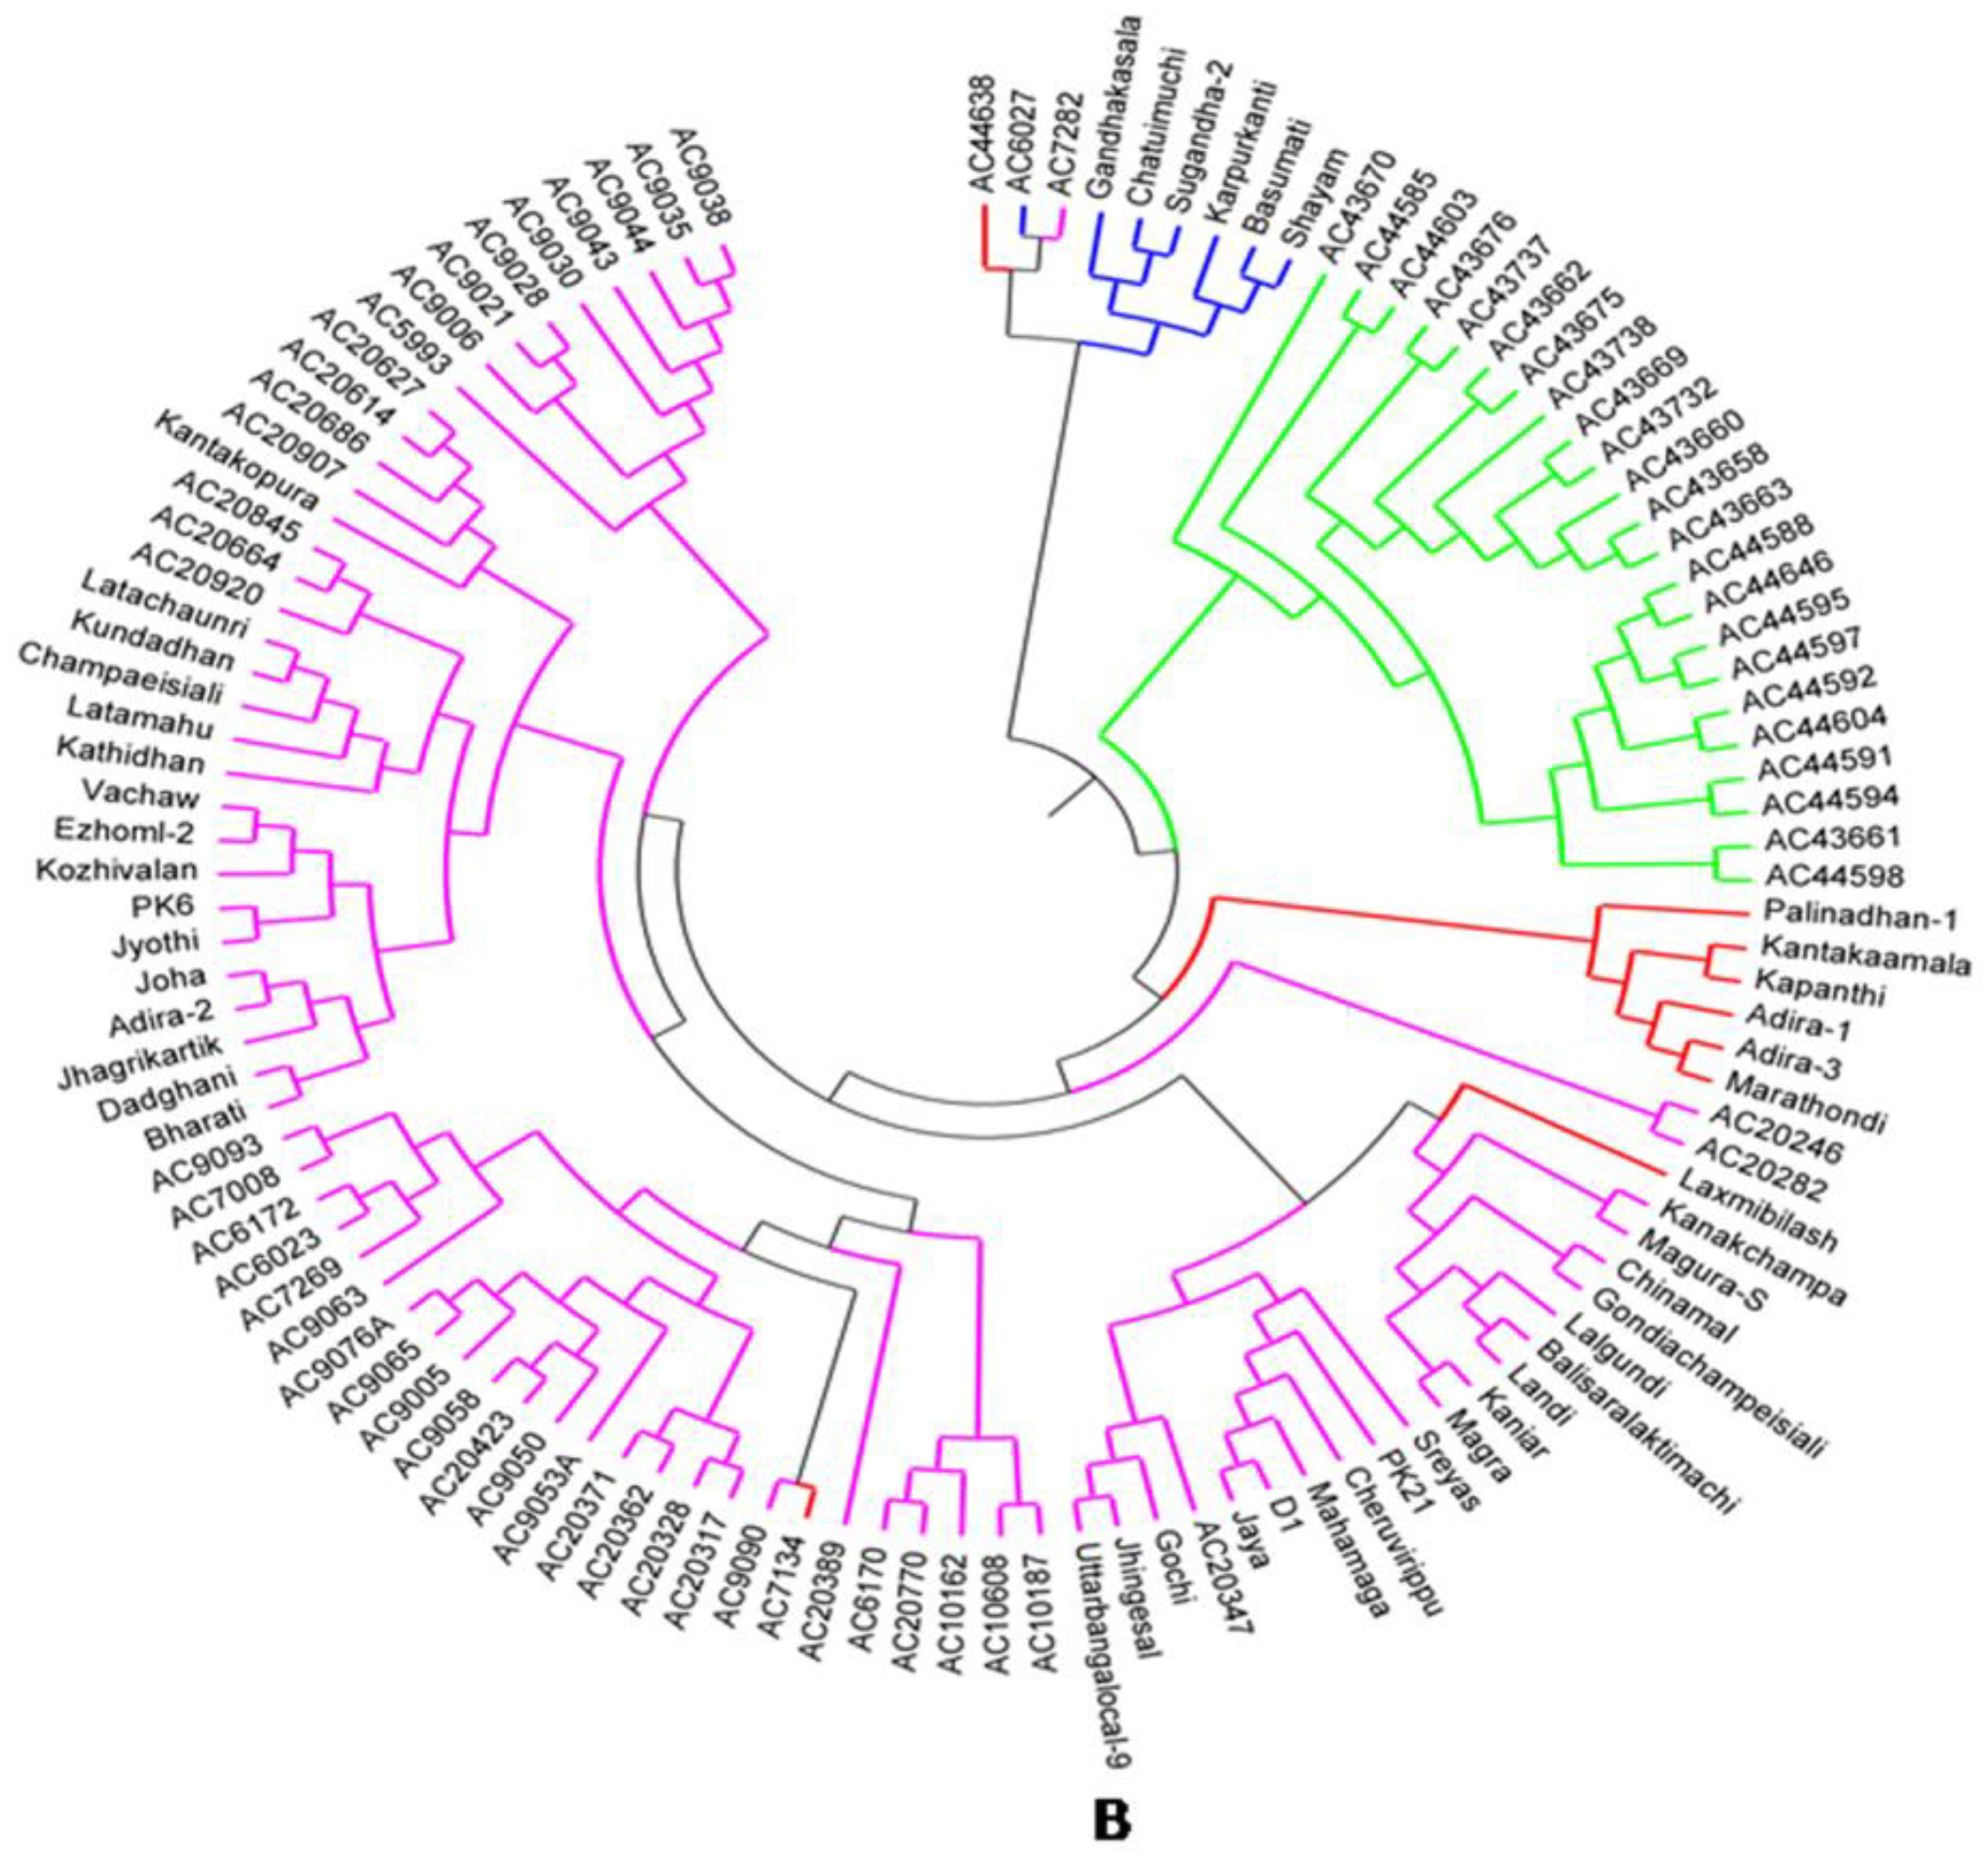
2.7. Principal Coordinates and Cluster Analyses for Genetic Relatedness among the Germplasm Lines

The two-dimensional plot for principal coordinate analysis (PCoA) was constructed based on the genotyping results of 131 SSR markers, and was used to classify the 117 germplasm lines as per the genetic relatedness among the lines (Figure 7). The inertia shown by component 1 was 12.29%, whereas component 2 exhibited 7.35%. The germplasm lines were assigned to the four quadrants at different places, forming three major groups (Figure 7). The biggest group accommodated all the germplasm lines of the subpopulations 2 and 3, and was clustered in the 2nd (bottom right) quadrant. The genotypes in the 1st quadrant were divided into two groups, of which one group on the top of the 1st quadrant form the SP3 subpopulation, which has low to very low antioxidant properties in the seeds. The other group near to axis 1 comprises only the admix type of germplasm lines. Several germplasm lines of quadrant 2 and those closer to axis 1 are also admix genotypes. The admix genotypes present on both sides of axis 1 are depicted in red (Figure 7).
The germplasm lines containing high to very high mean values for the antioxidant traits are grouped together, forming the subpopulation 3. This subpopulation is present on quadrants 3 (top left) and 4 (bottom left), and are encircled in blue. The germplasm lines rich in the antioxidant properties are placed on both sides of the axis on quadrants 3 and 4 (Figure 7). The PCoA distributed all the germplasm lines into the four quadrants, classifying them into four clusters and a separate admixture group. The subpopulations clustered by PCoA showed correspondence with the population structure (Figure 7). Germplasm lines Ac. 44594, Ac. 43669, Ac. 44597, Ac. 44588, Ac. 43737, Ac. 44595, Ac. 43676, Ac. 44597, Ac. 44592, Ac. 43738 and Ac. 44646 are placed together in one structural group present in quadrants III and IV, and are rich in the antioxidant traits. The PCoA placed germplasm lines in quadrant II for which antioxidant properties were mostly at average levels. This quadrant formed the group comprising all of the germplasm lines of subpopulations 1 and 2.
Ward’s clustering approach broadly grouped all the genotypes into two major groups. The largest cluster, cluster II accommodated 65 germplasm lines that all carried very low, low or medium levels of antioxidant properties. Cluster I only had 52 germplasm lines. The dendrogram placed in this cluster all the germplasm lines that were rich in antioxidant traits for at least one compound. This cluster was again subdivided into two subgroups, which were further divided into sub-subclusters. Cluster II was divided into two main subclusters, which were finally divided into small groups. All of the sub-subclusters accommodated in Ward’s clustering approach were based on the antioxidant traits present in the germplasm lines (Figure 8A).
The cluster analysis differentiated the germplasm lines on the basis of genotyping of 131 SSR markers and placed the genotypes into different clusters that corresponded with the studied antioxidant traits. The unweighted-neighbor joining tree differentiated the genotypes into three different clusters (Figure 8B). The cluster for subpopulation 3 was differentiated from SP2 by the presence of germplasm lines containing high antioxidant properties, whereas moderate to high containing genotypes were placed in subpopulation 2. The green-colored portion of the tree is designated SP2 whereas SP3 is shown in blue. The very poor antioxidant properties carrying germplasm lines were in subpopulation 3. The majority of the germplasm lines present in subpopulation 1 were poor to medium in antioxidant traits and are shown in pink. The germplasm lines with an admix type of population are depicted in red in the neighbor joining tree (Figure 8B).

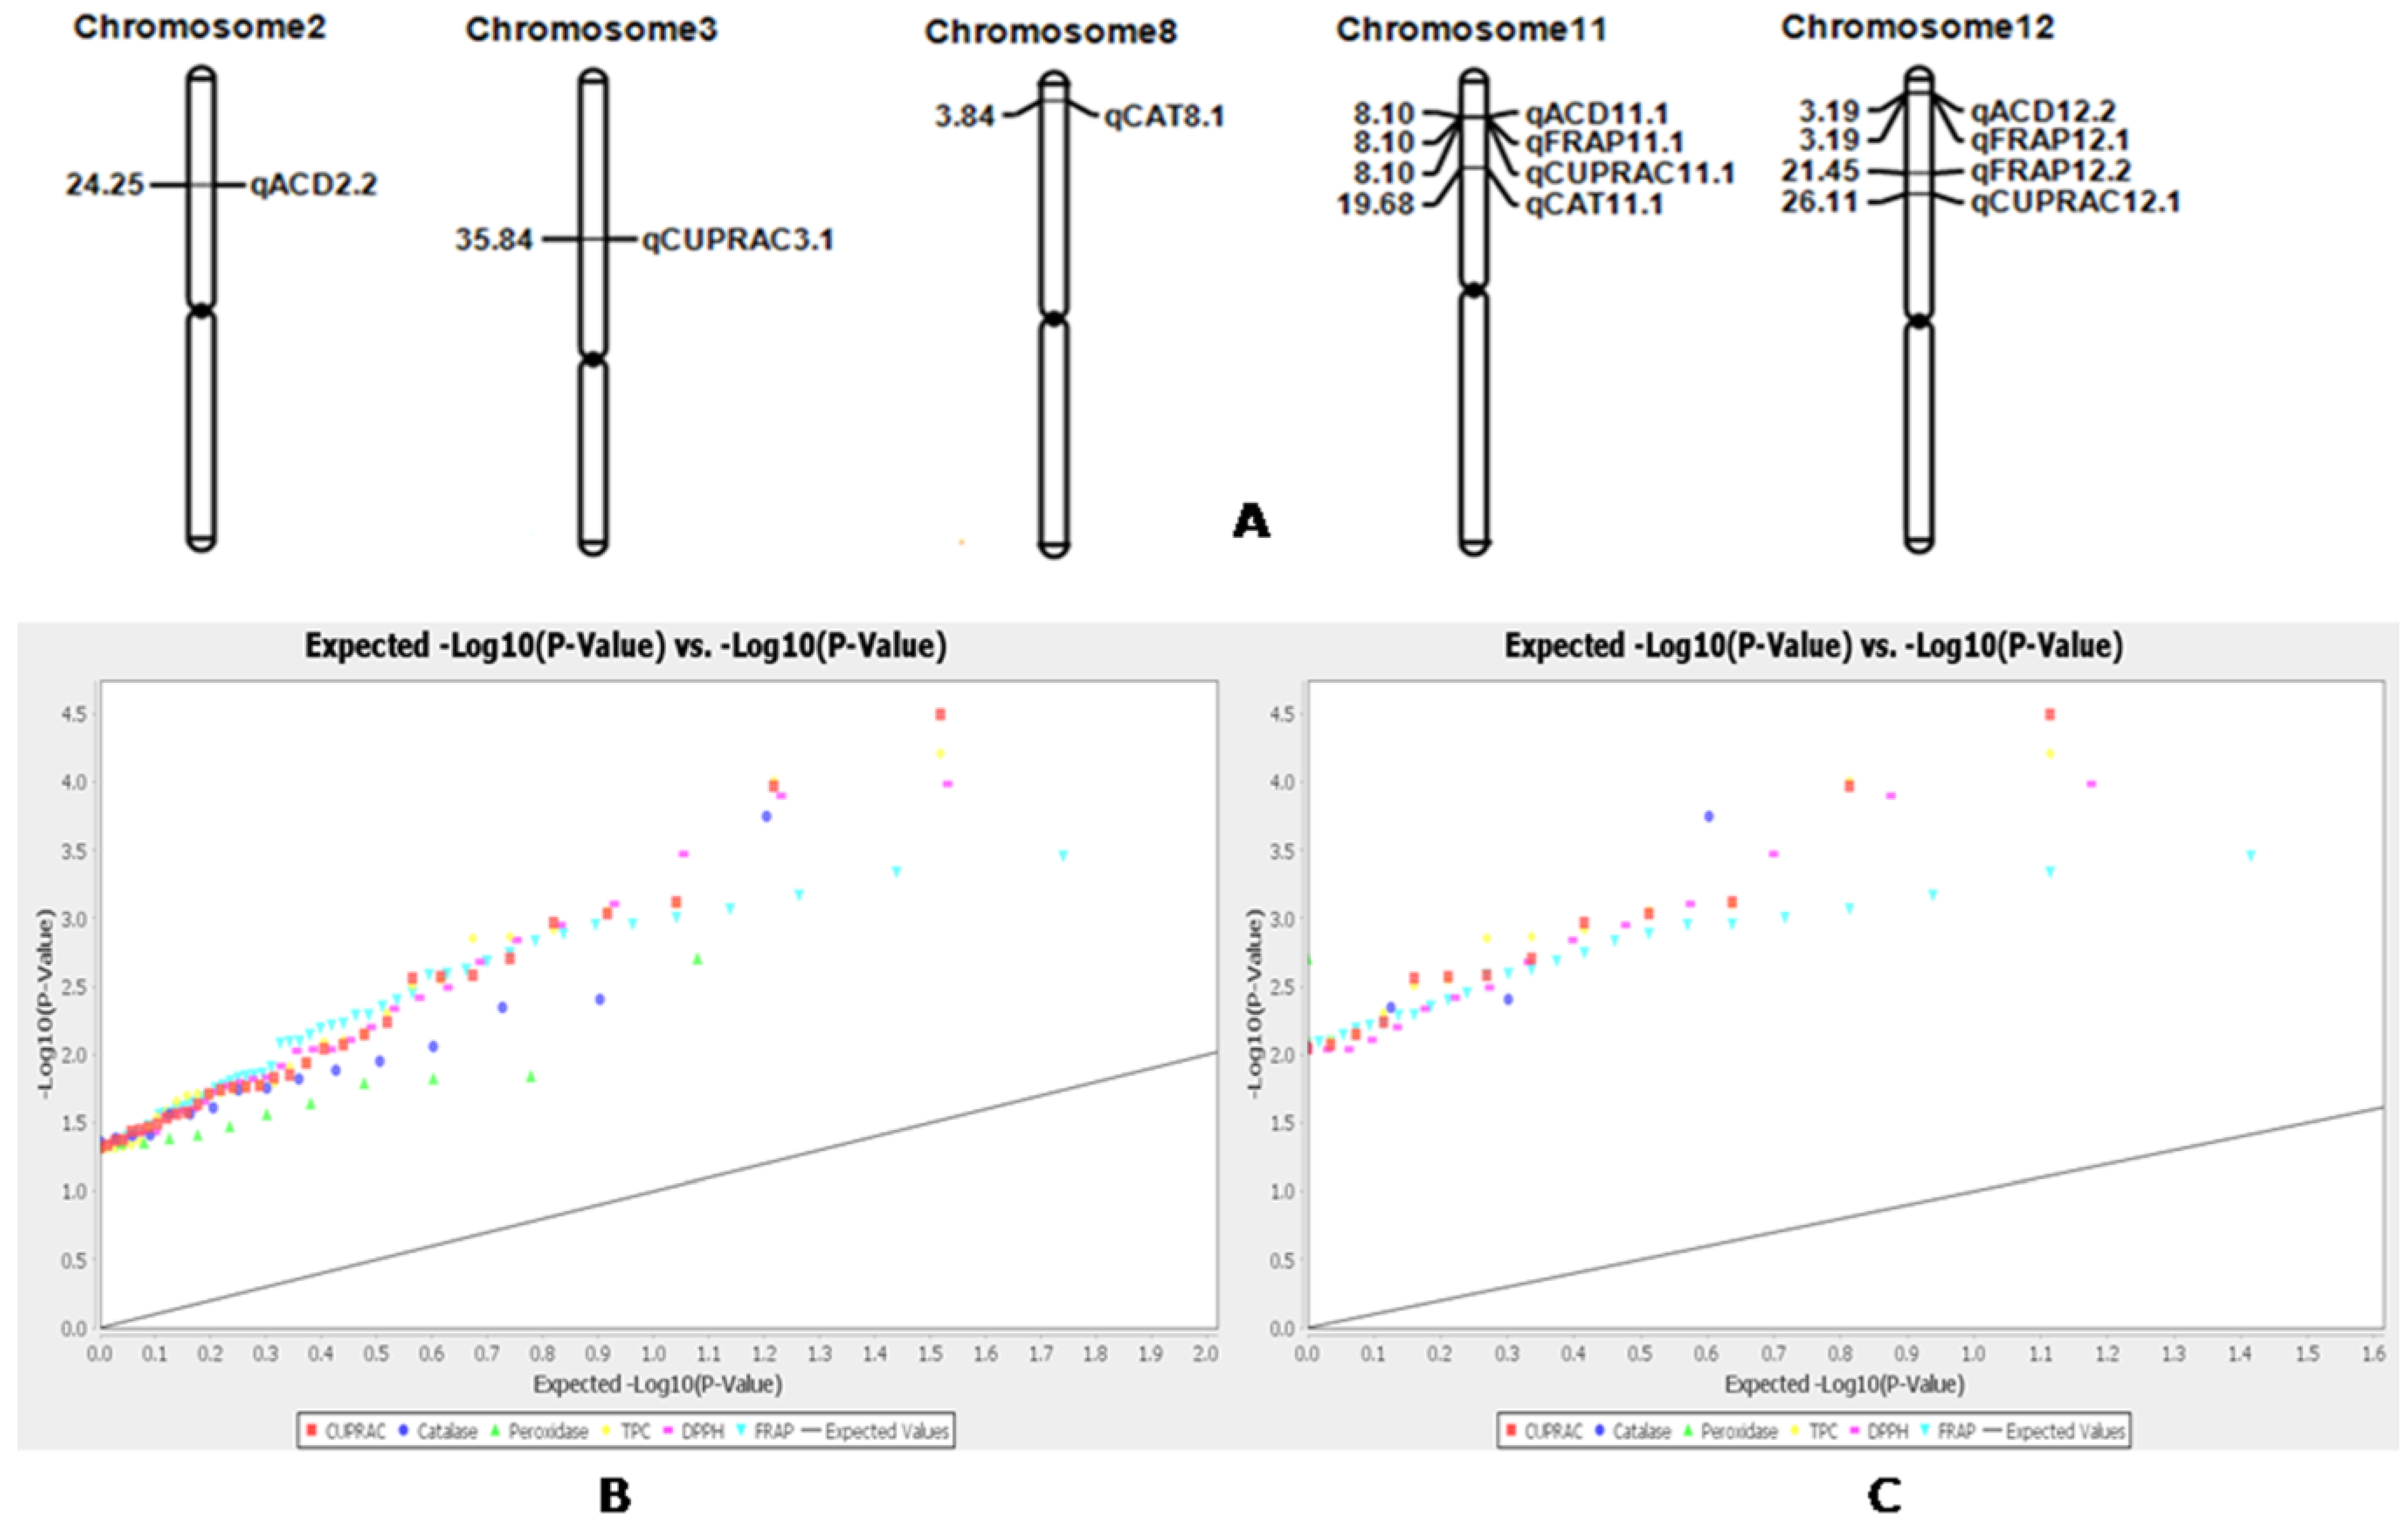
2.8. Marker–Trait Association for Antioxidant Traits in Rice

Marker–trait associations for total phenolic content; catalase and peroxidase for antioxidant enzymes; DPPH and FRAP for antioxidant activities; and CUPRAC for antioxidant capacity were computed by using the generalized linear model (GLM) and mixed linear model (MLM/ K+Q model)) in the TASSEL 5 software. The marker–trait association values were compared at less than 1% error, i.e., 99% confidence (p < 0.01). Five traits showed significant association with 43 SSR markers by GLM, and four traits with 14 SSR markers by MLM analysis at p < 0.01. The marker R2 values varied from 0.05438 to 0.12875 by GLM, and from 0.06324 to 0.12586 by the mixed linear model (Supplementary Tables S4 and S5). A total of 11 significant marker–trait associations were detected by both the models for four antioxidant traits at p < 0.01 in the seeds of the germplasm lines (Figure 9A). Three significant marker–trait associations were detected for each of the traits, DPPH, FRAP, CUPRAC, and catalase (Table 4; Figure 9A). The Q–Q plot also confirmed the association of these markers with the associated antioxidant traits in rice (Figure 9B).
Two markers, namely, RM1341 and RM3231 showed significant associations with the antioxidant enzyme, catalase, analyzed by GLM and MLM models at p < 0.01, and were present on chromosomes 11 and 8, respectively. The QTLs controlling the antioxidant activity of FRAP showed an association with SSR markers RM247 and RM309 present on chromosome 12. RM3701, which was present on chromosome 11, also showed a significant association with FRAP in both of the models. The CUPRAC assay was found to be significantly associated with marker RM235 present on chromosome 12 at the 101.8 cM position. Moreover, the enzyme was strongly associated with RM148 located at 142.3 cM on chromosome 3, as detected by both the models. The antioxidant activity measured by DPPH was found to be significantly associated with the markers RM247 and RM3701 present on chromosomes 12 and 11, respectively (Table S5; Figure 9A). The Q–Q plot also confirmed the associations of these markers with the estimated antioxidant traits in rice (Figure 9B).
The association mapping study for the antioxidant traits in rice seeds identified co-localization of QTLs controlling antioxidant properties in rice. It is observed that the same markers showed significant associations with different antioxidant traits in rice in both of the models (Table 4). Significant associations of marker RM3701 with antioxidant activities of DPPH, CUPRAC and FRAP present in the germplasm lines were detected. In addition, the association of RM247 with antioxidant activity of DPPH and FRAP was also detected by both of the models at <1% error and p < 0.01 (Table 4). In analysis of marker association by GLM, the markers RM468 and RM167 showed associations with both DPPH and FRAP activities.

3. Discussion

Rice is the staple food for the majority of the world population. Many antioxidant compounds and enzymes are present in different rice germplasm lines that provide health benefits. Mapping of these genes for regulating the antioxidant traits in rice germplasm lines and their deployment in breeding programs are very important for enhancing the content in rice grains. The germplasm lines shortlisted for this study showed variation among the lines for the antioxidant traits in the population (Supplementary Table S1; Table 1). The results showed that few antioxidant traits showed correlation among them and will be useful for simultaneous transfer of multiple antioxidant traits into the popular varieties. Therefore, there are possibilities for improvement of the antioxidant enzymes (such as catalase and peroxidase), antioxidant activities (namely, DPPH and FRAP) and antioxidant capacity (by CUPRAC assay), in rice based on the results from genetic variation and correlation obtained from the population (Table 1; Table 3). A number of studies on the existence of genetic variations for antioxidant content and activities have also been reported by researchers [25,26,27,28]. In addition, clear groups and subgroups were obtained in the phenotyping and molecular diversity analyses of antioxidant enzymes present in the population (Supplementary Table S2). The SSR markers showed better PIC values and related diversity parameters in the studied population; this result will be useful in antioxidant improvement programs. The germplasm lines used in this mapping study were from the rice reported for high diversity areas, including the Jeypore region, the secondary center of the origin of rice [29].
Several germplasm lines were identified as potential donors in which more than two traits for antioxidant enzymes and high activities were observed in the seeds. The genotypes rich in multiple antioxidant traits were Kundadhan, Latachaunri, AC.20282, AC.20246, AC.44646, AC.44595, AC.43737, AC.43660, AC.43732, AC.43738 and AC.43670, which will be useful as donors in antioxidant improvement programs (Table 1; Supplementary Table S3). Therefore, inclusion of the panel population for mapping of antioxidant traits will be effective. Structure analysis grouped the population into three subpopulations with different Fst values for each genetic group. The existence of genetic groups supported the continuance of linkage disequilibrium groups in the population. Detection of a moderate alpha value and the existence of many genetic admix-type germplasm lines in the population indicated that these antioxidant traits initially evolved from a single source during evolution of the trait. Different antioxidant compounds, enzymes and activities were formed in admix genotypes with different ancestry values during evolutionary process. A good correspondence of genetic structure group and different traits was found earlier by many researchers [10,30,31,32,33,34,35,36].
Four antioxidant traits were found to be significantly associated with 11 SSR markers analyzed by both GLM and MLM approaches (Table 4). The marker–trait associations detected by both the models at p < 0.01 and low p-value are considered to indicate very strong associations, and the markers will be useful in improvement programs. The strongly associated SSR markers—namely, RM1341 and RM3231 for catalase enzyme; RM247, RM309 and RM3701 for FRAP activity; RM235 and RM148 for CUPRAC assay; and RM247 and RM3701for DPPH activity—may be useful markers in marker-assisted antioxidant enzyme improvement programs in rice (Table 4). The Q–Q plot also confirmed the associations of these markers with the antioxidant compounds in rice (Figure 9B).
The QTLs for antioxidant capacity, i.e., DPPH, were reported by earlier researchers in rice [18,19,20]. In this investigation, the marker–trait associations for DPPH were detected with RM247, RM3701 and RM13600 present on chromosomes 12, 11 and 2, respectively. As previously report for the QTL, qACD12 on chromosome 12 was at the 252.06 Mb location [19]. We detected the QTL associated with marker RM247 at 31.85 Mb, which is a different locus present on chromosome 12. The detected QTL on this chromosome is a new locus and designated as qACD12.2, which regulates the DPPH activity in rice seeds. The QTL qACD2, reported on chromosome 2 by Shao et al. [19], was at 54.16 Mb. In our investigation, we detected the QTL on chromosome 2 near the location of 242.46 Mb for the trait. The associated QTL on this chromosome may be a new locus and designated as qACD2.2, which influences the DPPH activity in rice seeds. Another mapping study for DPPH reports the QTL on chromosome 7 [18]. In addition, the mapping publication of Xu et al. [20] for the trait reports the QTL on chromosome 11. However, in this investigation, a QTL was detected on chromosome 11, which is in contrast to the above-reported QTLs. Therefore, this may be a new locus that regulates antioxidant activity, DPPH, and is designated as qACD11.1.
The markers RM1341 and RM3231 were significantly associated with the antioxidant enzyme, catalase, as detected by both GLM and MLM analyses. The locations of these two markers are chromosomes 11 and 8 at 80.2 and 32.7 cM, respectively. No genes or QTLs were reported previously near to this location for the enzyme catalase, and hence the two QTLs are designated as qCAT11.1 and qCAT8.1, respectively. Three markers, namely, RM247, RM3701 and RM309, showed significant association with antioxidant activity, FRAP. The markers positions of RM247 and RM309 are chromosome 12 at 31.85 and 214.54 Mb, respectively. The other marker, RM3701, is located on chromosome 11 at 81.001 Mb. QTL regulating the FRAP activity was not reported near to these locations on chromosomes 11 and 12, or any other regions or chromosomes, in earlier publications. These QTLs controlling FRAP are designated as qFRAP12.1 near marker RM247 and qFRAP12.2 near RM309 on chromosome 12, and qFRAP11.1 on chromosome 11. The antioxidant enzyme, CUPRAC, is detected to be associated with three markers RM3701, RM235 and RM148 on chromosomes 11, 12 and 3 at 81.001, 261.07 and 358.35 Mb, respectively. No QTLs for antioxidant capacity, CUPRAC, were reported earlier in these positions on the chromosomes 3, 11 and 12, or any other regions or chromosomes. Therefore, these three detected QTLs that influence CUPRAC are new loci and designated as qCUPRAC3.1, qCUPRAC11.1 and qCUPRAC12.1, respectively.
In this investigation, more than two significant associations were observed in one location analyzed by both the models at <1% error and p < 0.01. QTLs present on these locations will be useful for the simultaneous transfer of a greater number of traits. QTLs regulating the antioxidant activities for the assay of DPPH, FRAP and CUPRAC were detected to be co-localized on chromosome 11 near the region 81.001 Mb. This region on chromosome 11 may be considered as an antioxidant hotspot for regulating the activity in rice. Moreover, QTLs for DPPH and FRAP are co-localized on chromosome 12 at the 31.85 Mb position, which is also a hotspot on this chromosome for antioxidant activities (Table S5). These observations of the co-localized candidate genes on the chromosome indicate the usefulness for simultaneous inheritance of these QTLs during improvement programs. Hence, improvement for QTLs regulating the antioxidant enzymes will be very effective in such breeding programs. Recent publications also suggested easy improvements in the co-localized genes controlling various traits in rice [23,24,36,37]. Results of the present investigation showed that association mapping is an effective method to detect more potential loci for antioxidant enzymes and compounds in rice. Additional fine mapping of the detected loci will be undertaken for application in maker-assisted breeding for improvements in antioxidants in rice.

4. Materials and Methods

4.1. Seed Material

The study materials, consisting of 270 germplasm lines, comprising white (121) and colored (149) rice grain landraces and cultivars, were obtained from Gene Bank, ICAR-NRRI, Cuttack, and grown in the experimental plot of the Institute during the wet season, 2018 (Supplementary Table S1). The initial population was shortlisted on the basis of maturity duration (up to 135 days) and kernel color (red, black, purple and white) from about 1000 germplasm lines. The genotypes were grown in a randomized complete block design in three rows each with spacing of 20 × 15 cm in three replications following a recommended package of practices. Each replication was divided into 5 blocks accommodating 54 germplasm lines in each block. Panicles from the middle row of each genotype and replication were harvested, sun dried for 4–5 days to reduce the moisture content to 11–12%, stored for three months to remove dormancy and then used for estimation of CAT, PEROX, TPC, DPPH, FRAP and CUPRAC activity. A representative panel population containing 117 germplasm lines (white grain: 64; red grain: 53) was shortlisted from the initial 270 shortlisted germplasm lines. The panel population was raised during wet seasons of 2019 and 2020, and the antioxidant traits were estimated. The panel population (117) was used for mapping of antioxidant traits (Table 1).

4.2. Phenotyping for the Antioxidant Traits

The seed samples were dehulled by a Satake rice huller, Japan, ground into flour by a grinding machine (Glenmini grinder), sieved through 100-size mesh and stored at 4 °C for the experiment. Seed enzymatic antioxidants such as catalase (CAT: unit min−1 g−1) and guaicol peroxidase (PEROX: unit min−1 g−1) were estimated as per the procedures of Aebi [38] and Putter [39], respectively. Non-enzymatic antioxidants such as total phenolics content (TPC) were determined by the modified protocol of Zilic et al. [40] and expressed as catechol equivalent (mg CE100 g−1). DPPH (2,2-diphenyl-1-picrylhydrazyl) radical scavenging assay was estimated according to the method of Zhou et al. [41] with little modification, and expressed as % inhibition. Ferric reducing antioxidant power (FRAP) activity was measured as per the modified procedure of Mau et al. [42] and results were expressed as µg ascorbic acid equivalent (AAE) g−1. Cupric ion reducing antioxidant capacity (CUPRAC) was determined according to the method of Apak et al. [43] and the result was expressed as μg trolox equivalent (TE) g−1.

4.2.1. Statistical Analysis

Cropstat software 7.0. was used for analysis of variance (ANOVA) for each trait, including the estimation of mean, range and coefficient of variation (CV %). Pearson’s correlation coefficients were analyzed to determine the relationship among the various antioxidant traits based on the mean values of the 117 genotypes, and presented in a correlation matrix heatmap using PAST3 software. The germplasm lines were classified into five groups, i.e., very high, high, medium, low and very low categories, based on the mean values of the antioxidant traits.

4.2.2. Genomic DNA Isolation, PCR Analysis and Selection of SSR Markers

Fifteen-day-old plants were used for extraction of genomic DNA from the germplasm lines by adopting the CTAB method [44]. A total of 131 simple sequence repeat (SSR) rice markers across the 12 chromosomes were taken from the database (http://gramene.org/) available in the public domain (Supplementary Table S2). The DNA fragments were resolved in gel electrophoresis for quantification of isolated DNA. PCR analysis was performed using the markers selected based on positions covering all the chromosomes to illustrate the diversity and to identify the polymorphic loci among the 117 rice germplasm lines (Table 1). The conditions of reaction were set to an initial denaturation step (4 min, 94 °C), followed by 35 cycles of denaturation (30 s, 95 °C) and annealing (45 min, 55 °C), extension (1.3 min, 72 °C), final extension (10 min, 72 °C) and storage at 4 °C (infinity). The PCR products were electrophoresed using 3% agarose gel containing 0.80 g ml−1 ethidium bromide. A 50 bp DNA ladder was used to determine the size of amplicons. The gel was run up to 4 h at 2.5 V cm−1 and photographed using a Gel Documentation System (SynGene). Earlier publications of Barik et al. [45,46] and Pradhan et al. [47] were followed for DNA isolation, electrophoresis and imaging techniques.

4.3. Molecular Data Analysis

The presence or absence of amplified products obtained on the basis genotype-primer combination was used to score the data. A binary data matrix was used as discrete variables for the entry of the resulting data. The parameters, namely, polymorphic information content (PIC), observed heterozygosity (H), number of alleles (N), major allele frequency (A) and gene diversity (GD), for each SSR locus were analyzed using ‘Power Marker Ver 3.25’ software [48]. The Bayesian model-based clustering software, STRUCTURE 2.3.6, was used to analyze the genetic data and for population structure [49]. STRUCTURE software was run with K varying from 1 to 10, with 10 iterations for each K value to derive the ideal number of groups. A high throughput parameter set of a burn-in period of 150,000, followed by 150,000 Markov Chain Monte Carlo (MCMC) replications, were adapted during the running period. The highest value of ΔK was obtained from Evanno table used to detect the subpopulation groups from the panel of populations in the next step. The maximal value of L (K) was identified using the exact number of subpopulations. The model choice criterion to detect the most probable value of K was ΔK, and an ad hoc quantity related to the second-order change in the log probability of data with respect to the number of clusters inferred by STRUCTURE was adopted [50]. For estimation of the ΔK value which is function of K, a clear peak was determined as the optimal K value [51]. Structure Harvester was used. The principal coordinate analysis of all the genotypes and unweighted neighbor joining unrooted tree for NEI coefficient dissimilarity index [52] with bootstrap value of 1000 were undertaken using DARwin5 software [53]. Analysis of molecular variance (AMOVA) using GenAlEx 6.5 software was used to estimate the presence of molecular variance across the whole population, within a population and between the subpopulation structures (FIT, FIS, FST), calculated by the deviation from the Hardy–Weinberg expectation. The procedures followed in earlier publications were adopted for molecular data analysis [23,30,54,55].
To analyze the marker–trait association for mapping study of the seed antioxidant traits in rice, the software “TASSEL 5.0” was used. The generalized linear model and mixed linear model in TASSEL 5.0 were used to determine the genetic association between the phenotypic traits and molecular markers obtained in the study [56]. By considering the significant p-value and r2 value detected by both the models, the associated markers were identified. The associations of markers were further confirmed by the Q–Q plot generated by the software. The linkage disequilibrium plot was obtained using the LD-measured r2 between pairs of markers, and plotted against the distance between the pairs. In addition, the accuracy of the marker–trait association was checked by estimating the FDR-adjusted p-values (q-values) using R software, as described in the earlier publications [23,30].

5. Conclusions

The representative panel population developed by shortlisting 117 germplasm lines based on six antioxidant trait phenotypic groups showed wide genetic variation among the germplasm lines. Moreover, the population showed higher diversity parameters based on 131 SSR marker allele data. Therefore, the choice of mapping population was effective for the association mapping study of the six antioxidant traits, viz., catalase, peroxidase, CUPRAC, DPPH, FRAP and TPC, using the population of 117 lines and 131 SSR markers. Donor lines rich in multiple antioxidant traits were identified from the population for antioxidant improvement programs. The population was classified into three genetic groups and showed reasonable correspondence with the antioxidant traits. The presence of a linkage disequilibrium in the population was confirmed from the estimated Fst values. A total of 11 significant marker–trait associations for antioxidant enzymes and activities was detected for three QTLs, namely, qACD2.1, qACD11.1 and qACD12.2 for DPPH; qCAT8.1 and qCAT11.1 for catalase; qFRAP11.1, qFRAP12.1 and qFRAP12.2 for FRAP, and qCUPRAC3.1, qCUPRAC11.1 and qCUPRA12.1 for CUPRAC. Co-localization of the QTLs was detected for qACD11.1, qFRAC11.1 and qCUPRAC11.1 regulating DPPH, FRAP and CUPRAC activities, respectively, and qACD12.2 and qFRAP12.1 remained close on chromosome 12. These QTLs will be useful in antioxidant improvement programs in rice.

Supplementary Materials

The following supporting information can be downloaded at: https://www.mdpi.com/article/10.3390/plants11111463/s1, Supplementary Figure S1. Scree plot and loadings generated by the six antioxidant traits and eigen values % in the 117 rice germplasm lines. Supplementary Figure S2. (A) Graph of ∆K value, to the rate of change in the log probability of data between successive K values; (B) population structure of the 117 germplasm lines of the panel population based on membership probability fractions of individual genotypes at K = 2. Supplementary Figure S3. The distribution pattern of alpha and FST values: (A) alpha value of the population at K = 3 and (B) four subpopulations at K = 3 showing a symmetric shape of the 3 Fst values. Supplementary Table S1. Mean values of catalase, peroxidase, TPC, DPPH, FRAP and CUPRAC antioxidant traits in 270 initial shortlisted genotypes. Supplementary Table S2. Estimation of genetic diversity parameters based on 131 SSR marker loci in a panel containing 117 rice germplasm lines. Supplementary Table S3. The inferred ancestry value and population structure of individual members with their antioxidant classification in the panel population at K = 2. Supplementary Table S4. Marker–trait associations with antioxidant content in the panel population detected by the model GLM at p < 0.01. Supplementary Table S5. Marker–trait associations with antioxidants, catalase, peroxidase, TPC, DPPH, FRAP and CUPRAC in the panel population detected by the model MLM at p < 0.01.

Author Contributions

S.K.P.; conceived the study. S.R.B., S.P.M., R.B., A.B., J.M. and E.P.; performed the genotyping work. P.S., G.K. and S.K.P.; performed the phenotyping work. S.R.B.; analyzed the data. S.K.P.; and P.S.; wrote the manuscript. All the authors read and approved the final version. All authors have read and agreed to the published version of the manuscript.

Funding

No externally aided fund was availed for this research work. However, Institute’s internal funding was used for this investigation.

Informed Consent Statement

The authors declare that this study complies with the current laws of the countries in which the experiments were performed.

Data Availability Statement

The data generated or analyzed in this study are included in this article.

Acknowledgments

The authors are highly grateful to the Head, Crop Improvement Division and Director, ICAR-NRRI, Cuttack for encouraging the team and providing all the necessary facilities. The authors acknowledge the support of Director, ICAR-National Rice Research Institute, Cuttack for providing all the necessary facilities including the funding for conducting the experiment.

Conflicts of Interest

The authors declare no conflict of interest.

Abbreviations

ANOVA Analysis of variance
CAT Catalase
CUPRAC Cupric ion reducing antioxidant capacity
DPPH 2,2-diphenyl-1-picrylhydrazyl
FDR False discovery rate
FRAP Ferric reducing antioxidant power
PEROX Guaicol peroxidase
PIC Polymorphic information content
RBD Randomized block design
TPC Total phenolics content

References

  1. Ferreira, I.C.F.R.; Abreu, R.M.V. Stress oxidativo, antioxidantes efitoquı´micos. Bioanalise 2007, 2, 32–39. [Google Scholar]
  2. Govindaraj, M.; Masilamani, P.V.; Albert, A.; Bhaskaran, M. Role of antioxidant in seed quality—A review. Agric. Rev. 2017, 38, 180–190. [Google Scholar] [CrossRef]
  3. Zhu, C.; Chen, J. Changes in soluble sugar and antioxidant enzymes in peanut seeds during ultra dry storage and after accelerated aging. Seed Sci. Technol. 2007, 35, 387–401. [Google Scholar] [CrossRef]
  4. Demirkaya, M.; Dietz, K.J.; Sivritepe, H.O. Changes in antioxidant enzymes during ageing of onion seeds. Not. Bot. Horti. Agrobo. 2010, 38, 49–52. [Google Scholar] [CrossRef]
  5. Islam, M.; Begum, H.; Ali, M.; Kamruzzaman, M.; Hoque, S.; Hoque, M. DNA fingerprinting and genetic diversities in some Bangladeshi aus rice (Oryza sativa L.) genotypes. SAARC J. Agric. 2017, 15, 123–137. [Google Scholar] [CrossRef] [Green Version]
  6. Sanghamitra, P.; Sah, R.P.; Bagchi, T.B.; Sharma, S.G.; Kumar, A.; Munda, S.; Sahu, R.K. Evaluation of variability and environmental stability of grain quality and agronomic parameters of pigmented rice (O. sativa L.). J. Food Sci. Technol. 2018, 55, 879–890. [Google Scholar] [CrossRef]
  7. Mbanjo, E.G.N.; Kretzschmar, T.; Jones, H.; Ereful, N.; Blanchard, C.; Boyd, L.A.; Sreenivasulu, N. The Genetic Basis and Nutritional Benefits of Pigmented Rice Grain. Front Genet. 2020, 11, 229. [Google Scholar] [CrossRef] [Green Version]
  8. Shao, Y.; Jin, L.; Zhang, G.; Lu, Y.; Shen, Y.; Bao, J. Association mapping of grain color, phenolic content, flavonoid content and antioxidant capacity in dehulled rice. Theor. Appl. Genet. 2011, 122, 1005–1016. [Google Scholar] [CrossRef]
  9. Shao, Y.; Bao, J. Polyphenols in whole rice grain: Genetic diversity and health benefits. Food Chem. 2015, 180, 86–97. [Google Scholar] [CrossRef]
  10. Sahoo, S.; Sanghamitra, P.; Nanda, N.; Pawar, S.; Pandit, E.; Bastia, R.; Muduli, K.C.; Pradhan, S.K. Association of molecular markers with physio-biochemical traits related to seed vigour in rice. Physiol. Mol. Biol. Plants 2020, 26, 1989–2003. [Google Scholar] [CrossRef]
  11. Yamane, K.; Mitsuya, S.; Taniguchi, M.; Hiroshi, M. Transcription Profiles of Genes Encoding Catalase and Ascorbate Peroxidase in the Rice Leaf Tissues under Salinity. Plant Prod. Sci. 2010, 13, 164–168. [Google Scholar] [CrossRef]
  12. Sofo, A.; Scopa, A.; Nuzzaci, M.; Vitti, A. Ascorbate Peroxidase and Catalase Activities and Their Genetic Regulation in Plants Subjected to Drought and Salinity Stresses. Int. J. Mol. Sci. 2015, 16, 13561–13578. [Google Scholar] [CrossRef] [Green Version]
  13. Rossatto, T.; de-Amaral, M.N.; Benitez, L.C.; Vighi, I.L.; Braga, E.; de Magalhães, J.; Maia, A.M.M.; da Silva, P.L. Gene expression and activity of antioxidant enzymes in rice plants, cv. BRS AG, under saline stress. Physiol. Mol. Biol. Plants 2017, 23, 865–875. [Google Scholar] [CrossRef] [Green Version]
  14. Alam, N.B.; Ghosh, A. Comprehensive analysis and transcript profiling of Arabidopsis thaliana and Oryza sativa catalase gene family suggests their specific roles in development and stress responses. Plant Physiol. Biochem. 2018, 123, 54–64. [Google Scholar] [CrossRef]
  15. Xu, T.Y.; Sun, J.; Chang, H.L.; Zheng, H.L.; Wang, J.G.; Liu, H.L.; Yang, L.M.; Zhao, H.W.; Zou, D.T. QTL mapping for anthocyanin and proanthocyanidin content in red rice. Euphytica 2017, 213, 243. [Google Scholar] [CrossRef]
  16. Teixeira, F.K.; Menezes-Benavente, L.; Margis, R.; Margis-Pinheiro, M. Analysis of the molecular evolutionary history of the ascorbate peroxidase gene family: Inferences from the rice genome. J. Mol. Evol. 2004, 59, 761–770. [Google Scholar] [CrossRef]
  17. Bowler, C.; Montagu, M.V.; Inze, D. Superoxide dismutase and stress tolerance. Ann. Rev. 1992, 43, 83–116. [Google Scholar] [CrossRef]
  18. Jin, L.; Xiao, P.; Lu, Y.; Shao, Y.F.; Shen, Y.; Bao, J.S. Quantitative trait loci for brown rice color, total phenolics and, flavonoid contents and antioxidant capacity in rice grain. Cereal Chem. 2009, 86, 609–615. [Google Scholar] [CrossRef]
  19. Shao, Y.; Tang, F.; Huang, Y.; Xu, F.; Chen, Y.; Tong, C.; Chen, H.; Bao, J. Analysis of genotype × environment interactions for polyphenols and antioxidant capacity of rice by association mapping. J. Agric. Food Chem. 2014, 62, 5361–5368. [Google Scholar] [CrossRef]
  20. Xu, F.; Jinsong, B.; Tae-Sung, K.; Yong-Jin, P. Genome-wide association mapping of polyphenol contents and antioxidant capacity in whole-grain rice. J. Agric. Food Chem. 2016, 64, 4695–4703. [Google Scholar] [CrossRef]
  21. Pradhan, S.K.; Pandit, E.; Pawar, S.; Naveenkumar, R.; Barik, S.R.; Mohanty, S.P.; Nayak, D.K.; Ghritlahre, S.K.; Rao, D.S.; Reddy, J.N.; et al. Linkage disequilibrium mapping for grain Fe and Zn enhancing QTLs useful for nutrient dense rice breeding. BMC Plant Biol. 2020, 20, 57. [Google Scholar] [CrossRef] [Green Version]
  22. Yu, J.; Pressoir, G.; Briggs, W.H.; Vroh, B.I.; Yamasaki, M.; Doebley, J.F.; Mc Mullen, M.D.; Gaut, B.S.; Nielsen, D.M.; Holland, J.B.; et al. A unified mixed model method for association mapping that accounts for multiple levels of relatedness. Nature Genet. 2006, 38, 203–208. [Google Scholar] [CrossRef]
  23. Pandit, E.; Tasleem, S.; Barik, S.R.; Mohanty, D.P.; Nayak, D.K.; Mohanty, S.P.; Das, S.; Pradhan, S.K. Genome-wide association mapping reveals multiple QTLs governing tolerance response for seedling stage chilling stress in indica rice. Front. Plant Sci. 2017, 8, 552. [Google Scholar] [CrossRef] [Green Version]
  24. Pawar, S.; Pandit, E.; Arjun, A.; Wagh, M.; Bal, D.; Panda, S.; Bastia, D.N.; Pradhan, S.K.; Mohanty, I.C. Genetic variation and association of molecular markers for iron toxicity tolerance in rice. Oryza 2017, 54, 356–366. [Google Scholar] [CrossRef]
  25. Oselebe, H.O.; Ogah, O.; Odo, M.I.; Ogbu, K.I. Determination of Phytochemical and Antioxidant Properties of Some Rice Varieties and Hybrids Grown in Ebonyi State, Nigeria. Nig. J. Biotech. 2013, 26, 60–67. [Google Scholar]
  26. Goufo, P.; Trindade, H. Rice antioxidants: Phenolic acids, flavonoids, anthocyanins, proanthocyanidins, tocopherols, tocotrienols, γ-oryzanol, and phytic acid. Food Sci. Nutr. 2014, 2, 75–104. [Google Scholar] [CrossRef]
  27. Sanghamitra, P.; Bagchi, T.B.; Sharma, S.G.; Sarkar, S.; Basak, N. Characterization of red and purple-pericarp rice (Oryza sativa L.) based on physico-chemical and antioxidative properties of grains. Oryza 2017, 54, 57–64. [Google Scholar]
  28. Mahender, A.; Anandan, A.; Pradhan, S.K.; Pandit, E. Rice grain nutritional traits and their enhancement using relevant genes and QTLs through advanced approaches. SpringerPlus 2016, 5, 2086. [Google Scholar] [CrossRef] [Green Version]
  29. Sanghamitra, P.; Nanda, N.; Barik, S.R.; Sahoo, S.; Pandit, E.; Bastia, R.; Bagchi, T.B.; Pradhan, S.K. Genetic structure and molecular markers-trait association for physiological traits related to seed vigour. Plant Gene 2021, 28. [Google Scholar] [CrossRef]
  30. Pawar, S.; Pandit, E.; Mohanty, I.C.; Saha, D.; Pradhan, S.K. Population genetic structure and association mapping for iron toxicity tolerance in rice. PLoS ONE 2021, 16, e0246232. [Google Scholar] [CrossRef] [PubMed]
  31. Das, S.; Pandit, E.; Guru, M.; Nayak, D.K.; Tasleem, S.; Barik, S.R.; Mohanty, D.P.; Mohanty, S.P.; Patra, B.C.; Pradhan, S.K. Genetic diversity, population structure, marker validation and kinship analysis for seedling stage cold tolerance in indica rice. Oryza 2018, 55, 396–405. [Google Scholar] [CrossRef]
  32. Mohapatra, S.; Pandit, E.; Barik, S.R.; Patra, B.C.; Pradhan, S.K. Genetic diversity and population structure in early duration rice genotypes. Oryza 2017, 54, 158–168. [Google Scholar] [CrossRef]
  33. Barik, S.R.; Pandit, E.; Sanghamitra, P.; Mohanty, S.P.; Behera, A.; Mishra, J.; Nayak, D.K.; Bastia, R.; Moharana, A.; Sahoo, A.; et al. Unraveling the genomic regions controlling the seed vigour index, root growth parameters and germination per cent in rice. PLoS ONE 2022. [Google Scholar] [CrossRef]
  34. Pandit, E.; Panda, R.K.; Sahoo, A.; Pani, D.R.; Pradhan, S.K. Genetic relationship and structure analyses of root growth angle for improvement of drought avoidance in early and mid-early maturing rice genotypes. Rice Sci. 2020, 27, 124–132. [Google Scholar] [CrossRef]
  35. Anandan, A.; Anumalla, M.; Pradhan, S.K.; Ali, J. Population Structure, Diversity and Trait Association Analysis in Rice (Oryza sativa L.) Germplasm for early seedling vigor (ESV) Using Trait Linked SSR Markers. PLoS ONE 2016, 11, e0152406. [Google Scholar] [CrossRef] [Green Version]
  36. Pradhan, S.K.; Barik, S.R.; Sahoo, A.; Mohapatra, S.; Nayak, D.K.; Mahender, A.; Meher, J.; Anandan, A.; Pandit, E. Population structure, genetic diversity and molecular marker-trait association analysis for high temperature stress tolerance in rice. PLoS ONE 2016, 11, 123. [Google Scholar] [CrossRef] [Green Version]
  37. Pradhan, S.K.; Pandit, E.; Pawar, S.; Bharati, B.; Chatopadhyay, K.; Singh, S.; Dash, P.; Reddy, J.N. Association mapping reveals multiple QTLs for grain protein content in rice useful for biofortification. Mol. Genet. Genom. 2019, 294, 963–983. [Google Scholar] [CrossRef]
  38. Aebi, H. Catalase in vitro methods. In Methods in Enzymology; Colowick, S.P., Kaplan, N.O., Eds.; Academic Press: Cambridge, UK, 1984; Volume 105, pp. 114–121. [Google Scholar]
  39. Putter, J. Peroxidase. In Methods of Enzymatic Analysis; Bergmeyer, H.U., Ed.; Academic Press: Cambridge, UK, 1974; pp. 685–690. [Google Scholar]
  40. Zilic, S.; Hadzi-Taskovic, S.V.; Dodig, D.; Maksimovic, V.; Maksimovic, M.; Basic, Z. Antioxidant activity of small grain cereals caused by phenolics and lipid soluble antioxidants. J. Cereal Sci. 2011, 54, 417–424. [Google Scholar] [CrossRef]
  41. Zhou, H.M.; Zhu, K.X.; Qian, H.F. Antioxidant and free radical-scavenging activities of wheat germ protein hydrolysates (WGPH) prepared with alcalase. Process Biochem. 2006, 41, 1296–1302. [Google Scholar] [CrossRef]
  42. Mau, J.L.; Lin, H.C.; Chen, C.C. Antioxidant properties of several medicinal mushrooms. J. Agric. Food Chem. 2002, 50, 6072–6077. [Google Scholar] [CrossRef] [PubMed]
  43. Apak, R.; Guçlu, K.; Ozyurek, M.; Çelik, S.E. Mechanism of antioxidant capacity assays and the CUPRAC (cupric ion reducing antioxidant capacity) assay. Microchimica Acta 2008, 160, 413–419. [Google Scholar] [CrossRef]
  44. Murray, M.G.; Thompson, W.F. Rapid isolation of high molecular weight plant DNA. Nucleic Acids Res. 1980, 8, 4321–4325. [Google Scholar] [PubMed] [Green Version]
  45. Barik, S.R.; Pandit, E.; Pradhan, S.K.; Singh, S.; Mohapatra, T. QTL mapping for relative water content trait at reproductive stage drought tolerance in rice. Ind. J. Genet. Plant Breed. 2018, 78, 401–408. [Google Scholar]
  46. Barik, S.R.; Pandit, E.; Pradhan, S.K.; Mohanty, S.P.; Mohapatra, T. Genetic mapping of morpho-physiological traits involved during reproductive stage drought tolerance in rice. PLoS ONE 2019, 14, e0214979. [Google Scholar] [CrossRef] [Green Version]
  47. Pradhan, S.K.; Pandit, E.; Nayak, D.K.; Behera, L.; Mohapatra, T. Genes, pathways and transcription factors involved in seedling stage chilling stress tolerance in indica rice through RNA-Seq analysis. BMC Plant Biol. 2019, 19, 352. [Google Scholar] [CrossRef] [Green Version]
  48. Liu, K.; Muse, S.V. Power Marker: An integrated analysis environment for genetic marker analysis. Bioinformatics 2005, 21, 2128–2129. [Google Scholar] [CrossRef] [Green Version]
  49. Pritchard, J.K.; Stephens, M.; Donnelly, P. Inference of population structure using multilocus genotype data. Genetics 2000, 155, 945–959. [Google Scholar] [CrossRef]
  50. Evanno, G.; Regnaut, S.; Goudet, J. Detecting the number of clusters of individuals using the software STRUCTURE: A simulation study. Mol. Ecol. 2005, 14, 2611–2620. [Google Scholar] [CrossRef] [Green Version]
  51. Earl, D.A.; Vonholdt, B.M. Structure Harvester: A website and program for visualizing STRUCTURE output and implementing the Evannomethod. Conserva. Genet. Resour. 2012, 4, 359–361. [Google Scholar] [CrossRef]
  52. Nei, M. Genetic distance between populations. Am. Nat. 1972, 106, 283–292. [Google Scholar] [CrossRef]
  53. Perrier, X.; Jacquemoud-Collet, J.P. DARwin Software. 2006. Available online: http://darwin.cirad.fr/Darwin.
  54. Pandit, E.; Pawar, S.; Barik, S.R.; Mohanty, S.P.; Meher, J.; Pradhan, S.K. Marker-Assisted Backcross Breeding for Improvement of Submergence Tolerance and Grain Yield in the Popular Rice Variety ‘Maudamani’. Agronomy 2021, 11, 1263. [Google Scholar] [CrossRef]
  55. Mohapatra, S.; Bastia, A.K.; Meher, J.; Sanghamitra, P.; Pradhan, S.K. Development of submergence tolerant, bacterial blight resistant and high yielding near isogenic lines of popular variety, ‘Swarna’ through marker-assisted breeding approach. Front. Plant Sci. 2021. [Google Scholar] [CrossRef]
  56. Bradbury, P.J.; Zhang, Z.; Kroon, D.E.; Casstevens, T.M.; Ramdoss, Y.; Buckler, E.S. TASSEL: Software for association mapping of complex traits in diverse samples. Bioinformatics 2007, 23, 2633–2635. [Google Scholar] [CrossRef]
Figure 1. Frequency distribution of genotypes containing each antioxidant trait, namely, catalase, peroxidase, total phenolics content (TPC), 2,2-diphenyl-1-picrylhydrazyl (DPPH), ferric reducing antioxidant power (FRAP) and cupric ion reducing antioxidant capacity (CUPRAC) in the 270 shortlisted germplasm lines.
Plants 11 01463 g001
Figure 2. (A). Frequency distribution of germplasm lines for antioxidant properties, catalase, peroxidase, total phenolics content (TPC), 2,2-diphenyl-1-picrylhydrazyl (DPPH), ferric reducing antioxidant power (FRAP) and cupric ion reducing antioxidant capacity (CUPRAC) present in the panel population of 117 genotypes. (B). Spider graph showing the catalase and peroxidase activities. (C). TPC content and DPPH activities. (D). FRAP and CUPRAC activities.
Plants 11 01463 g002
Figure 3. Genotype-by-trait biplot diagram of 117 germplasm lines in the two PCs for the antioxidant traits, catalase, peroxidase, total phenolics content (TPC), 2,2-diphenyl-1-picrylhydrazyl (DPPH), ferric reducing antioxidant power (FRAP) and cupric ion reducing antioxidant capacity (CUPRAC).
Plants 11 01463 g003
Figure 4. Heat map showing Pearson’s correlation coefficients for the antioxidant traits. Significant correlations are colored either red (negative) or blue (positive). Shades of blue indicate increasing positive correlation coefficient; shades of red indicate increasing negative correlation coefficient. CAT: catalase (unit min −1 g−1); PEROX: guaiacol peroxidase (unit min −1 g−1); TPC: total phenolics content (mg catechol or CE 100 g−1); DPPH: 2, 2-diphenyl-1-picrylhydrazyl (% inhibition); FRAP: ferric reducing antioxidant power activity (µg ascorbic acid equivalent or AAE) g−1; CUPRAC: cupric ion reducing antioxidant capacity (μg trolox equivalent or TE) g−1).
Plants 11 01463 g004
Figure 5. (A) Graph of ∆K value against the rate of change in the log probability of data between successive K values. (B) Population structure of the panel population based on membership probability fractions of individual genotypes at K = 3. The genotypes with the probability of ≥80% of membership proportions were assigned as subgroups whereas others were grouped as the admixture group. The numbers in the diagram depict the serial number of the germplasm lines listed in Table 1.
Plants 11 01463 g005
Figure 6. (A) The physical distance (megabase pairs, Mb) between pairs of loci on chromosomes against the linkage disequilibrium (LD) decay (R2) curve plotted in rice. The decay in million bp was estimated by taking the 95th percentile of the distribution of R2 for all unlinked loci. (B) The marker ‘P’ versus marker ‘F’ and marker R2.
Plants 11 01463 g006
Figure 7. Distribution of 117 genotypes for the principal coordinate analysis (PCoA) based on 131 molecular markers’ genotyping for the six antioxidant traits. The dot numbers in the figure represent the serial number of the genotypes listed in Table 1. The numbers are colored on the basis of the subpopulations obtained from the structure analysis (SP1: pink; SP2: green; SP3: blue; Admix: red).
Plants 11 01463 g007
Figure 8. (A) Grouping of the germplasm lines present in the panel population by Ward’s clustering based on the six antioxidant traits. (B). Unrooted tree using unweighted-neighbor joining method depicting clustering patterns of 117 germplasm lines genotyped by 131 molecular markers colored on the basis of the subpopulations obtained from structure analysis (SP1: pink; SP2: green; SP3: blue; Admix: red).
Plants 11 01463 g008aPlants 11 01463 g008b
Figure 9. (A) Positions (Mb) of the QTLs on the chromosomes regulating the antioxidant traits, catalase, peroxidase, DPPH, FRAP and CUPRAC detected by association mapping in rice. B. Distribution of marker–trait association and quantile–quantile (Q–Q) plot generated by generalized linear model analysis for the six antioxidant traits at (B) p < 0.05 and (C) at p < 0.01.
Plants 11 01463 g009
Table 1. Mean values of catalase (unit min−1 g−1), peroxidase (unit min−1 g−1), TPC (mg CE100 g−1), DPPH (% inhibition), FRAP (AAE g−1) and CUPRAC (TE g−1) antioxidant traits estimated from the 117 genotypes present in the panel population.
Sl.
No.
Kernel ColorGenotype/Vernacular Name/Accession No.CatalasePeroxidaseTPCDPPHFRAPCUPRAC
1WhiteAC.59930.1080.000214.4328.1494.14225.167
2WhiteAC.62210.2160.00033.13619.6137.31324.958
3WhiteAC.60230.1300.00112.2958.1496.00725.833
4WhiteAC.61720.0650.00039.2954.4206.04527.458
5WhiteAC.60270.0650.00050.23211.05011.97831.500
6WhiteAC.60070.1730.000511.2503.0394.59022.875
7WhiteAC.90210.1300.000534.0914.14412.36024.958
8RedAC.90280.6280.0008205.56858.01127.57549.958
9WhiteAC.90301.0820.000735.00011.3265.82126.417
10WhiteAC.90350.1520.001341.3645.2498.95529.958
11RedAC.90380.0650.0002118.52342.06431.30644.542
12WhiteAC.90430.1520.000531.47712.15512.05225.792
13WhiteAC.9044A0.1520.000623.29516.71314.81323.917
14RedAC.209200.1080.0002134.88681.10724.963117.875
15RedAC.209070.1080.0003148.18286.64527.164118.083
16WhiteAC.208450.1080.000834.77322.8015.07521.208
17RedAC.207700.1520.000594.54584.20223.69489.125
18RedAC.206270.1730.0003144.54582.73628.470134.958
19WhiteAC.206860.0650.00048.6364.5604.17924.125
20WhiteAC.206640.1300.000745.45513.1927.27625.792
21RedAC.206140.1730.0003148.52385.34220.858101.208
22WhiteJhagrikartik0.1520.000234.5458.1434.73932.042
23WhiteDadghani0.1950.000426.13621.0105.00028.083
24WhiteShayam0.9740.000139.31818.5675.29929.542
25WhiteBasumati-B0.2380.000126.36422.8017.50027.875
26RedBharati0.1950.0002114.54580.13020.70941.292
27WhiteJoha0.1730.000110.00017.5905.18721.625
28RedAdira-10.1300.000251.25078.37232.127123.292
29RedAdira-20.1300.000570.00083.20635.336132.667
30RedAdira-30.1080.0002103.86480.40731.381107.875
31RedPK60.1300.000562.38684.47830.44899.125
32RedVAC.haw0.1300.000584.88977.07528.78458.917
33RedKozhivalan0.1520.000687.89372.39229.46361.833
34RedMarathondi0.1080.000771.02378.88027.44060.583
35RedEzhoml-20.2600.000378.18288.29524.14276.208
36RedJyothi0.0650.0005121.81887.78621.71675.792
37RedKantakapura0.1520.0003113.63690.22831.082118.917
38RedKantakaamala0.1520.0006128.75090.55428.619109.958
39RedKapanthi0.1080.0004131.70589.90224.51543.074
40WhiteKarpurkanti0.1080.000445.90929.9676.86631.333
41RedKathidhan0.1730.0004148.29589.57722.83676.208
42RedKundadhan0.1300.0001160.90989.90231.64259.542
43RedChampaeisiali0.1080.0003136.81887.29623.82177.875
44WhiteLatamahu0.2600.000733.29524.20214.10411.875
45RedLatachaunri0.2380.0015128.06891.53124.63448.292
46WhiteAC.106080.0870.00081.18214.5033.76921.208
47WhiteAC.101870.0870.000431.47734.58610.26135.792
48RedAC.101620.0650.000783.40976.79624.88864.333
49WhiteAC.72820.1080.00081.4779.8075.78422.250
50WhiteAC.72690.1080.00041.72212.5695.70923.500
51WhiteAC.71340.0870.00073.63612.4315.74631.208
52WhiteAC.70080.1080.00051.86423.2609.70132.458
53WhiteAC.90930.7140.00048.75024.3097.20120.792
54WhiteAC.90900.1730.000626.59122.2386.86619.958
55WhiteAC.9076A0.1520.000521.2509.9456.41820.792
56RedAC.90650.3900.0004126.59142.48626.60456.417
57RedAC.90630.1080.0007152.50031.87826.00761.208
58WhiteAC.90580.2380.000336.59115.1939.73916.833
59WhiteAC.9053A0.1950.001023.52312.0179.51528.708
60RedAC.90500.4110.0011116.47738.37023.65756.833
61WhiteAC.90050.1520.000313.4091.6575.78424.542
62WhiteAC.203890.1080.00041.40918.7303.76923.917
63WhiteAC.203710.1080.000519.77328.66410.18724.958
64RedAC.204230.1300.0007141.59159.77223.39671.208
65WhiteAC.203620.1520.000711.70521.66110.11231.625
66WhiteAC.203280.1520.000720.90923.2907.91048.208
67WhiteAC.203170.0650.000321.25028.99011.15737.667
68RedAC.202820.1520.0003169.09187.94842.127202.250
69RedAC.202460.2380.0002165.22786.97139.366187.875
70RedAC.203470.0650.0003132.72736.15628.06047.250
71WhitePalinadhan-10.0650.000427.38619.5775.44821.208
72WhiteChatuimuchi0.1080.000325.79521.8245.03726.625
73WhiteUttarbangalocal-90.2160.000611.36420.5214.77627.875
74WhiteGochi0.2160.00045.22719.47911.38121.208
75WhiteSugandha-20.1520.000216.93227.8506.67926.000
76WhiteJhingesal0.8010.000111.13614.6584.81336.208
77RedCheruvirippu0.1950.000246.93288.80422.42573.917
78RedMahamaga0.0650.0007111.75077.60831.90355.792
79WhiteJaya0.0650.00051.70524.42710.29934.958
80RedD10.1520.000678.86479.89830.26153.292
81RedPk-210.1520.000762.84188.04125.52259.542
82WhiteGandhakasala0.1520.00042.72724.4279.73928.083
83RedSreyas0.1080.0007117.50084.86026.60491.208
84RedGondiAC.hampeisiali0.2380.0005122.27391.69427.61242.250
85WhiteChinamal0.1950.000428.86423.77911.56723.292
86WhiteMagra0.1730.000421.47723.45316.60424.750
87RedLandi0.0870.0004104.65989.57725.07538.292
88WhiteLalgundi0.2380.000333.18226.3849.29118.708
89WhiteBalisaralaktimAC.hi0.3460.000214.77312.37813.95527.250
90WhiteLaxmibilash0.5410.000217.72723.1279.21616.625
91RedKaniar0.3900.000182.95589.25126.41848.083
92WhiteKanakchampa0.3680.000417.27318.5676.9032.833
93WhiteMagura-s0.3030.000217.2735.70010.5603.542
94WhiteAC.446030.2160.000332.27334.35111.94036.208
95RedAC.445850.3460.000985.22748.29529.96348.917
96WhiteAC.445980.1520.000220.00018.3218.95524.542
97RedAC.445920.2160.000668.06883.96934.104151.833
98RedAC.446460.8660.000465.00083.46144.813211.625
99WhiteAC.446040.3900.000319.88612.27612.20135.375
100WhiteAC.445970.1080.000432.95538.16816.56716.208
101WhiteAC.446380.1730.000325.79515.77610.67227.250
102RedAC.445950.5190.000354.65984.47849.440238.708
103RedAC.445880.3460.000254.54583.71535.149186.417
104RedAC.445910.0870.000494.77346.38735.59757.458
105RedAC.445940.3900.000262.27386.00529.507114.750
106RedAC.437370.4110.000352.50088.93136.642166.000
107WhiteAC.436600.5630.000344.43226.00511.23147.875
108WhiteAC.437320.1080.000241.25026.76825.67259.542
109WhiteAC.436610.2380.000336.81834.02014.62739.542
110RedAC.437380.6060.000275.34186.76840.933174.958
111WhiteAC.436690.2380.000245.00027.40515.74618.083
112WhiteAC.436630.2380.000322.04525.4969.47824.750
113RedAC.436580.1300.000486.36485.49638.84393.708
114WhiteAC.436620.1300.000421.25023.28210.63434.333
115RedAC.436700.2380.000480.45588.55059.142287.042
116WhiteAC.436750.3030.000348.63616.76811.71639.750
117RedAC.436760.2810.000345.34173.66435.522149.125
Mean 0.2190.00058.36544.91818.43558.691
CV % 10.7511.325.784.644.725.81
LSD5% 0.04480.000096.1223.3031.5796.54
CAT: catalase (unit min −1 g−1); PEROX: peroxidase (unit min −1 g−1); TPC: Total phenolics content (mg catechol or CE 100 g−1); DPPH: 2,2-diphenyl-1-picrylhydrazyl (% inhibition); FRAP: Ferric reducing antioxidant power Activity (µg ascorbic acid equivalent or AAE) g−1; CUPRAC: Cupric ion reducing antioxidant capacity (μg trolox equivalent or TE) g−1).
Table 2. The inferred ancestry value and population structure of individual members in the panel population with their antioxidant trait classification.
Sl. No.Accession No./
Vernacular Name of Germplasm Line
Inferred Ancestry Value at K = 3GroupAntioxidants Traits in Each Germplasm Line
Q1Q2Q3
1AC59930.9950.0030.003SP1Very low
2AC61700.9920.0060.002SP1Low
3AC60230.9810.0170.002SP1High Peroxidase
4AC61720.9610.0370.002SP1Low
5AC60270.0090.0020.989SP3Very low
6AC90060.9950.0030.002SP1Very low
7AC90210.9860.0110.003SP1Very low
8AC90280.9370.060.003SP1High Peroxidase
9AC90300.9940.0050.001SP1High Catalase
10AC90350.9870.0040.009SP1High Peroxidase
11AC90380.9980.0010.001SP1Very low
12AC90430.9980.0010.001SP1Low
13AC90440.9940.0020.003SP1Very low
14AC209200.9950.0020.003SP1High DPPH
15AC209070.9970.0020.001SP1High DPPH
16AC208450.9970.0020.001SP1High Peroxidase
17AC207700.9970.0010.002SP1High DPPH
18AC206270.9980.0010.001SP1High DPPH
19AC206860.9970.0020.001SP1Very low
20AC206640.9960.0020.001SP1Low
21AC206140.9960.0010.003SP1High DPPH
22Jhagrikarti0.990.0090.002SP1Very low
23Dadghani0.9910.0050.004SP1Very low
24Shayam0.0040.0020.994SP3High Catalase
25Basumati0.1380.0040.859SP3Low
26Bharati0.9970.0010.002SP1High DPPH
27Joha0.9970.0010.002SP1Very low
28Adira-10.6130.0180.369AMedium
29Adira-20.9970.0020.001SP1High DPPH
30Adira-30.6220.0030.376AHigh DPPH
31PK60.9690.0030.028SP1High DPPH
32Vachaw0.9460.0020.053SP1High DPPH
33Kozhivalan0.9980.0020.001SP1High DPPH
34Marathondi0.5150.0220.463AHigh DPPH
35Ezhoml-20.9980.0010.001SP1High DPPH
36Jyothi0.9980.0010.001SP1High DPPH
37Kantakopura0.9970.0010.002SP1High DPPH
38Kantakaamal0.6930.0810.227AHigh DPPH
39Kapanthi0.3020.3230.375AHigh DPPH
40Karpurkanti0.0020.0010.997SP3Very low
41Kathidhan0.8990.0950.006SP1High DPPH
42Kundadhan0.9950.0040.001SP1High TPC and DPPH
43Champaeisia0.9910.0030.006SP1High DPPH
44Latamahu0.9960.0020.002SP1Low
45Latachaunri0.9940.0040.002SP1High DPPH and Peroxidase
46AC106080.9950.0050.001SP1High Peroxidase
47AC101870.9450.0520.002SP1High DPPH
48AC101620.9630.0210.016SP1High DPPH
49AC72820.0020.0010.997SP1High Peroxidase
50AC72690.9970.0020.001SP1Very low
51AC71340.7850.0060.208ALow
52AC70080.9980.0010.001SP1Low
53AC90930.9960.0010.003SP1High Catalase
54AC90900.9930.0030.004SP1Very low
55AC9076A0.9950.0030.001SP1Low
56AC90650.9730.0030.024SP1Low
57AC90630.9930.0060.001SP1High TPC
58AC90580.9980.0010.001SP1Low
59AC9053A0.8310.1580.011SP1High Peroxidase
60AC90500.9940.0010.004SP1Low
61AC90050.9940.0040.002SP1Low
62AC203890.9450.0350.02SP1Low
63AC203710.9930.0060.001SP1Low
64AC204230.9960.0030.001SP1Low
65AC203620.9770.0180.005SP1Low
66AC203280.9860.0080.006SP1Low
67AC203170.9960.0020.002SP1Low
68AC202820.8890.1040.007SP1High CUPRAC, Cata, TPC, DPPH and FRAP
69AC202460.8940.0170.089SP1High CUPRAC, FRAP and DPPH
70AC203470.9430.0550.002SP1Low
71Palinadhan-0.3340.2140.452AHigh DPPH
72Chatuimuchi0.0010.0010.998SP3Very low
73Uttarbangal0.9040.0940.002SP1Very low
74Gochi0.9410.0530.006SP1High DPPH
75Sugandha-20.0020.0010.998SP3Very low
76Jhingesal0.9970.0020.001SP1High Catatalase
77Cheruviripp0.9960.0030.001SP1High DPPH
78Mahamaga0.9850.0130.002SP1High DPPH
79Jaya0.9910.0080.001SP1Low
80D10.9440.0330.023SP1High DPPH
81PK210.9850.0140.001SP1High DPPH
82Gandhakasal0.0040.0030.993SP3Very low
83Sreyas0.9950.0020.003SP1High DPPH
84Gondiachamp0.9950.0020.003SP1High DPPH
85Chinamal0.9810.0010.017SP1Low
86Magra0.9950.0020.003SP1Very low
87Landi0.9970.0010.002SP1High DPPH
88Lalgundi0.990.0030.007SP1Very low
89Balisaralak0.9940.0030.003SP1Very low
90Laxmibilash0.4260.0020.572ALow
91Kaniar0.980.0050.016SP1High DPPH
92Kanakchampa0.9760.0030.02SP1Very low
93Magura-S0.8950.0010.104SP1Very low
94AC446030.0170.9810.001SP2Low
95AC445850.0040.9840.012SP2High Peroxidase
96AC445980.0070.9870.006SP2Low
97AC445920.9950.0030.003SP2High DPPH
98AC446460.0010.9970.001SP2High Cata, DPPH, FRAP and CUPRAC
99AC446040.0010.9980.001SP2Medium
100AC445970.0130.980.007SP2Medium
101AC446380.0020.9970.001ALow
102AC445950.0010.2840.715SP2High CUPRAC, FRAP and DPPH
103AC445880.0050.9940.002SP2High CUPRAC, DPPH and FRAP
104AC445910.0020.9970.001SP2Low
105AC445940.0020.9980.001SP2High DPPH
106AC437370.010.9880.002SP2High DPPH and CUPRAC
107AC436600.0020.9970.001SP2High Catalase, DPPH, FRAP, CUPRAC
108AC437320.0030.9960.001SP2High Catalase, DPPH and CUPRAC
109AC436610.0010.9980.001SP2Low
110AC437380.0040.9950.001SP2High Catalase and CUPRAC
111AC436690.0020.9970.001SP2High DPPH
112AC436630.0030.9940.003SP2High DPPH
113AC436580.0010.9970.002SP2High DPPH
114AC436620.0010.9980.001SP2Low
115AC436700.0030.9810.016SP2High DPPH and CUPRAC
116AC436750.0020.8050.193SP2High DPPH
117AC436760.0020.9860.012SP2Medium
Table 3. Analysis of molecular variance (AMOVA) of the subpopulations of the panel population for antioxidant properties in 117 rice genotypes.
Source of VariationAMOVA for the Four Subpopulations at K = 3
df.Mean Sum of SquaresVariance ComponentsPercentage Variation
Among populations30.6410.0031%
Among individuals (accessions) within population1130.5140.0224%
Within individuals (accessions)1170.4700.47095%
Total233 0.495
F-StatisticsValuep-value
FST0.0060.121
FIS0.0450.003
FIT0.0510.001
FST max. 0.014
F’ST 0.460
Table 4. Marker–trait associations with antioxidant traits catalase, peroxidase, DPPH, FRAP and CUPRAC in the panel population detected by both GLM and MLM at p < 0.01.
Sl.
No.
Antioxidant
Enzymes
MarkerPosition
(cM)
GLMMLM
Marker_FMarker_pMarker_R2q-ValueMarker_FMarker_pMarker_R2q-Value
1CatalaseRM134180.29.997470.002040.080160.005647.85660.0060.071790.00994
2CatalaseRM323132.710.555770.001540.084240.005648.160130.005140.074570.009638
3DPPHRM24732.310.720250.001420.088550.0096610.073840.001960.091620.006125
4DPPHRM370145.311.908137.99 × 10−40.097380.0056411.097330.001180.100930.006125
5DPPHRM13600110.29.406510.002730.07790.006526.887230.009940.062640.00994
6FRAPRM24732.29.406510.002730.07790.006177.145970.008680.065510.00994
7FRAPRM370145.39.112310.003170.067810.006178.984190.003380.082360.007243
8FRAPRM30974.512.354956.44 × 10−40.089460.006177.357630.007770.067450.00994
9CUPRACRM370145.314.568122.26 × 10−40.103440.007719.653650.002410.086780.006125
10CUPRACRM235101.89.112310.003170.067810.0056410.039310.001990.090240.006125
11CUPRACRM148142.312.354956.44 × 10−40.089460.009667.035230.00920.063240.00994
Publisher’s Note: MDPI stays neutral with regard to jurisdictional claims in published maps and institutional affiliations.

