
Modelling the Plant Uptake of Metals from Release Rates Obtained by the EUF Method


Abstract
:1. Introduction
2. Material and Methods
2.1. Soil Samples
2.2. Test Plants
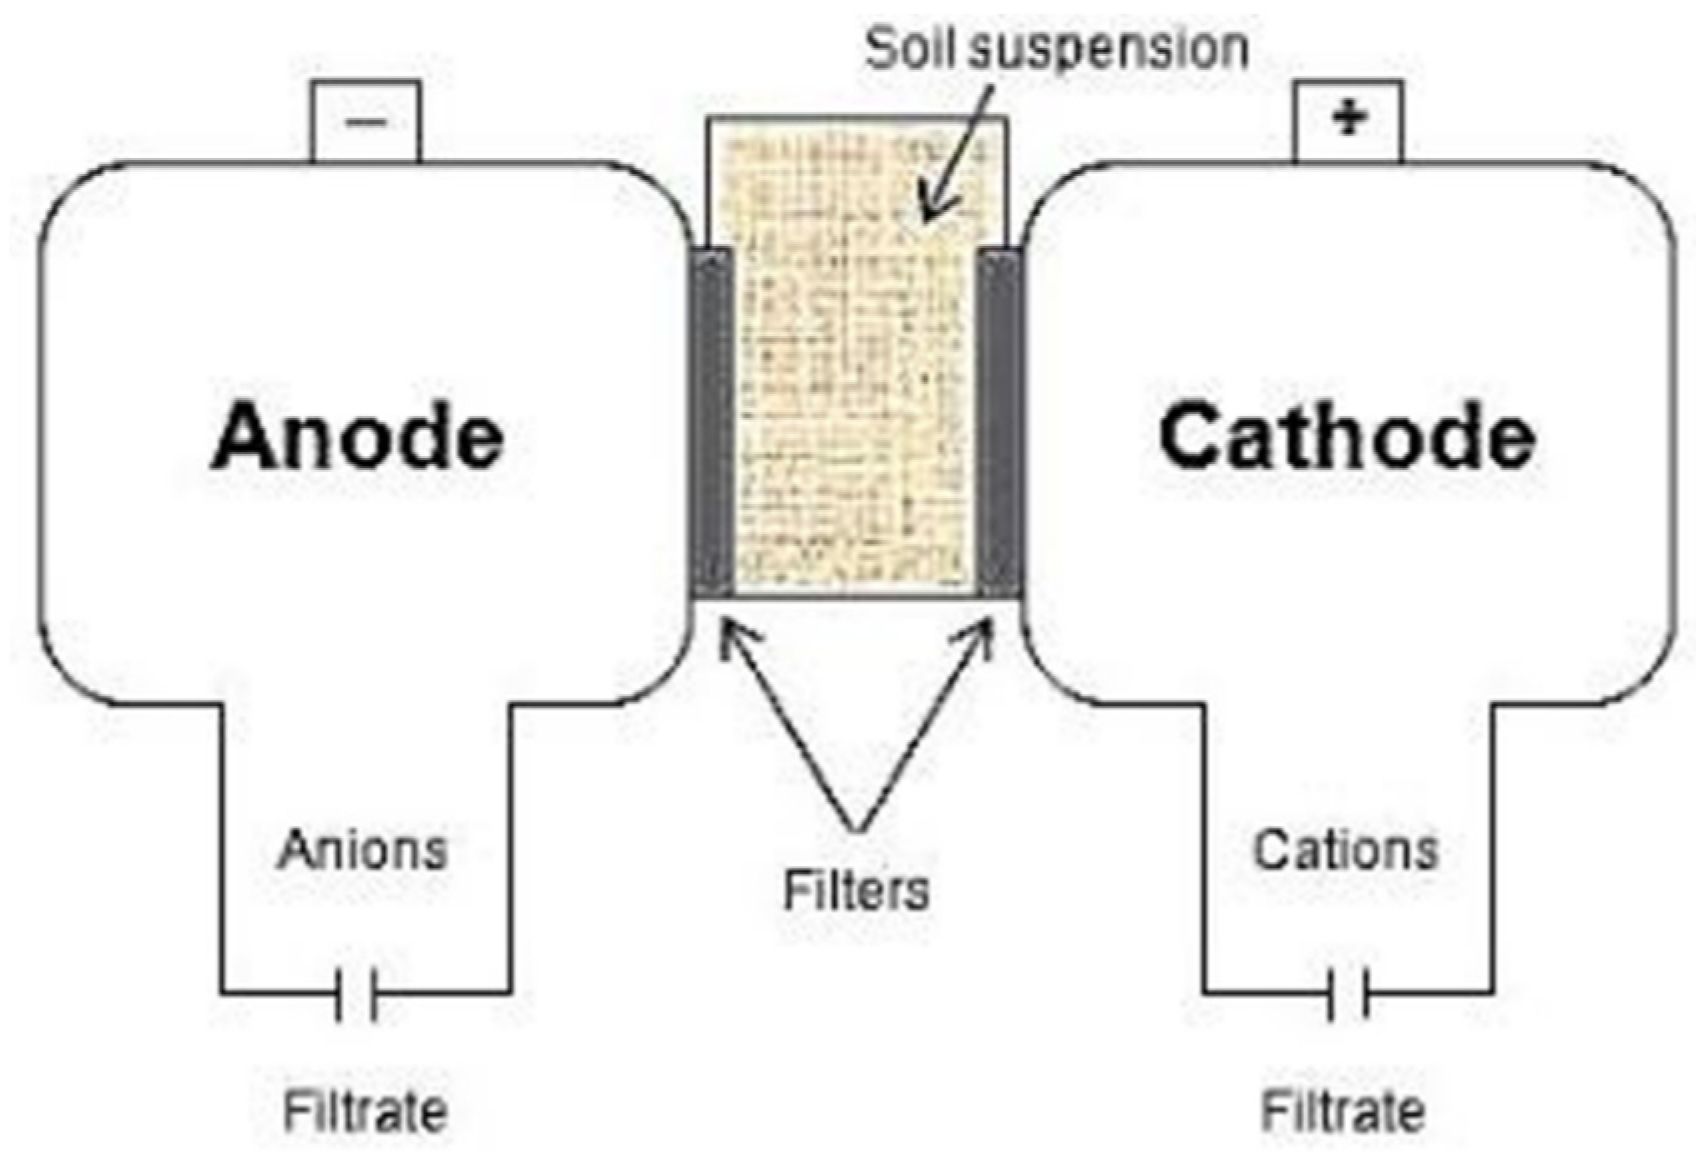
2.3. EUF Procedure
2.4. Kinetic Modelling
2.5. Connections with Plant Uptake
3. Results
4. Discussion
5. Conclusions
Funding
Institutional Review Board Statement
Informed Consent Statement
Data Availability Statement
Acknowledgments
Conflicts of Interest
References
- Marschner, H. Mineral Nutrition of Higher Plants, 2nd ed.; Academic Press: Cambridge, MA, USA, 1995. [Google Scholar]
- Wissemeier, A.; Olfs, H.W. (Eds.) Den Nährstoffen Auf der Spur; Erling Verlag: Clenze, Germany, 2019; p. 288. ISBN 978-3-86263-118-6. [Google Scholar]
- Jelecevic, A.; Wellacher, M.; Sager, M.; Liebhard, P. Heavy metals in soils from selected locations in Styria. Wasser Und Abfall 2018, 5, 25–31. (In German) [Google Scholar] [CrossRef]
- Sager, M. Chemical speciation and environmental mobility of heavy metals in sediments and soils. In Hazardous Metals in the Environment; Stoeppler, M., Ed.; Elsevier Science Publishers: Amsterdam, The Netherlands, 1992; pp. 133–175. [Google Scholar]
- Sager, M. Metals in the environment, mobility, bioaccessibility and contamination. Carpathian J. Earth Environ. Sci. 2020, 15, 47–70. [Google Scholar] [CrossRef]
- Grilli, E.; Ganga, A.; Salvestrini, S. Modelling the kinetics of elements release from a zeolitic rich tuff. Environments 2020, 7, 41. [Google Scholar] [CrossRef]
- Berner, R.A. Rate control of mineral dissolution under earth surface conditions. Am. J. Sci. 1978, 278, 1235–1252. [Google Scholar] [CrossRef]
- Pirkl, H.; Schedl, A.; Pfleiderer, S. Geochemischer Atlas von Österreich–Bundesweite Bach- und Flusssedimentgeochemie. Arch. Für Lagerstättenforschung 2015, 28, 288. [Google Scholar]
- ÖNORM L 1056 Sampling of Grassland (Including Parks and Green Areas), 1 July 2004. Available online: https://shop.austrian-standards.at/action/en/public/details/180359/OENORM_L_1056_2004_07_01;jsessionid=A59B4033BB796D779C2AD043B70A7020 (accessed on 26 December 2021).
- ÖNORM EN 15933: Sludge, Treated Biowaste and Soil—Determination of pH, 1 October 2012. Available online: https://shop.austrian-standards.at/action/de/public/details/445999/OENORM_EN_15933_2012_10_01;jsessionid=1FAAF937AC2C2224FE4402967B6E9B36 (accessed on 26 December 2021).
- ÖNORM L 1061-2 Physical Soil Investigations—Determination of Grain Size Distributions of Mineral Soils. Part 2 Fine Soils, 1 February 2002. Available online: https://www.bdb.at/Service/NormenDetail?id=651037 (accessed on 26 December 2021).
- ÖNORM L 1080 Chemical Analysis of Soil; Determination of Humus by Dry Combustion of Carbon, 1 January 1989. Available online: http://www.ydylstandards.org.cn/static/down/pdf/ONORM%20L%201080-1999_5625.pdf (accessed on 26 December 2021).
- Sager, M.; Chon, H.T.; Lee, S.Y. Growth of lettuce (lactuca sativa) at mine tailings from Shiheung/ Korea, and the effect of added organic complexants on metal mobilities. Ecol. Chem. Eng. 2010, 17, 177–197. [Google Scholar]
- Németh, K. Electro-ultrafiltration of aqueous soil suspension with simultaneously varying temperature and voltage. Plant Soil 1982, 64, 7–23. [Google Scholar] [CrossRef]
- Nemeth, K. Recent advances in EUF research (1980–1983). Plant Soil 1985, 83, 1–19. [Google Scholar] [CrossRef]
- Horn, D. Determination of micronutrients and heavy metals in soils using electro-ultrafiltration (EUF) technique by addition of DTPA (in German). J. Plant Nutr. Soil Sci. 2006, 169, 83–86. [Google Scholar] [CrossRef]
- Ma, Q.Y.; Traina, S.J.; Logan, T.J.; Ryan, J.A. Effects of aqueous Al, Cd, Cu, Fe(II), Ni, and Zn on Pb immobilization by hydroxyapatite. Environ. Sci. Technol. 1994, 28, 1219–1228. [Google Scholar] [CrossRef] [PubMed]
- Hafsteinsdottir, E.G.; Camenzuli, D.; Rocavert, A.L.; Walworth, J.; Gore, D.B. Chemical immobilization of metals and metalloids by phosphates. Appl. Geochem. 2015, 59, 47–62. [Google Scholar] [CrossRef]
- Lü, X.-N.; Xu, J.-M.; Ma, W.-Z.; Lu, Y.-F. Comparison of seven kinetic equations for K-release and application of kinetic parameters. Pedosphere 2007, 17, 124–129. [Google Scholar] [CrossRef]
- Kumar, E.; Bhatnagar, A.; Ji, M.; Jung, W.; Lee, S.-H.; Kim, S.-J.; Lee, G.-H.; Song, H.-C.; Choi, J.-Y.; Yang, J.-S.; et al. Defluoridation from aqueous solutions by granular ferric hydroxide. Water Res. 2009, 43, 490–498. [Google Scholar] [CrossRef] [PubMed]
- Daifullah, A.A.M.; Yakout, S.M.; Elreefy, S.A. Adsorption of fluoride in aqueous solutions using KMnO4-modified activated carbon derived from steam pyrolysis of rice straw. J. Hazard. Mat. 2007, 147, 633–643. [Google Scholar] [CrossRef] [PubMed]
- Anderegg, G.; Nägeli, P.; Müller, F.; Schwarzenbach, G.; Komplexone, X. Diäthylentriamin-pentaessigsäure (DTPA). Helv. Chim. Acta 1959, 42, 827–836. [Google Scholar] [CrossRef]
- Soltanpour, P.N.; Khan, A.; Lindsay, W.L. Factors affecting DTPA-extractable Zn, Fe, Mn, and Cu from soils. Commun. Soil Sci. Plant Anal. 1976, 7, 797–821. [Google Scholar] [CrossRef]
- Lindsay, W.L.; Norvell, W.A. Development of a DTPA Soil Test for Zinc, Iron, Manganese, and Copper. Soil Sci. Am. J. 1978, 42, 421–428. [Google Scholar] [CrossRef]
- Dang, Y.P.; Dalal, R.C.; Edwards, D.G.; Tiller, K.G. Kinetics of zinc desorption from vertisols. Soil Sci. Soc. Am. J. 1994, 58, 1392–1399. [Google Scholar] [CrossRef]
- Motlagh, M.B. Kinetics and mechanism of copper release from selected agricultural calcareous soils of northern Iran. Soil Res. 2012, 50, 312–319. [Google Scholar] [CrossRef]

| Location | pH | Sand % | Silt % | Clay % | C-org mg/kg | Pb mg/kg | Ni mg/kg | Cd mg/kg | Cu mg/kg | Cr mg/kg | As mg/kg |
|---|---|---|---|---|---|---|---|---|---|---|---|
| Rabenstein | 6.9 | 46 | 41 | 13 | 2.8 | 340 | 42 | 1.8 | 47 | 27 | 19 |
| Arzwaldgraben | 7.4 | 26 | 64 | 10 | 5.4 | 800 | 51 | 2.6 | 45 | 75 | 12 |
| Zeltweg | 6.2 | 30 | 62 | 8 | 4.1 | 130 | 43 | 0.24 | 44 | 58 | 35 |
| Kraubath | 7.3 | 44 | 47 | 9 | 4.6 | 21 | 24 | <0.2 | 36 | 26 | 8 |
| Kinetic Model. | f(x) | Release Rate = dy/dt |
|---|---|---|
| Linear equation | y = b + at | dy/dt = a |
| Elovich equation | y = b + a ln(t) | dy/dt = a/t |
| Weber–Morris equation | y = b + a √t | dy/dt = a/√t |
| Power equation | ln(y) = b + a ln (t) | dy/dt = a/t·(b + a ln (t)) |
| Al | As | Be | Cd | Co | Cr | Cu | Fe | Li | Mn | Ni | Pb | Sb | Sr | Ti | V | Zn |
|---|---|---|---|---|---|---|---|---|---|---|---|---|---|---|---|---|
| Rabenstein | ||||||||||||||||
| 5.42 | 0.349 | 0.092 | 0.311 | 0.364 | 0.163 | 3.35 | 25.57 | 0.0466 | 36.68 | 1.34 | 21.62 | 0.121 | 0.912 | 0.082 | 0.096 | 17.34 |
| 9.93 | 0.232 | 0.078 | 0.203 | 0.588 | 0.136 | 2.01 | 36.24 | 0.0298 | 45.72 | 1.29 | 23.83 | 0.118 | 0.847 | 0.078 | 0.056 | 14.62 |
| 11.97 | 0.141 | 0.072 | 0.120 | 0.652 | 0.114 | 0.80 | 34.05 | 0.0194 | 41.16 | 0.75 | 18.44 | 0.108 | 0.641 | 0.098 | 0.048 | 9.03 |
| 14.37 | 0.102 | 0.074 | 0.085 | 0.711 | 0.117 | 0.47 | 34.06 | 0.0148 | 39.93 | 0.69 | 16.56 | 0.111 | 0.544 | 0.090 | 0.044 | 6.53 |
| 15.72 | 0.078 | 0.073 | 0.061 | 0.701 | 0.114 | 0.18 | 32.67 | 0.0119 | 37.13 | 0.53 | 13.67 | 0.110 | 0.475 | 0.096 | 0.042 | 4.87 |
| Rabenstein + PK | ||||||||||||||||
| 3.58 | 0.253 | 0.074 | 0.222 | 0.271 | 0.063 | 0.491 | 19.35 | 0.0271 | 31.54 | 0.89 | 18.69 | 0.112 | 0.865 | 0.009 | 0.027 | 14.93 |
| 7.44 | 0.194 | 0.076 | 0.168 | 0.471 | 0.079 | 0.327 | 29.44 | 0.0238 | 39.28 | 0.64 | 21.46 | 0.115 | 0.834 | 0.033 | 0.050 | 13.36 |
| 9.97 | 0.132 | 0.074 | 0.112 | 0.593 | 0.083 | 0.017 | 31.15 | 0.0176 | 39.20 | 0.50 | 19.10 | 0.112 | 0.668 | 0.054 | 0.039 | 9.35 |
| 11.70 | 0.095 | 0.073 | 0.076 | 0.642 | 0.083 | 0.016 | 30.45 | 0.0131 | 37.46 | 0.40 | 16.49 | 0.110 | 0.558 | 0.065 | 0.033 | 6.63 |
| 12.91 | 0.069 | 0.073 | 0.053 | 0.638 | 0.083 | 0.016 | 29.53 | 0.0104 | 35.34 | 0.30 | 13.69 | 0.109 | 0.477 | 0.069 | 0.030 | 4.91 |
| Rabenstein + metal | ||||||||||||||||
| 4.11 | 0.736 | 0.084 | 0.704 | 0.306 | 0.099 | 1.01 | 26.75 | 0.0275 | 29.16 | 42.75 | 18.93 | 0.116 | 0.910 | 0.045 | 0.037 | 14.73 |
| 8.62 | 0.560 | 0.076 | 0.529 | 0.535 | 0.105 | 0.88 | 39.97 | 0.0143 | 36.24 | 42.04 | 19.81 | 0.115 | 0.844 | 0.044 | 0.031 | 12.96 |
| 11.23 | 0.359 | 0.074 | 0.331 | 0.647 | 0.104 | 0.47 | 40.15 | 0.0110 | 35.47 | 29.27 | 17.33 | 0.112 | 0.813 | 0.061 | 0.035 | 8.63 |
| 13.04 | 0.239 | 0.073 | 0.219 | 0.685 | 0.108 | 0.15 | 38.57 | 0.0084 | 33.67 | 20.02 | 14.27 | 0.110 | 0.576 | 0.087 | 0.030 | 5.93 |
| 13.85 | 0.167 | 0.072 | 0.147 | 0.654 | 0.110 | 0.02 | 35.61 | 0.0068 | 30.88 | 13.79 | 11.56 | 0.108 | 0.480 | 0.080 | 0.029 | 4.26 |
| Arzwaldgraben | ||||||||||||||||
| 2.503 | 0.425 | 0.074 | 0.390 | 0.258 | 0.117 | 1.102 | 22.36 | 0.041 | 31.32 | 0.790 | 64.21 | 0.108 | 1.712 | 0.016 | 0.064 | 21.16 |
| 2.964 | 0.326 | 0.068 | 0.295 | 0.469 | 0.118 | 1.127 | 34.48 | 0.032 | 44.01 | 0.780 | 74.43 | 0.105 | 1.535 | 0.013 | 0.079 | 18.48 |
| 3.306 | 0.213 | 0.064 | 0.189 | 0.625 | 0.111 | 0.896 | 35.78 | 0.023 | 45.57 | 0.525 | 61.28 | 0.099 | 1.208 | 0.021 | 0.079 | 13.20 |
| 3.911 | 0.153 | 0.063 | 0.132 | 0.696 | 0.112 | 0.380 | 36.54 | 0.017 | 45.09 | 0.433 | 51.20 | 0.098 | 1.042 | 0.033 | 0.080 | 10.48 |
| 4.475 | 0.110 | 0.060 | 0.092 | 0.663 | 0.108 | 0.233 | 34.97 | 0.014 | 39.71 | 0.370 | 40.80 | 0.093 | 0.893 | 0.042 | 0.076 | 7.86 |
| Arzwaldgraben + PK | ||||||||||||||||
| 3.942 | 0.378 | 0.078 | 0.343 | 0.240 | 0.100 | 1.567 | 24.09 | 0.045 | 23.48 | 0.658 | 61.41 | 0.112 | 1.547 | 0.018 | 0.098 | 18.87 |
| 4.968 | 0.293 | 0.069 | 0.263 | 0.521 | 0.098 | 1.509 | 35.06 | 0.033 | 42.75 | 0.739 | 68.02 | 0.106 | 1.341 | 0.063 | 0.105 | 15.93 |
| 5.560 | 0.199 | 0.065 | 0.175 | 0.736 | 0.098 | 0.903 | 37.46 | 0.023 | 49.80 | 0.592 | 56.00 | 0.100 | 1.091 | 0.054 | 0.104 | 12.13 |
| 6.309 | 0.143 | 0.063 | 0.124 | 0.802 | 0.103 | 0.541 | 37.76 | 0.018 | 49.14 | 0.523 | 45.30 | 0.097 | 0.917 | 0.071 | 0.102 | 9.03 |
| 7.177 | 0.110 | 0.061 | 0.093 | 0.768 | 0.106 | 0.342 | 37.51 | 0.014 | 44.26 | 0.458 | 37.14 | 0.094 | 0.807 | 0.085 | 0.096 | 7.03 |
| Arzwaldgraben + metal | ||||||||||||||||
| 2.786 | 1.542 | 0.072 | 1.393 | 0.224 | 0.096 | 1.454 | 20.28 | 0.040 | 28.15 | 54.28 | 63.18 | 0.108 | 1.477 | 0.005 | 0.076 | 15.26 |
| 3.795 | 1.147 | 0.068 | 1.021 | 0.468 | 0.111 | 1.612 | 32.51 | 0.032 | 39.69 | 57.51 | 71.83 | 0.106 | 1.390 | 0.006 | 0.105 | 14.05 |
| 4.303 | 0.730 | 0.064 | 0.696 | 0.652 | 0.106 | 1.119 | 35.41 | 0.022 | 42.84 | 42.88 | 59.46 | 0.100 | 1.012 | 0.023 | 0.096 | 10.26 |
| 4.842 | 0.491 | 0.062 | 0.463 | 0.714 | 0.106 | 0.627 | 35.57 | 0.016 | 41.78 | 32.79 | 47.85 | 0.096 | 0.848 | 0.031 | 0.084 | 7.46 |
| 5.512 | 0.351 | 0.061 | 0.327 | 0.694 | 0.108 | 0.354 | 36.43 | 0.013 | 39.27 | 24.99 | 38.84 | 0.094 | 0.745 | 0.037 | 0.081 | 5.73 |
| Zeltweg | ||||||||||||||||
| 11.63 | 0.078 | 0.084 | 0.058 | 0.119 | 0.119 | 1.901 | 27.36 | 0.045 | 9.57 | 0.48 | 8.38 | 0.122 | 1.081 | 0.168 | 0.235 | 1.020 |
| 18.20 | 0.038 | 0.073 | 0.022 | 0.183 | 0.106 | 1.692 | 38.68 | 0.034 | 14.52 | 0.81 | 7.95 | 0.119 | 0.949 | 0.255 | 0.299 | 0.991 |
| 20.80 | 0.024 | 0.072 | 0.009 | 0.214 | 0.111 | 1.115 | 39.90 | 0.027 | 13.78 | 0.68 | 5.87 | 0.116 | 0.781 | 0.298 | 0.284 | 0.598 |
| 22.68 | 0.016 | 0.072 | 0.003 | 0.219 | 0.114 | 0.780 | 39.33 | 0.021 | 12.47 | 0.62 | 4.46 | 0.117 | 0.644 | 0.319 | 0.261 | 0.418 |
| 23.18 | 0.013 | 0.071 | 0.000 | 0.206 | 0.113 | 0.503 | 36.87 | 0.017 | 11.03 | 0.64 | 3.35 | 0.113 | 0.527 | 0.316 | 0.226 | 0.354 |
| Zeltweg + PK | ||||||||||||||||
| 11.91 | 0.096 | 0.091 | 0.075 | 0.150 | 0.147 | 1.702 | 32.84 | 0.040 | 15.88 | 0.48 | 9.34 | 0.121 | 1.053 | 0.192 | 0.222 | 0.752 |
| 18.08 | 0.037 | 0.074 | 0.020 | 0.147 | 0.108 | 1.427 | 42.61 | 0.023 | 13.92 | 0.39 | 8.41 | 0.115 | 0.895 | 0.262 | 0.253 | 0.259 |
| 21.29 | 0.023 | 0.074 | 0.007 | 0.171 | 0.115 | 0.995 | 43.17 | 0.019 | 12.14 | 0.28 | 6.43 | 0.115 | 0.750 | 0.310 | 0.248 | 0.106 |
| 22.74 | 0.017 | 0.073 | 0.001 | 0.176 | 0.114 | 0.594 | 40.76 | 0.015 | 10.71 | 0.20 | 4.83 | 0.113 | 0.614 | 0.319 | 0.233 | 0.003 |
| 23.12 | 0.013 | 0.072 | 0.000 | 0.166 | 0.117 | 0.377 | 38.00 | 0.013 | 9.54 | 0.15 | 3.62 | 0.110 | 0.517 | 0.316 | 0.204 | 0.043 |
| Zeltweg + metal | ||||||||||||||||
| 10.42 | 0.288 | 0.075 | 0.252 | 0.090 | 0.110 | 1.264 | 28.23 | 0.027 | 12.26 | 13.43 | 8.67 | 0.117 | 1.059 | 0.160 | 0.227 | 0.723 |
| 16.70 | 0.201 | 0.077 | 0.174 | 0.148 | 0.136 | 1.112 | 41.51 | 0.026 | 13.42 | 12.72 | 8.27 | 0.119 | 0.939 | 0.285 | 0.322 | 0.464 |
| 19.60 | 0.125 | 0.077 | 0.103 | 0.170 | 0.135 | 0.664 | 42.84 | 0.021 | 11.85 | 8.98 | 6.25 | 0.118 | 0.785 | 0.349 | 0.301 | 0.238 |
| 21.22 | 0.082 | 0.077 | 0.062 | 0.172 | 0.136 | 0.295 | 41.34 | 0.017 | 10.47 | 6.25 | 4.60 | 0.116 | 0.641 | 0.362 | 0.264 | 0.111 |
| 22.24 | 0.055 | 0.076 | 0.036 | 0.164 | 0.132 | 0.077 | 39.12 | 0.014 | 9.42 | 4.45 | 3.50 | 0.115 | 0.537 | 0.358 | 0.232 | 0.071 |
| Kraubath | ||||||||||||||||
| 6.74 | 0.070 | 0.079 | 0.050 | 0.100 | 0.116 | 0.599 | 24.47 | 0.023 | 10.07 | 1.04 | 2.21 | 0.118 | 1.336 | 0.135 | 0.120 | 2.24 |
| 8.74 | 0.030 | 0.063 | 0.014 | 0.087 | 0.092 | 0.562 | 34.81 | 0.009 | 9.92 | 0.39 | 1.33 | 0.108 | 1.073 | 0.170 | 0.133 | 1.80 |
| 9.72 | 0.021 | 0.061 | 0.007 | 0.096 | 0.095 | 0.448 | 36.57 | 0.007 | 8.94 | 0.32 | 1.03 | 0.104 | 0.829 | 0.214 | 0.128 | 1.27 |
| 10.73 | 0.043 | 0.059 | 0.029 | 0.103 | 0.100 | 0.408 | 37.05 | 0.006 | 8.34 | 0.35 | 0.89 | 0.101 | 0.693 | 0.247 | 0.122 | 1.05 |
| 11.56 | 0.044 | 0.058 | 0.030 | 0.107 | 0.099 | 0.337 | 36.48 | 0.005 | 7.76 | 0.40 | 0.83 | 0.098 | 0.573 | 0.259 | 0.111 | 0.85 |
| Kraubath + metal | ||||||||||||||||
| 3.88 | 0.903 | 0.063 | 0.817 | 0.226 | 0.096 | 1.933 | 21.81 | 0.045 | 23.28 | 23.38 | 57.70 | 0.114 | 1.833 | 0.020 | 0.070 | 14.03 |
| 4.23 | 0.688 | 0.059 | 0.652 | 0.497 | 0.096 | 2.302 | 30.36 | 0.036 | 41.72 | 28.38 | 67.22 | 0.108 | 1.508 | 0.010 | 0.089 | 12.61 |
| 4.75 | 0.445 | 0.057 | 0.416 | 0.688 | 0.101 | 1.509 | 32.94 | 0.025 | 46.16 | 22.74 | 55.35 | 0.103 | 1.164 | 0.027 | 0.091 | 9.03 |
| 5.41 | 0.283 | 0.054 | 0.260 | 0.744 | 0.101 | 1.189 | 32.62 | 0.017 | 44.99 | 16.99 | 42.86 | 0.097 | 0.907 | 0.031 | 0.082 | 6.40 |
| 5.85 | 0.226 | 0.053 | 0.207 | 0.729 | 0.101 | 0.966 | 32.70 | 0.014 | 41.76 | 14.50 | 37.52 | 0.097 | 0.828 | 0.040 | 0.078 | 5.41 |
| Time to Reach Max. Conc. | Slope a | Intercept b | Maximum Releasable Concentrations | |||||||||
|---|---|---|---|---|---|---|---|---|---|---|---|---|
| Correlations | Leaf µg | Root µg | Sum µg | Leaf µg | Root µg | Sum µg | Leaf µg | Root µg | Sum µg | Leaf µg | Root µg | Sum µg |
| As | ||||||||||||
| Elovich | 0.2134 | 0.0723 | 0.2523 | 0.2792 | −0.3769 | 0.1625 | −0.2916 | 0.3870 | −0.1719 | 0.2799 | −0.3881 | 0.1595 |
| Weber–Morris | 0.1848 | 0.0941 | 0.2289 | 0.2796 | −0.3777 | 0.1626 | −0.3054 | 0.3991 | −0.1820 | 0.2778 | −0.3930 | 0.1558 |
| Linear | 0.1642 | 0.0968 | 0.2078 | 0.2800 | −0.3782 | 0.1629 | 0.2619 | −0.3601 | 0.1503 | 0.2748 | −0.4001 | 0.1503 |
| Cd | ||||||||||||
| Elovich | −0.4708 | −0.2838 | −0.4652 | 0.2163 | 0.4371 | 0.2505 | −0.2018 | −0.4061 | −0.2334 | 0.2095 | 0.4299 | 0.2433 |
| Weber–Morris | −0.4370 | −0.2290 | −0.4277 | 0.2086 | 0.4151 | 0.2407 | −0.1744 | −0.3441 | −0.2009 | 0.2012 | 0.4135 | 0.2338 |
| Linear | −0.4465 | −0.2328 | −0.4368 | 0.2155 | 0.4370 | 0.2497 | 0.2339 | 0.4721 | 0.2707 | 0.1996 | 0.4253 | 0.2337 |
| Cu | ||||||||||||
| Elovich | 0.2296 | −0.6832 * | 0.0922 | 0.1437 | −0.2802 | 0.0937 | 0.0058 | 0.4202 | 0.1092 | 0.2578 | −0.2435 | 0.2314 |
| Weber–Morris | 0.2982 | −0.8266 ** | 0.1345 | 0.1643 | −0.3121 | 0.1091 | −0.4483 | 0.7995 ** | −0.3105 | 0.1800 | −0.4092 | 0.1031 |
| Linear | 0.3102 | −0.8229 ** | 0.1489 | 0.1746 | −0.3290 | 0.1166 | −0.3638 | 0.6371 * | −0.2548 | 0.1834 | −0.4164 | 0.1051 |
| Ni | ||||||||||||
| Elovich | −0.2415 | −0.2803 | −0.2559 | 0.7272 * | 0.8545 ** | 0.7729 ** | −0.7412 ** | −0.8431 ** | −0.7819 ** | 0.7274 * | 0.8492 ** | 0.7719 ** |
| Weber–Morris | −0.2074 | −0.2984 | −0.2319 | 0.7276 * | 0.8541 ** | 0.7731 ** | −0.7463 ** | −0.8324 ** | −0.7838 ** | 0.7341 * | 0.8499 ** | 0.7775 ** |
| Linear | −0.0675 | −0.1540 | −0.0874 | 0.7279 * | 0.8537 ** | 0.7733 ** | 0.6245 * | 0.8393 ** | 0.6858 * | 0.7356 ** | 0.8491 ** | 0.7786 ** |
| Pb | ||||||||||||
| Elovich | 0.3787 | 0.4582 | 0.4743 | 0.6204 * | 0.5133 | 0.6808 * | −0.6275 | −0.5196 | −0.6888 * | 0.6314 * | 0.5337 | 0.6975 * |
| Weber–Morris | 0.4863 | 0.4937 | 0.5707 | 0.6208 * | 0.5140 | 0.6814 * | −0.6314 * | −0.5238 | −0.6935 * | 0.6329 * | 0.5351 | 0.6992 * |
| Linear | 0.5485 | 0.5084 | 0.6240 * | 0.6212 * | 0.5146 | 0.6819 * | 0.5309 | 0.4306 | 0.5791 | 0.6338 * | 0.5357 | 0.7001 * |
| Zn | ||||||||||||
| Elovich | 0.3927 | 0.1565 | 0.3615 | 0.8328 ** | 0.7785 ** | 0.8488 ** | −0.2999 | −0.2757 | −0.3048 | 0.7588 ** | 0.7069 * | 0.7729 ** |
| Weber–Morris | 0.4729 | 0.3029 | 0.4564 | 0.8316 ** | 0.7770 ** | 0.8475 ** | −0.7877 ** | −0.6916 * | −0.7946 ** | 0.7996 ** | 0.7584 ** | 0.8170 ** |
| Linear | 0.5930 | 0.3597 | 0.5685 | 0.8304 ** | 0.7755 ** | 0.8463 ** | 0.8579 ** | 0.8648 ** | 0.8860 ** | 0.8155 ** | 0.7575 ** | 0.8303 ** |
| Li | Li | |||||||||||
| Elovich | −0.1197 | −0.3346 | −0.2006 | 0.5613 | 0.4747 | 0.6433 * | −0.5397 | −0.4980 | −0.6299 * | 0.5900 | 0.4108 | 0.6523 * |
| Weber–Morris | 0.0549 | −0.0205 | 0.0447 | 0.5640 | 0.4757 | 0.6461 * | 0.5165 | −0.3511 | 0.3780 | 0.6633 * | 0.2855 | 0.6854 * |
| Linear | −0.3865 | −0.4020 | −0.4634 | 0.5511 | 0.4694 | 0.6325 * | 0.0585 | −0.3236 | −0.0343 | 0.3898 | −0.0718 | 0.3377 |
| Sr | Sr | |||||||||||
| Elovich | −0.0994 | 0.0188 | −0.0920 | 0.0443 | 0.3374 | 0.0709 | −0.3794 | −0.4329 | −0.3955 | −0.0200 | 0.2541 | 0.0048 |
| Weber–Morris | 0.4391 | 0.6361 * | 0.4694 | 0.3255 | 0.3134 | 0.3344 | −0.5136 | −0.4951 | −0.5276 | 0.4156 | 0.4522 | 0.4313 |
| Linear | 0.6141 * | 0.5901 | 0.6306 * | 0.2541 | 0.3038 | 0.2661 | −0.1086 | −0.0917 | −0.1104 | 0.3961 | 0.4504 | 0.4133 |
| Time to Reach Max. Conc. | Slope a | Intercept b | Maximum Releasable Concentrations | |||||||||
|---|---|---|---|---|---|---|---|---|---|---|---|---|
| Probability | Leaf µg | Root µg | Sum µg | Leaf µg | Root µg | Sum µg | Leaf µg | Root µg | Sum µg | Leaf µg | Root µg | Sum µg |
| As | ||||||||||||
| Elovich | 0.501 | 0.288 | 0.293 | 0.406 | 0.253 | 0.633 | 0.384 | 0.24 | 0.613 | 0.403 | 0.238 | 0.638 |
| Weber–Morris | 0.513 | 0.301 | 0.307 | 0.405 | 0.252 | 0.633 | 0.361 | 0.224 | 0.592 | 0.409 | 0.231 | 0.649 |
| Linear | 0.501 | 0.299 | 0.297 | 0.404 | 0.251 | 0.632 | 0.437 | 0.277 | 0.659 | 0.413 | 0.224 | 0.658 |
| Cd | ||||||||||||
| Elovich | 0.144 | 0.398 | 0.149 | 0.523 | 0.179 | 0.457 | 0.552 | 0.216 | 0.489 | 0.539 | 0.187 | 0.472 |
| Weber–Morris | 0.179 | 0.498 | 0.189 | 0.538 | 0.205 | 0.475 | 0.608 | 0.300 | 0.553 | 0.553 | 0.206 | 0.488 |
| Linear | 0.169 | 0.491 | 0.179 | 0.524 | 0.179 | 0.458 | 0.489 | 0.143 | 0.420 | 0.554 | 0.191 | 0.486 |
| Cu | ||||||||||||
| Elovich | 0.497 | 0.020 * | 0.788 | 0.673 | 0.404 | 0.782 | 0.987 | 0.198 | 0.749 | 0.444 | 0.470 | 0.493 |
| Weber–Morris | 0.373 | 0.002 ** | 0.693 | 0.629 | 0.350 | 0.749 | 0.167 | 0.003 ** | 0.352 | 0.597 | 0.211 | 0.763 |
| Linear | 0.353 | 0.002 ** | 0.662 | 0.608 | 0.323 | 0.733 | 0.271 | 0.035 * | 0.449 | 0.589 | 0.203 | 0.758 |
| Ni | ||||||||||||
| Elovich | 0.474 | 0.404 | 0.448 | 0.011 * | 0.001 ** | 0.005 ** | 0.009 ** | 0.001 ** | 0.004 ** | 0.011 * | 0.001 ** | 0.005 ** |
| Weber–Morris | 0.541 | 0.373 | 0.498 | 0.011 * | 0.001 ** | 0.005 ** | 0.008 ** | 0.001 ** | 0.004 ** | 0.010 * | 0.001 ** | 0.005 ** |
| Linear | 0.844 | 0.651 | 0.798 | 0.011 * | 0.001 ** | 0.005 ** | 0.040 * | 0.001 * | 0.020 * | 0.010 ** | 0.001 ** | 0.005 ** |
| Pb | ||||||||||||
| Elovich | 0.251 | 0.156 | 0.140 | 0.042 * | 0.106 | 0.021 * | 0.039 * | 0.101 | 0.019 * | 0.037 * | 0.091 | 0.017 * |
| Weber–Morris | 0.129 | 0.123 | 0.067 | 0.042 * | 0.106 | 0.021 * | 0.037 * | 0.098 | 0.018 * | 0.037 * | 0.090 | 0.017 * |
| Linear | 0.081 | 0.110 | 0.040 * | 0.041 * | 0.105 | 0.021 * | 0.093 | 0.186 | 0.062 | 0.036 * | 0.089 | 0.016 * |
| Zn | ||||||||||||
| Elovich | 0.231 | 0.647 | 0.273 | 0.001 ** | 0.005 ** | 0.001 ** | 0.374 | 0.416 | 0.361 | 0.007 ** | 0.014 * | 0.005 ** |
| Weber–Morris | 0.141 | 0.364 | 0.157 | 0.001 ** | 0.005 ** | 0.001 ** | 0.004 ** | 0.018 * | 0.003 ** | 0.003 ** | 0.007 ** | 0.002 ** |
| Linear | 0.054 | 0.275 | 0.067 | 0.002 ** | 0.005 ** | 0.001 ** | 0.001 ** | 0.001 ** | 0.000 ** | 0.002 ** | 0.007 ** | 0.002 ** |
| Li | ||||||||||||
| Elovich | 0.722 | 0.316 | 0.555 | 0.073 | 0.139 | 0.033 * | 0.087 | 0.119 | 0.038 | 0.054 | 0.183 | 0.027 * |
| Weber–Morris | 0.874 | 0.956 | 0.894 | 0.071 | 0.137 | 0.032 * | 0.103 | 0.298 | 0.250 | 0.029 * | 0.360 | 0.021 * |
| Linear | 0.238 | 0.220 | 0.151 | 0.079 | 0.144 | 0.037 * | 0.860 | 0.329 | 0.922 | 0.229 | 0.867 | 0.297 |
| Sr | ||||||||||||
| Elovich | 0.695 | 0.749 | 0.730 | 0.897 | 0.339 | 0.838 | 0.250 | 0.190 | 0.229 | 0.954 | 0.451 | 0.991 |
| Weber–Morris | 0.177 | 0.032 * | 0.145 | 0.329 | 0.350 | 0.315 | 0.106 | 0.121 | 0.096 | 0.203 | 0.163 | 0.185 |
| Linear | 0.045 * | 0.057 | 0.037 | 0.452 | 0.374 | 0.429 | 0.750 | 0.774 | 0.746 | 0.229 | 0.165 | 0.207 |
Publisher’s Note: MDPI stays neutral with regard to jurisdictional claims in published maps and institutional affiliations. |
© 2021 by the author. Licensee MDPI, Basel, Switzerland. This article is an open access article distributed under the terms and conditions of the Creative Commons Attribution (CC BY) license (https://creativecommons.org/licenses/by/4.0/).
Share and Cite
Sager, M. Modelling the Plant Uptake of Metals from Release Rates Obtained by the EUF Method. Plants 2022, 11, 85. https://doi.org/10.3390/plants11010085
Sager M. Modelling the Plant Uptake of Metals from Release Rates Obtained by the EUF Method. Plants. 2022; 11(1):85. https://doi.org/10.3390/plants11010085
Chicago/Turabian StyleSager, Manfred. 2022. "Modelling the Plant Uptake of Metals from Release Rates Obtained by the EUF Method" Plants 11, no. 1: 85. https://doi.org/10.3390/plants11010085
APA StyleSager, M. (2022). Modelling the Plant Uptake of Metals from Release Rates Obtained by the EUF Method. Plants, 11(1), 85. https://doi.org/10.3390/plants11010085