
The Similarity between Species Composition of Vegetation and Soil Seed Bank of Grasslands in Inner Mongolia, China: Implications for the Asymmetric Response to Precipitation

 , ,
, ,  and
and 
Abstract
:1. Introduction
2. Methods
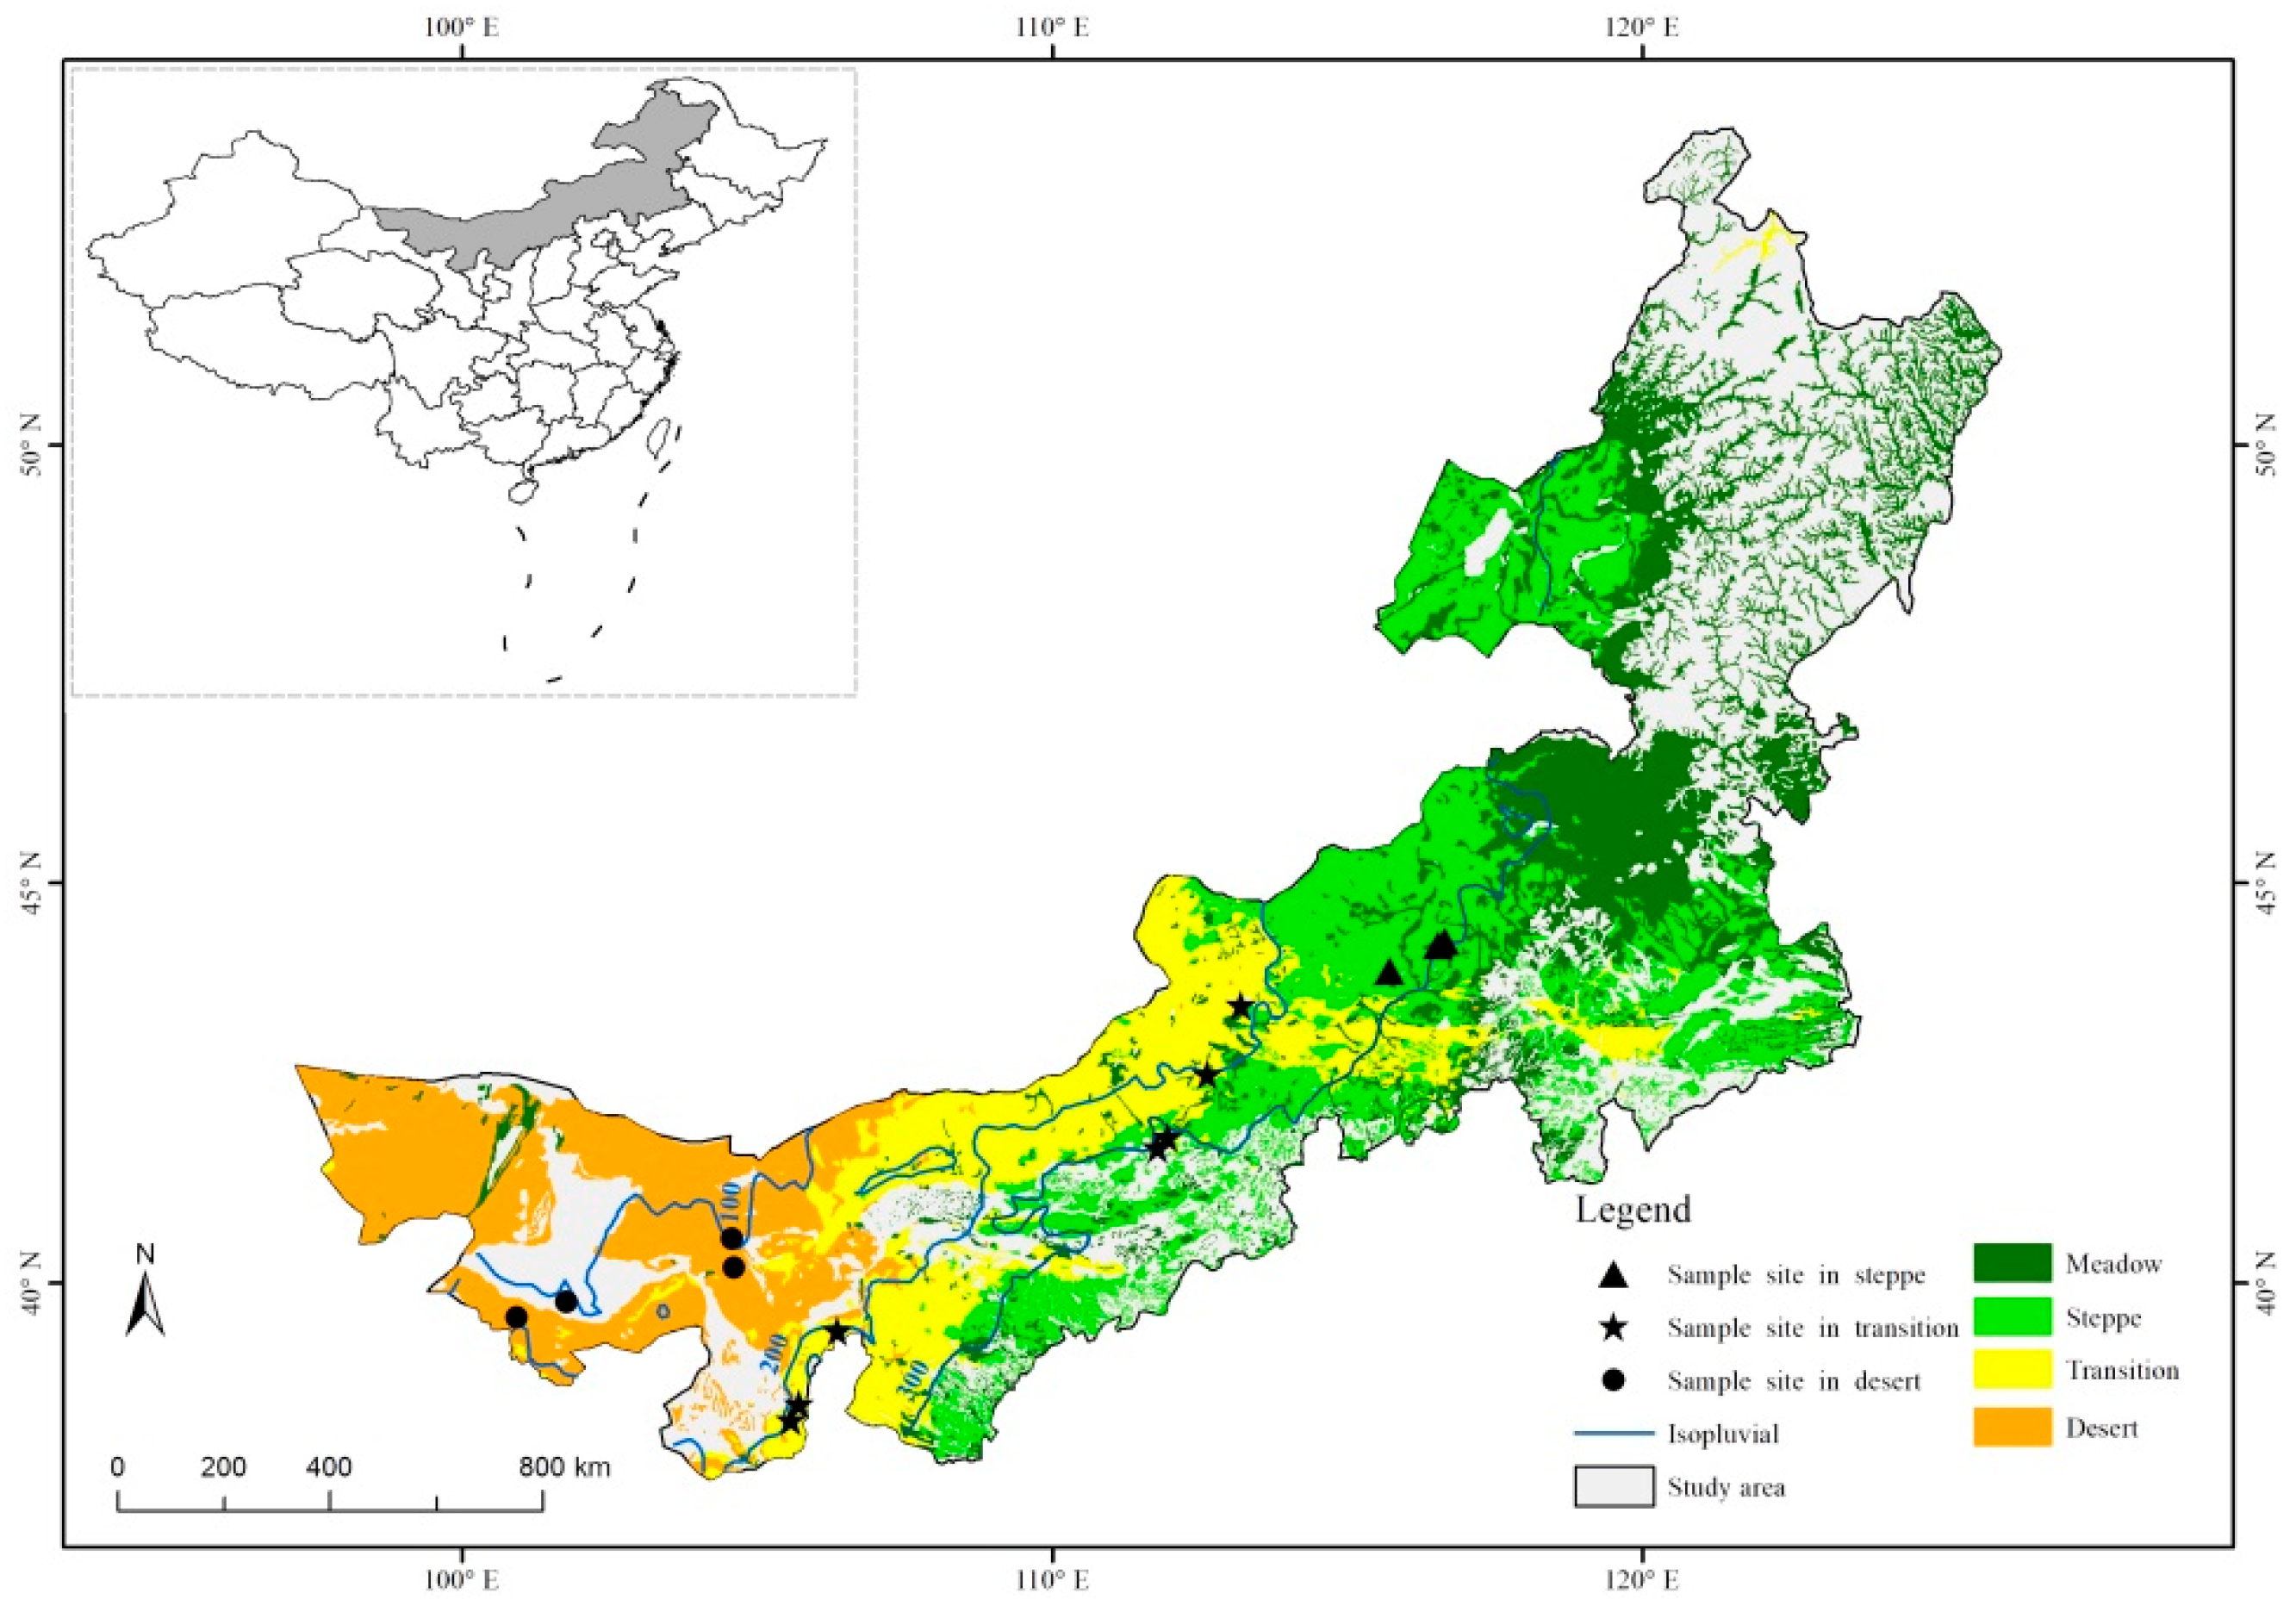
2.1. Study Area
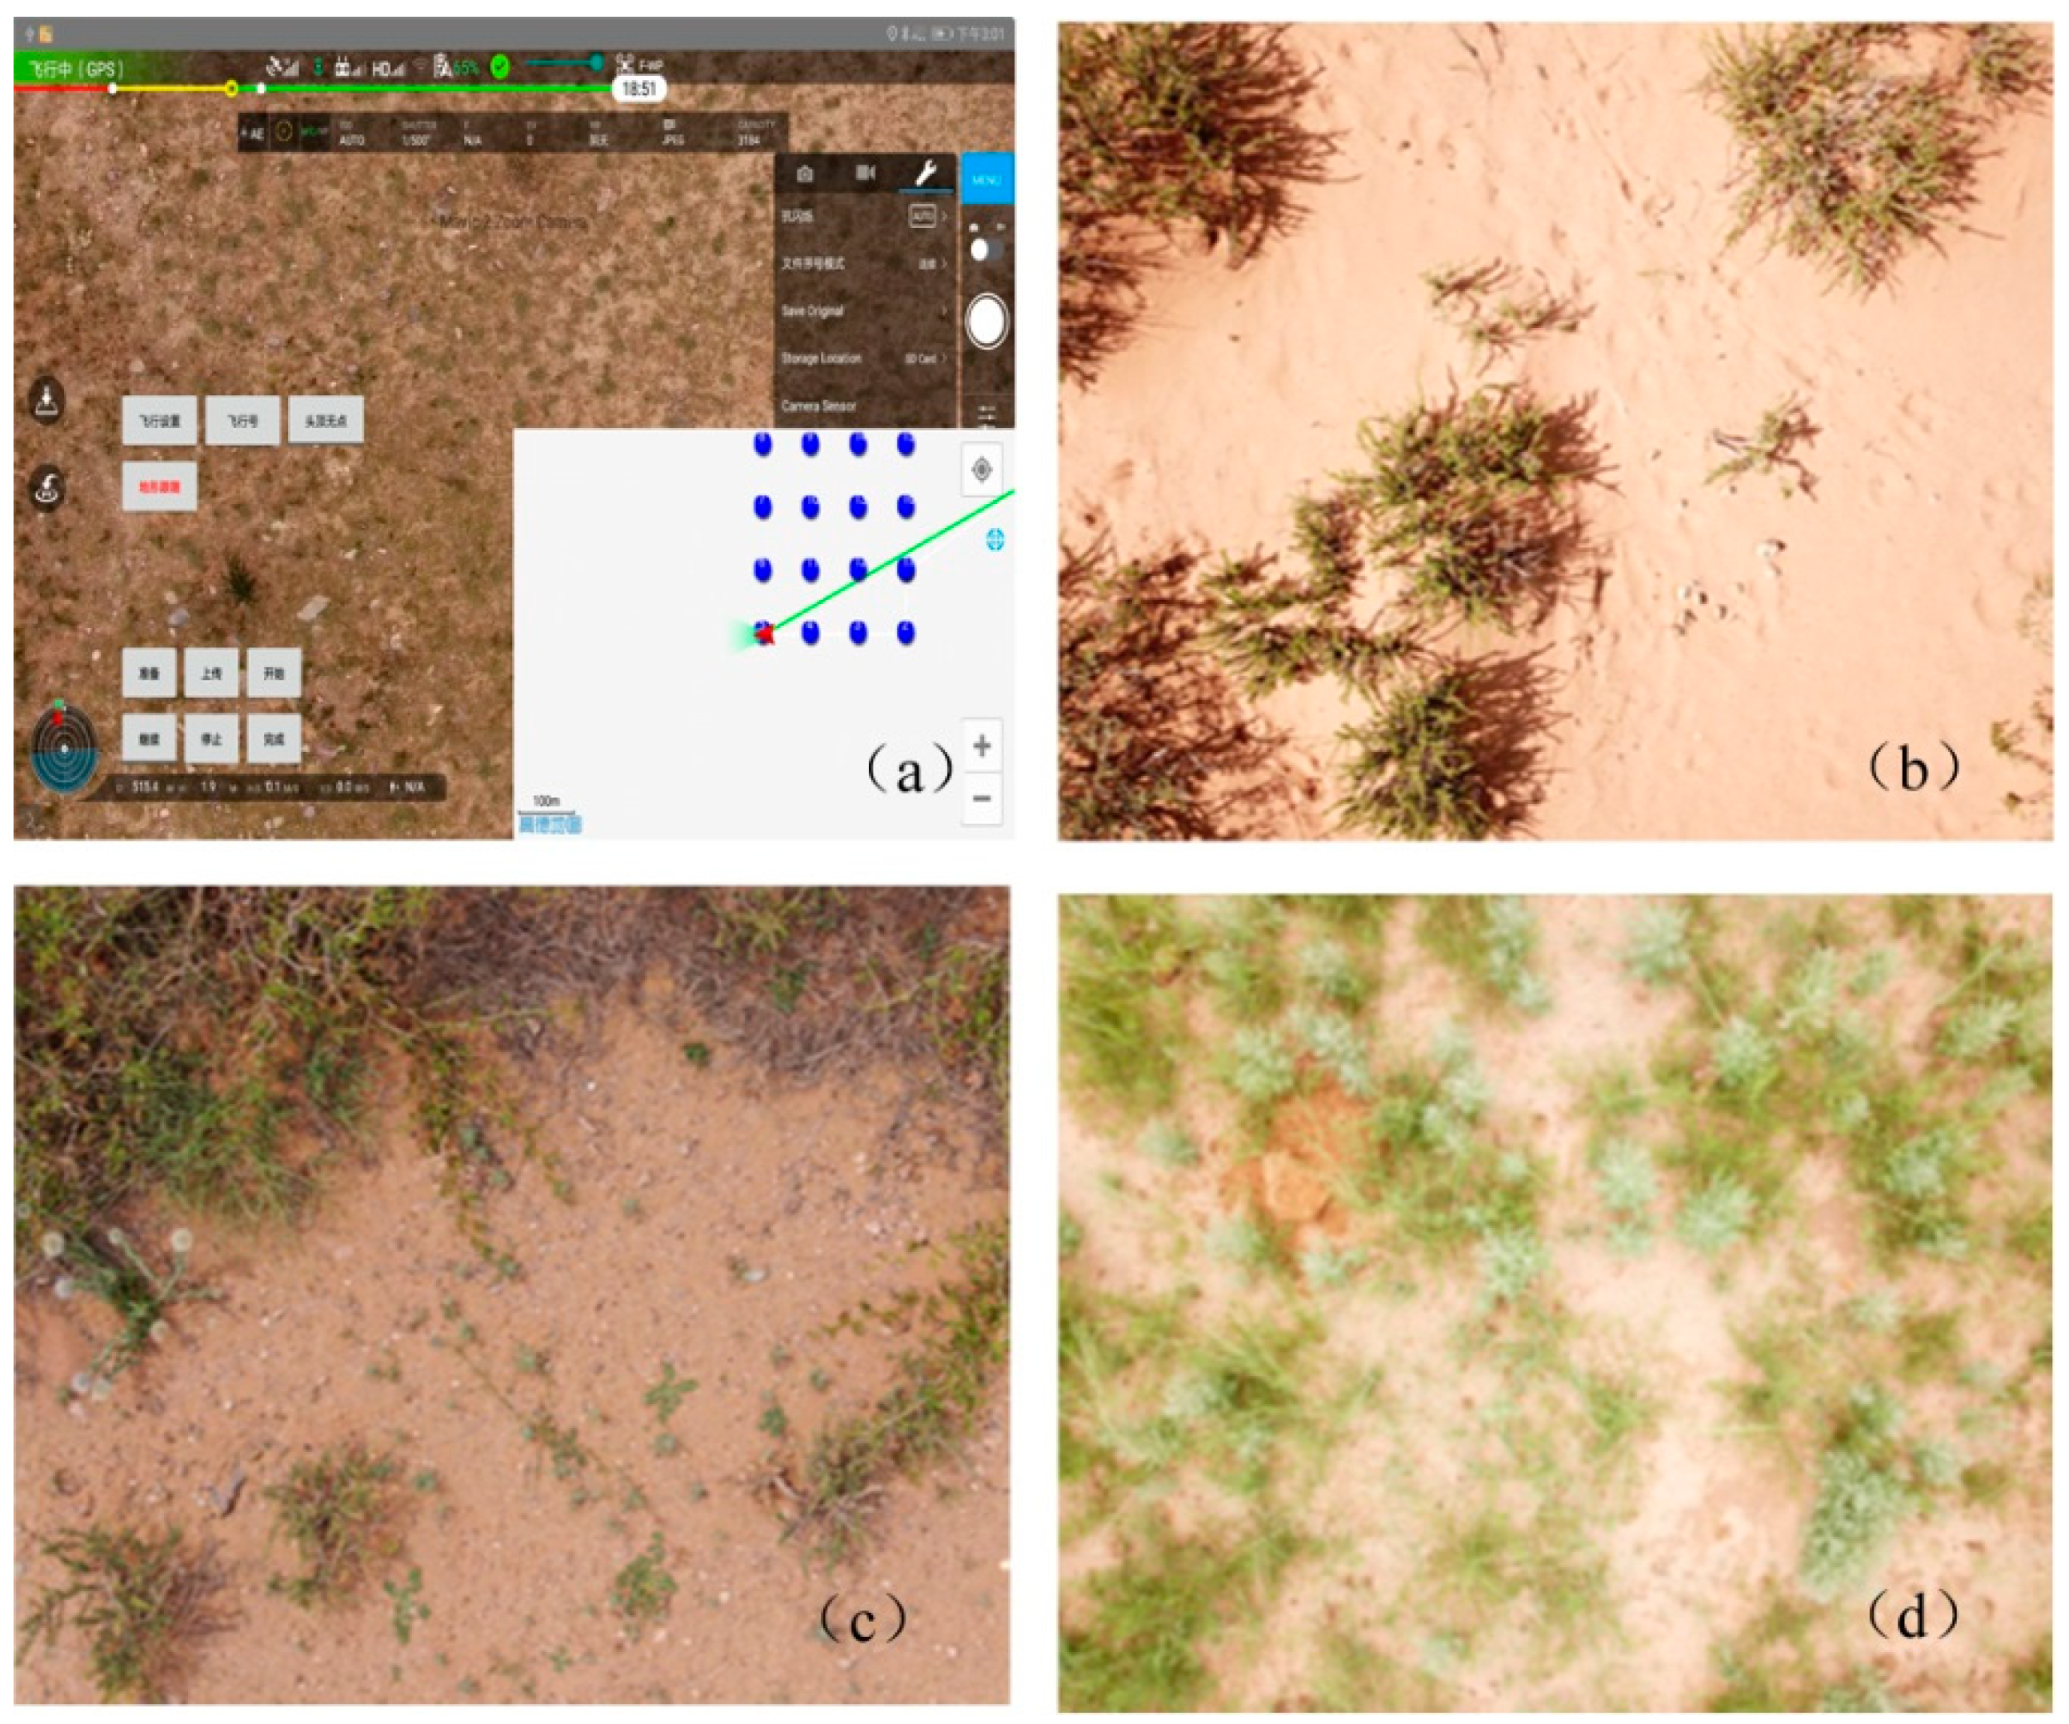
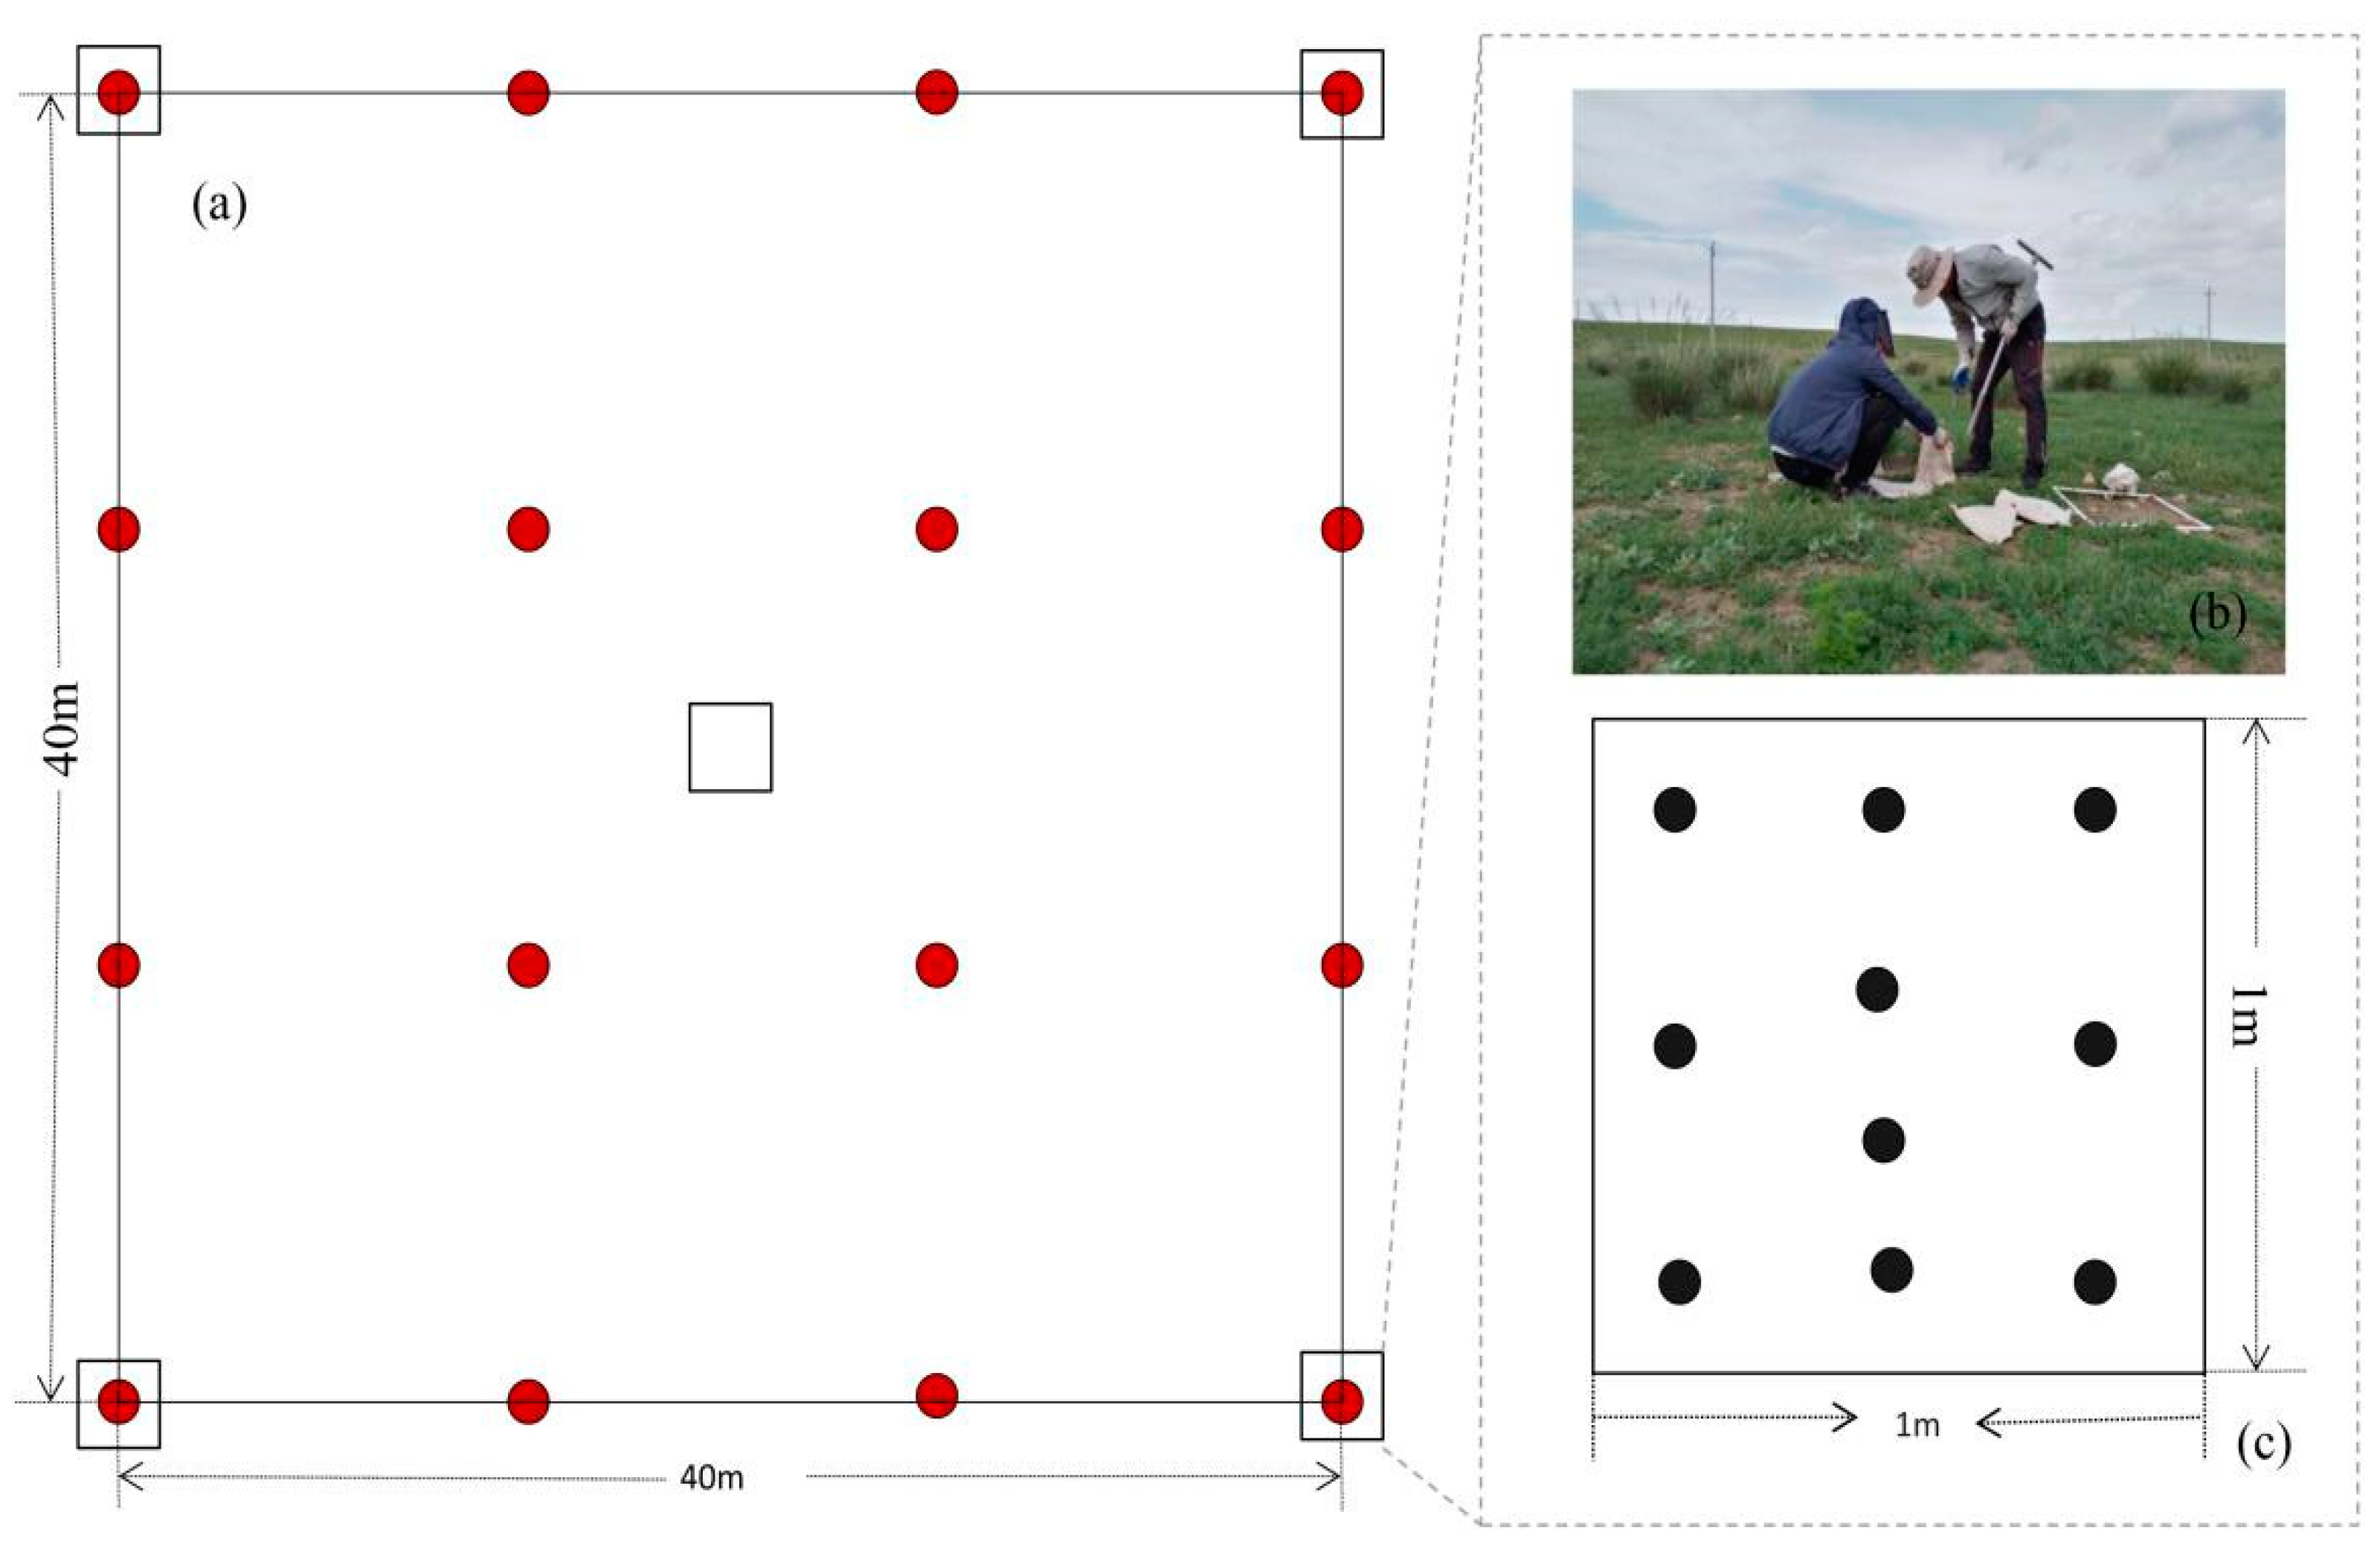
2.2. Species Composition Observation by Unmanned Aerial Vehicle (UAV)
2.3. Soil Seed Bank Sampling and Seed Density Test
2.4. Similarity Index between Soil Seed Bank and Vegetation Species
2.5. Data Analysis
3. Results
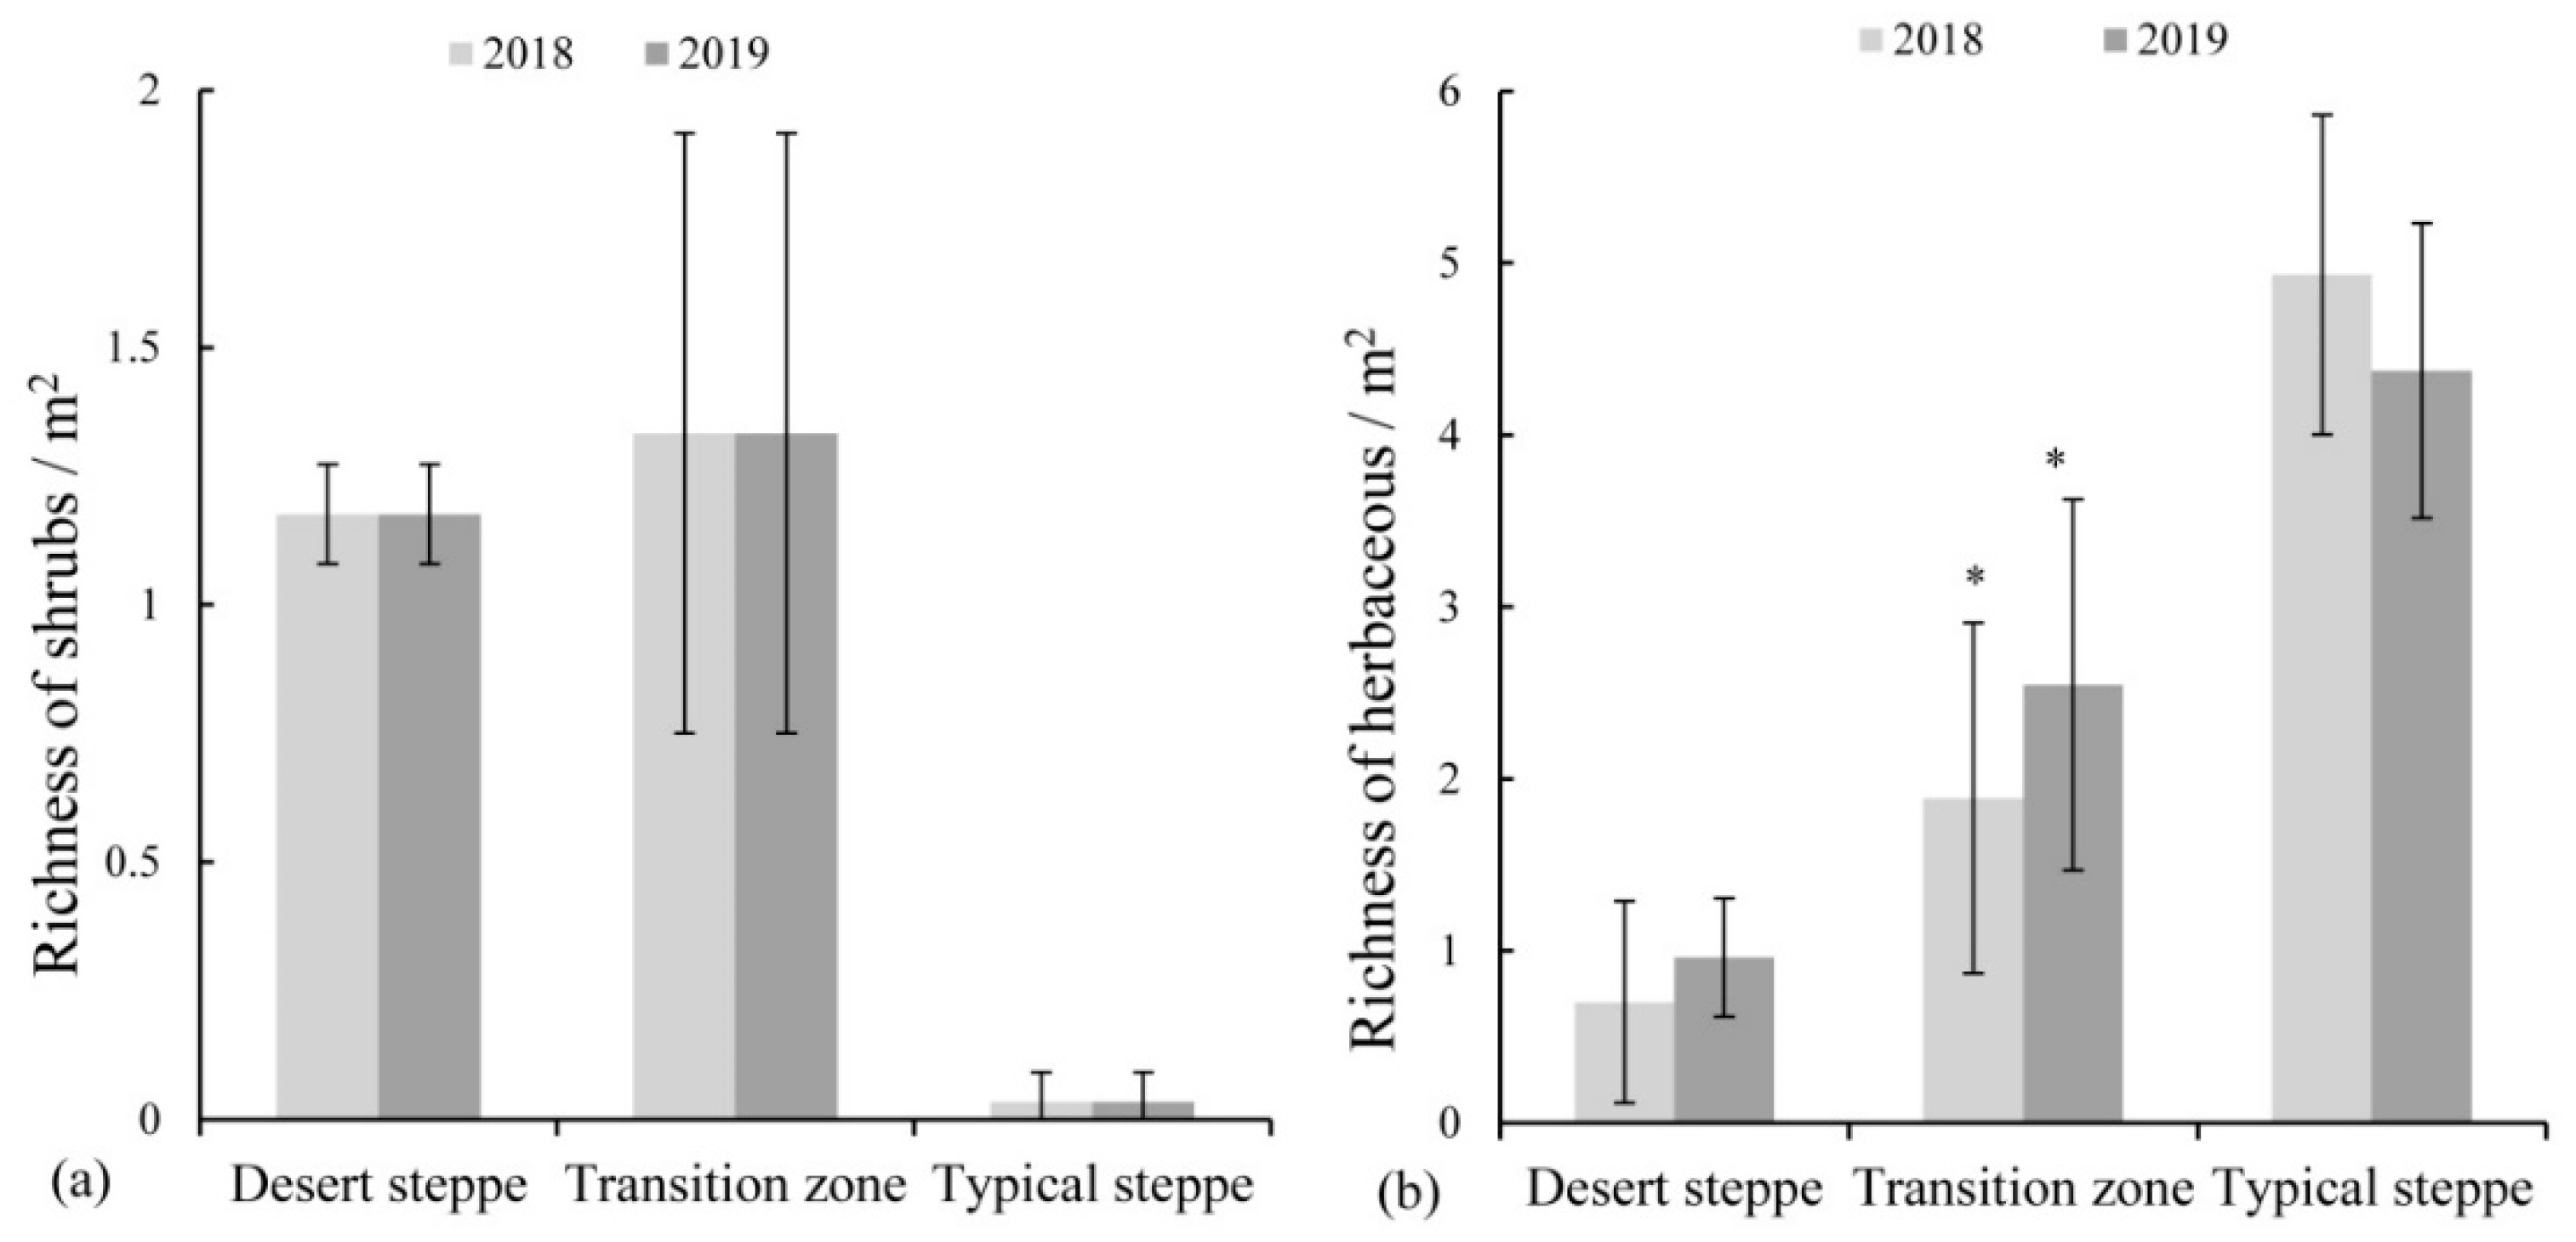
3.1. Differences in Species Composition Variation among Three Grassland Types
3.2. Soil Seed Bank Density and Species Richness in the Soil Seed Bank
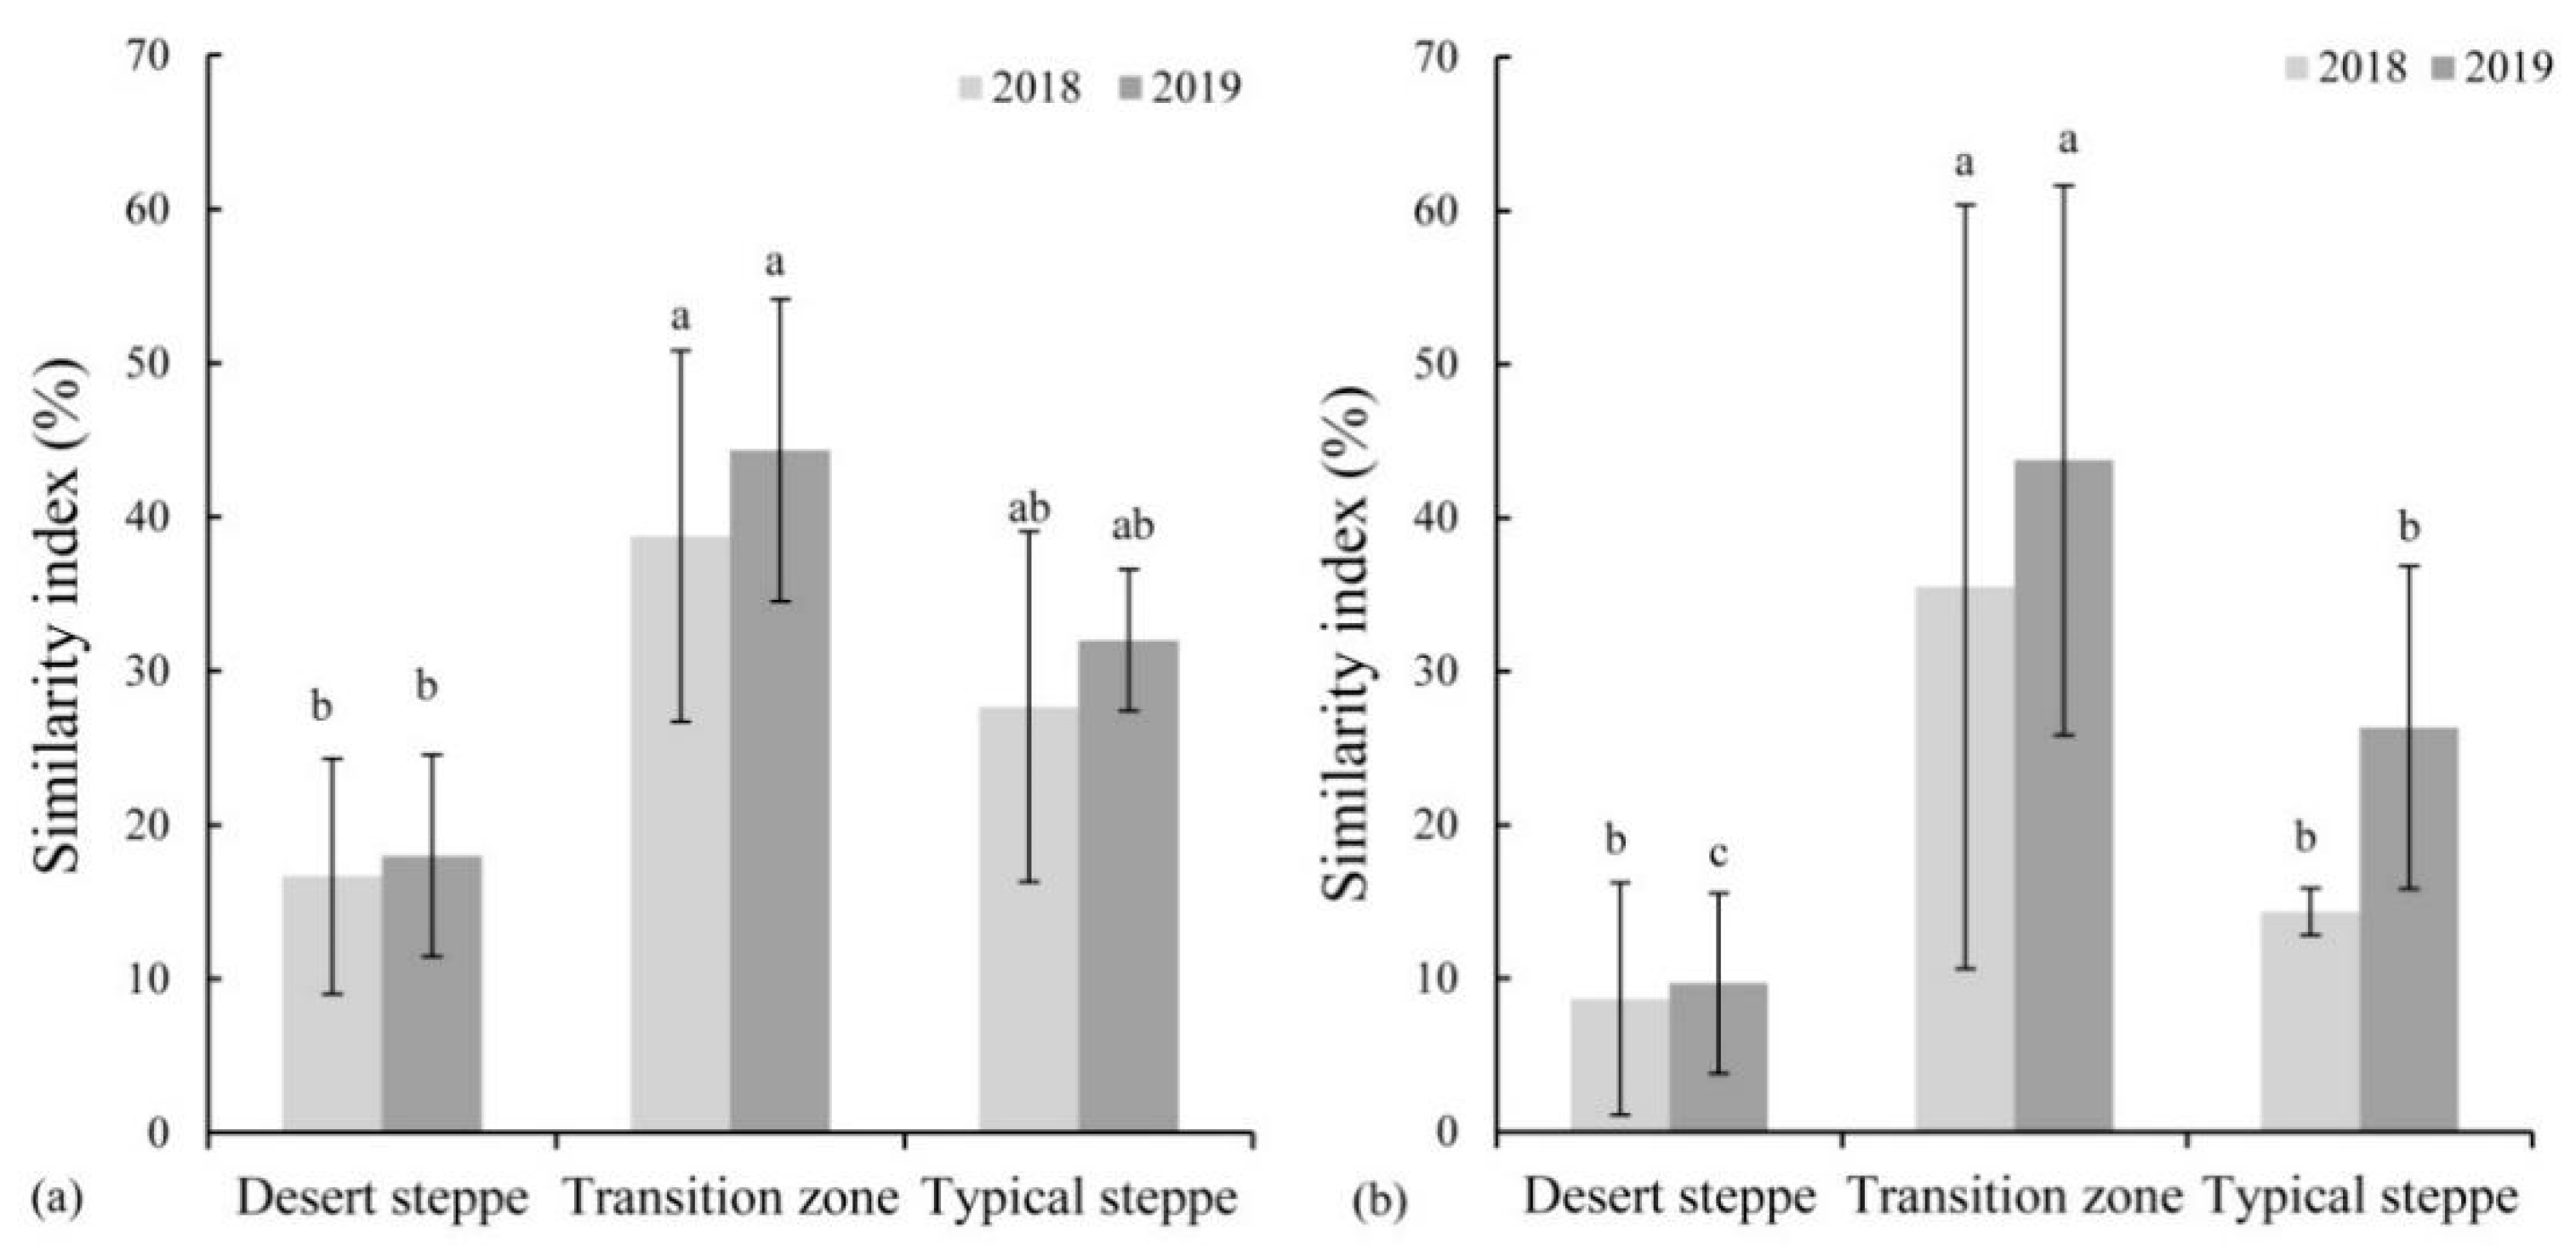
3.3. Similarity Index between Soil Seed Bank and Vegetation
4. Discussion
4.1. Highest Seed Density and Similarity Index in the Transition Zone
4.2. Responses of Species to Precipitation and Implications
4.3. UAV Application for the Mechanism Study of ANPP Asymmetric Response to Precipitation
5. Conclusions
Supplementary Materials
Author Contributions
Funding
Institutional Review Board Statement
Informed Consent Statement
Data Availability Statement
Acknowledgments
Conflicts of Interest
References
- Gidey, E.; Dikinya, O.; Sebego, R.; Segosebe, E.; Zenebe, A. Predictions of future meteorological drought hazard (~2070) under the representative concentration path (RCP) 4.5 climate change scenarios in Raya, Northern Ethiopia. Modeling Earth Syst. Environ. 2018, 4, 475–488. [Google Scholar] [CrossRef]
- Cleland, E.E.; Goodale, U.M. Co-limitation by nitrogen and water constrains allocation response to drought in deciduous and evergreen shrubs in a semi-arid ecosystem. Plant Ecol. 2019, 220, 213–225. [Google Scholar] [CrossRef]
- Carlsson, M.; Merten, M.; Kayser, M.; Isselstein, J.; Wrage-Mönnig, N. Drought stress resistance and resilience of permanent grasslands are shaped by functional group composition and N fertilization. Agric. Ecosyst. Environ. 2017, 236, 52–60. [Google Scholar] [CrossRef]
- Ochoa-Hueso, R.; Collins, S.L.; Delgado-Baquerizo, M.; Hamonts Kelly Pockman, W.T.; Sinsabaugh, R.L.; Smith, M.D.; Knapp, A.K.; Power, S.A. Drought consistently alters the composition of soil fungal and bacterial communities in grasslands from two continents. Glob. Chang. Biol. 2018, 24, 2818–2827. [Google Scholar] [CrossRef] [PubMed]
- Stampfli, A.; Bloor, J.M.G.; Fischer, M.; Zeiter, M. High land-use intensity exacerbates shifts in grassland vegetation composition after severe experimental drought. Glob. Chang. Biol. 2018, 24, 2021–2034. [Google Scholar] [CrossRef] [Green Version]
- deMenocal, P.; Guilderson, T.; Adkins, J.; Sarnthein, M.; Baker, L.; Yarusinsky, M.; Ortiz, J. Abrupt onset and termination of the African Humid Period: Rapid climate responses to gradual insolation forcing. Quat. Sci. Rev. 2000, 19, 347–361. [Google Scholar] [CrossRef]
- Rietkerk, M.; Dekker, S.C.; de Ruiter, P.C.; van de Koppel, J. Self-organized patchiness and catastrophic shifts in ecosystems. Science 2004, 305, 1926–1929. [Google Scholar] [CrossRef] [PubMed] [Green Version]
- Kéfi, S.; Rietkerk, M.; Alados, C.L.; Pueyo, Y.; Papanastasis, V.P.; ElAich, A.; De Ruiter, P.C. Spatial vegetation patterns and imminent desertification in Mediterranean arid ecosystems. Nature 2007, 449, U213–U215. [Google Scholar] [CrossRef]
- Knapp, A.K.; Ciais, P.; Smith, M.D. Reconciling inconsistencies in precipitation-productivity relationships: Implications for climate change. New Phytol. 2017, 214, 41–47. [Google Scholar] [CrossRef] [Green Version]
- Luo, Y.; Jiang, L.; Niu, S.; Zhou, X. Nonlinear responses of land ecosystems to variation in precipitation. New Phytol. 2017, 214, 5. [Google Scholar] [CrossRef] [Green Version]
- Zhang, L.; Wang, J.; Zhao, R.; Guo, Y.; Hao, L. Aboveground net primary productivity and soil respiration display different responses to precipitation changes in desert grassland. J. Plant Ecol. 2021, rtab067. [Google Scholar] [CrossRef]
- Deng, Q.; Aras, S.; Yu, C.L.; Dzantor, E.K.; Fay, P.A.; Luo, Y. Effects of precipitation changes on aboveground net primary production and soil respiration in a switchgrass field. Agric. Ecosyst. Environ. 2017, 248, 29–37. [Google Scholar] [CrossRef]
- Hu, Z.M.; Guo, Q.; Li, S.G.; Piao, S.L.; Knapp, A.; Philippe, C.; Li, X.; Yu, G.; Johannes, K. Shifts in the dynamics of productivity signal ecosystem state transitions at the biome-scale. Ecol. Lett. 2018, 21, 1457–1466. [Google Scholar] [CrossRef]
- Knapp, A.K.; Smith, M.D. Variation among biomes in temporal dynamics of aboveground primary production. Science 2001, 291, 481–484. [Google Scholar] [CrossRef] [PubMed] [Green Version]
- Holm, A.M.; Watson, I.W.; Loneragan, W.A.; Adams, M.A. Loss of patch-scale heterogeneity on primary productivity and rainfalluse efficiency in Western Australia. Basic Appl. Ecol. 2003, 4, 569–578. [Google Scholar] [CrossRef]
- Li, X.J.; Li, X.R.; Song, W.M.; Gao, Y.P.; Zheng, J.G.; Jia, R.L. Effects of crust and shrubs patches on runoff, sedimentation, and related nutrient (C, N) redistribution in the desertified steppe zone of the Tengger Desert, Northern China. Geomorphology 2008, 96, 221–232. [Google Scholar] [CrossRef]
- Walck, J.L.; Baskin, J.M.; Baskin, C.C.; Hidayati, S.N. Defining transient and persistent seed banks in species with pronounced seasonal dormancy and germination patterns. Seed Sci. Res. 2005, 15, 189–196. [Google Scholar] [CrossRef]
- Fisher, J.L.; Loneragan, W.A.; Dixon, K.; Veneklaas, E.J. Soil seed bank compositional change constrains biodiversity in an invaded species-rich woodland. Biol. Conserv. 2009, 142, 256–269. [Google Scholar] [CrossRef]
- Jalili, A.; Hamzeh’ee, B.; Asri, Y.; Shirvany, A.; Yazdani, S.; Khoshnevis, M.; Zarrinkamar, F.; Ghahramani, M.-A.; Safavi, R.; Shaw, S. Soil seed banks in the arasbaran protected area of Iran and their significance for conservation management. Biol. Conserv. 2003, 109, 425–431. [Google Scholar] [CrossRef]
- Yan, J.C.; Liang, C.Z.; Fu, X.Y.; Wang, W.; Wang, L.X.; Jia, C.Z. The response of annual plant traits to rainfall variation in steppe and desert regions. Acta Prataculturae Sin. 2013, 22, 68–76. [Google Scholar]
- Wang, W.; Ma, K.P.; Gao, X.M. Relationship between soil seed bank and vegetation. In Proceedings of the 2nd National Symposium on Biodiversity Conservation and Sustainable Use, Beijing, China, 4 November 1996; pp. 288–292. [Google Scholar]
- Duncan, R.P.; Diez, J.M.; Sullivan, J.J.; Wangen, S.; Miller, A.L. Safe sites, seed supply, and the recruitment function in plant populations. Ecology 2009, 90, 2129–2138. [Google Scholar] [CrossRef] [PubMed]
- Feldman, S.R.; Alzugaray, C.; Lewis, J.P. Relationship between the soil seed bank and vegetation of tall grassland of Spartina argentinensis. Investig. Agrar. 2007, 34, 41–48. [Google Scholar] [CrossRef]
- Yan, Q.L.; Liu, Z.M.; Zhen, J.J.; Luo, Y.; Wang, H.; Jiang, D. Structure, pattern and mechanisms of formation of seed banks in sand dune systems in northeastern Inner Mongolia, China. Plant Soil 2005, 277, 175–184. [Google Scholar]
- Yang, L.; Wang, Y.R.; Yu, J.D. Review of research on seed bank of desert regions. Acta Pratacult. Sin. 2010, 2, 227–234. [Google Scholar]
- Huang, X.Y.; Wang, K.; Wang, Y.T.; Kan, Y.C.; Zhang, Y.J.; Shao, X.Q. Soil seed bank dynamics during natural restoration by fence in a typical steppe of Inner Mongolia. Acta Agrestia Sin. 2011, 19, 38–42. [Google Scholar]
- Wang, Y.C.; Mark, K.J.; Ren, G.H. Species shifts in above-ground vegetation and the soil seed bank in the inter-dune lowlands of an active dune field in Inner Mongolia, China. Basic Appl. Ecol. 2015, 16, 490–499. [Google Scholar] [CrossRef] [Green Version]
- Qian, J.; Liu, Z.; Hatier, J.H.B.; Liu, B. The vertical distribution of soil seed bank and its restoration implication in an active sand dune of northeastern Inner Mongolia, China. Land Degrad. Dev. 2016, 27, 305–315. [Google Scholar] [CrossRef]
- Wang, Y.C.; Chu, L.; Daryanto, S.; Lü, L.Y.; Ala, M.S.; Wang, L.X. Sand dune stabilization changes the vegetation characteristics and soil seed bank and their correlations with environmental factors. Sci. Total Environ. 2018, 648, 500–507. [Google Scholar] [CrossRef] [Green Version]
- Kang, S.; Ma, W.; Li, F.Y.; Zhang, Q.; Niu, J.; Ding, Y.; Han, F.; Sun, X. Functional redundancy instead of species redundancy determines community stability in a typical steppe of Inner Mongolia. PLoS ONE 2015, 10, e0145605. [Google Scholar] [CrossRef]
- Liu, G.; Xie, X.; Ye, D.; Ye, X.; Tuvshintogtokh, I.; Mandakh, B.; Huang, Z.; Dong, M. Plant functional diversity and species diversity in the Mongolian steppe. PLoS ONE 2013, 8, e77565. [Google Scholar]
- DAHV (Department of Animal Husbandry and Veterinary, Ministry of Agriculture); GSAHV (General Station of Animal Husbandry and Veterinary, Ministry of Agriculture). Rangeland and Resources of China; China Science and Technology Press: Beijing, China, 1996. (In Chinese) [Google Scholar]
- He, M.Z. Environmental effects on distribution and composition of desert vegetations in Alxa Plateau: Ⅳ. Soil seed banks. J. Desert Res. 2010, 30, 287–295. [Google Scholar]
- Cui, L.; Yang, S.J.; Fan, Y.W. Ten-day response of vegetation NDVI to the variations of temperature and precipitation in Eastern China. Acta Geogr. Sin. 2009, 64, 850–860. [Google Scholar]
- Liu, C.L.; Pan, R.H.; Wu, J.J.; Yan, F. Temporal lag of grassland vegetation growth response to precipitation in Xilinguolemeng. Arid. Land Geogr. 2009, 32, 512–518. [Google Scholar]
- Yi, S. FragMAP: A tool for long-term and cooperative monitoring and analysis of small-scale habitat fragmentation using an unmanned aerial vehicle. Int. J. Remote Sens. 2017, 38, 2686–2697. [Google Scholar] [CrossRef]
- Sun, Y.; Yi, S.H.; Hou, F.J. Unmanned aerial vehicle methods makes species composition monitoring easier in grassland. Ecol. Indic. 2018, 95, 825–830. [Google Scholar] [CrossRef]
- Qin, Y.; Yi, S.; Ding, Y.; Wang, Z. Effects of plateau pikas’ foraging and burrowing activities on vegetation biomass and soil organic carbon of alpine grasslands. Plant Soil 2020, 458, 201–216. [Google Scholar] [CrossRef]
- Karen, R.H.; Hartnett, D.C.; Robert, C.C.; Owensby, C.E. Grazing management effects on plant species diversity in tallgrass prairie. J. Range Manag. 2004, 57, 58–65. [Google Scholar]
- Bonham, C.D. Measurements for Terrestrial Vegetation, 2nd ed.; John Wiley and Sons: Chichester, UK, 2013. [Google Scholar]
- Thompson, K.; Grime, J.P. Seasonal variation in the seed bank of herbaceous species in ten contrasting habitats. J. Ecol. 1979, 67, 893–921. [Google Scholar] [CrossRef] [Green Version]
- Baskin, C.C.; Baskin, J.M. Seeds: Ecology, Biogeography, and Evolution of Dormancy and Germination; Academic Press: Cambridge, MA, USA, 1998. [Google Scholar]
- Bai, W.J.; Jiao, J.Y. A review of soil seed bank. Agric. Res. Arid. Areas 2006, 6, 195–203. [Google Scholar]
- Zeng, Y.J.; Wang, Y.R.; Nan, Z.B.; Dong, W.; Li, B. Soil seed bank of different grassland types of Alashan arid desert region, Inner Mongolia. Chin. J. Appl. Ecol. 2003, 14, 1457–1463. [Google Scholar]
- Magurran, A. Diversity indices and species abundance models. In Ecological Diversity and Its Measurement; Princeton University Press: Princeton, UK, 1988; pp. 8–45. [Google Scholar]
- Grime, J.P. Plant Strategies, Vegetation Processes, and Ecosystem Properties; John Willey and Sons: Hoboken, NJ, USA, 2001. [Google Scholar]
- Navarra, J.J.; Quintana-Ascencio, P.F. Spatial pattern and composition of the Florida scrub seed bank and vegetation along an anthropogenic disturbance gradient. Appl. Veg. Sci. 2012, 15, 349–358. [Google Scholar] [CrossRef]
- Amiaud, B.; Touzard, B. The relationships between soil seed bank, aboveground vegetation and disturbances in old embanked marshlands of western France. Flora 2004, 199, 25–35. [Google Scholar] [CrossRef]
- Chambers, J.C.; MacMahon, J.A. A day in the life of a seed: Movements and fates of seeds and their implications for natural and managed systems. Ann. Rev. Ecol. Syst. 1994, 25, 263–292. [Google Scholar] [CrossRef]
- Chambers, J.C.; MacMahon, J.A.; Haefner, J.H. Seed entrapment in alpine ecosystems: Effects of soil particle size and diaspore morphology. Ecology 1991, 72, 1668–1677. [Google Scholar] [CrossRef]
- Okubo, A.; Levin, S.A. A theoretical framework for data analysis of wind dispersal of seeds and pollen. Ecology 1989, 70, 329–338. [Google Scholar] [CrossRef]
- Reichman, J. Spatial and temporal variation of seed distributions in Sonoran desert soils. J. Biogeogr. 1984, 11, 1–11. [Google Scholar] [CrossRef]
- Guo, J.L.; Li, Q.F.; Zhang, S.Y.; Tian, S.X. Study on seedling vigour and drought tolerance of Three Rhizomatose grasses. J. Arid. Land Resour. Environ. 2008, 22, 171–174. [Google Scholar]
- Guo, Q.; Brown, J.H.; Valone, T.J. Constrains of seed size on plant distributions and abundance. Ecology 2000, 81, 2149–2155. [Google Scholar] [CrossRef]
- Liddle, M.J.; Parlange, J.L.; Bulow-Olsen, A. A simple method for measuring diffusion rates and predation of seed on the soil surface. J. Ecol. 1987, 75, 1–8. [Google Scholar] [CrossRef]
- Moles, A.T.; Hodson, D.W.; Webb, C.J. Seed size and shape and persistence in the soil in the New Zealand flora. Oikos 2000, 89, 541–545. [Google Scholar] [CrossRef] [Green Version]
- O’Connor, T.G.; Pickett, G.A. The influence of grazing on seed production and seed bank of some African savanna grassland. J. Appl. Ecol. 1992, 29, 247–260. [Google Scholar] [CrossRef]
- Thompson, K.; Band, S.R.; Hodgson, J.G. Seed size and shape predict persistence in soil. Funct. Ecol. 1993, 7, 236–241. [Google Scholar] [CrossRef] [Green Version]
- Li, C.; Bo, X.; Wang, Q.; Zheng, R.; Wu, J. Responses of soil seed bank and vegetation to the increasing intensity of human disturbance in a semi-arid region of northern China. Sustainability 2017, 9, 1837. [Google Scholar] [CrossRef] [Green Version]
- Plassmann, K.; Brown, N.; Edwards-Jones, J.G. Can soil seed bank contribute to the restoration of dune-slacks under conservation management? Appl. Veg. Sci. 2009, 12, 199–210. [Google Scholar] [CrossRef]
- Bossuyt, B.; Hermy, M. Seed bank assembly follows vegetation succession in dune slacks. J. Veg. Sci. 2004, 15, 449–456. [Google Scholar] [CrossRef]
- Thompson, K. Seeds and seed bank. New Phytol. 1987, 106, 23–34. [Google Scholar] [CrossRef]
- Noy-Meir, I. Desert ecosystems: Environment and producers. Ann. Rev. Ecol. Syst. 1973, 4, 23–51. [Google Scholar] [CrossRef]
- Brown, G. Species richness, diversity and biomass production of desert steppe annuals in an Ungrazed Rhanterium epapposum community over three growth seasons in Kuwait. Plant Ecol. 2003, 165, 53–68. [Google Scholar] [CrossRef]
- Stark, K.E.; Lundholm, J.T.; Larson, D.W. Relation-ships between seed bank and spatial heterogeneity of North American alvar vegetation. J. Veg. Sci. 2003, 14, 205–212. [Google Scholar] [CrossRef]
- Ye, X.; Li, L.; Baskin, C.C.; Baskin, J.M.; Du, J.; Huang, Z. Sand burial helps regulate timing of seed germination of a dominant herb in an inland dune ecosystem with a semiarid temperate climate. Sci. Total Environ. 2019, 680, 44–50. [Google Scholar] [CrossRef]
- Bai, Y.; Wu, J.; Xing, Q.; Pan, Q.; Huang, J.; Yang, D.; Han, X. Primary production and rain use efficiency across a precipitation gradient on the Mongolia plateau. Ecology 2008, 89, 2140–2153. [Google Scholar] [CrossRef]
- Yang, Y.; Fang, J.; Ma, W.; Guo, D.; Mohammat, A. Largescale pattern of biomass partitioning across China’s grasslands. Glob. Ecol. Biogeogr. 2010, 19, 268–277. [Google Scholar] [CrossRef]
- Zhongmin, H.; Guirui, Y.; Jiangwen, F.; Huaping, Z.; Shaoqiang, W.; Shenggong, L. Precipitation-use efficiency along a 4500-km grassland transect. Glob. Ecol. Biogeogr. 2010, 19, 842–851. [Google Scholar] [CrossRef]
- Arif, M.S.M.; Gülch, E.; Tuhtan, J.A.; Thumser, P.; Haas, C. An investigation of image processing techniques for substrate classification based on dominant grain size using RGB images from UAV. Int. J. Remote Sens. 2016, 38, 2639–2661. [Google Scholar] [CrossRef]
- Wei, T.; Shangguan, D.; Yi, S.; Ding, Y. Characteristics and controls of vegetation and diversity changes monitored with an unmanned aerial vehicle (UAV) in the foreland of the Urumqi Glacier No. 1, Tianshan, China. Sci. Total Environ. 2020, 771, 145433. [Google Scholar] [CrossRef] [PubMed]
- Mikhailova, M.P.; Sinegovskaia, V.T.; Boiarskii, B.S.; Sinegovskii, M.O.; Boiarskaia, A.I. Evaluation of the influence of biologically active substances on the physiological processes of soybean plants with the use of multispectral camera and unmanned aerial vehicle. IOP Conf. Ser. Earth Environ. Sci. 2020, 548, 032028. [Google Scholar] [CrossRef]


| Grassland Types | Cumulative Average Precipitation (mm) from May to June | Multi-Year Average Precipitation from May to June (mm) | Multi-Year Average Precipitation (~mm) | |
|---|---|---|---|---|
| 2018 | 2019 | |||
| Desert steppe | 10.53 | 34.43 | 21.15 | 115 |
| Transition zone | 32.25 | 73.25 | 53.40 | 200 |
| Typical steppe | 42.25 | 73.75 | 76.06 | 300 |
Publisher’s Note: MDPI stays neutral with regard to jurisdictional claims in published maps and institutional affiliations. |
© 2021 by the authors. Licensee MDPI, Basel, Switzerland. This article is an open access article distributed under the terms and conditions of the Creative Commons Attribution (CC BY) license (https://creativecommons.org/licenses/by/4.0/).
Share and Cite
Lv, Y.; Shen, M.; Meng, B.; Zhang, H.; Sun, Y.; Zhang, J.; Chang, L.; Li, J.; Yi, S. The Similarity between Species Composition of Vegetation and Soil Seed Bank of Grasslands in Inner Mongolia, China: Implications for the Asymmetric Response to Precipitation. Plants 2021, 10, 1890. https://doi.org/10.3390/plants10091890
Lv Y, Shen M, Meng B, Zhang H, Sun Y, Zhang J, Chang L, Li J, Yi S. The Similarity between Species Composition of Vegetation and Soil Seed Bank of Grasslands in Inner Mongolia, China: Implications for the Asymmetric Response to Precipitation. Plants. 2021; 10(9):1890. https://doi.org/10.3390/plants10091890
Chicago/Turabian StyleLv, Yanyan, Menghong Shen, Baoping Meng, Huifang Zhang, Yi Sun, Jianguo Zhang, Li Chang, Jingrong Li, and Shuhua Yi. 2021. "The Similarity between Species Composition of Vegetation and Soil Seed Bank of Grasslands in Inner Mongolia, China: Implications for the Asymmetric Response to Precipitation" Plants 10, no. 9: 1890. https://doi.org/10.3390/plants10091890
APA StyleLv, Y., Shen, M., Meng, B., Zhang, H., Sun, Y., Zhang, J., Chang, L., Li, J., & Yi, S. (2021). The Similarity between Species Composition of Vegetation and Soil Seed Bank of Grasslands in Inner Mongolia, China: Implications for the Asymmetric Response to Precipitation. Plants, 10(9), 1890. https://doi.org/10.3390/plants10091890