
Morphological Characteristics of Grapevine Cultivars and Closed Contour Analysis with Elliptic Fourier Descriptors

 ,
,  ,
,  , and
, and
Abstract
1. Introduction
2. Materials and Methods
2.1. Locations of Grape Cultivars
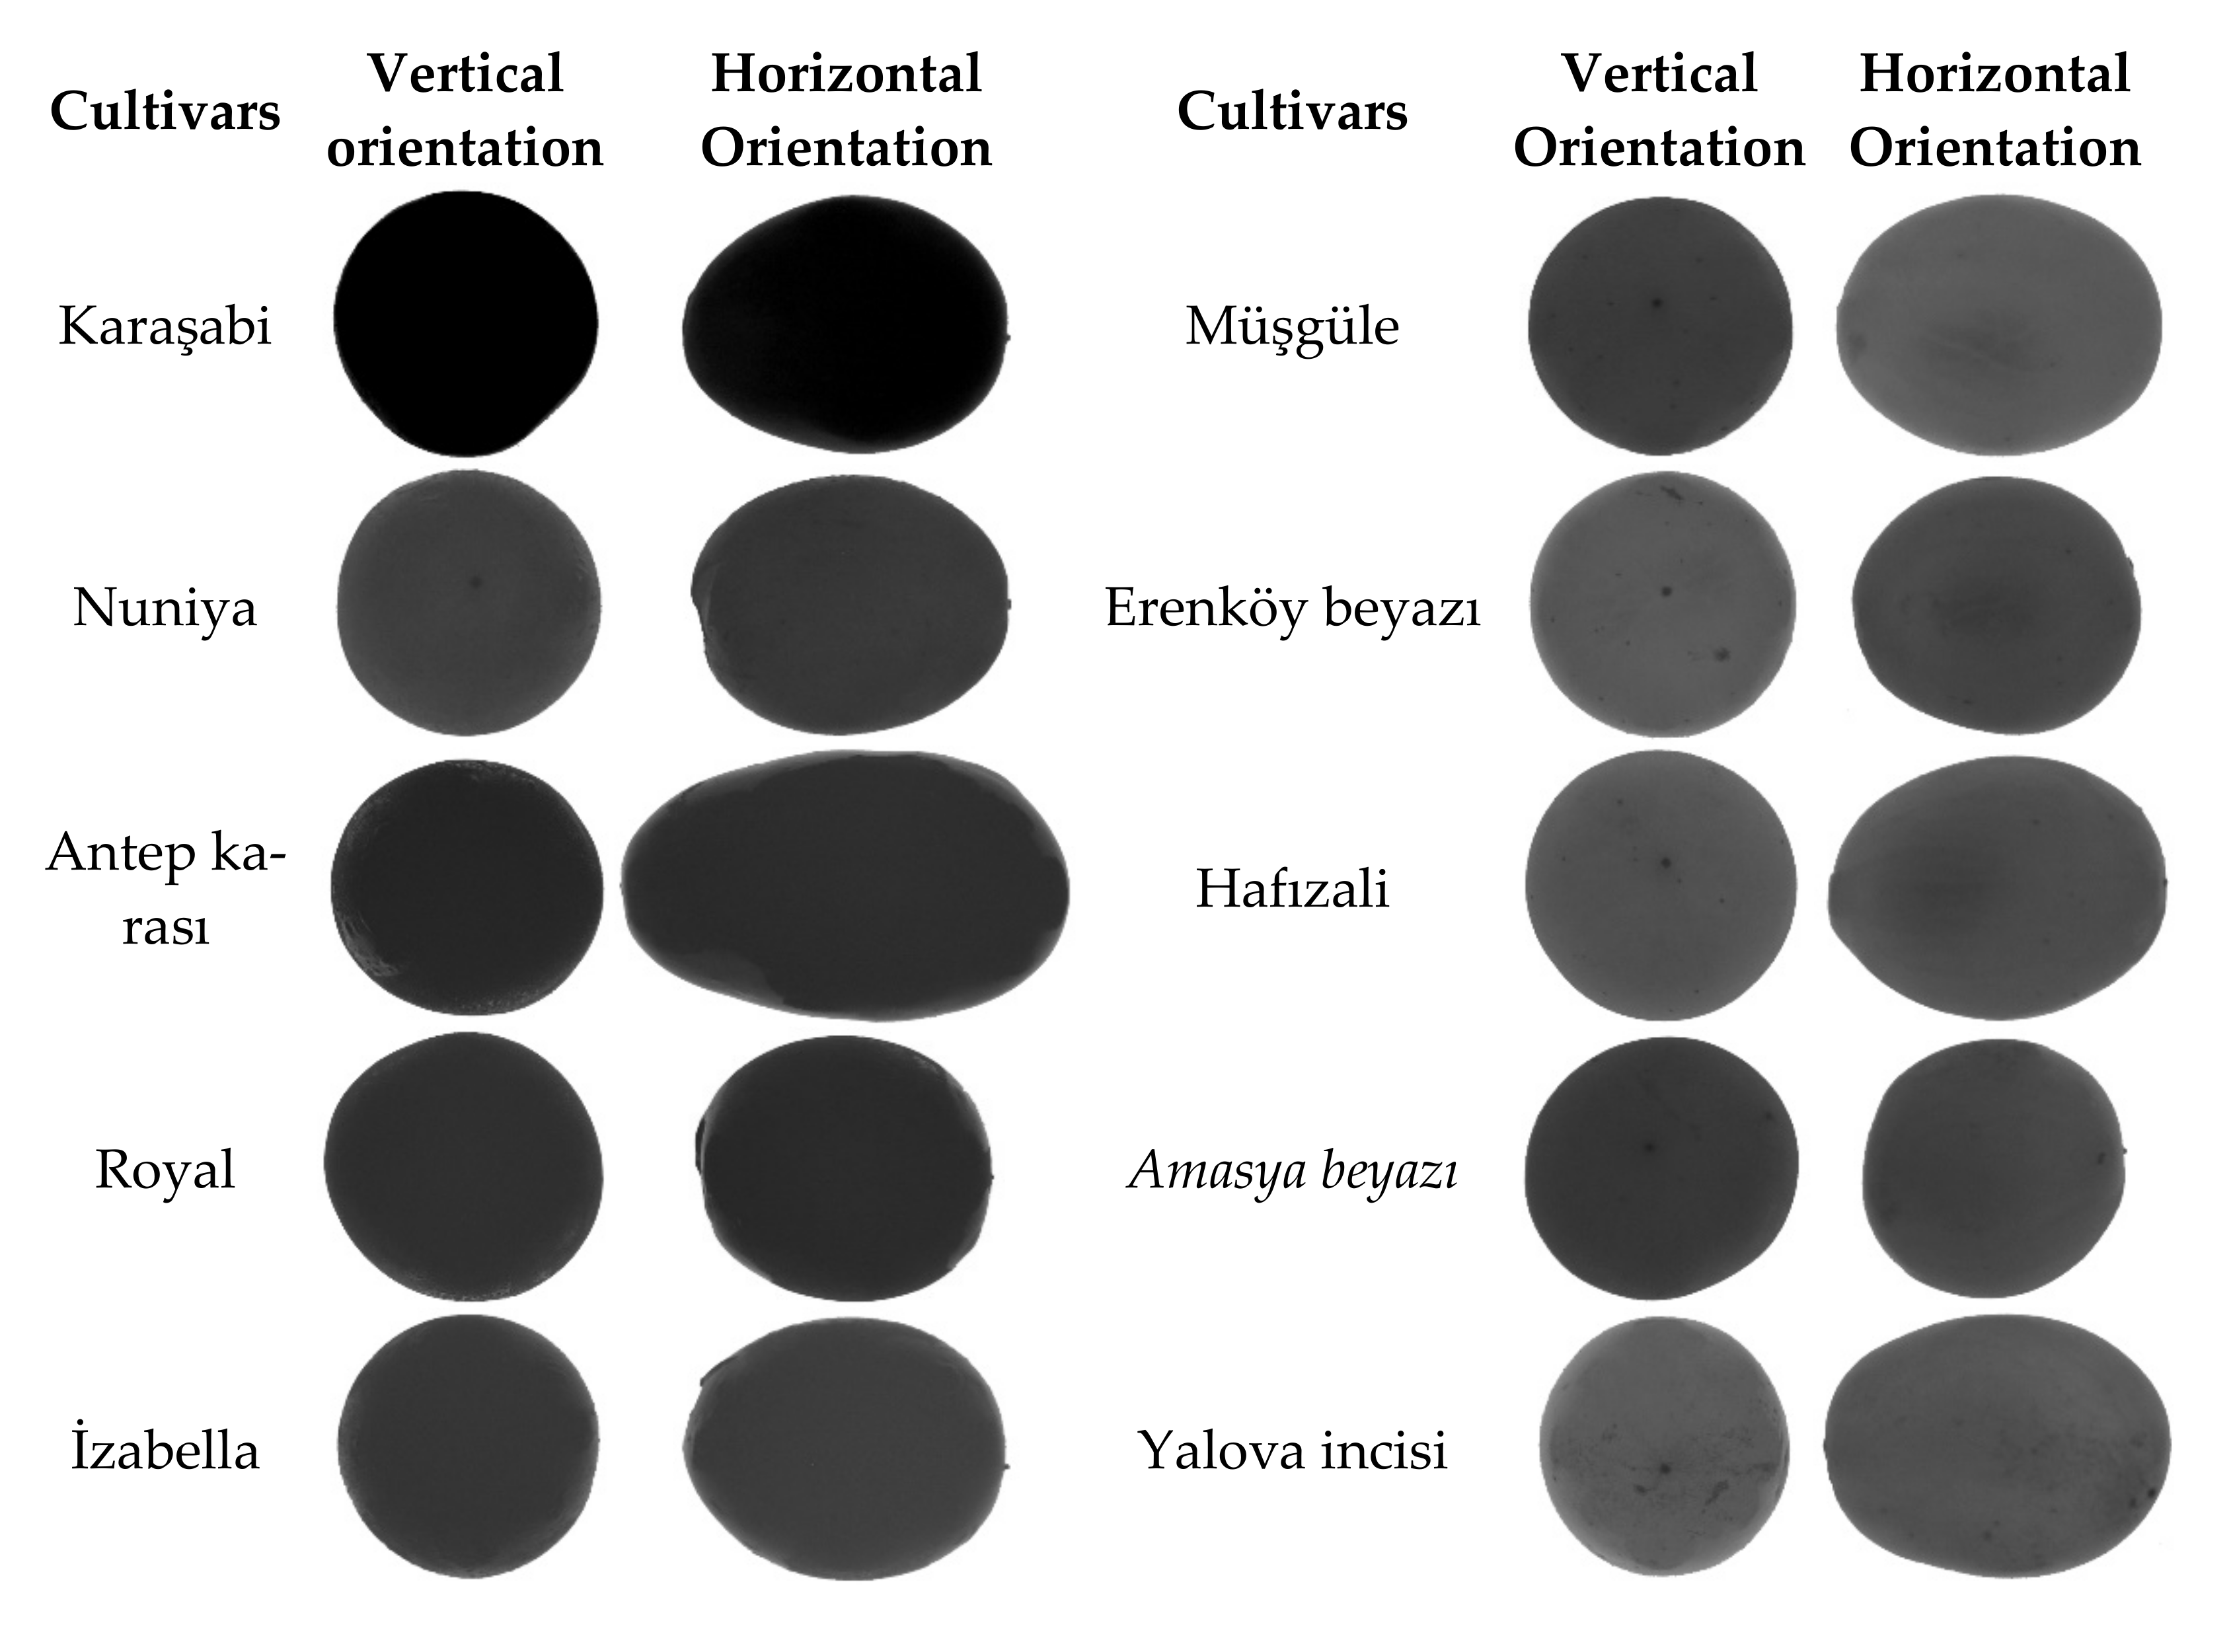
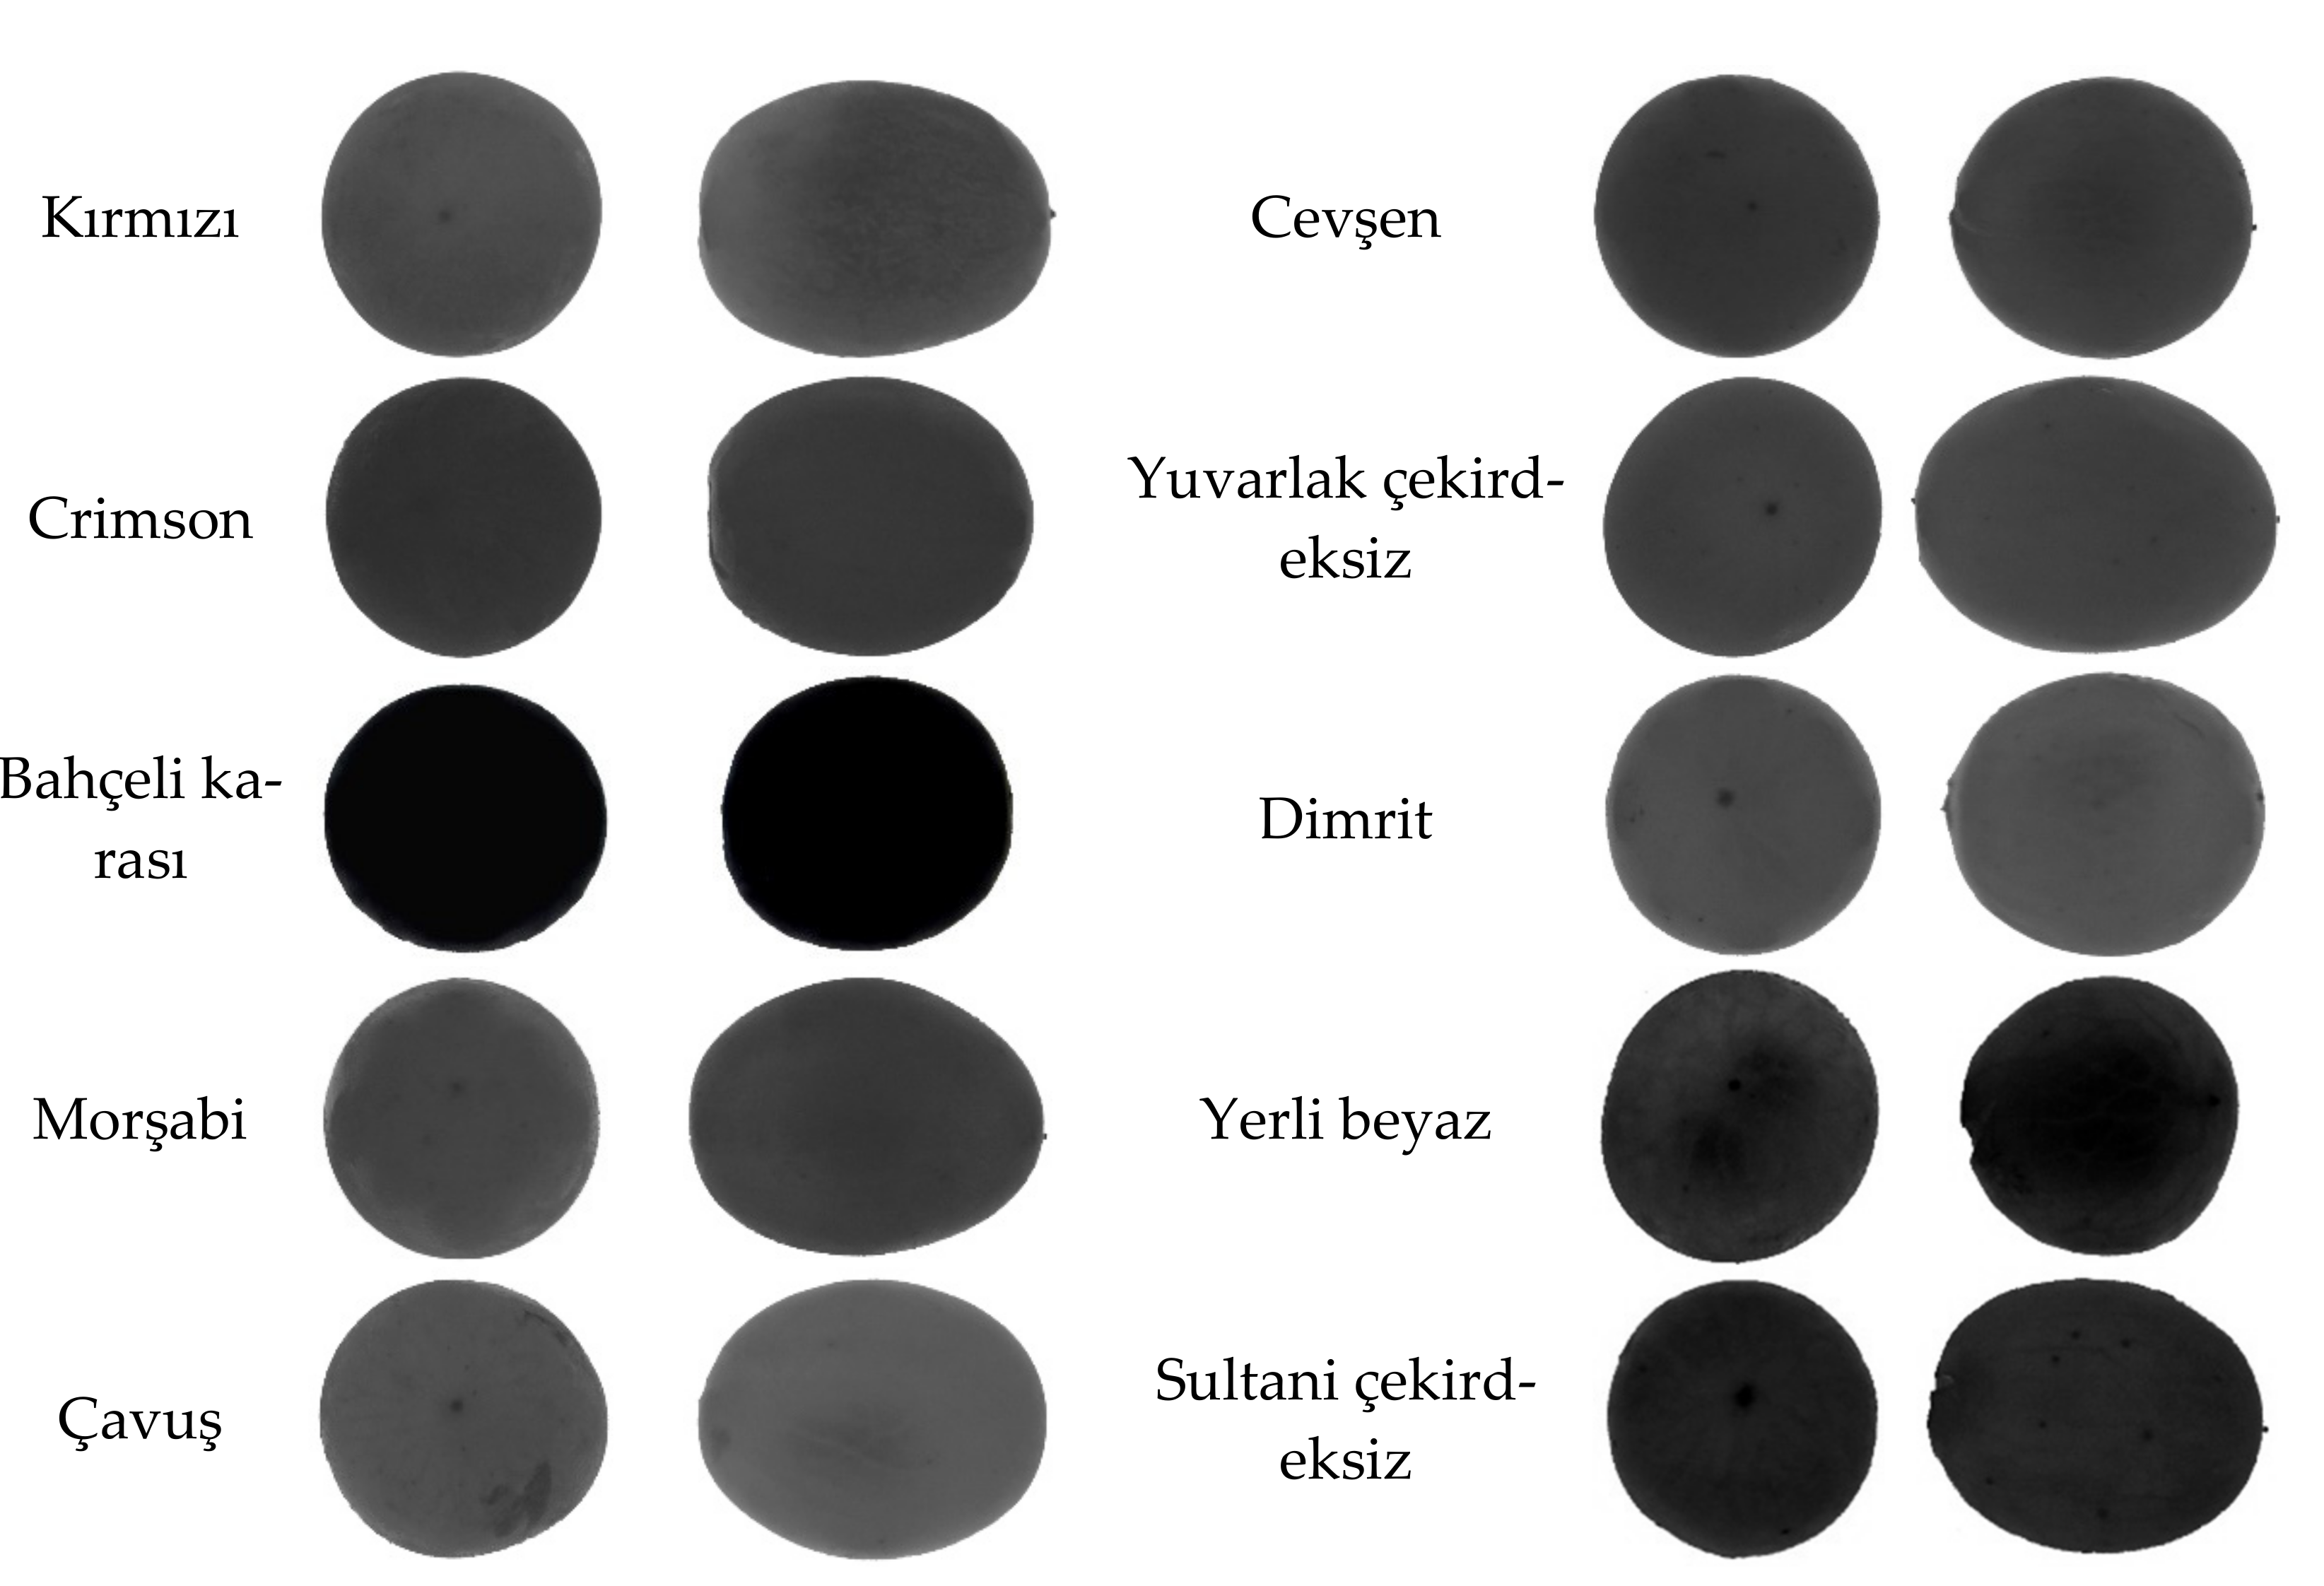
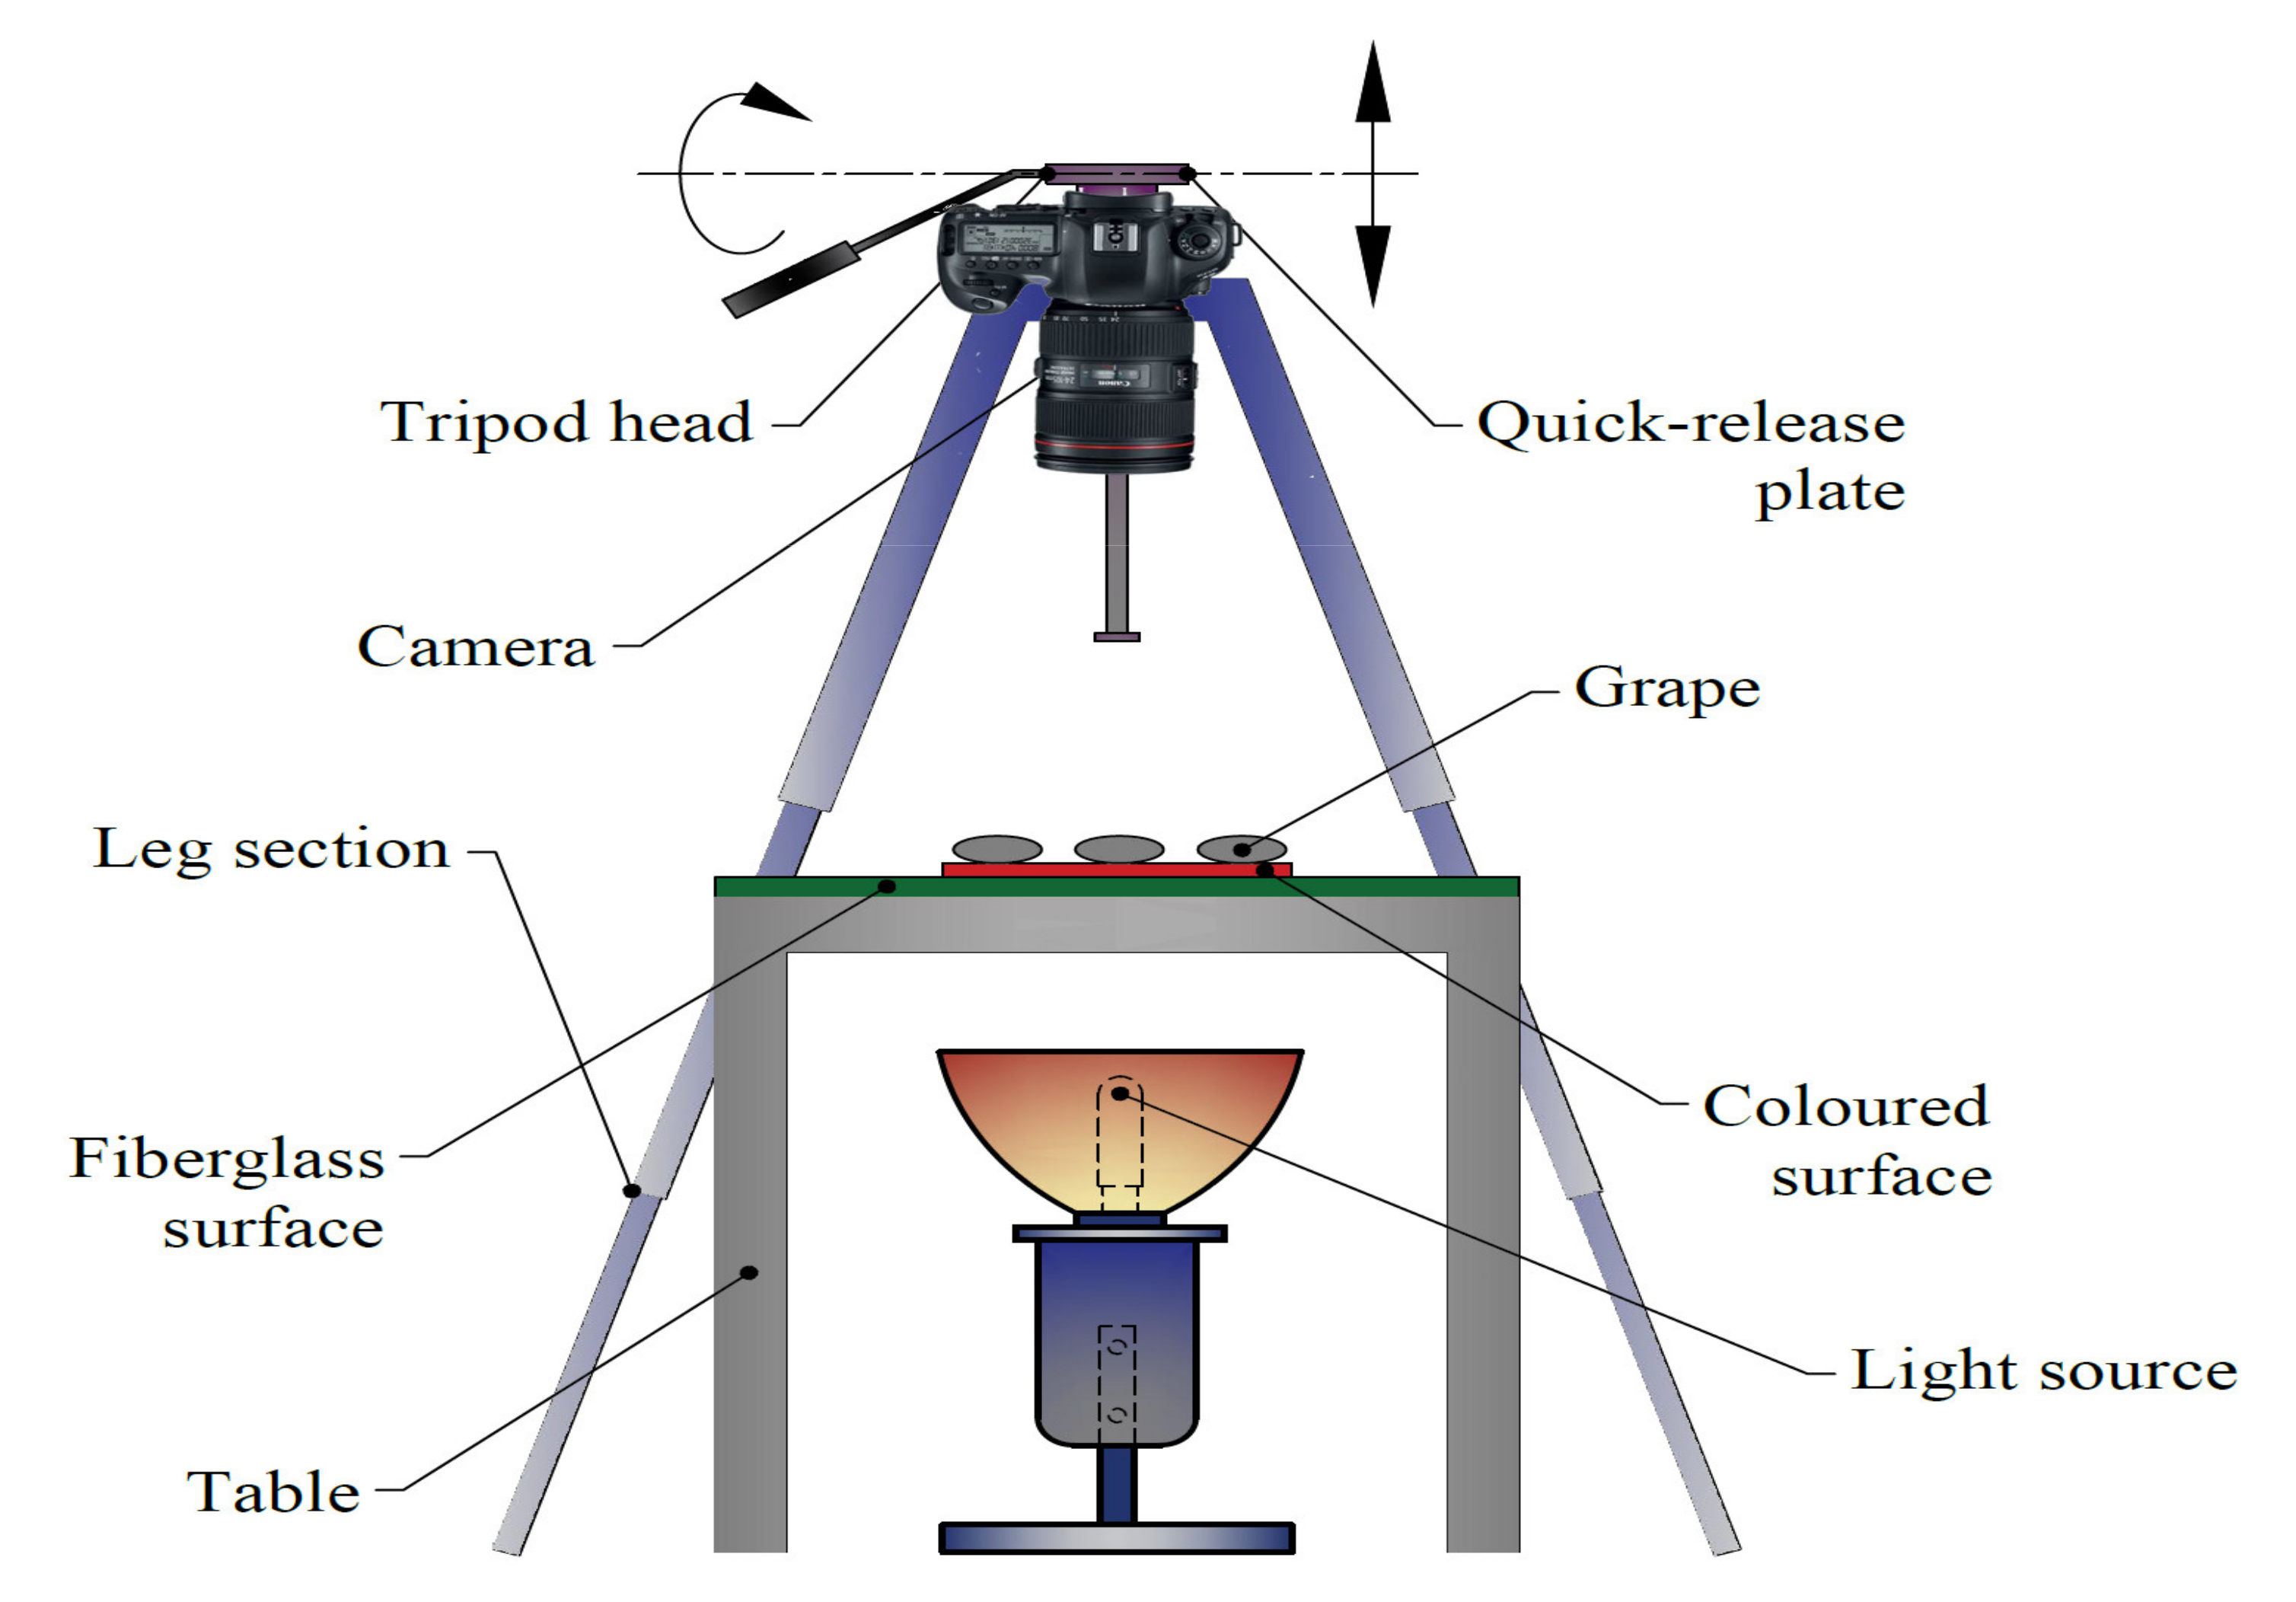
2.2. Imaging System and Sampling
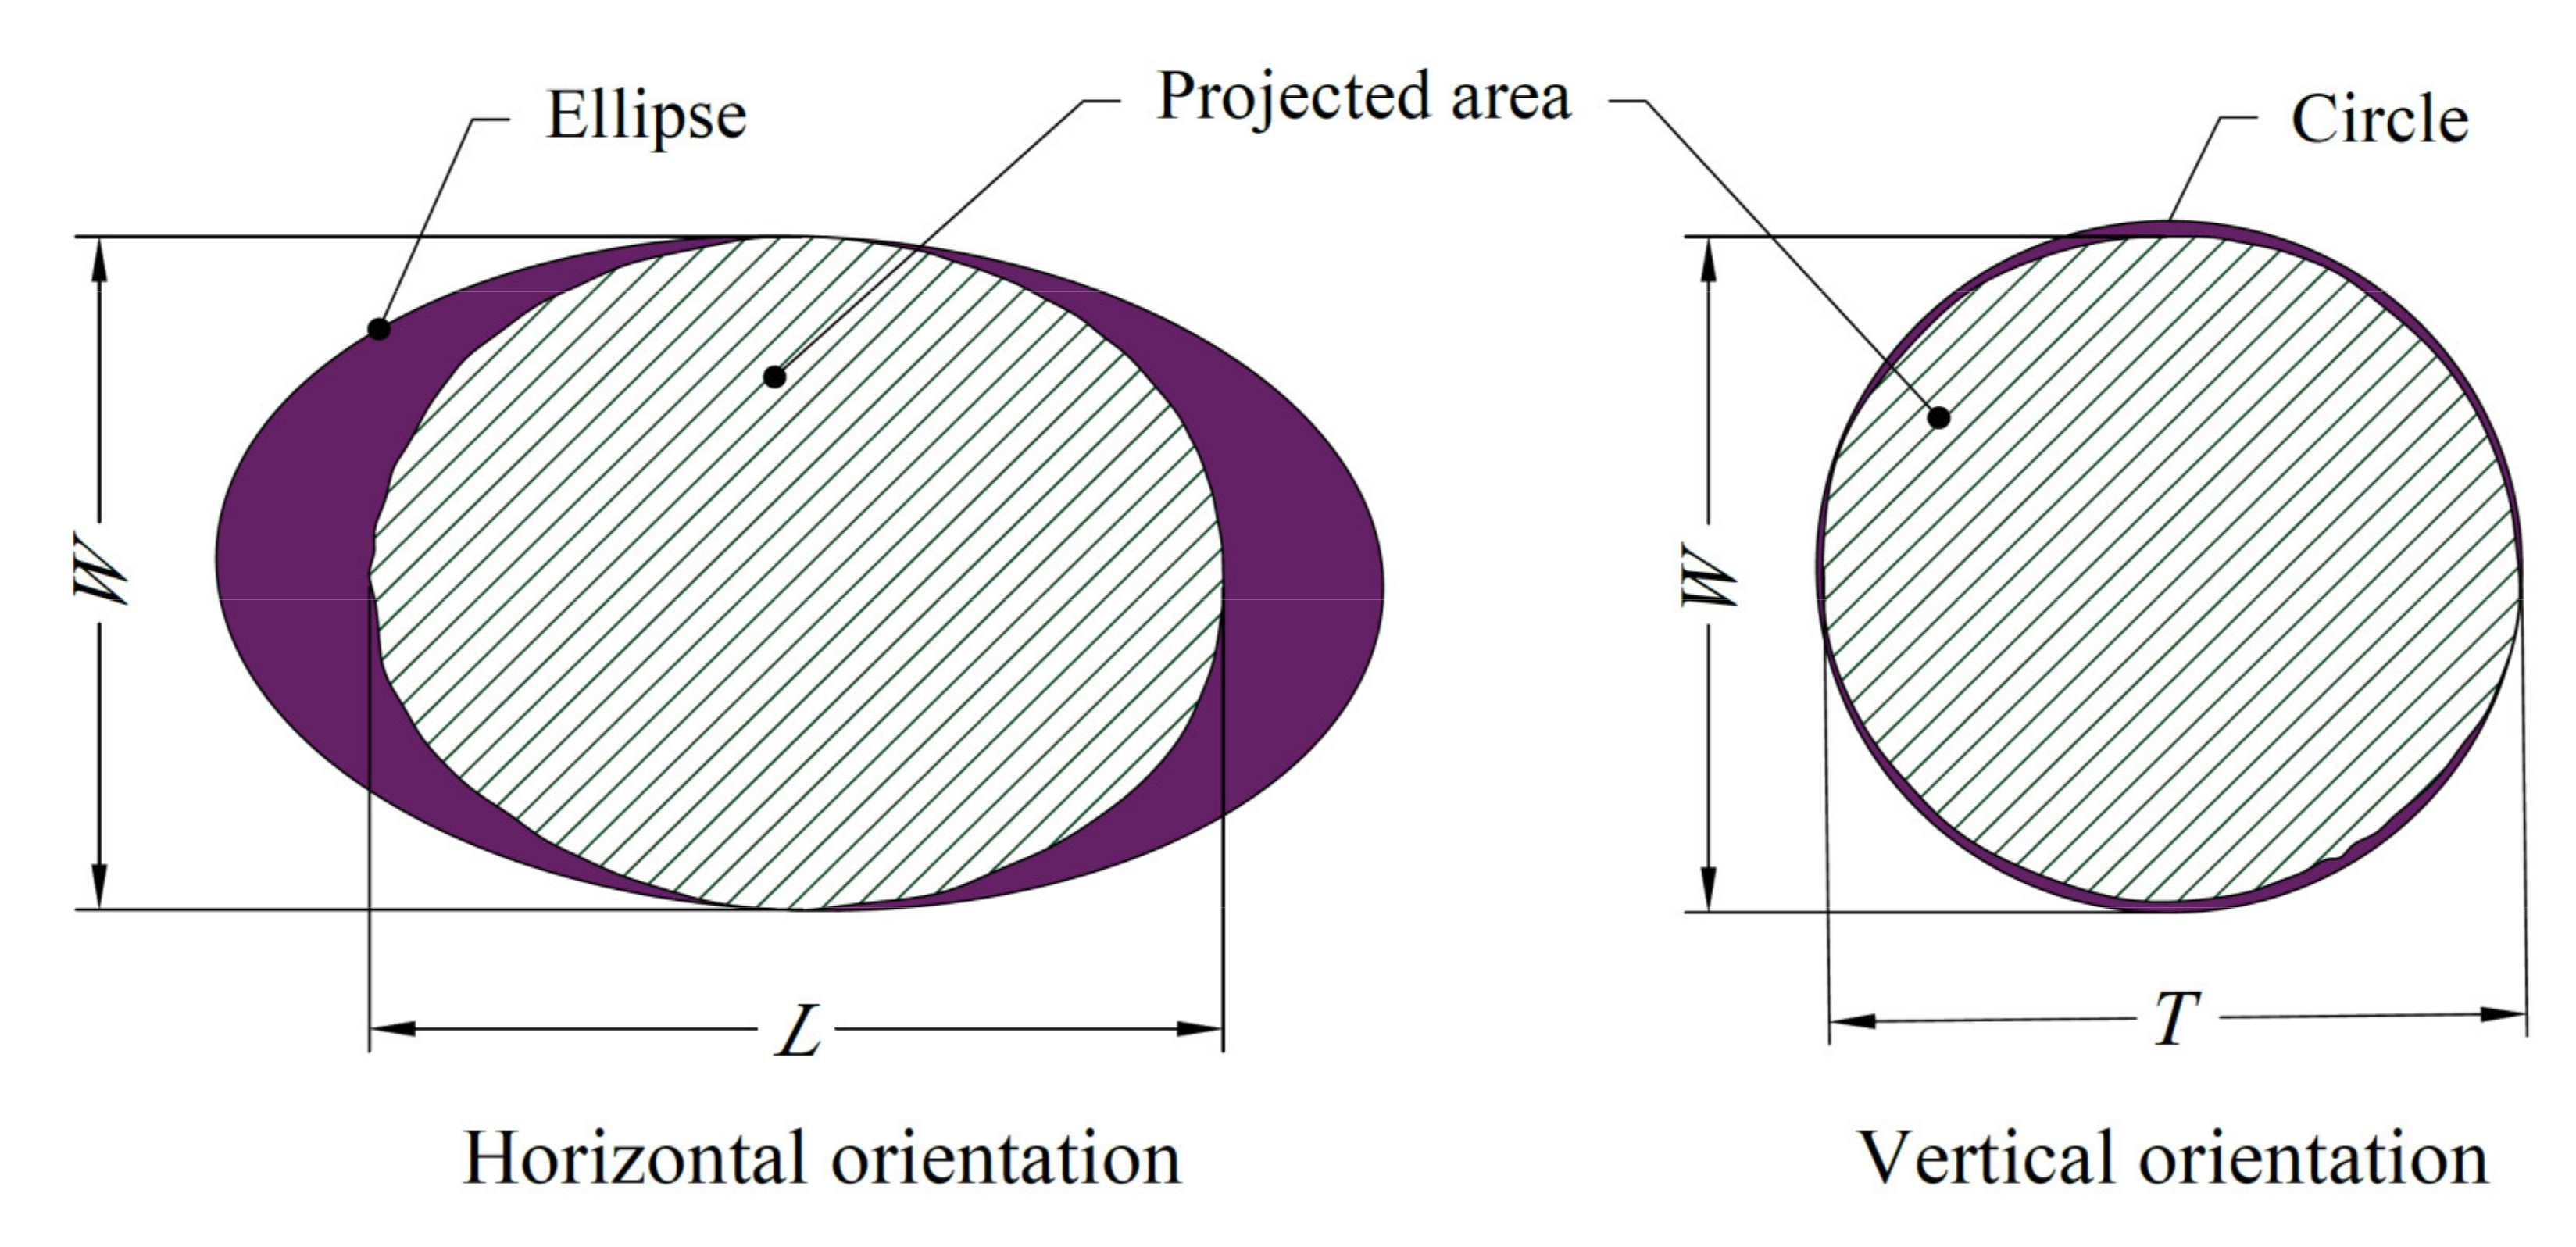
2.3. Morphology and Dimensional Attributes
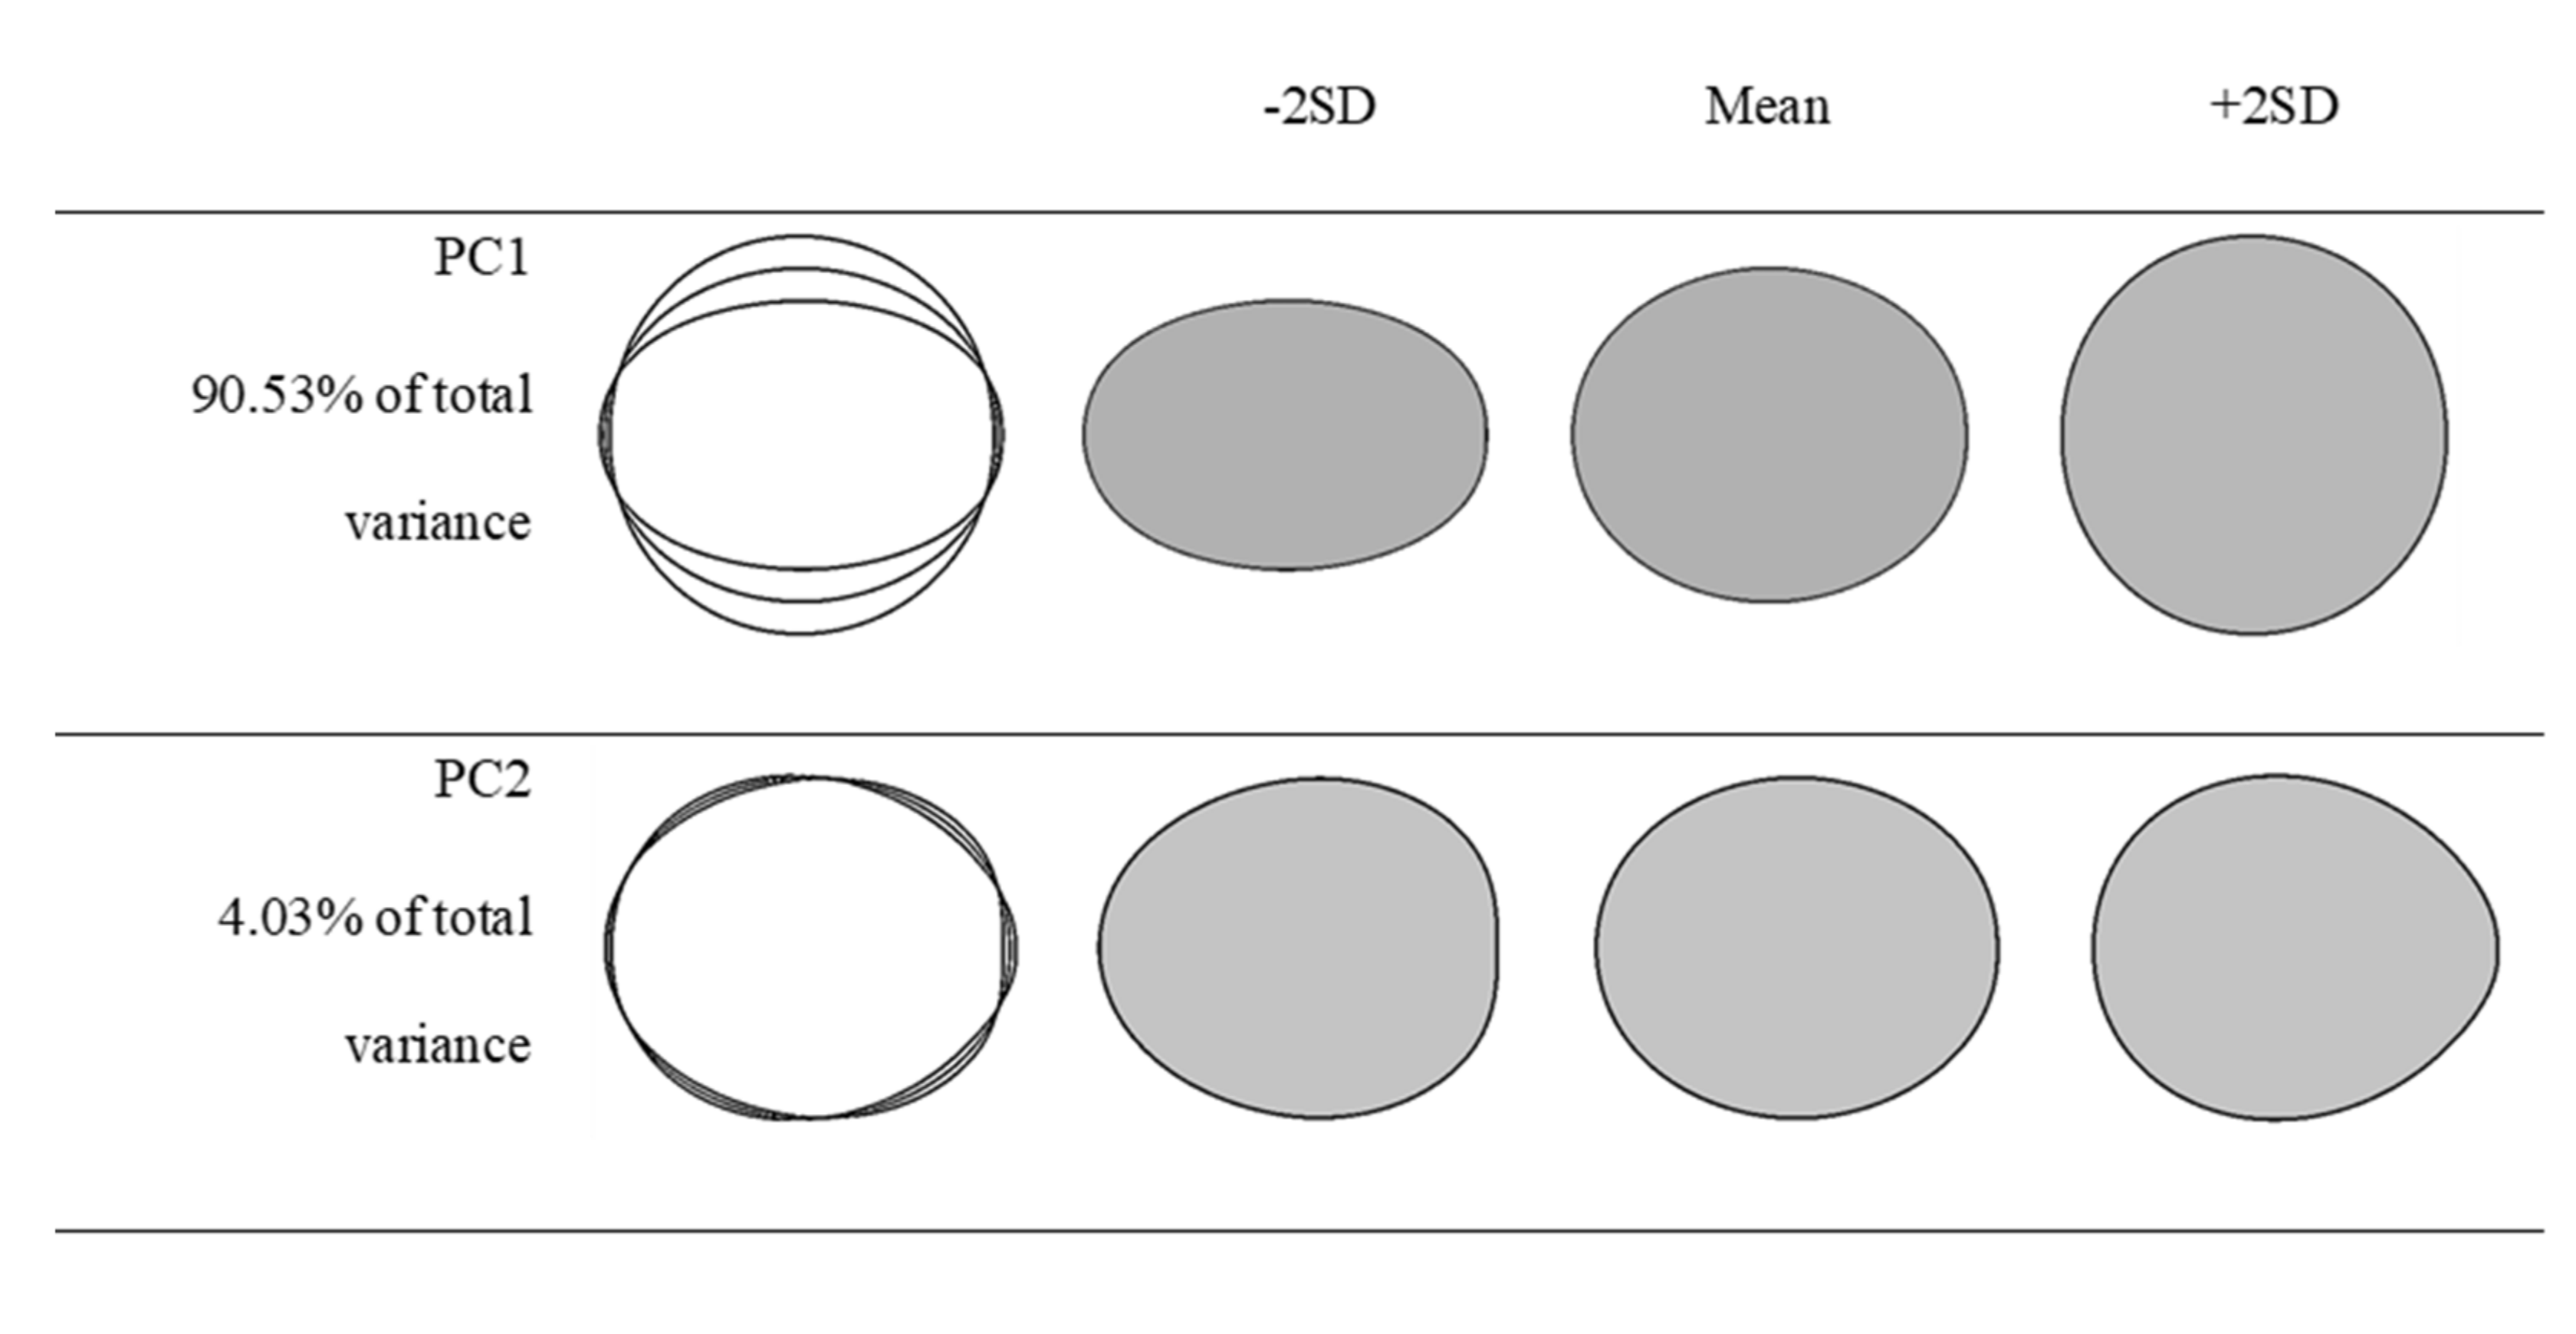
2.4. Elliptic Fourier Analysis
2.5. Statistical Assessments
3. Results and Discussion
3.1. Basic Morphology and Dimensional Attributes Measured at Horizontal and Vertical Orientations
3.2. Basic Morphology and Dimensional Attributes of the Grape Cultivars
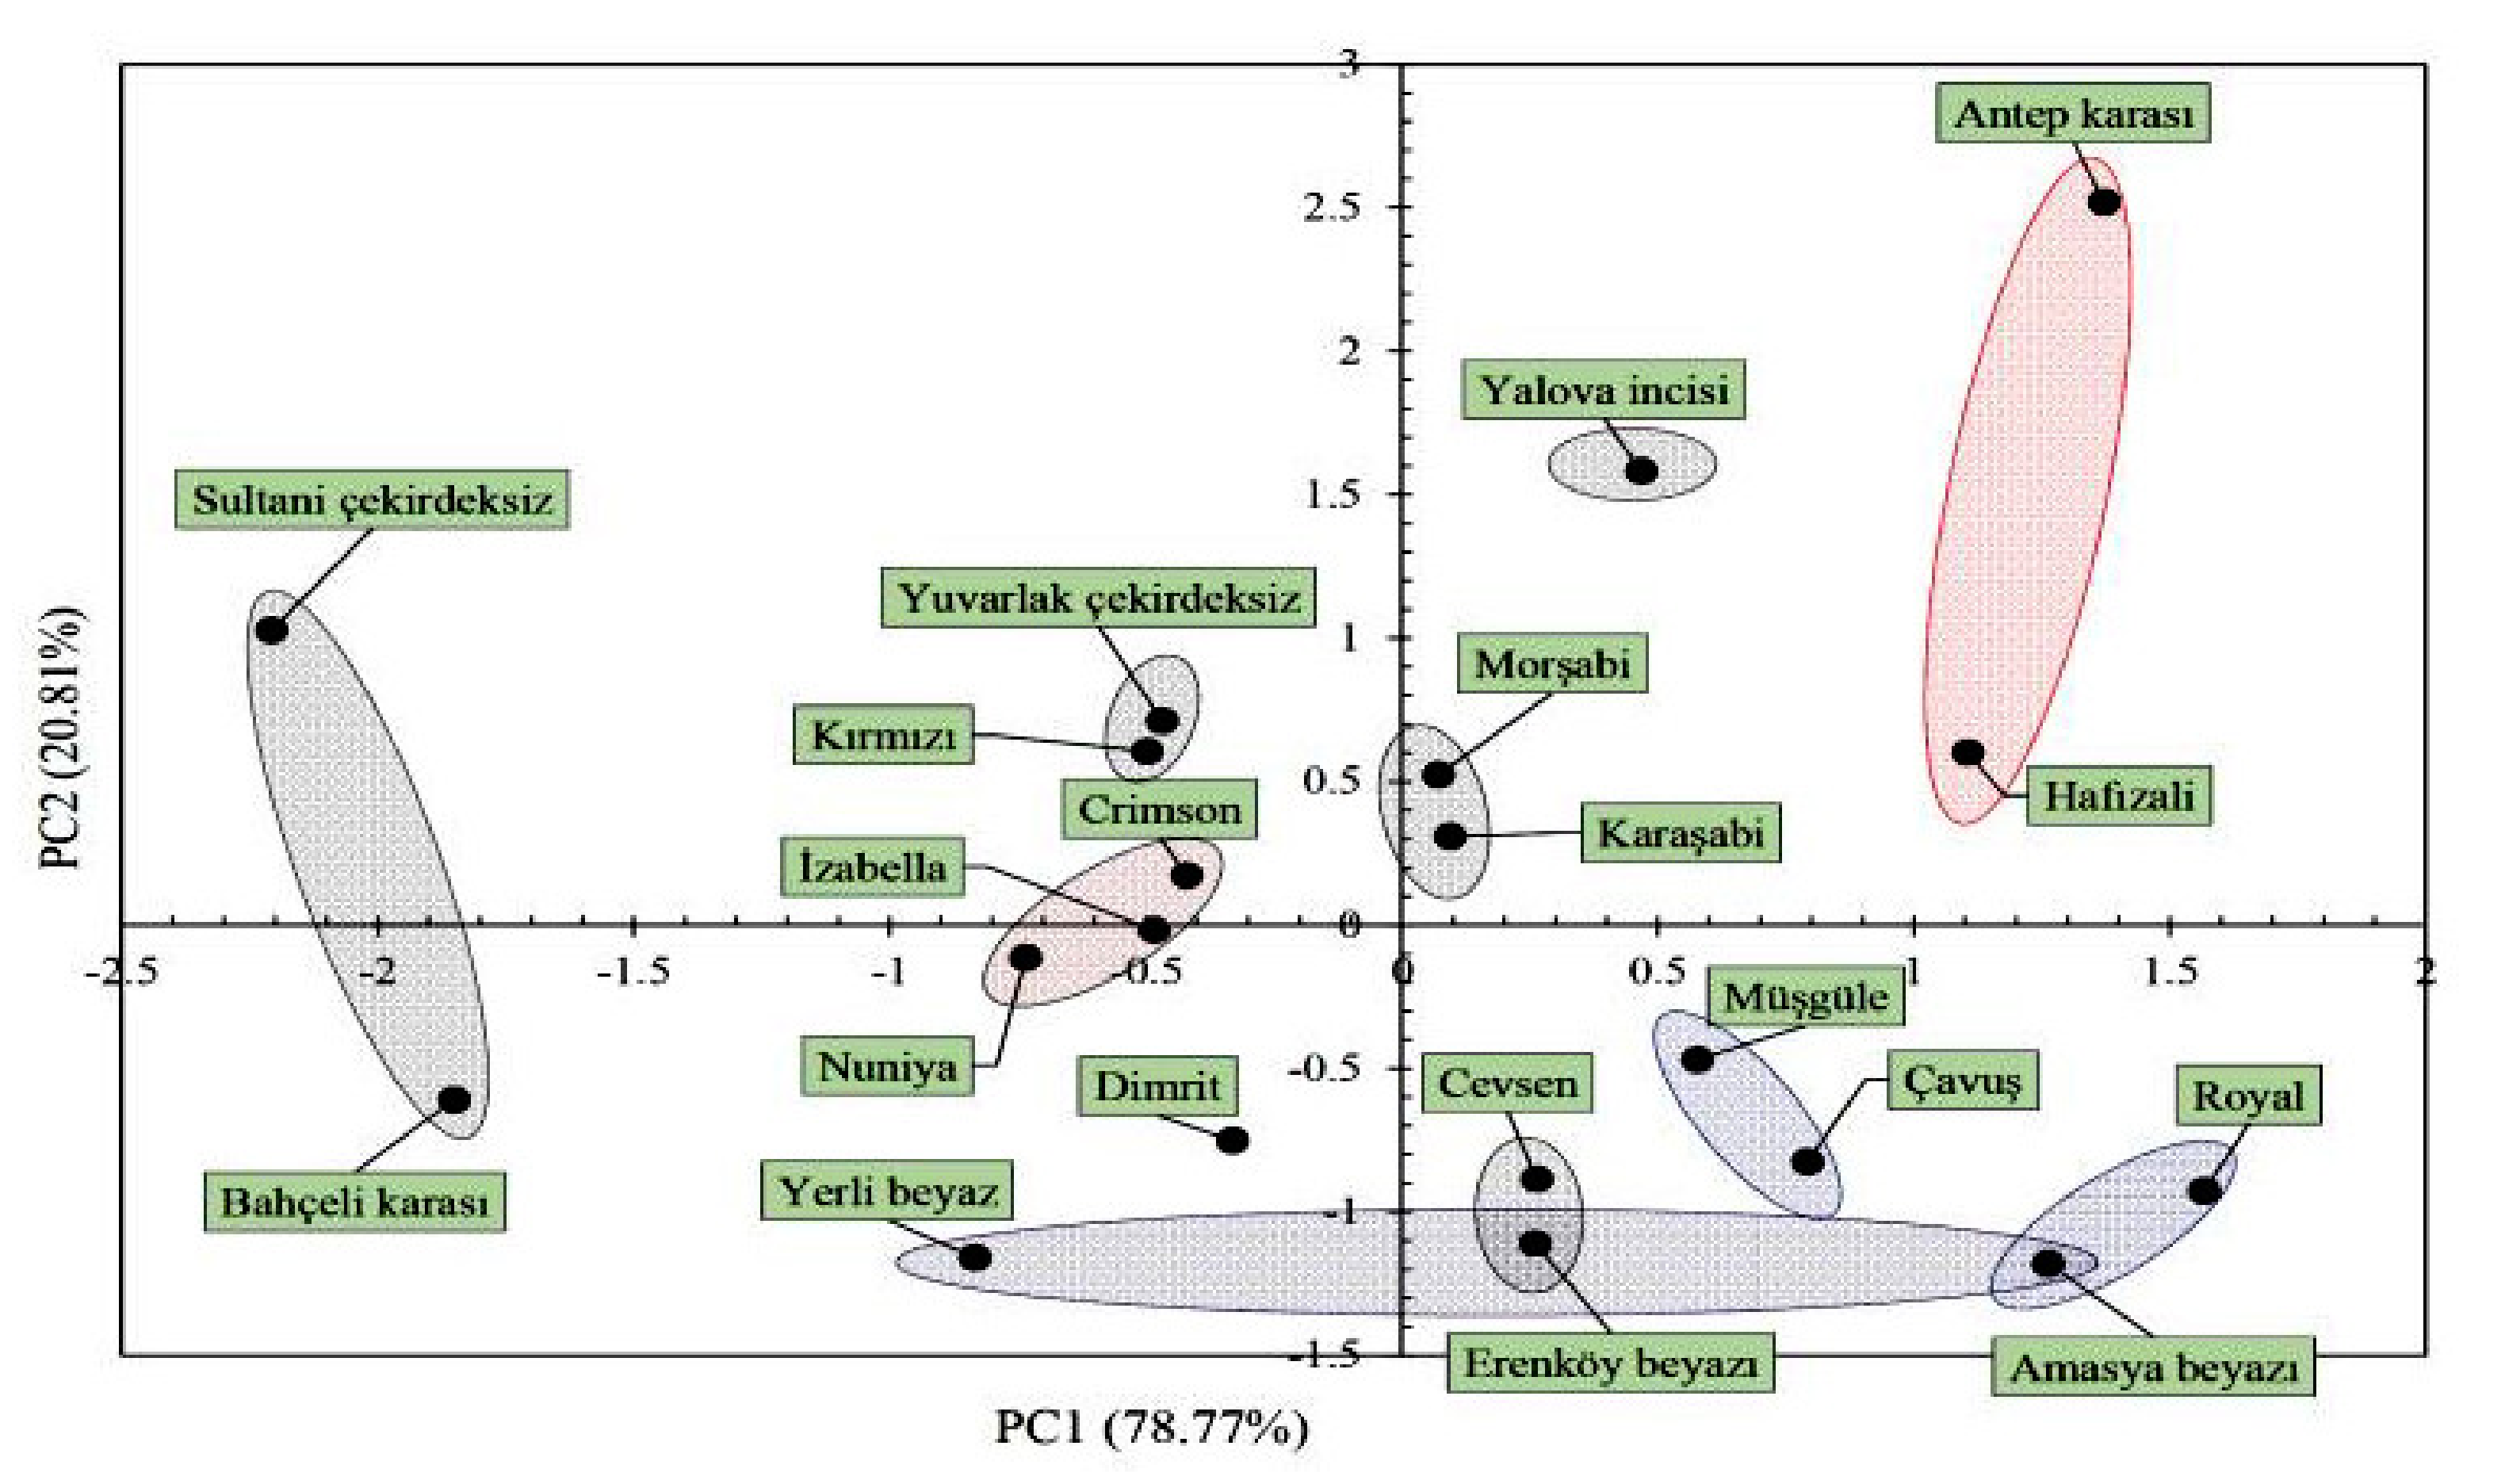
3.3. Eigen Statistics for Two Principal Components
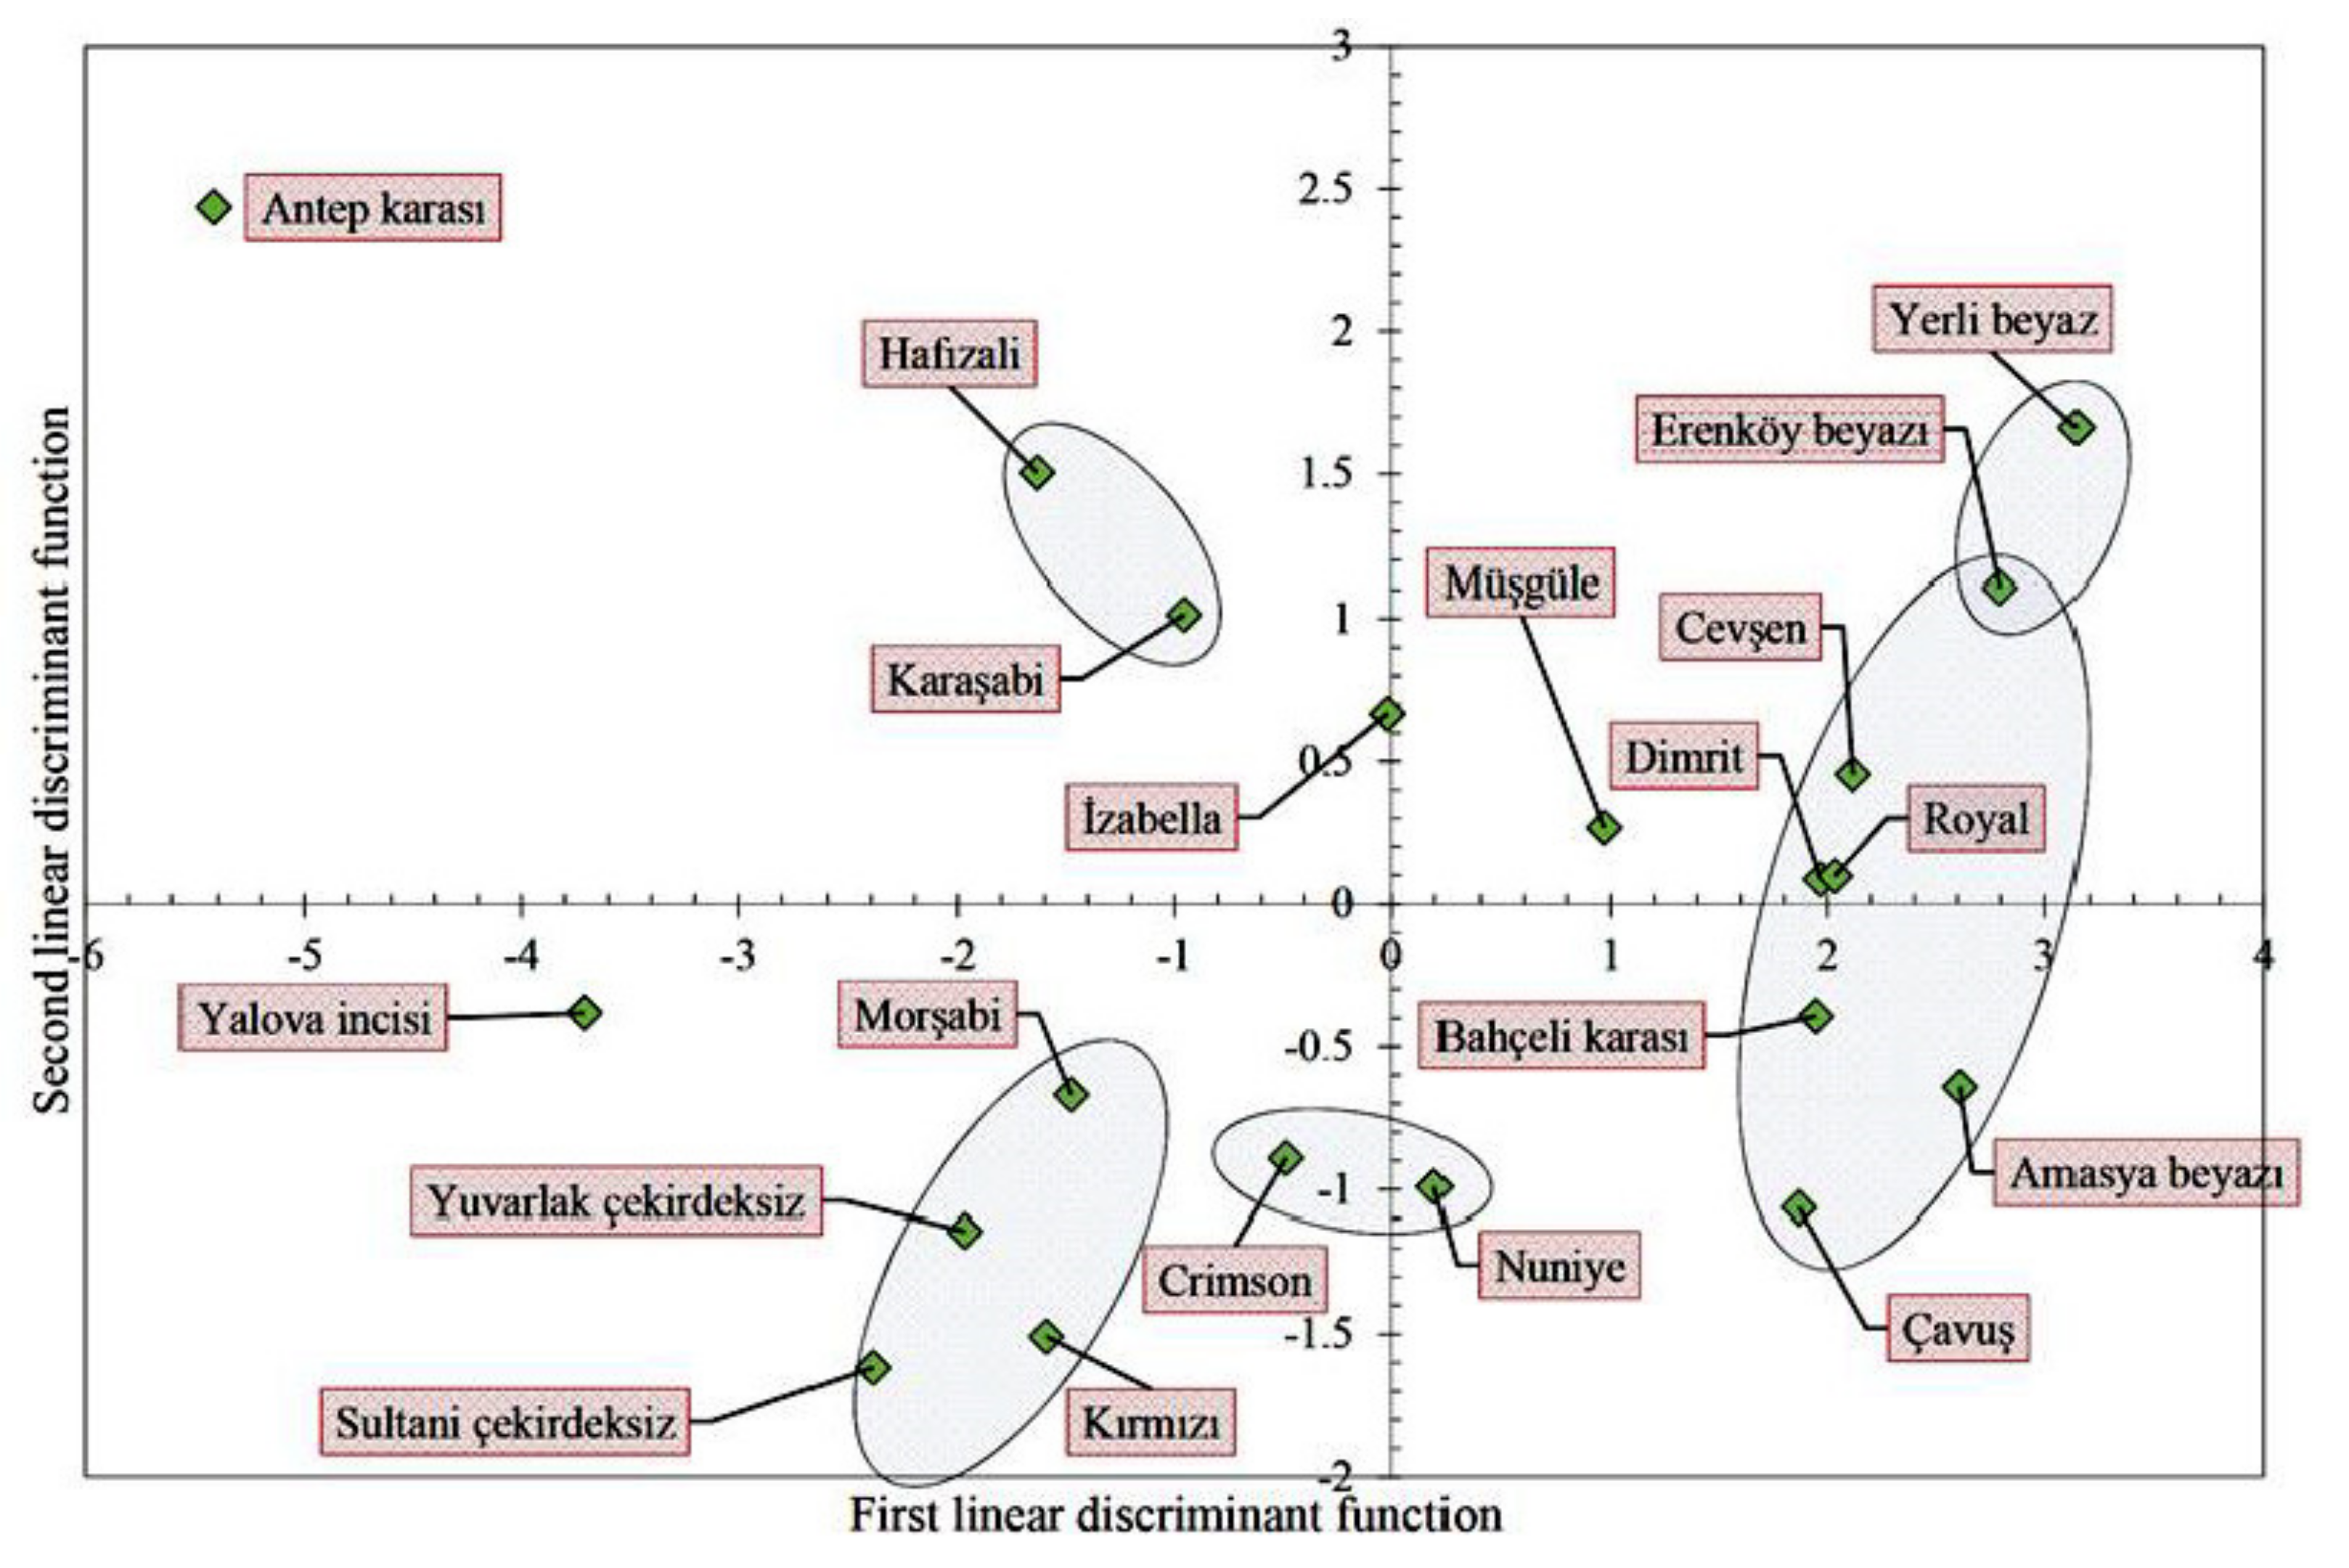
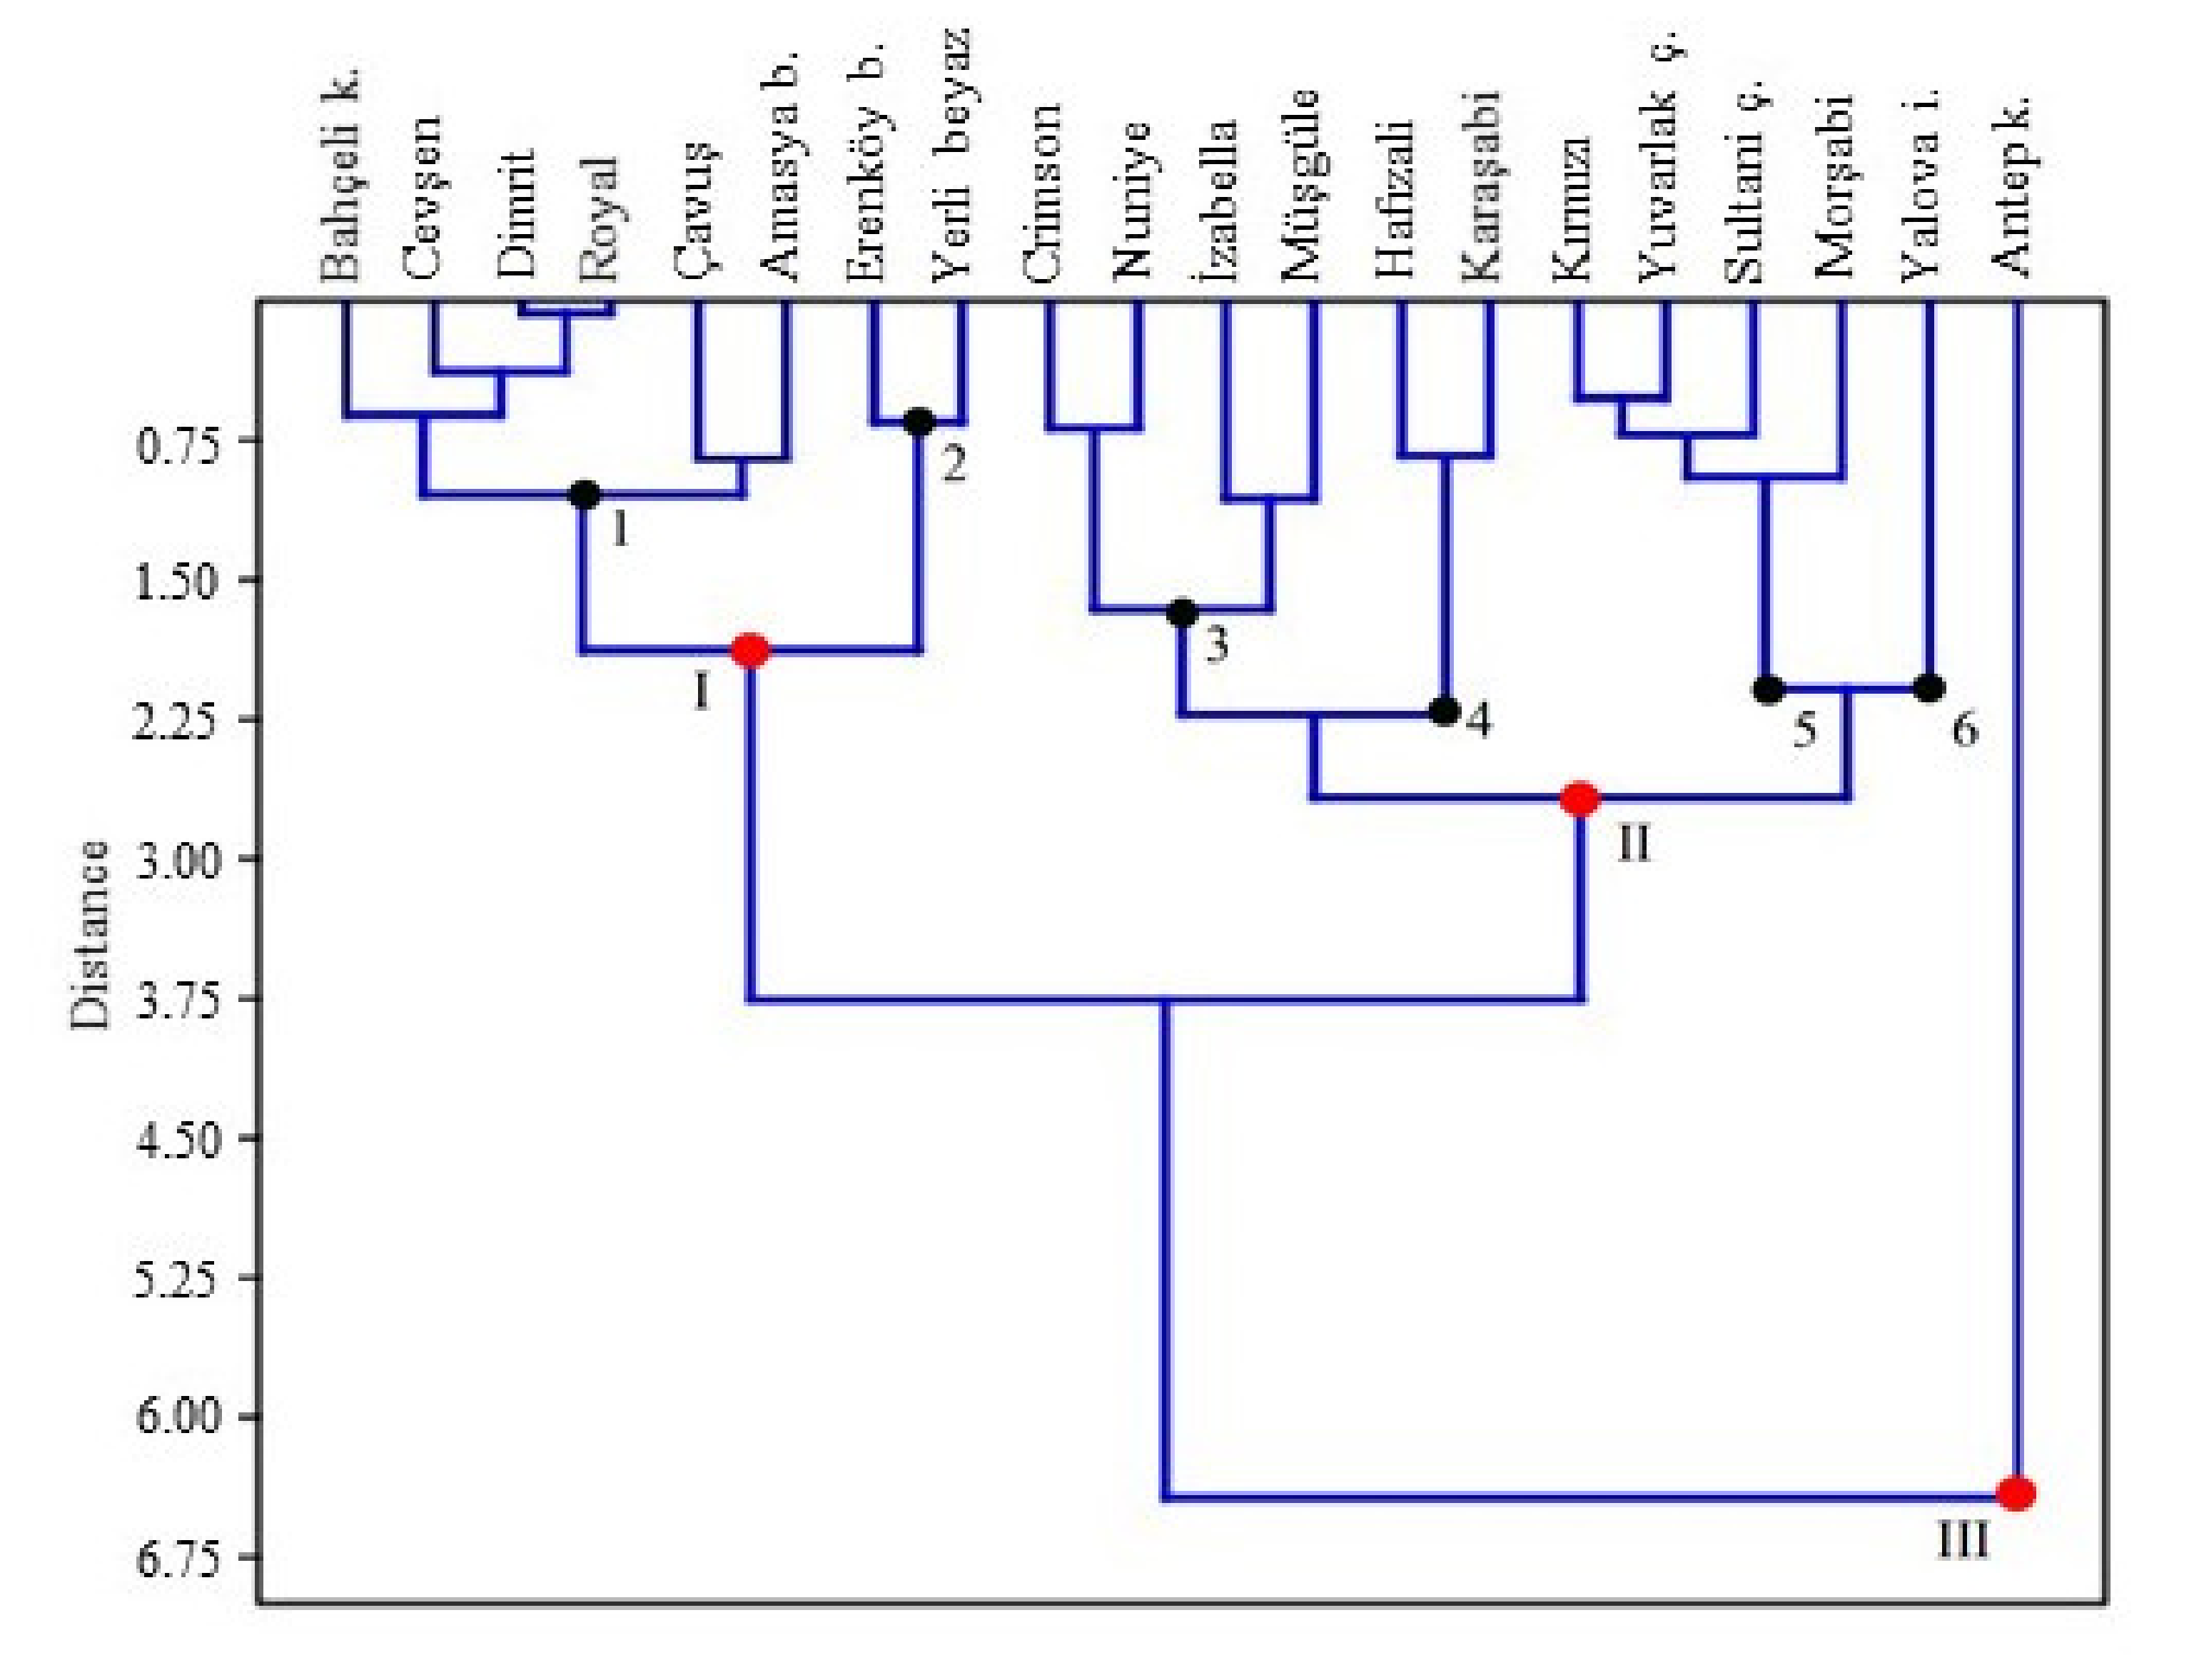
3.4. The Results of the Discriminant Analysis and Pair-Wise Comparisons
4. Conclusions
Author Contributions
Funding
Institutional Review Board Statement
Informed Consent Statement
Data Availability Statement
Conflicts of Interest
References
- FAOSTAT. FAO Web Page. Available online: http://www.fao.org/faostat (accessed on 15 May 2020).
- OIV. Statistical Report on World Vitiviniculture. 2019. Available online: https://www.oiv.int/public/medias/6782/oiv-2019-statistical-report-on-world-vitiviniculture.pdf (accessed on 5 June 2021).
- OIV. Distribution of the World’s Grapevine Varieties. 2017. Available online: https://www.oiv.int/public/medias/5888/en-distribution-of-the-worlds-grapevine-varieties.pdf (accessed on 5 June 2021).
- Agaoglu, Y.S.; Celik, H.; Gokcay, E. Brief Ampelographic Characterization of Indigenous Grapevine Cultivars Subjected to Clonal Selection in Turkey. In Proceedings of the 5th International Symposium on Grape Breeding, St. Martin/Pfalz, Germany, 12–16 September 1989. [Google Scholar]
- Maghradze, D.; Kikilashvili, S.; Gotsiridze, O.; Maghradze, T.; Fracassetti, D.; Failla, O.; Rustioni, L. Comparison between the grape technological characteristics of Vitis vinifera Subsp. sylvestris and Subsp. sativa. Agronomy 2021, 11, 472. [Google Scholar] [CrossRef]
- Bouby, L.; Wales, N.; Jalabadze, M.; Rusishvili, N.; Bonhomme, V.; Ramos-Madrigal, J.; Evin, A.; Ivorra, S.; Lacombe, T.; Pagnoux, C.; et al. Tracking the history of grapevine cultivation in Georgia by combining geometric morphometric and ancient DNA. Veget. Hist. Archaeobot. 2020, 30, 63–76. [Google Scholar] [CrossRef]
- Soylemezoglu, G.; Agaoglu, Y.S.; Uzun, H.I. Ampelographic characteristics and isozymic analysis of Vitis vinifera spp. sylvestris Gmel in Southwestern Turkey. Biotechno. Biotechnol. Equip. 2001, 15, 106–113. [Google Scholar] [CrossRef]
- Soylemezoglu, G.; Atak, A.; Boz, Y.; Unal, A.; Saglam, M. Viticulture in Turkey. Chron. Horticult. 2016, 56, 27–31. [Google Scholar]
- Ates, F.; Coban, H.; Kara, Z.; Sabir, A. Ampelographic characterization of some grape cultivars (Vitis vinifera L.) grown in south-western region of Turkey. Bulg. J. Agric. Sci. 2011, 17, 314–324. [Google Scholar]
- Eyduran, S.P.; Akin, M.; Ercisli, S.; Eyduran, E.; Magharadze, D. Sugars, organic acids, and phenolic compounds of ancient grape cultivars (Vitis vinifera L.) from Igdir province of Eastern Turkey. Biol. Res. 2015, 48, 2. [Google Scholar] [CrossRef] [PubMed]
- Sabir, A.; Kafkas, E.; Tangolar, S. Distribution of major sugars, acids and total phenols in juice of five grapevine (Vitis spp.) cultivars at different stages of berry development. Span. J. Agric. Res. 2010, 8, 425–433. [Google Scholar] [CrossRef]
- Pallas, E.I. Sustainable wine and grape production, the example of Hungary. Visegrad J. Bioeconomy Sustain. Develop. 2016, 5, 53–57. [Google Scholar] [CrossRef][Green Version]
- Sargolzaei, M.; Rustioni, L.; Cola, G.; Ricciardi, V.; Bianco, P.A.; Maghradze, D.; Failla, O.; Quaglino, F.; Toffolatti, S.L.; de Lorenzis, G. Georgian Grapevine Cultivars: Ancient Biodiversity for Future Viticulture. Front. Plant Sci. 2021, 12, 630122. [Google Scholar] [CrossRef]
- Kupe, M. Some ampelographic and biochemical characteristics of local grape accessions from Turkey. Genetika-Belgrade 2020, 50, 513–525. [Google Scholar] [CrossRef]
- Gago, P.; Santiago, J.L.; Boso, S.; Alonso-Villaverde, V.; Grando, M.S.; Martinez, M.C. Biodiversity and characterization of twenty-two Vitis vinifera L. cultivars in the Northwestern Iberian Peninsula. Am. J. Enol. Vitic. 2009, 60, 293–301. [Google Scholar]
- Antolín, M.C.; Toledo, M.; Pascual, I.; Irigoyen, J.J.; Goicoechea, N. The exploitation of local Vitis vinifera L. Biodiversity as a valuable tool to cope with climate change maintaining berry quality. Plants 2021, 10, 71. [Google Scholar] [CrossRef]
- Meneghetti, S.; Costacurta, A.; Frare, E.; da Rold, G.; Migliaro, D.; Morreale, G.; Crespan, M.; Sotés, V.; Calò, A. Clones identification and genetic characterization of Garnacha grapevine by means of different PCR-derived marker systems. Mol. Biothecnol. 2011, 48, 244–254. [Google Scholar] [CrossRef] [PubMed]
- Pantelic, M.; Zagorac, D.D.; Natic, M.; Gašic, U.; Jovic, S.; Vujovic, D.; Djordjevic, P. Impact of clonal variability on phenolics and radical scavenging activity of grapes and wines: A study on the recently developed Merlot and Cabernet Franc clones (Vitis vinifera L.). PLoS ONE 2016, 11, e0163823. [Google Scholar] [CrossRef] [PubMed]
- OIV. OIV Descriptor List for Grape Varieties and Vitis Species, 2nd ed.; OIV: Paris, France, 2001. [Google Scholar]
- Muñoz-Organero; Gaforio, L.; Garcia Muñoz, S.; Cabello, F. Manual for Standarization of Vitis Descriptors; Instituto Nacional de Investigación y Tecnología Agraria y Alimentaria (INIA): Madrid, Spain, 2011. [Google Scholar]
- Rustioni, L.; Maghradze, D.; Popescu, C.F.; Cola, G.; Abashidze, E.; Aroutiounian, R.; Brazao, J.; Coletti, S.; Cornea, V.; Dejeu, L.; et al. First results of the European grapevine collections’ collaborative network: Validation of a standard eno-carpological phenotyping method. Vitis-Geilweilerhof. 2014, 53, 219–226. [Google Scholar]
- Rustioni, L.; Cola, G.; Maghradze, D.; Abashidze, E.; Argiriou, A.; Aroutiounian, R.; Brazão, J.; Chipashvili, R.; Cocco, M.; Cornea, V.; et al. Description of the Vitis vinifera L. phenotypic variability in eno-carpological traits by a Euro-Asiatic collaborative network among ampelographic collections. Vitis Geilweilerhof. 2019, 58, 37–46. [Google Scholar]
- Mena, A.; Martínez, J.; Fernández-González, M. Recovery, identification and relationships by microsatellite analysis of ancient grapevine cultivars from Castilla-La Mancha: The largest wine growing region in the world. Genet. Resour. Crop Evol. 2014, 61, 625–637. [Google Scholar] [CrossRef]
- Benjak, A.; Ercisli, S.; Vokurka, A.; Maletic, E.; Pejic, I. Genetic relationships among grapevine cultivars native to Croatia, Greece and Turkey. Vitis 2005, 44, 73–77. [Google Scholar]
- Laiadi, Z.; Bentchikou, M.M.; Bravo, G.; Cabello, F.; Martínez-Zapater, J.M. Molecular identification and genetic relationships of Algerian grapevine cultivars maintained at the germplasm collection of Skidda (Algeria). Vitis 2009, 48, 25–32. [Google Scholar]
- García-Muñoz, S.; Lacombe, T.; de Andrés, M.T.; Gaforio, L.; Muñoz-Organero, G.; Lacou, V.; This, P.; Cabello, F. Grape varieties (Vitis vinifera L.) from the Balearic Islands: Genetic characterization and relationship with Iberian peninsula and Mediterranean Basin. Genet. Resour. Crop Evol. 2012, 59, 589–605. [Google Scholar] [CrossRef]
- Maeda, H.; Akagi, T.; Tao, R. Quantitative characterization of fruit shape and its differentiation pattern in diverse persimmon (Diospyros kaki) cultivars. Sci. Hortic. 2018, 228, 41–48. [Google Scholar] [CrossRef]
- Basile, T.; Marsico, A.D.; Perniola, R. NIR analysis of intact berries: Chemical and physical properties prediction using multivariate analysis. Foods 2021, 10, 113. [Google Scholar] [CrossRef]
- Fuantes, S.; Hernandez-Montes, E.; Escalona, J.M.; Bota, J.; Gonzales Viejo, C.; Poblete-Echeverria, C.; Tongson, E.; Medrano, H. Automated grapevine cultivar classification based on machine learning using leaf morpho-colorimetry, fractal dimension and near-infrared spectroscopy parameters. Comput. Electron. Agrc. 2018, 151, 311–318. [Google Scholar] [CrossRef]
- De Oliveira, G.L.; de Souza, A.P.; de Oliveira, F.A.; Zucchi, M.I.; de Souza, L.M.; Moura, M.F. Genetic structure and molecular diversity of Brazilian grapevine germplasm: Management and use in breeding programs. PLoS ONE 2020, 15, e0240665. [Google Scholar] [CrossRef]
- Laucou, V.; Launay, A.; Bacilieri, R.; Lacombe, T.; Adam-Blondon, A.F.; Bérard, A.; Chauveau, A.; de Andrés, M.T.; Hausmann, L.; Ibanez, J.; et al. Extended diversity analysis of cultivated grapevine Vitis vinifera with 10K genome-wide SNPs. PLoS ONE 2018, 13, e0192540. [Google Scholar] [CrossRef] [PubMed]
- Bodor, P.; Somogyi, E.; Baranyai, L.; Lazar, J.; Balo, B. Analysis of the grapevine (Vitis vinifera L.) berry shape by using elliptic Fourier descriptors. Prog. Agric. Eng. Sci. 2020, 16, 87–93. [Google Scholar]
- Sayıncı, B.; Kara, M.; Ercişli, S.; Duyar, Ö.; Ertürk, Y. Elliptic Fourier analysis for shape distinction of Turkish hazelnut cultivars. Erwerbs Obstbau 2015, 57, 1–11. [Google Scholar] [CrossRef]
- Shimomura, K.; Horie, H.; Sugiyama, M.; Kawazu, Y.; Yoshioka, Y. Quantitative evaluation of cucumber fruit texture and shape traits reveals extensive diversity and differentiation. Sci. Hortic. 2016, 199, 133–141. [Google Scholar] [CrossRef]
- Demir, B.; Sayinci, B.; Cetin, N.; Yaman, M.; Comlek, R. Shape discrimination of almond cultivars by Elliptic Fourier Descriptors. Erwerbs Obstbau. 2018, 61, 245–256. [Google Scholar] [CrossRef]
- Iwata, H.; Ukai, Y. SHAPE: A computer program package for quantitative evaluation of biological shapes based on elliptic Fourier descriptors. J. Hered. 2002, 93, 384–385. [Google Scholar] [CrossRef]
- Kara, M.; Sayıncı, B.; Elkoca, E.; Öztürk, İ.; Özmen, T.B. Seed size and shape analysis of registered common bean (Phaseolus vulgaris L.) cultivars in Turkey using digital photography. J. Agric. Sci. 2013, 19, 219–234. [Google Scholar]
- Demir, B.; Sayinci, B.; Sümbül, A.; Yaman, M.; Yildiz, E.; Çetin, N.; Karakaya, O.; Ercişli, S. Bioactive compounds and physical attributes of Cornus mas genotypes through multivariate approaches. Folia Hortic. 2020, 32, 189–202. [Google Scholar] [CrossRef]
- Kara, M. Physical Properties of Biological Products (Includes Agricultural Products and Foods); Güven® Bilimsel I. Press: İzmir, Turkey, 2017; p. 327, (In Turkish). ISBN 978-975-6240-56-4. [Google Scholar]
- Mohsenin, N.N. Physical Properties of Plant and Animal Materials; Gordon and Breach Science Publisher: New York, NY, USA, 1986. [Google Scholar]
- Sayıncı, B.; Ercişli, S.; Akbulut, M.; Şavşatlı, Y.; Baykal, H. Determination of shape in fruits of cherry laurel (Prunus laurocerasus) accessions by using Elliptic Fourier analysis. Acta Sci. Pol. Hortoru 2015, 14, 63–82. [Google Scholar]
- Ercisli, S.; Sayinci, B.; Kara, M.; Yildiz, C.; Ozturk, I. Determination of size and shape features of walnut (Juglans regia L.) cultivars using image processing. Sci Hortic. 2012, 133, 47–55. [Google Scholar] [CrossRef]
- Sayıncı, B. Detection of manufacturing defects on orifice geometry of polyacetal (POM) nozzle discs by using the elliptic fourier descriptors. J. Agric. Fac. Bursa Uludağ Univ. 2016, 30, 57–73. [Google Scholar]
- Neto, J.C.; Meyer, G.E.; Jones, D.D.; Samal, A.K. Plant species identification using Elliptic Fourier leaf shape analysis. Comput. Electron. Agric. 2006, 50, 121–134. [Google Scholar] [CrossRef]
- Özkan-Koca, A. Ortadoğu’da yayılış gösteren Apis mellifera L. (Hymenoptera: Apidae) alt türlerinin geometrik morfometri yöntemiyle analizi. Ph.D. Thesis, Ankara Üniversitesi Fen Bilimleri Enstitüsü, Biyoloji Anabilim Dalı, Ankara, Turkey, 2012. [Google Scholar]
- Ekhvaia, J.; Akhalkatsi, M. Morphological variation and relationships of Georgian populations of Vitis vinifera L. subsp. sylvestris (C.C. Gmel.). Flora 2010, 205, 608–617. [Google Scholar] [CrossRef]
- Leão, P.C.S.; Cruz, C.D.; Motoike, S.Y. Genetic diversity of table grape based on morphoagronomic traits. Sci. Agric. 2011, 68, 42–49. [Google Scholar] [CrossRef]
- Khadivi-Khub, A.; Salimpour, A.; Rasouli, M. Analysis of grape germplasm from Iran based on fruit characteristics. Braz. J. Bot. 2014, 37, 105–113. [Google Scholar] [CrossRef]
- Kök, D.; Bal, E.; Bahar, E. Physical and biochemical traits of selected grape varieties cultivated in Tekirdağ, Turkey. Int. J. Sustain. Agric. Manag. Inform. 2017, 3, 215–223. [Google Scholar] [CrossRef]
- Abu-Zahra, T. Berry size of Thompson seedless as influenced by the application of Gibberellic acid and cane girdling. Pak. J. Bot. 2010, 42, 1755–1760. [Google Scholar]
- Barbagallo, M.G.; Guidoni, S.; Hunter, J.J. Berry size and qualitative characteristics of Vitis vinifera L. cv. Syrah. S. Afr. J. Enol. Vitic. 2011, 32, 129–136. [Google Scholar] [CrossRef]
- Kose, B. Effect of rootstock on grafted grapevine quality. Eur. J. Hortic. Sci. 2014, 79, 197–202. [Google Scholar]
- Esgici, R.; Özdemir, G.; Pekitkan, G.; Eliçin, K.; Öztürk, F.; Sessiz, A. Engineering properties of the Şire grape (Vitis vinifera L. Cv.). Sci. Papers Ser. B Hortic. 2017, 61, 195–203. [Google Scholar]
- Khodaei, J.; Akhijahani, H.S. Some physical properties of rasa grape (Vitis vinifera L.). World Appl. Sci. J. 2012, 18, 818–825. [Google Scholar]
- Abiri, K.; Rezaei, M.; Tahanian, H.; Heidari, P.; Khadivi, A. Morphological and pomological variability of a grape (Vitis vinifera L.) germplasm collection. Sci. Hortic. 2020, 266, 109285. [Google Scholar] [CrossRef]
- Lamine, M.; Zemni, H.; Ziadi, S.; Chabaane, A.; Melki, I.; Mejri, S.; Zoghlami, N. Multivariate analysis and clustering reveal high morphological diversity in Tunisian autochthonous grapes (Vitis vinifera): Insights into characterization, conservation and commercialization. J. Int. Sci. Vigne. Vin. 2014, 48, 111–122. [Google Scholar] [CrossRef]
- Nassur, R.C.M.R.; Pereira, G.E.; Alves, J.A.; Lima, L.C.O. Chemical characteristics of grape juices from different cultivar and rootstock combinations. Pesq. Agropec. Bras. 2014, 49, 540–545. [Google Scholar] [CrossRef]
- Istrate, A.; Rotaru, L.; Colibaba, L.C. Applications of the principle component analysis (PCA) at grape varieties from the sortogroup Coarnă neagră for establishing phenotypical variability. Seria Hortic. 2015, 58, 163–168. [Google Scholar]
- Demir, B.; Sayıncı, B.; Çetin, N.; Yaman, M.; Çömlek, R.; Aydın, Y.; Sütyemez, M. Elliptic Fourier based analysis and multivariate approaches for size and shape distinctions of walnut (Juglans regia L.) cultivars. Grasas Aceites 2018, 69, 1–12. [Google Scholar] [CrossRef]
- Skender, A.; Kurtovic, M.; Drkenda, P.; Becirspahic, D.; Ebrahimi, A. Phenotypic variability of autochthonous walnut (Juglans regia L) genotypes in northwestern Bosnia and Herzegovina. Turk. J. Agric. For. 2020, 44, 517–525. [Google Scholar] [CrossRef]
- Bujdosó, G.; Cseke, K. The Persian (English) walnut (Juglans regia L.) assortment of Hungary: Nut characteristics and origin. Sci. Hortic. 2021, 283, 110035. [Google Scholar] [CrossRef]
- Ercisli, S.; Esitken, A.; Cangi, R.; Sahin, F. Adventitious root formation of kiwifruit in relation to sampling date, IBA and Agrobacterium rubi inoculation. Plant Growth Regul. 2003, 41, 133–137. [Google Scholar] [CrossRef]
- Serçe, S.; Özgen, M.; Torun, A.A.; Ercisli, S. Chemical composition, antioxidant activities and total phenolic content of Arbutus andrachne L. (Fam. Ericaceae) (the Greek strawberry tree) fruits from Turkey. Anal. J. Food Compos. 2010, 23, 619–623. [Google Scholar] [CrossRef]
- Zivotic, A.; Micic, N.; Zabic, M.; Bosancic, B.; Cvetkovic, M. Precision cane meristem management can influence productivity and fruit quality of floricane red raspberry cultivars. Turk. J. Agric. For. 2019, 43, 405–413. [Google Scholar] [CrossRef]
- Sulu, G.; Kacar, Y.; Polat, I.; Kitapci, A.; Turgutoglu, E.; Simsek, O.; Satar, G. Identification of genetic diversity among mutant lemon and mandarin varieties using different molecular markers. Turk. J. Agric. For. 2020, 44, 465–478. [Google Scholar] [CrossRef]
- Gecer, M.K.; Kan, T.; Gundogdu, M.; Ercisli, S.; Ilhan, G.; Sagbas, H.I. Physicochemical characteristics of wild and cultivated apricots (Prunus armeniaca L.) from Aras valley in Turkey. Genet. Resour. Crop Evol. 2020, 67, 935–945. [Google Scholar] [CrossRef]


| Cultivars | Berry Skin Color |
|---|---|
| Amasya beyazı | Green-yellow |
| Antep karası | Black |
| Bahçeli karası | Black |
| Çavuş | Green-yellow |
| Cevşen | Green-yellow |
| Crimson | Dark red |
| Dimrit | Purple-black |
| Erenköy beyazı | Green-yellow |
| Hafizali | Green-yellow |
| Karaşabi | Black |
| Kırmızı | Dark red |
| Izabella (İsabella) | Dark purple-black |
| Morşabi | Purple |
| Müşgüle | Green-yellow |
| Nuniya | Green-yellow |
| Royal | Black |
| Sultani çekirdeksiz (Sultanina) | Green-yellow |
| Yalova incisi | Green-yellow |
| Yerli beyaz | Green-yellow |
| Yuvarlak çekirdeksiz | Green-ellow |
| Morphological–Dimensional Attributes | Equations | References |
|---|---|---|
| ) | ; for hor. orientation ; for vertical orientation | [38] |
| Geometric mean diameter (Dg, mm) | [39] | |
| Sphericity (φ, %) | [40] | |
| Volume (V, mm3) | Ellipse volume | |
| Surface area (SA, mm2) | [41] | |
| Circularity (C) | [42] |
| Varieties | Horizontal Orientation | Vertical Orientation | ||||||
|---|---|---|---|---|---|---|---|---|
| Projected Area (mm2) | Feret Diameter (mm) | Perimeter (mm) | Aspect Ratio | Projected Area (mm2) | Feret Diameter (mm) | Perimeter (mm) | Aspect Ratio | |
| Amasya beyazı | 371.2 ± 28.0 d,* | 21.73±0.81 d | 73.68 ± 2.94 d | 1.072 ± 0.042 klm | 356.8 ± 31.0 b | 21.30 ± 0.91 b | 71.31 ± 3.11 b | 1.028 ± 0.016 f |
| Antep karası | 516.1 ± 47.9 a | 25.61 ± 1.19 a | 89.21 ± 4.21 a | 1.557 ± 0.103 a | 347.6 ± 37.6 bc | 21.01 ± 1.14 bc | 70.52 ± 4.01 b | 1.057 ± 0.041 a |
| Bahçeli karası | 150.8 ± 14.2 m | 13.84 ± 0.65 o | 46.51 ± 2.26 o | 1.100 ± 0.035 j | 136.4 ± 13.7 j | 13.16 ± 0.65 j | 44.73 ± 2.30 j | 1.032 ± 0.017 cdef |
| Çavuş | 345.3 ± 37.6 e | 20.94 ± 1.13 e | 71.34 ± 4.15 e | 1.103 ± 0.044 j | 316.0 ± 40.4 d | 20.02 ± 1.27 d | 68.00 ± 4.06 c | 1.036 ± 0.018 bcdef |
| Cevşen | 297.6 ± 16.2 h | 19.46 ± 0.53 h | 65.97 ± 1.83 h | 1.095 ± 0.039 jkl | 278.3 ± 17.3 f | 18.81 ± 0.58 f | 63.32 ± 1.99 e | 1.034 ± 0.017 cdef |
| Crimson | 276.4 ± 29.3 i | 18.73 ± 0.98 j | 63.63 ± 3.38 ji | 1.218 ± 0.056 g | 229.1 ± 22.4 h | 17.06 ± 0.83 h | 57.16 ± 2.71 h | 1.032 ± 0.017 cdef |
| Dimrit | 256.6 ± 18.2 j | 18.06 ± 0.64 k | 61.27 ± 2.10 k | 1.100 ± 0.042 j | 233.7 ± 17.5 h | 17.24 ± 0.64 h | 58.52 ± 2.07 g | 1.036 ± 0.018 bcdef |
| Erenköy beyazı | 289.9 ± 18.9 hi | 19.20 ± 0.63 hi | 65.40 ± 2.42 hi | 1.069 ± 0.028 lm | 277.6 ± 20.3 f | 18.79 ± 0.68 f | 63.55 ± 2.44 e | 1.027 ± 0.016 f |
| Hafizali | 422.8 ± 37.6 b | 23.18 ± 1.04 b | 79.03 ± 3.88 b | 1.285 ± 0.058 de | 337.1 ± 30.3 c | 20.70 ± 0.93 c | 69.14 ± 3.09 c | 1.031 ± 0.017 cdef |
| Karaşabi | 320.1 ± 27.4 g | 20.17 ± 0.87 g | 68.22 ± 3.08 g | 1.245 ± 0.059 f | 265.5 ± 24.2 g | 18.37 ± 0.85 g | 61.40 ± 2.82 f | 1.042 ± 0.027 bcd |
| Kırmızı | 282.7 ± 25.3 i | 18.95 ± 0.83 ij | 64.40 ± 2.96 ji | 1.277 ± 0.061 de | 223.1 ± 19.9 h | 16.84 ± 0.74 h | 56.47 ± 2.35 h | 1.031 ± 0.020 def |
| İzabella | 262.6 ± 27.5 j | 18.26 ± 0.95 k | 61.92 ± 3.27 k | 1.198 ± 0.058 hg | 225.7 ± 27.0 h | 16.92 ± 1.00 h | 56.73 ± 3.34 h | 1.036 ± 0.024 bcdef |
| Morşabi | 327.5 ± 29.0 fg | 20.40 ± 0.91 fg | 69.44 ± 3.29 fg | 1.266 ± 0.057 ef | 262.3 ± 25.6 g | 18.25 ± 0.90 g | 61.22 ± 2.97 f | 1.030 ± 0.016 ef |
| Müşgüle | 338.6 ± 22.6 ef | 20.75 ± 0.69 ef | 70.65 ± 2.43 ef | 1.146 ± 0.052 i | 299.8 ± 18.6 e | 19.53 ± 0.60 e | 66.00 ± 1.86 d | 1.034 ± 0.016 cdef |
| Nuniya | 242.5 ± 25.8 k | 17.55 ± 0.94 ij | 59.31 ± 3.19 l | 1.180 ± 0.050 h | 208.1 ± 23.8 i | 16.25 ± 0.93 i | 54.56 ± 3.12 i | 1.040 ± 0.026 bcde |
| Royal | 410.5 ± 43.0 bc | 22.83 ± 1.19 bc | 76.80 ± 3.96 c | 1.097 ± 0.055 ij | 379.7 ± 43.3 a | 21.95 ± 1.23 a | 73.26 ± 4.06 a | 1.046 ± 0.020 b |
| Sultani çekirdeksiz | 159.7 ± 9.8 m | 14.25 ± 0.44 n | 48.99 ± 1.72 n | 1.326 ± 0.070 c | 120.6 ± 8.4 k | 12.38 ± 0.43 k | 42.12 ± 1.67 k | 1.042 ± 0.025 bc |
| Yalova incisi | 401.1 ± 50.2 c | 22.56 ± 1.40 c | 77.63 ± 4.90 c | 1.415 ± 0.080 b | 285.4 ± 40.5 f | 19.02 ± 1.34 f | 65.51 ± 4.99 d | 1.034 ± 0.017 cdef |
| Yerli beyaz | 201.3 ± 17.2 l | 16.00 ± 0.68 m | 55.09 ± 2.53 m | 1.055 ± 0.029 m | 201.9 ± 15.6 i | 16.02 ± 0.62 i | 54.26 ± 2.10 i | 1.033 ± 0.018 cdef |
| Yuvarlak çekirdeksiz | 286.2 ± 20.8 hi | 19.08 ± 0.69 hij | 65.17 ± 2.49 hi | 1.297 ± 0.056 d | 225.4 ± 16.6 h | 16.93 ± 0.62 h | 56.86 ± 2.02 h | 1.037 ± 0.018 bcdef |
| Mean ± SD | 308.0 ± 92.0 | 19.58 ± 2.98 | 66.68 ± 10.38 | 1.205 ± 0.140 | 260.5 ± 71.9 | 18.03 ± 2.59 | 60.73 ± 8.60 | 1.036 ± 0.022 |
| Min-max | 119.8–619.4 | 12.35–28.08 | 41.41–98.43 | 1.008–1.782 | 106.9–518.4 | 11.67–25.69 | 39.2–85.49 | 1.000–1.216 |
| Varieties | Length (mm) | Width (mm) | Thickness (mm) | Geometric Mean Diameter (mm) | Sphericity (%) | Surface Area (cm2) | Volume (cm3) | Circularity |
|---|---|---|---|---|---|---|---|---|
| Amasya beyazı | 22.67 ± 0.92 de* | 21.17 ± 0.96 b | 21.46 ± 0.93 b | 21.75±0.84 c | 96.0 ± 2.0 a | 14.89 ± 1.16 c | 5.413 ± 0.638 c | 0.858 ± 0.020 bcd |
| Antep karası | 31.94 ± 1.69 a | 20.56 ± 1.22 c | 21.52 ± 1.42 b | 24.17 ± 1.20 a | 75.7 ± 3.1 i | 18.39 ± 1.82 a | 7.443 ± 1.104 a | 0.813 ± 0.017 h |
| Bahçeli karası | 14.54 ± 0.77 l | 13.22 ± 0.67 k | 13.20 ± 0.72 k | 13.64 ± 0.67 m | 93.8 ± 1.9 b | 5.86 ± 0.58 l | 1.338 ± 0.202 l | 0.874 ± 0.012 a |
| Çavuş | 22.14 ± 1.17 ef | 20.10 ± 1.24 d | 20.11 ± 1.47 d | 20.76 ± 1.22 e | 93.7 ± 2.4 b | 13.58 ± 1.60 e | 4.731 ± 0.844 e | 0.851 ± 0.020 def |
| Cevşen | 20.54 ± 0.69 hi | 18.78 ± 0.56 f | 18.93 ± 0.72 fg | 19.40 ± 0.53 fg | 94.5 ± 2.2 b | 11.83 ± 0.64 fg | 3.828 ± 0.311 fg | 0.859 ± 0.016 bcd |
| Crimson | 20.73 ± 1.27 h | 17.02 ± 0.84 hi | 17.16 ± 0.92 i | 18.22 ± 0.90 hij | 88.0 ± 2.4 e | 10.45 ± 1.04 hi | 3.189 ± 0.479 hi | 0.856 ± 0.013 cde |
| Dimrit | 19.06 ± 0.74 j | 17.34 ± 0.72 hi | 17.28 ± 0.69 i | 17.87 ± 0.61 j | 93.8 ± 2.1 b | 10.04 ± 0.68 i | 2.997 ± 0.307 i | 0.858 ± 0.014 bcd |
| Erenköy beyazı | 20.03 ± 0.72 i | 18.75 ± 0.71 f | 18.93 ± 0.75 fg | 19.23 ± 0.67 g | 96.0 ± 1.5 a | 11.63 ± 0.82 g | 3.736 ± 0.396 g | 0.851 ± 0.016 def |
| Hafizali | 26.36 ± 1.47 b | 20.53 ± 0.95 c | 20.92 ± 1.00 c | 22.45 ± 1.00 b | 85.3 ± 2.4 f | 15.86 ± 1.41 b | 5.957 ± 0.790 b | 0.849 ± 0.015 ef |
| Karaşabi | 22.68 ± 1.22 de | 18.23 ± 0.87 g | 18.59 ± 0.99 gh | 19.73 ± 0.88 f | 87.1 ± 2.7 e | 12.25 ± 1.08 f | 4.043 ± 0.530 f | 0.863 ± 0.011 bc |
| Kırmızı | 21.42 ± 1.17 g | 16.79 ± 0.77 i | 17.03 ± 0.84 i | 18.29 ± 0.81 hi | 85.5 ± 2.5 f | 10.53 ± 0.95 hi | 3.224 ± 0.447 hi | 0.855 ± 0.013 cde |
| İzabella | 20.13 ± 1.14 i | 16.82 ± 1.03 i | 17.12 ± 1.09 i | 17.96 ± 0.99 ij | 89.3 ± 2.7 d | 10.16 ± 1.13 hi | 3.059 ± 0.518 hi | 0.859 ± 0.017 bcd |
| Morşabi | 23.08 ± 1.18 d | 18.24 ± 0.9 g | 18.35 ± 0.97 h | 19.76 ± 0.90 f | 85.7 ± 2.4 f | 12.29 ± 1.12 f | 4.065 ± 0.552 f | 0.852 ± 0.013 def |
| Müşgüle | 22.32 ± 0.99 e | 19.49 ± 0.68 e | 19.65 ± 0.74 e | 20.44 ± 0.66 e | 91.6 ± 2.3 c | 13.14 ± 0.85 e | 4.485 ± 0.440 e | 0.852 ± 0.019 def |
| Nuniya | 19.13 ± 1.07 j | 16.24 ± 1.00 j | 16.37 ± 0.95 j | 17.19 ± 0.90 k | 89.9 ± 2.5 d | 9.31 ± 0.97 j | 2.681 ± 0.418 j | 0.864 ± 0.010 b |
| Royal | 24.10 ± 1.37 c | 21.99 ± 1.30 a | 21.99 ± 1.34 a | 22.66 ± 1.19 b | 94.1 ± 2.8 b | 16.18 ± 1.72 b | 6.145 ± 0.991 b | 0.872 ± 0.012 a |
| Sultani çekirdeksiz | 16.37 ± 0.75 k | 12.36 ± 0.45 l | 12.53 ± 0.54 l | 13.63 ± 0.42 m | 83.4 ± 3.0 g | 5.84 ± 0.36 l | 1.330 ± 0.125 l | 0.836 ± 0.020 g |
| Yalova incisi | 26.69 ± 1.76 b | 18.90 ± 1.31 f | 19.20 ± 1.41 f | 21.31 ± 1.35 d | 79.9 ± 2.9 h | 14.32 ± 1.84 d | 5.125 ± 0.994 d | 0.833 ± 0.012 g |
| Yerli beyaz | 16.71 ± 0.80 k | 15.84 ± 0.67 j | 16.12 ± 0.70 j | 16.22 ± 0.67 l | 97.1 ± 1.5 a | 8.27 ± 0.69 k | 2.244 ± 0.278 k | 0.833 ± 0.028 g |
| Yuvarlak çekirdeksiz | 21.72 ± 1.04 fg | 16.75 ± 0.64 i | 17.24 ± 0.72 i | 18.44 ± 0.67 h | 85.0 ± 2.5 f | 10.69 ± 0.78 h | 3.294 ± 0.36 h | 0.846 ± 0.012 f |
| Mean ± SD | 21.62 ± 3.96 | 17.96 ± 2.57 | 18.19 ± 2.65 | 19.16 ± 2.82 | 89.3 ± 6.2 | 11.78 ± 3.36 | 3.916 ± 1.644 | 0.852 ± 0.021 |
| Min-max | 12.53–35.78 | 11.49–25.54 | 11.53–25.91 | 12.37–26.44 | 71.1–99.5 | 4.81–21.96 | 0.992–9.676 | 0.769–0.890 |
| Variables | PC1 | PC2 |
|---|---|---|
| Thickness | 0.999 | −0.006 |
| Feret diameter at vertical orientation. | 0.998 | −0.039 |
| Perimeter at vertical orientation. | 0.998 | −0.036 |
| Projected area at vertical orientation. | 0.997 | −0.032 |
| Width | 0.996 | −0.069 |
| Geometric mean diameter | 0.976 | 0.212 |
| Surface area | 0.968 | 0.247 |
| Volume | 0.951 | 0.280 |
| Feret diameter at horizontal orientation. | 0.940 | 0.337 |
| Perimeter at horizontal orientation. | 0.927 | 0.372 |
| Projected area at horizontal orientation. | 0.923 | 0.380 |
| Length | 0.811 | 0.583 |
| Aspect ratio at horizontal orientation. | 0.075 | 0.996 |
| Sphericity | −0.029 | −0.996 |
| Eigenvalues | 11.028 | 2.914 |
| % of variance | 78.773 | 20.812 |
| Cumulative (%) | 78.773 | 99.585 |
| A. Canonical Discriminant Functions (35.9% of Original Grouped Cases Correctly Classified) (Computed in SPSS ver. 20) | |||||||||||||||||||||||||||||
|---|---|---|---|---|---|---|---|---|---|---|---|---|---|---|---|---|---|---|---|---|---|---|---|---|---|---|---|---|---|
| Functions | Eigenvalue | % of Variance | Cumulative % | Canonical Correlation | |||||||||||||||||||||||||
| 1 | 5.461 | 81.5 | 81.5 | 0.919 | |||||||||||||||||||||||||
| 2 | 1.241 | 18.5 | 100.0 | 0.744 | |||||||||||||||||||||||||
| B. MANOVA Results (Computed in PAST ver. 4.05) | |||||||||||||||||||||||||||||
| Statistics | Value | Hypothesis df | Error df | F Value | p (Sigma) | ||||||||||||||||||||||||
| Wilks’ lambda | 0.06904 | 38 | 1558 | 115.00 | 0.000 | ||||||||||||||||||||||||
| Pillai trace | 1.399 | 38 | 1560 | 95.59 | 0.000 | ||||||||||||||||||||||||
| C. Hotelling’s Pair-Wise Comparisons. (Bonferroni Corrected p Values in Upper Triangle; Mahalonabis Distances in Lower Triangle) (Computed in PAST ver. 4.05) * | |||||||||||||||||||||||||||||
| Cultivars | Amasya beyazı | Antep karası | Bahçeli karası | Cevşen | Crimson | Çavuş | Dimrit | Erenköy beyazı | Hafızali | İzabella | Karaşabi | Kırmızı | Morşabi | Müşgüle | Nuniye | Royal | Sultani çekirdeksiz | Yalova incisi | Yerli beyaz | Yuvarlak çekirdeksiz | |||||||||
| Amasya beyazı | 1.6E−48b * | 1.8E+00 | 9.9E−04 | 2.8E−19 | 2.7E−01 | 4.4E−02 | 3.3E−08 | 1.7E−30 | 5.9E−18 | 3.1E−25 | 1.3E−27 | 2.8E−26 | 3.3E−09 | 5.8E−14 | 7.4E−02 | 1.7E−32 | 6.3E−39 | 2.5E−13 | 1.4E−29 | ||||||||||
| Antep karası | 73.99 | 8.7E−46 | 2.1E−45 | 4.4E−37 | 1.5E−46 | 3.1E−45 | 1.8E−47 | 5.0E−25 | 1.0E−35 | 4.4E−30 | 1.0E−34 | 4.8E−32 | 6.5E−41 | 4.0E−40 | 1.8E−45 | 2.7E−32 | 1.0E−20 | 1.7E−48 | 8.9E−32 | ||||||||||
| Bahçeli karası | 0.50 | 62.27 | 2.2E−01 | 2.7E−14 | 2.8E+00 | 2.1E+01 | 6.4E−08 | 4.9E−26 | 3.3E−12 | 3.6E−20 | 1.1E−23 | 1.0E−21 | 1.5E−03 | 5.5E−09 | 1.7E+01 | 5.7E−29 | 1.5E−35 | 2.0E−13 | 1.4E−25 | ||||||||||
| Cevşen | 1.45 | 60.75 | 0.75 | 6.6E−18 | 2.3E−06 | 4.1E+01 | 7.3E−02 | 5.6E−25 | 1.7E−11 | 2.1E−19 | 5.4E−27 | 4.3E−24 | 2.0E−03 | 1.1E−13 | 5.2E+01 | 1.0E−31 | 9.5E−37 | 9.5E−07 | 3.2E−28 | ||||||||||
| Crimson | 9.65 | 35.42 | 6.16 | 8.59 | 2.7E−13 | 1.3E−15 | 1.3E−24 | 1.0E−15 | 4.1E−07 | 6.3E−10 | 3.3E−04 | 2.3E−02 | 4.5E−09 | 2.3E+00 | 3.9E−16 | 1.4E−10 | 1.9E−20 | 1.5E−28 | 4.4E−06 | ||||||||||
| Çavuş | 0.72 | 65.38 | 0.45 | 2.36 | 5.58 | 2.4E−03 | 2.9E−13 | 6.3E−28 | 6.3E−15 | 3.0E−22 | 3.9E−22 | 3.0E−21 | 6.3E−07 | 1.6E−07 | 1.7E−03 | 1.2E−27 | 2.3E−35 | 1.7E−18 | 1.4E−24 | ||||||||||
| Dimrit | 0.95 | 60.10 | 0.23 | 0.16 | 6.98 | 1.33 | 1.4E−04 | 8.4E−25 | 7.9E−11 | 5.8E−19 | 5.1E−25 | 2.1E−22 | 2.3E−02 | 6.9E−11 | 1.8E+02 | 4.9E−30 | 9.2E−36 | 6.0E−10 | 1.6E−26 | ||||||||||
| Erenköy beyazı | 3.09 | 69.28 | 2.97 | 0.88 | 14.76 | 5.56 | 1.72 | 1.3E−28 | 3.0E−17 | 5.3E−24 | 1.5E−32 | 1.0E−29 | 2.5E−10 | 4.8E−21 | 3.5E−04 | 1.3E−36 | 1.5E−40 | 3.4E+00 | 1.9E−33 | ||||||||||
| Hafızali | 22.61 | 15.22 | 16.40 | 15.16 | 7.05 | 18.84 | 14.96 | 19.77 | 1.0E−08 | 3.4E−01 | 1.5E−18 | 9.4E−12 | 1.6E−17 | 3.7E−19 | 3.3E−25 | 4.5E−20 | 6.6E−17 | 1.3E−30 | 8.5E−16 | ||||||||||
| İzabella | 8.63 | 32.32 | 4.98 | 4.61 | 2.65 | 6.55 | 4.28 | 8.11 | 3.31 | 2.9E−02 | 6.0E−16 | 4.6E−10 | 1.0E−02 | 1.7E−07 | 2.4E−11 | 1.1E−20 | 1.4E−24 | 7.8E−21 | 9.6E−16 | ||||||||||
| Karaşabi | 15.46 | 21.96 | 10.40 | 9.75 | 3.85 | 12.29 | 9.40 | 14.08 | 0.70 | 1.00 | 2.9E−15 | 3.1E−08 | 8.4E−11 | 7.1E−13 | 2.0E−19 | 2.0E−18 | 4.1E−19 | 1.1E−26 | 1.9E−13 | ||||||||||
| Kırmızı | 18.41 | 30.22 | 13.75 | 17.61 | 1.60 | 12.18 | 15.21 | 26.08 | 9.07 | 7.21 | 6.76 | 2.9E−01 | 2.4E−19 | 4.7E−09 | 1.8E−25 | 5.0E−01 | 1.4E−13 | 9.0E−36 | 1.4E+01 | ||||||||||
| Morşabi | 16.71 | 25.20 | 11.79 | 14.18 | 1.03 | 11.35 | 12.44 | 21.41 | 4.74 | 3.91 | 3.10 | 0.72 | 2.0E−15 | 9.9E−08 | 7.0E−23 | 1.3E−04 | 2.3E−12 | 6.3E−33 | 2.5E+00 | ||||||||||
| Müşgüle | 3.52 | 45.55 | 1.39 | 1.35 | 3.46 | 2.58 | 1.03 | 4.04 | 8.30 | 1.14 | 4.26 | 9.72 | 6.87 | 6.8E−06 | 8.3E−03 | 1.1E−24 | 2.7E−30 | 4.2E−15 | 2.0E−20 | ||||||||||
| Nuniye | 5.96 | 43.27 | 3.43 | 5.79 | 0.47 | 2.81 | 4.31 | 11.17 | 9.56 | 2.80 | 5.34 | 3.45 | 2.90 | 2.19 | 2.0E−11 | 9.6E−16 | 2.4E−25 | 1.8E−25 | 1.2E−11 | ||||||||||
| Royal | 0.88 | 61.05 | 0.25 | 0.13 | 7.33 | 1.37 | 0.00 | 1.60 | 15.42 | 4.54 | 9.78 | 15.73 | 12.92 | 1.16 | 4.57 | 1.9E−30 | 4.1E−36 | 1.5E−09 | 5.9E−27 | ||||||||||
| Sultani çekirdeksiz | 25.97 | 25.61 | 20.30 | 24.62 | 4.16 | 18.46 | 21.90 | 34.32 | 10.32 | 10.85 | 8.98 | 0.65 | 1.74 | 14.85 | 7.07 | 22.52 | 1.3E−08 | 1.9E−39 | 4.2E+00 | ||||||||||
| Yalova incisi | 40.00 | 10.88 | 31.97 | 34.64 | 10.64 | 31.57 | 32.43 | 44.52 | 7.86 | 14.72 | 9.53 | 5.75 | 5.06 | 22.31 | 15.60 | 33.21 | 3.26 | 1.1E−42 | 2.1E−09 | ||||||||||
| Yerli beyaz | 5.59 | 73.92 | 5.66 | 2.51 | 19.68 | 9.04 | 3.86 | 0.43 | 22.82 | 10.98 | 17.21 | 32.46 | 26.77 | 6.66 | 15.73 | 3.67 | 41.37 | 51.10 | 1.9E−36 | ||||||||||
| Yuvarlak çekirdeksiz | 21.21 | 24.72 | 15.88 | 19.24 | 2.26 | 14.73 | 17.00 | 27.74 | 7.11 | 7.07 | 5.67 | 0.28 | 0.46 | 10.62 | 4.70 | 17.55 | 0.41 | 3.61 | 33.97 | ||||||||||
Publisher’s Note: MDPI stays neutral with regard to jurisdictional claims in published maps and institutional affiliations. |
© 2021 by the authors. Licensee MDPI, Basel, Switzerland. This article is an open access article distributed under the terms and conditions of the Creative Commons Attribution (CC BY) license (https://creativecommons.org/licenses/by/4.0/).
Share and Cite
Kupe, M.; Sayıncı, B.; Demir, B.; Ercisli, S.; Baron, M.; Sochor, J. Morphological Characteristics of Grapevine Cultivars and Closed Contour Analysis with Elliptic Fourier Descriptors. Plants 2021, 10, 1350. https://doi.org/10.3390/plants10071350
Kupe M, Sayıncı B, Demir B, Ercisli S, Baron M, Sochor J. Morphological Characteristics of Grapevine Cultivars and Closed Contour Analysis with Elliptic Fourier Descriptors. Plants. 2021; 10(7):1350. https://doi.org/10.3390/plants10071350
Chicago/Turabian StyleKupe, Muhammed, Bahadır Sayıncı, Bunyamin Demir, Sezai Ercisli, Mojmir Baron, and Jiri Sochor. 2021. "Morphological Characteristics of Grapevine Cultivars and Closed Contour Analysis with Elliptic Fourier Descriptors" Plants 10, no. 7: 1350. https://doi.org/10.3390/plants10071350
APA StyleKupe, M., Sayıncı, B., Demir, B., Ercisli, S., Baron, M., & Sochor, J. (2021). Morphological Characteristics of Grapevine Cultivars and Closed Contour Analysis with Elliptic Fourier Descriptors. Plants, 10(7), 1350. https://doi.org/10.3390/plants10071350