Article

Comparative Analysis of Chloroplast Genomes of Four Medicinal Capparaceae Species: Genome Structures, Phylogenetic Relationships and Adaptive Evolution

by
Dhafer A. Alzahrani
1,*,
Enas J. Albokhari
1,2,*,
Samaila S. Yaradua
1 and
Abidina Abba
1
1
Department of Biological Sciences, Faculty of Sciences, King Abdulaziz University, P.O. Box 80203, Jeddah 21589, Saudi Arabia
2
Department of Biological Sciences, Faculty of Applied Sciences, Umm Al-Qura University, Makkah 24351, Saudi Arabia
*
Authors to whom correspondence should be addressed.
Plants 2021, 10(6), 1229; https://doi.org/10.3390/plants10061229
Submission received: 4 March 2021 / Revised: 25 May 2021 / Accepted: 31 May 2021 / Published: 17 June 2021
(This article belongs to the Special Issue Genetics, Genomics and Biotechnology of Plant Cytoplasmic Organelles)

Abstract

:
This study presents for the first time the complete chloroplast genomes of four medicinal species in the Capparaceae family belonging to two different genera, Cadaba and Maerua (i.e., C. farinosa, C. glandulosa, M. crassifolia and M. oblongifolia), to investigate their evolutionary process and to infer their phylogenetic positions. The four species are considered important medicinal plants, and are used in the treatment of many diseases. In the genus Cadaba, the chloroplast genome ranges from 156,481 bp to 156,560 bp, while that of Maerua ranges from 155,685 bp to 155,436 bp. The chloroplast genome of C. farinosa, M. crassifolia and M. oblongifolia contains 138 genes, while that of C. glandulosa contains 137 genes, comprising 81 protein-coding genes, 31 tRNA genes and 4 rRNA genes. Out of the total genes, 116–117 are unique, while the remaining 19 are replicated in inverted repeat regions. The psbG gene, which encodes for subunit K of NADH dehydrogenase, is absent in C. glandulosa. A total of 249 microsatellites were found in the chloroplast genome of C. farinosa, 251 in C. glandulosa, 227 in M. crassifolia and 233 in M. oblongifolia, the majority of which are mononucleotides A/T found in the intergenic spacer. Comparative analysis revealed variable hotspot regions (atpF, rpoC2, rps19 and ycf1), which can be used as molecular markers for species authentication and as regions for inferring phylogenetic relationships among them, as well as for evolutionary studies. The monophyly of Capparaceae and other families under Brassicales, as well as the phylogenetic positions of the studied species, are highly supported by all the relationships in the phylogenetic tree. The cp genomes reported in this study will provide resources for studying the genetic diversity of Capparaceae, as well as resolving phylogenetic relationships within the family.

1. Introduction

The family Capparaceae, whose members are distributed in both arid and semi-arid areas, has about 470 morphologically diverse species in ca. 17 genera, which include Cadaba and Maerua [1,2,3]. Members of the family possess highly essential compounds used in folk medicine that are extracted from them [4]. The four species in question are considered important medicinal plants and are used in the treatment of many diseases. Most Cadaba species contain important compounds, such as alkaloids, sesquiterpene lactones and cadabicine. Cadaba farinosa and Cadaba glandulosa are used as purgative, anthelmintic, antisyphilitic, emmenagogue, aperient, antiscorbutic, and antiphlogistic substances; for liver damage and cancer, dysentery, fever and body pain; in therapy as a hepatoprotective and hypoglycemic [5,6]. Maerua crassifolia and Maerua oblongifolia species are used in the treatment of fever, stomach troubles, skin infections, diabetes mellitus, epilepsy and abdominal colic; they demonstrate antimicrobial and antioxidant properties and are used for hypocholesterolemia, wound-healing, intestinal disorders like abdominal cramps and hookworms, anthrax, severe mumps, tetanus and eye disease [5,7,8,9,10,11].
According to the taxonomic status of Capparaceae, Capparideae was placed under the cohort Parietales [12]. Later, Capparidaceae and Cruciferae were placed under suborder Capparidineae, order Rhoedales [13], and Capparidaceae was classified under Capparidales [14,15]. After some decades, Capparaceae was placed under Capparales [1,16], and finally under order Brassicales [17,18,19,20]. Previous studies, with the exception of Hutchinson [14], reported that Brassicaceae and Capparaceae are sister taxa [1,21,22,23,24,25,26,27,28,29,30]. The two families (Brassicaceae and Capparaceae) are considered as one family—Brassicaceae sensu lato (s.l.)—by some authors [17,18,31,32]. Phylogenetic relationship studies using genes from chloroplast and nuclear genomes [29,33] confirmed the monophyly of Brassicaceae and Capparaceae. Within Capparaceae, there are two subfamilies, Cleomoideae and Capparoideae; these subfamilies are elevated to family by some studies of Brassicales [14,34]. Currently, as adopted by the Angiosperm Phylogeny Group [19,20], Cleomaceae, Capparaceae and Brassicaceae are considered as a single family.
There has been some shifting of a few genera between the families Brassicaceae and Capparaceae, such as two genera, Dipterygium and Puccionia, previously belonging to Brassicaceae [14] being moved to Capparaceae under the subfamily Dipterigioideae, based on the presence of methyl-glucosinolate [35,36]. The genus Stixis L. was removed from the Capparaceae family and represents as a new family, which is called Stixaceae Doweld (including the genus Forchhammeria Lieb.), yet, it is still considered under Brassicaceae sensu lato, excluding Forchhammeria, as it is more closely related to Resedaceae than Brassicaceae [37].
Genetic information is a reliable means of understanding evolutionary relationships among species in various taxonomic hierarchies. The genetic information in the chloroplast genome contains sufficient information for comparison analysis and studies of species diversification, due to the presence of functional genes that have a vital role in plant cells [38]. The chloroplast organelle functions in carbon fixation and photosynthesis in plants [39]. The chloroplast genome is more conserved than other genomes found in plants. Generally, the chloroplast genome is circular, double-stranded and has a quadripartite structure, including a large single copy (LSC), as well as a small single copy (SSC) and a pair of repeats (IRa and IRb) [40]. The chloroplast genome is uniparentally inherited, and this characteristic makes it highly conserved in structure and gene content [41,42]. However, different kinds of mutations do occur [43], which consequently lead to sequence divergence among species and could be used to study evolutionary relationships in plants [44]. Despite the importance of the plastome in modern taxonomy, chloroplast genomes of only three species in the whole Capparaceae family, including three varieties, have been reported: Capparis spinosa [45], Capparis spinosa var. spinosa, Capparis spinosa var. herbacea, Capparis spinosa var. ovata [46] and Capparis decidua.
This study obtained the first complete chloroplast genome of the genus Cadaba (Cadaba farinosa and Cadaba glandulosa) and genus Maerua (Maerua crassifolia and Maerua oblongifolia) using Illumina sequencing technology. This study also analyzed and compared the features of the cp genomes to provide resources of genetic data for the four species. We reconstructed the phylogenetic relationship between Capparaceae, Cleomaceae and Brassicaceae to infer the phylogenetic positions of the species within the families.

2. Results

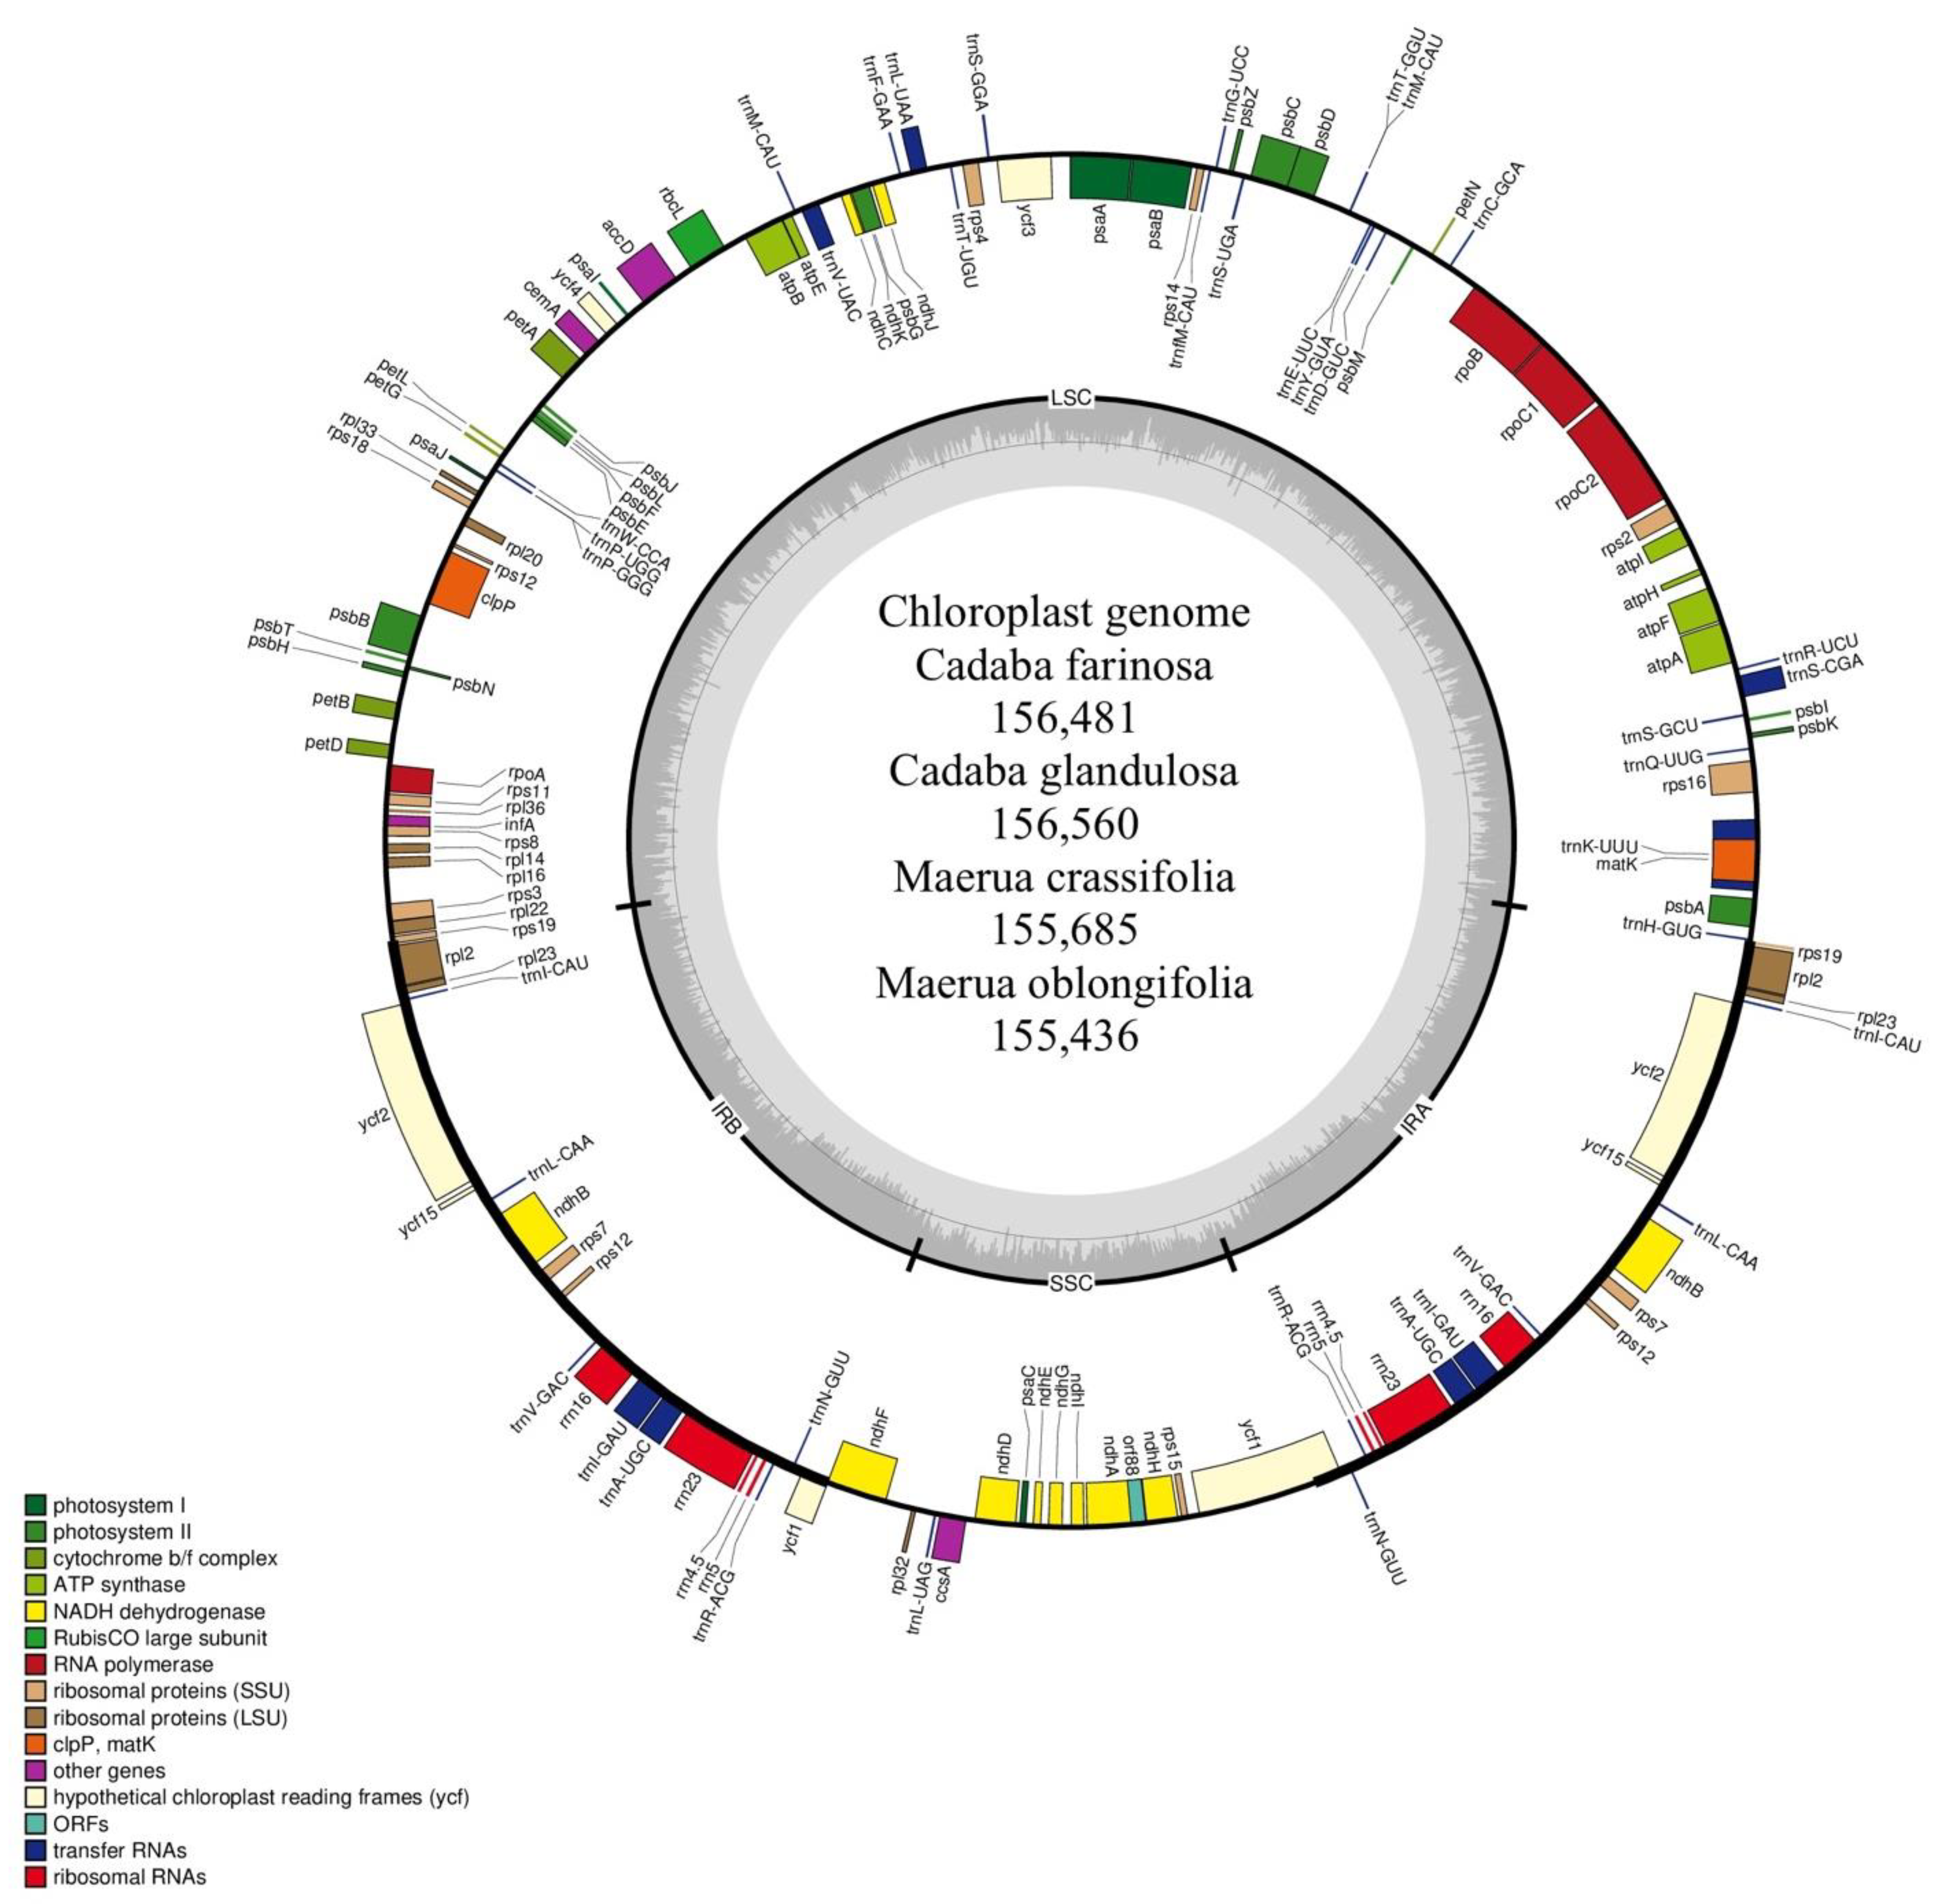
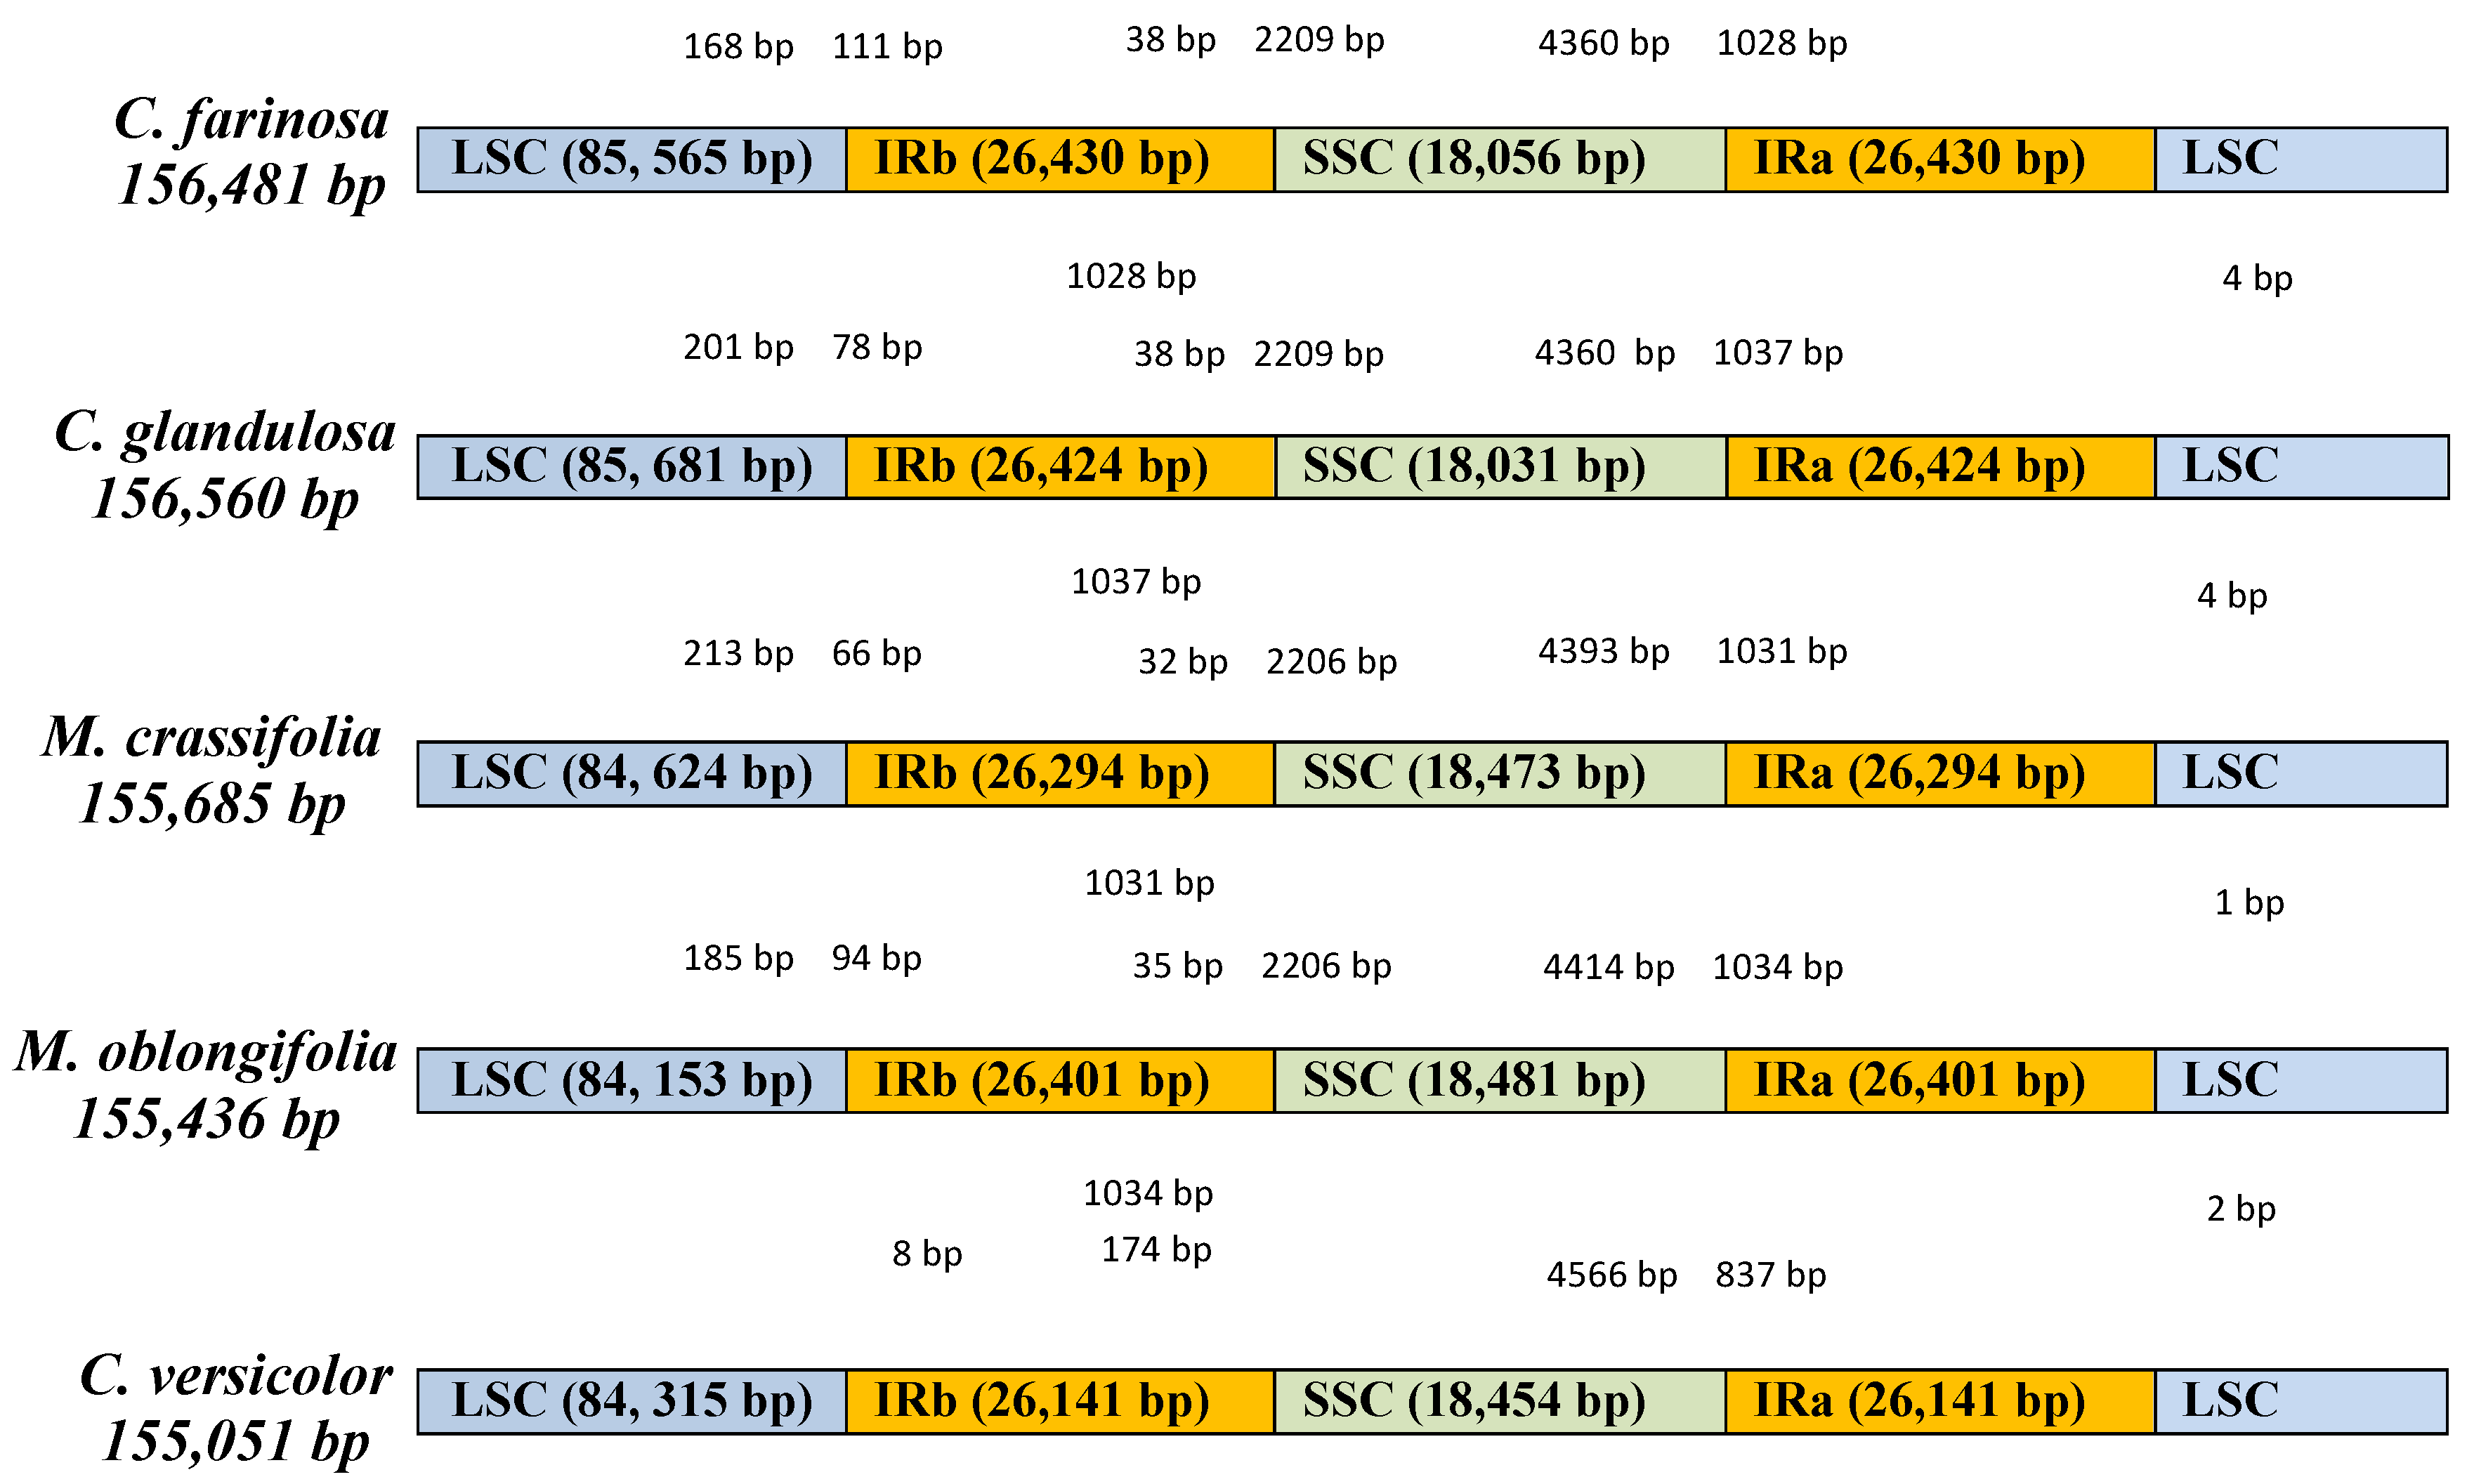
2.1. Characteristics of Four Chloroplast Genomes
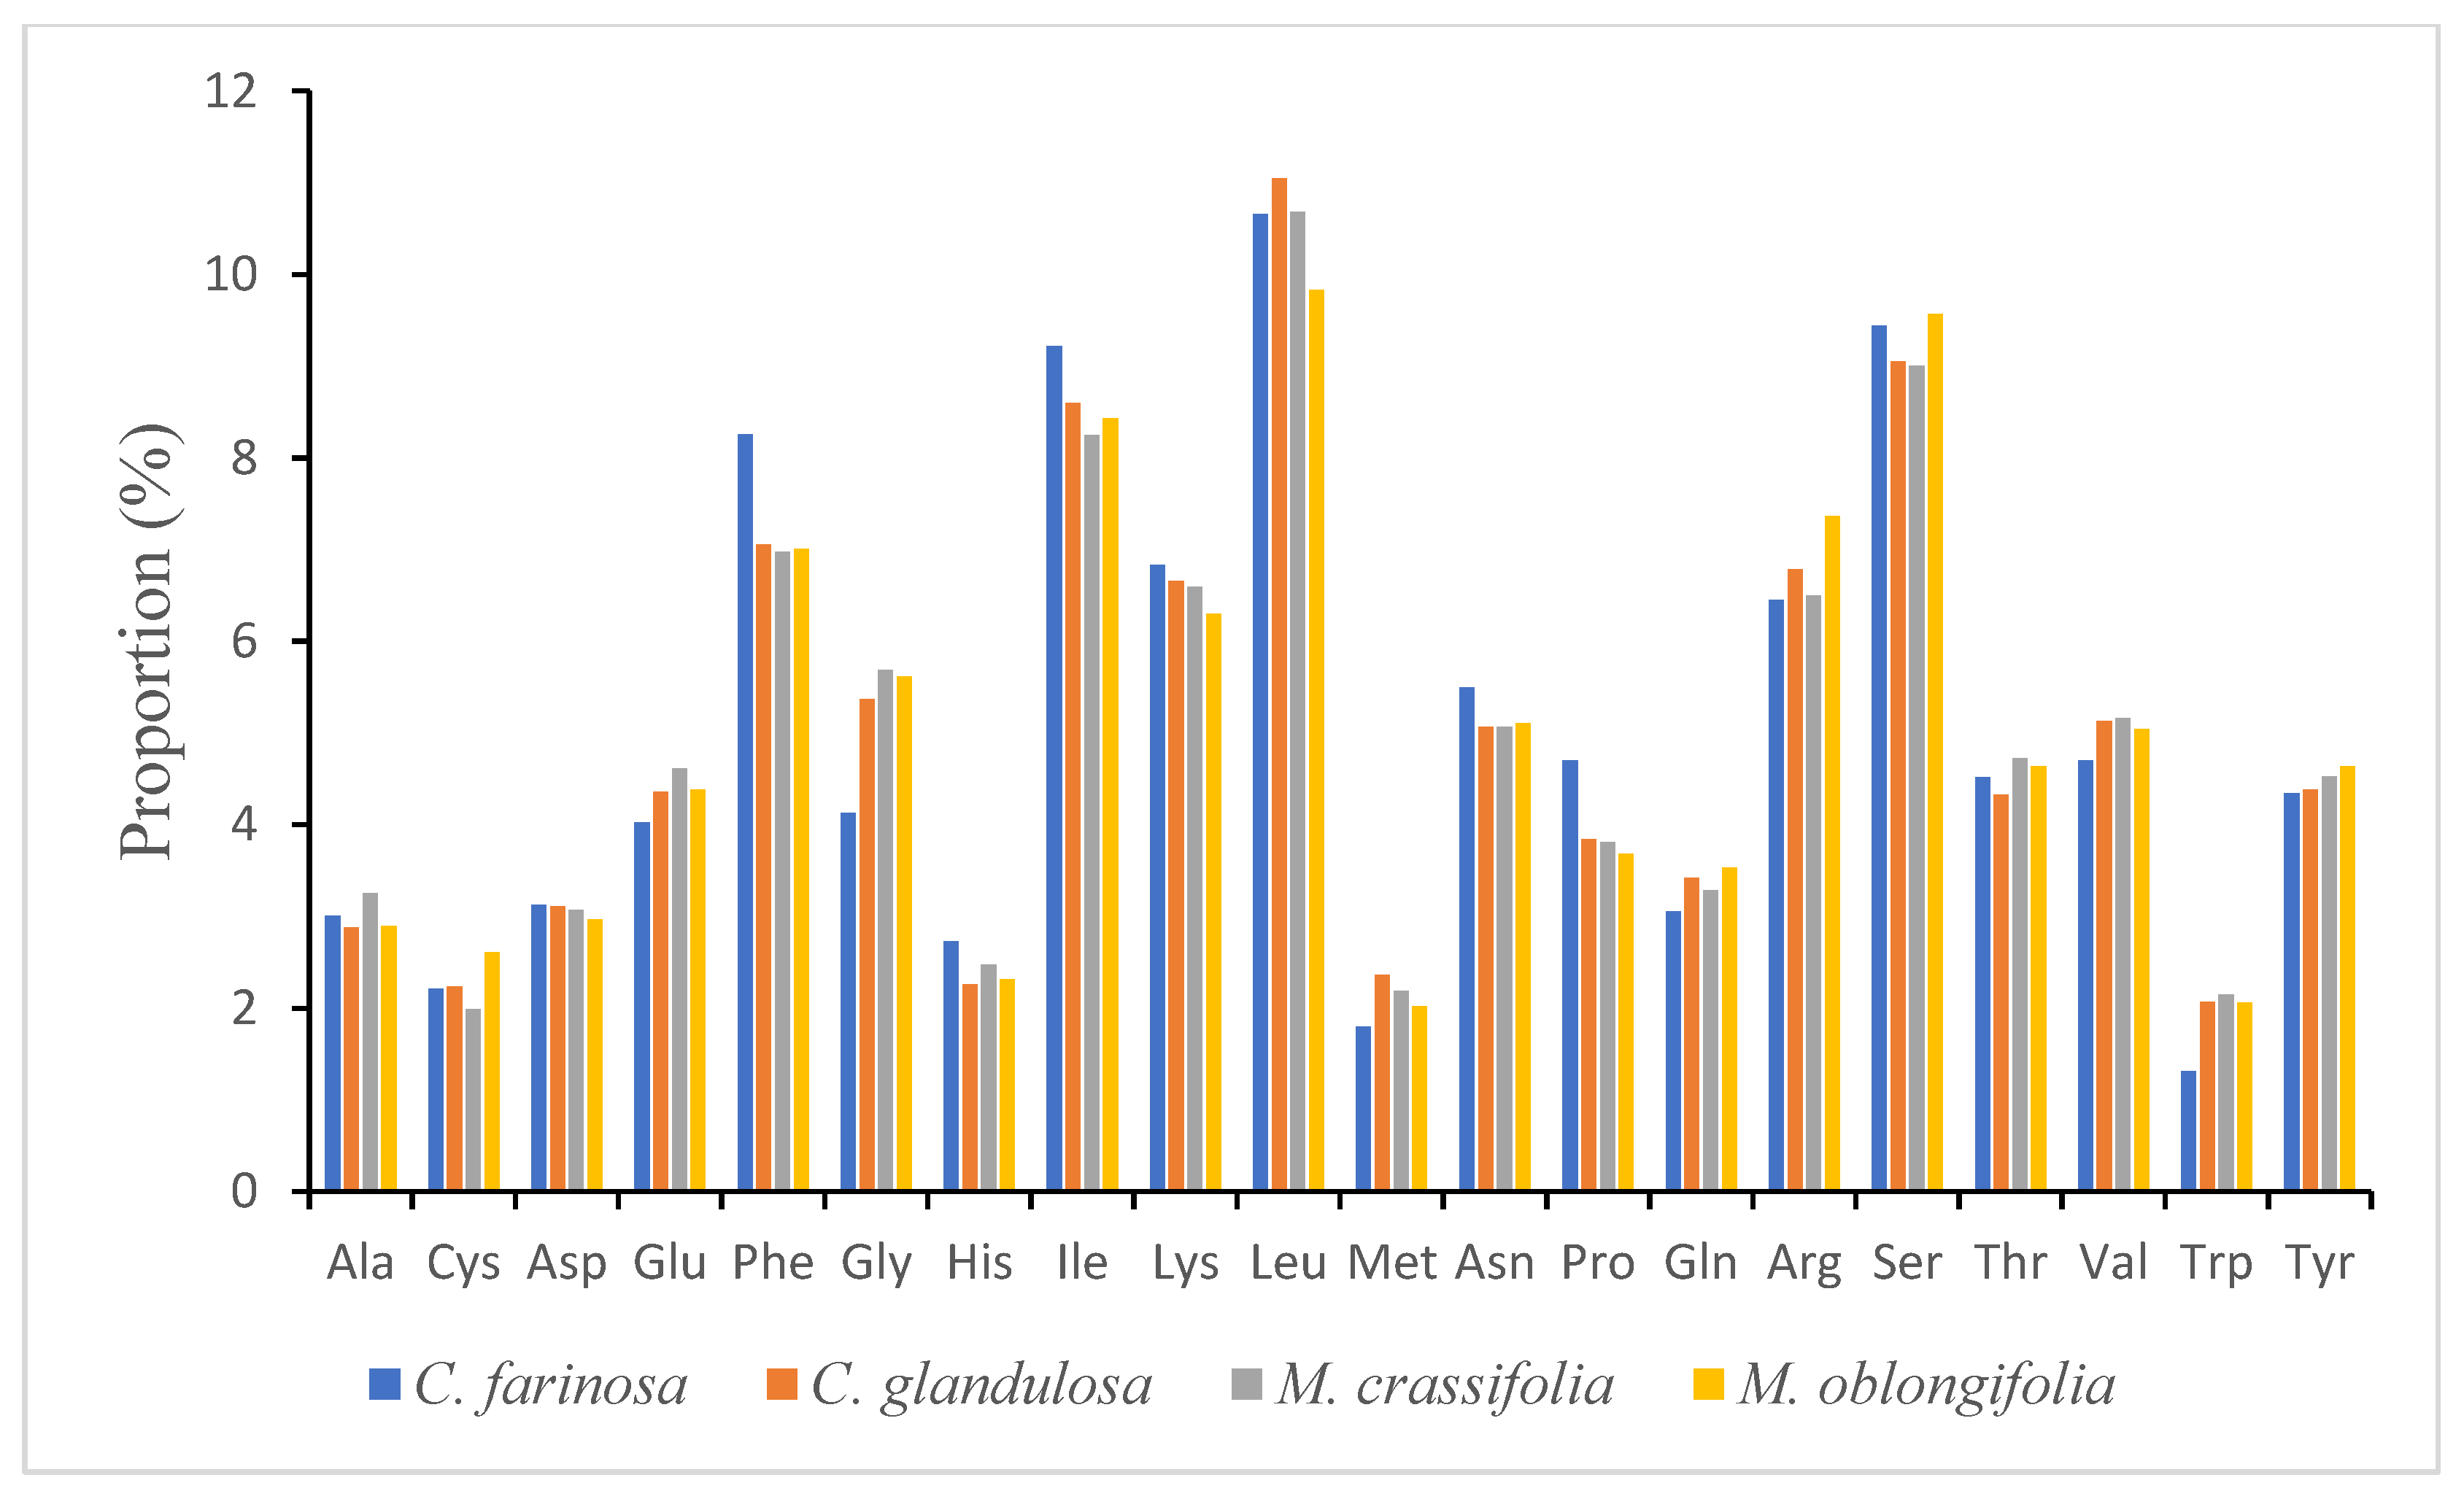
Previous studies have shown that the plastomes of flowering plants are greatly conserved in structural organization and gene content, but contraction and expansion do occur [47,48]. Each complete chloroplast genome of C. farinosa, C. glandulosa, M. crassifolia and M. oblongifolia has a circular and quadripartite structure. The genome of C. farinosa, C. glandulosa, M. crassifolia and M. oblongifolia ranged from 156,560 bp (C. glandulosa) to 155,436 bp (M. oblongifolia); the coding region ranged from 78,080 bp (C. farinosa) to 76,614 bp (C. glandulosa), corresponding to 49.89% and 48.93% of the total genome length. The LSC regions ranged from 85,681 bp (C. glandulosa) to 84,153 bp (M. oblongifolia) in size, whereas the SSC ranged from 18,481 bp (M. oblongifolia) to 18,031 bp (C. glandulosa); the pair of inverted repeats are separated by the small single copy region and ranged from 26,430 bp (C. farinosa) to 26,294 bp (M. crassifolia) (Table 1 and Figure 1). These four Capparaceae chloroplast genome sequences were deposited in GenBank (accession numbers: C. farinosa, MN603027; C. glandulosa, MN603028; M. crassifolia, MN603029 and M. oblongifolia, MN603030).
In the four species, the plastomes are well conserved in gene order and number of genes, with slight variation in the presence of the psbG gene, which is absent in C. glandulosa. The result of the gene annotation revealed a total of 137 in C. glandulosa and 138 genes in C. farinosa, M. crassifolia and M. oblongifolia, among which 116–117 are situated in the SSC and the LSC copy regions, and 19 genes are located in the IRa and IRb. The plastome contained 80 protein-coding genes in C. glandulosa and 81 in other species, four rRNA genes and 31 tRNA genes (Figure 1 and Table 2). Eight protein-coding genes, four rRNA and seven tRNA were found in the IR regions. In the C. glandulosa species, the LSC region contained 61 protein-coding genes, whereas it included 62 in other species and 23 tRNA genes; the remaining 12 protein-coding genes and 1 tRNA are situated in the SSC region.
Some protein-coding genes and tRNA genes in the chloroplast genome of angiosperms contain an intron [49,50], as is found in the plastomes of the four species (C. farinosa, C. glandulosa, M. crassifolia and M. oblongifolia). In the total genes of the cp genomes (out of the total genes in all chloroplast genomes), 13 genes in C. glandulosa and M. crassifolia and 14 genes in C. farinosa and M. oblongifolia include an intron; some genes are protein-coding genes (nine in C. farinosa and M. oblongifolia and eight in C. glandulosa and M. crassifolia) while the remaining five are tRNA genes. Four genes (rpl2, ndhB, trnI-GAU and trnA-UGC) that have introns are situated in the inverted repeat region, ndhA is located in the SSC region and the remainder is found in the LSC region. All genes have only one intron and only two genes, namely ycf3 and clpP, have two introns. The gene trnK-UUU has the longest intron of 2542–2571 bp; this is a result of the matK gene being located within the intron of the gene.

2.2. Codon Usage

One of the factors shaping the evolution of the chloroplast genome is codon usage, which occurs as a result of bias in mutation [51]. The codon usage bias in the plastome was computed using the protein-coding genes and tRNA gene nucleotide sequences—104,575 bp, 106,488 bp, 105,750 bp and 99,100 bp for C. farinosa, C. glandulosa, M. crassifolia and M. oblongifolia, respectively. Supplementary Tables S1–S4 present the relative synonymous codon usage (RSCU) of each codon in the genome; these results suggested that all the genes are encoded by 33,686 codons in C. farinosa, 34,303 codons in C. glandulosa, 34,064 codons in M. crassifolia and 31,920 codons in M. oblongifolia. The most frequently occurring codons are for the amino acids leucine 3290 (9.76%), 3599 (10.49%), 3452 (10.13%) and 2951 (9.24%), respectively (Figure 2), which have been found in other flowering plant genomes [52], whereas methionine has the fewest codons in the genome at 620 (1.84%) in C. farinosa and 606 (1.89%) in M. oblongifolia, and for tryptophan it is 674 (1.96%) in C. glandulosa and 695 (2.04%) in M. crassifolia. A- and T- endings were discovered to be less frequent than their counterparts G- and C-. The codon usage bias is low in the cp genomes of Capparaceae species (Tables S1–S4). Additionally, the results show that the RSCU values of 27 codons were >1, all with A/T- endings, whereas the other 28 codons were <1, and all ended with G/C. The RSCU values of tryptophan and methionine amino acids are 1, so they are the only amino acids with no codon bias.

2.3. RNA Editing Sites

RNA editing features a set of processes that comprise of insertion, deletion or modifications of nucleotides that alter the DNA-encoded sequence [53], which represents a way to create transcript and protein diversity [54]. Some chloroplast RNA editing sites are preserved in plants [55]. The RNA editing sites in the C. farinosa, C. glandulosa, M. crassifolia and M. oblongifolia chloroplast genomes were predicted using the PREP suite program; the first codon position of the first nucleotide was used in all of the analyses. The results show that conversion of the amino acid serine into leucine was the majority of the conversions in the codon positions (Tables S5–S8). This conversion is found to occur more frequently [56]. In total, 48 editing sites in the genus Maerua and 50 in the genus Cadaba were revealed by the program. Twenty protein-coding genes in C. farinosa and 19 protein-coding genes in C. glandulosa, M. crassifolia and M. oblongifolia were distributed across the editing sites. As stated in previous studies [57,58,59], the ndhB genes have the largest number of editing sites (nine sites), followed by ndhD (nine sites in C. farinosa and M. oblongifolia and eight sites in C. glandulosa and M. crassifolia), while accD, atpF, ccsA, clpP, PsaI, psbG, psbF, rpoA, rpl20, rps2 and rps16 have at least one site each. Certain RNA sites, amidst all the conversions in the RNA editing (modification) sites, changed the amino acid from proline to serine. RNA-predicting sites in the first codon of the first nucleotides are not present in the following genes: atpA, atpB, atpI, ccsA (only in C. glandulosa), petB, petD, petG, petL, psaB, psbB, psbL, rpl2, rpl20 (except in M. oblongifolia), rpl23, rps8 and ycf3, among others. This result indicated that the preservation of RNA editing is fundamental [60,61].

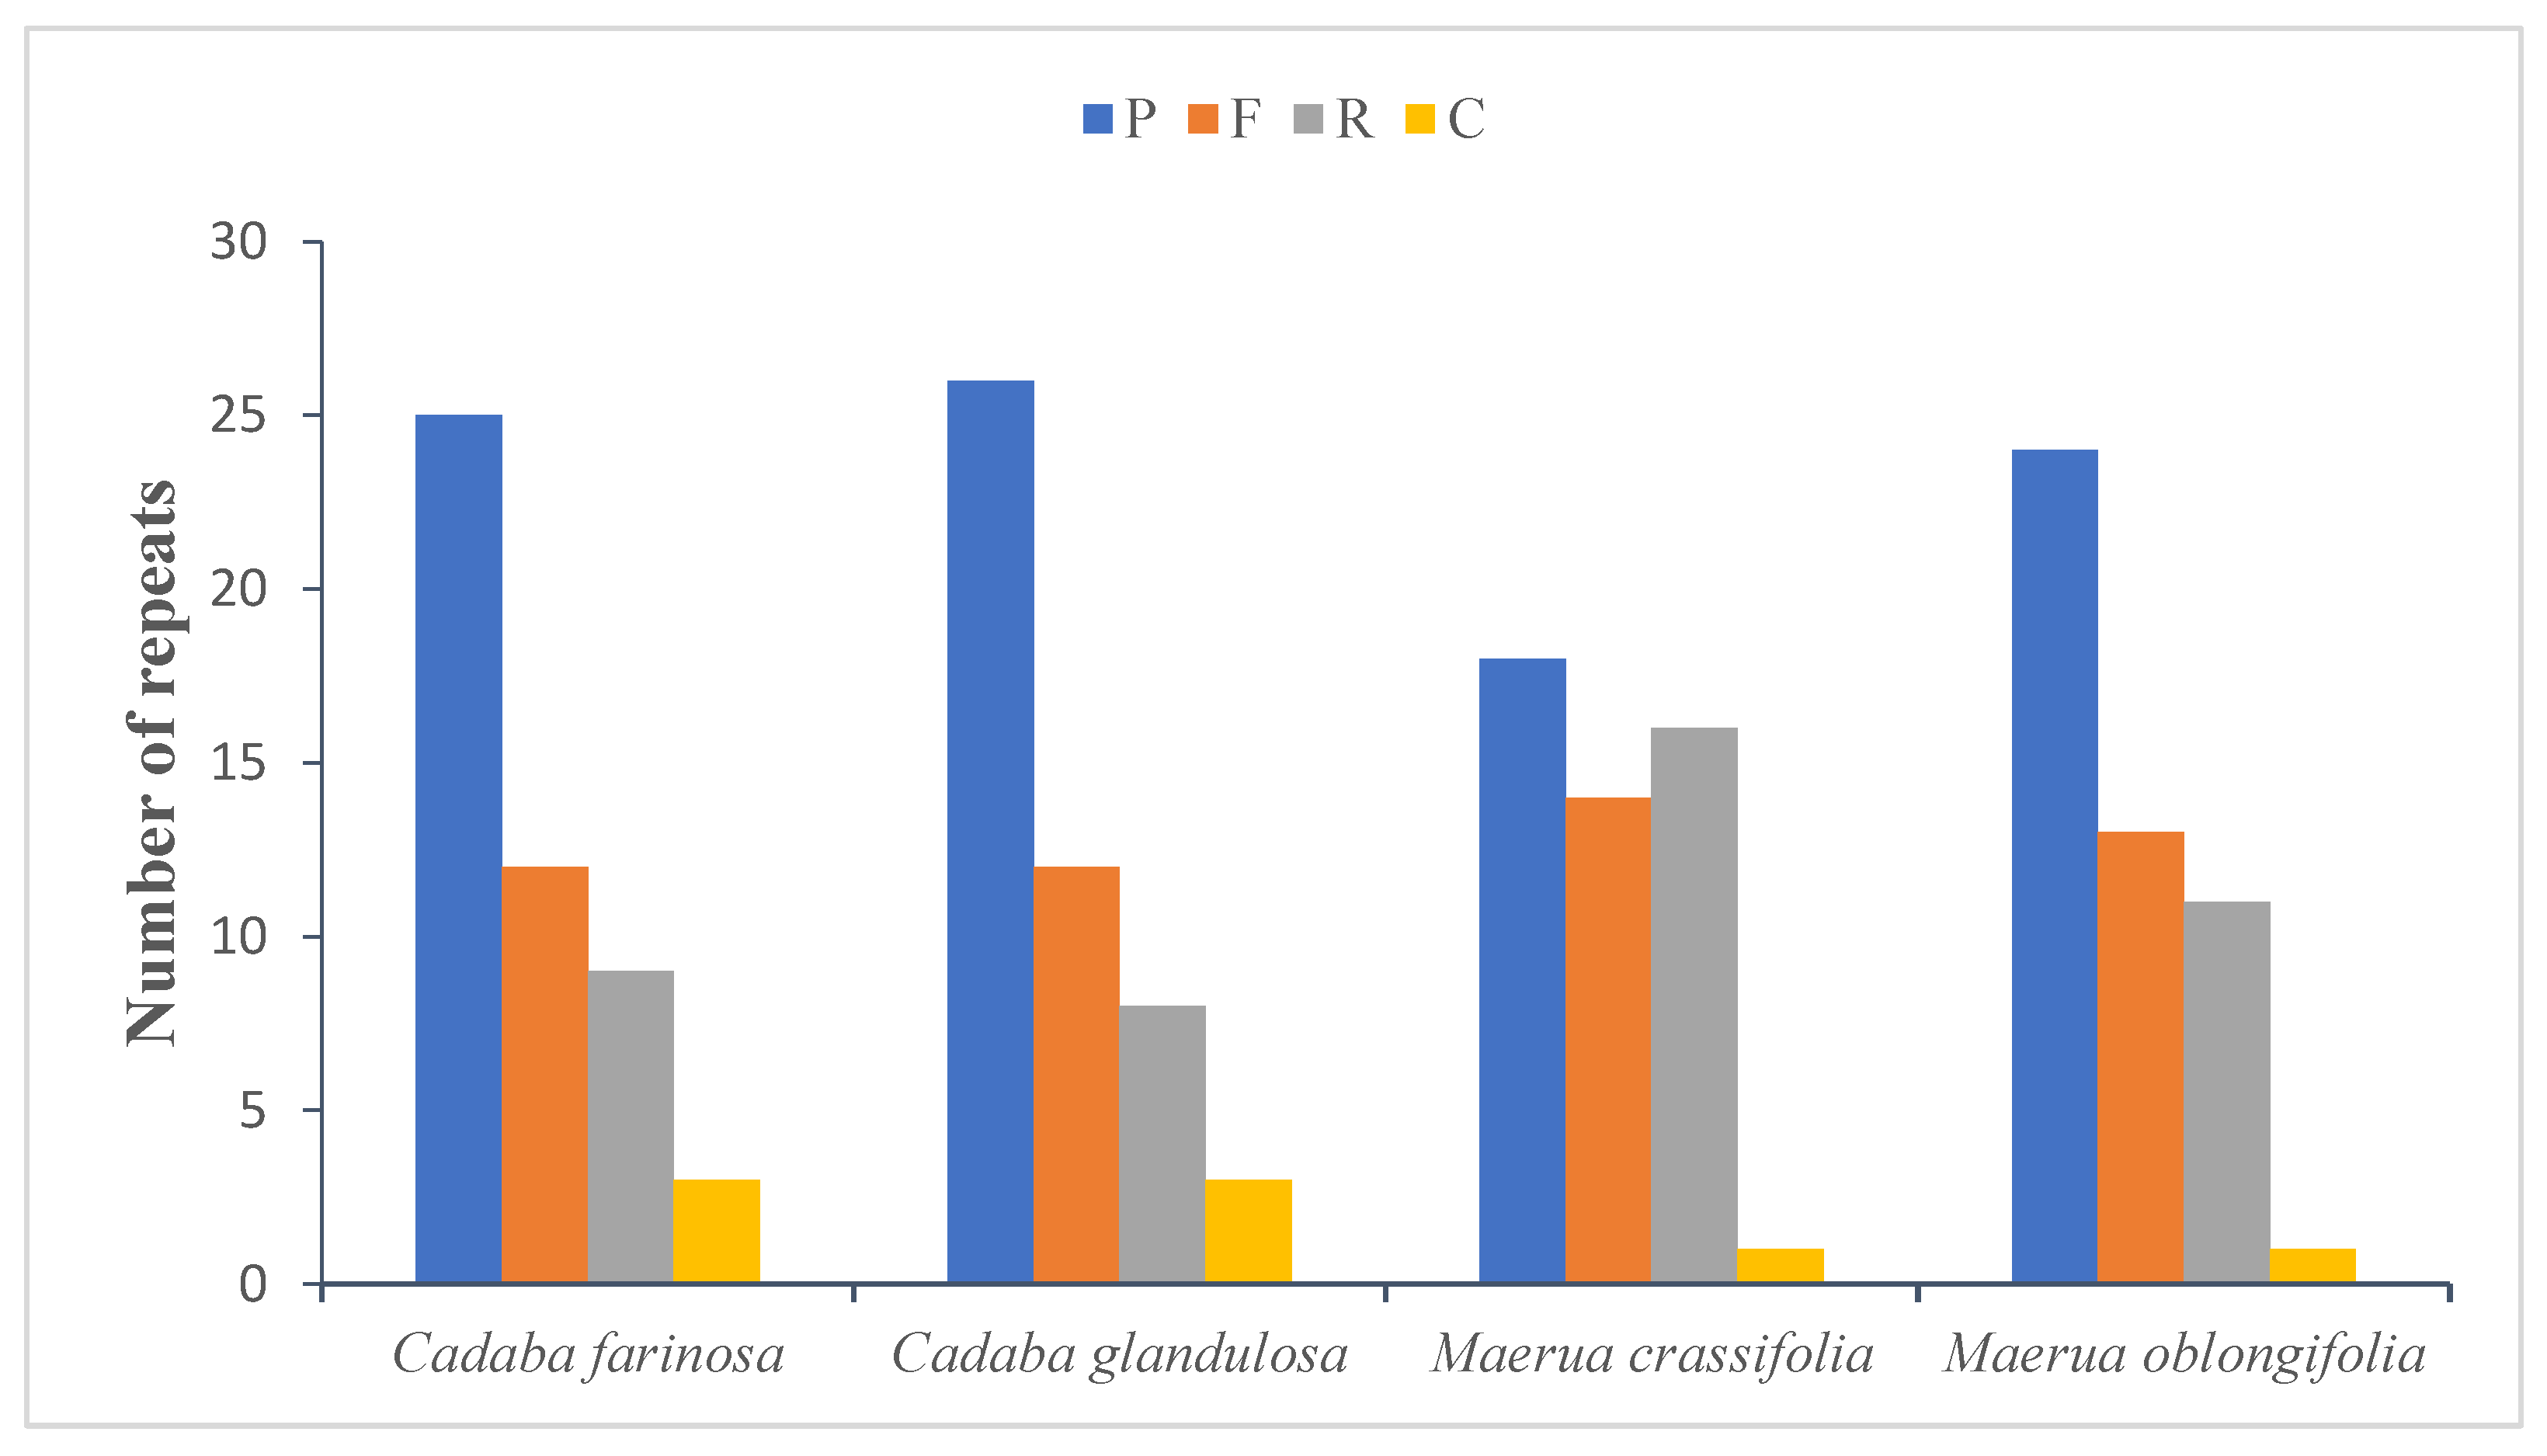
2.4. Repeat Analysis

2.4.1. Long Repeats

Repeat sequences in the chloroplast genomes of the four Capparaceae species were determined by the REPuter program with default settings; the obtained results clearly show that forward, reverse, palindrome and complemented repeats were detected in the cp genomes (Figure 3). The long repeat analysis in C. farinosa, C. glandulosa, M. crassifolia and M. oblongifolia showed 25–26–18–24 palindromic repeats, 12–12–14–13 forward repeats, 9–8–16–11 reverse repeats and 3–3–1–1 complement repeats, respectively (Figure 3 and Tables S9–S12). For the majority of the repeats, their sizes are: In C. farinosa—20–29 bp (69.38%), followed by 10–19 bp (22.44%), followed by 30–39 bp (4.08%), whereas 40–49 bp and 60–69 bp are the least common, at 2.04%. In C. glandulosa—20–29 bp (87.75%), followed by 30–39 bp (6.12%), whereas 10–19 bp, 40–49 bp and 60–69 bp are the least common, at 2.04%. In M. crassifolia—20–29 bp (48.97%), followed by 10–19 bp (38.77%), with 50–59 bp and 40–49 bp being the least common, at 6.12% and 4.08%, respectively, whereas 30–39 bp was at 2.04%. In M. oblongifolia—20–29 bp (65.30%), followed by 10–19 bp (26.53%), followed by 50–59 bp (4.08%), whereas 30–39 bp and 40–49 bp are the least common, at 2.04%. In total, there are 49 repeats in the chloroplast genomes of the four species. In the first location, the codon region harbored 42.85% of the repeats in C. farinosa, M. crassifolia and M. oblongifolia and 34.69% in C. glandulosa; tRNA contained 7 repeats (14.28%) in C. farinosa, 8 repeats (16.32%) in C. glandulosa, 9 repeats (18.36%) in M. crassifolia and 10 repeats (20.40%) in M. oblongifolia; the remainder of the repeats are located in the protein-coding genes—7 repeats (14.28%) in C. farinosa and C. glandulosa, 6 repeats (12.24%) in M. crassifolia and 12 repeats (24.48%) in M. oblongifolia. The length of repeated sequences in the four Capparaceae chloroplast genomes ranged from 10 to 59 bp, analogous to the lengths in other angiosperm plants [62,63,64].

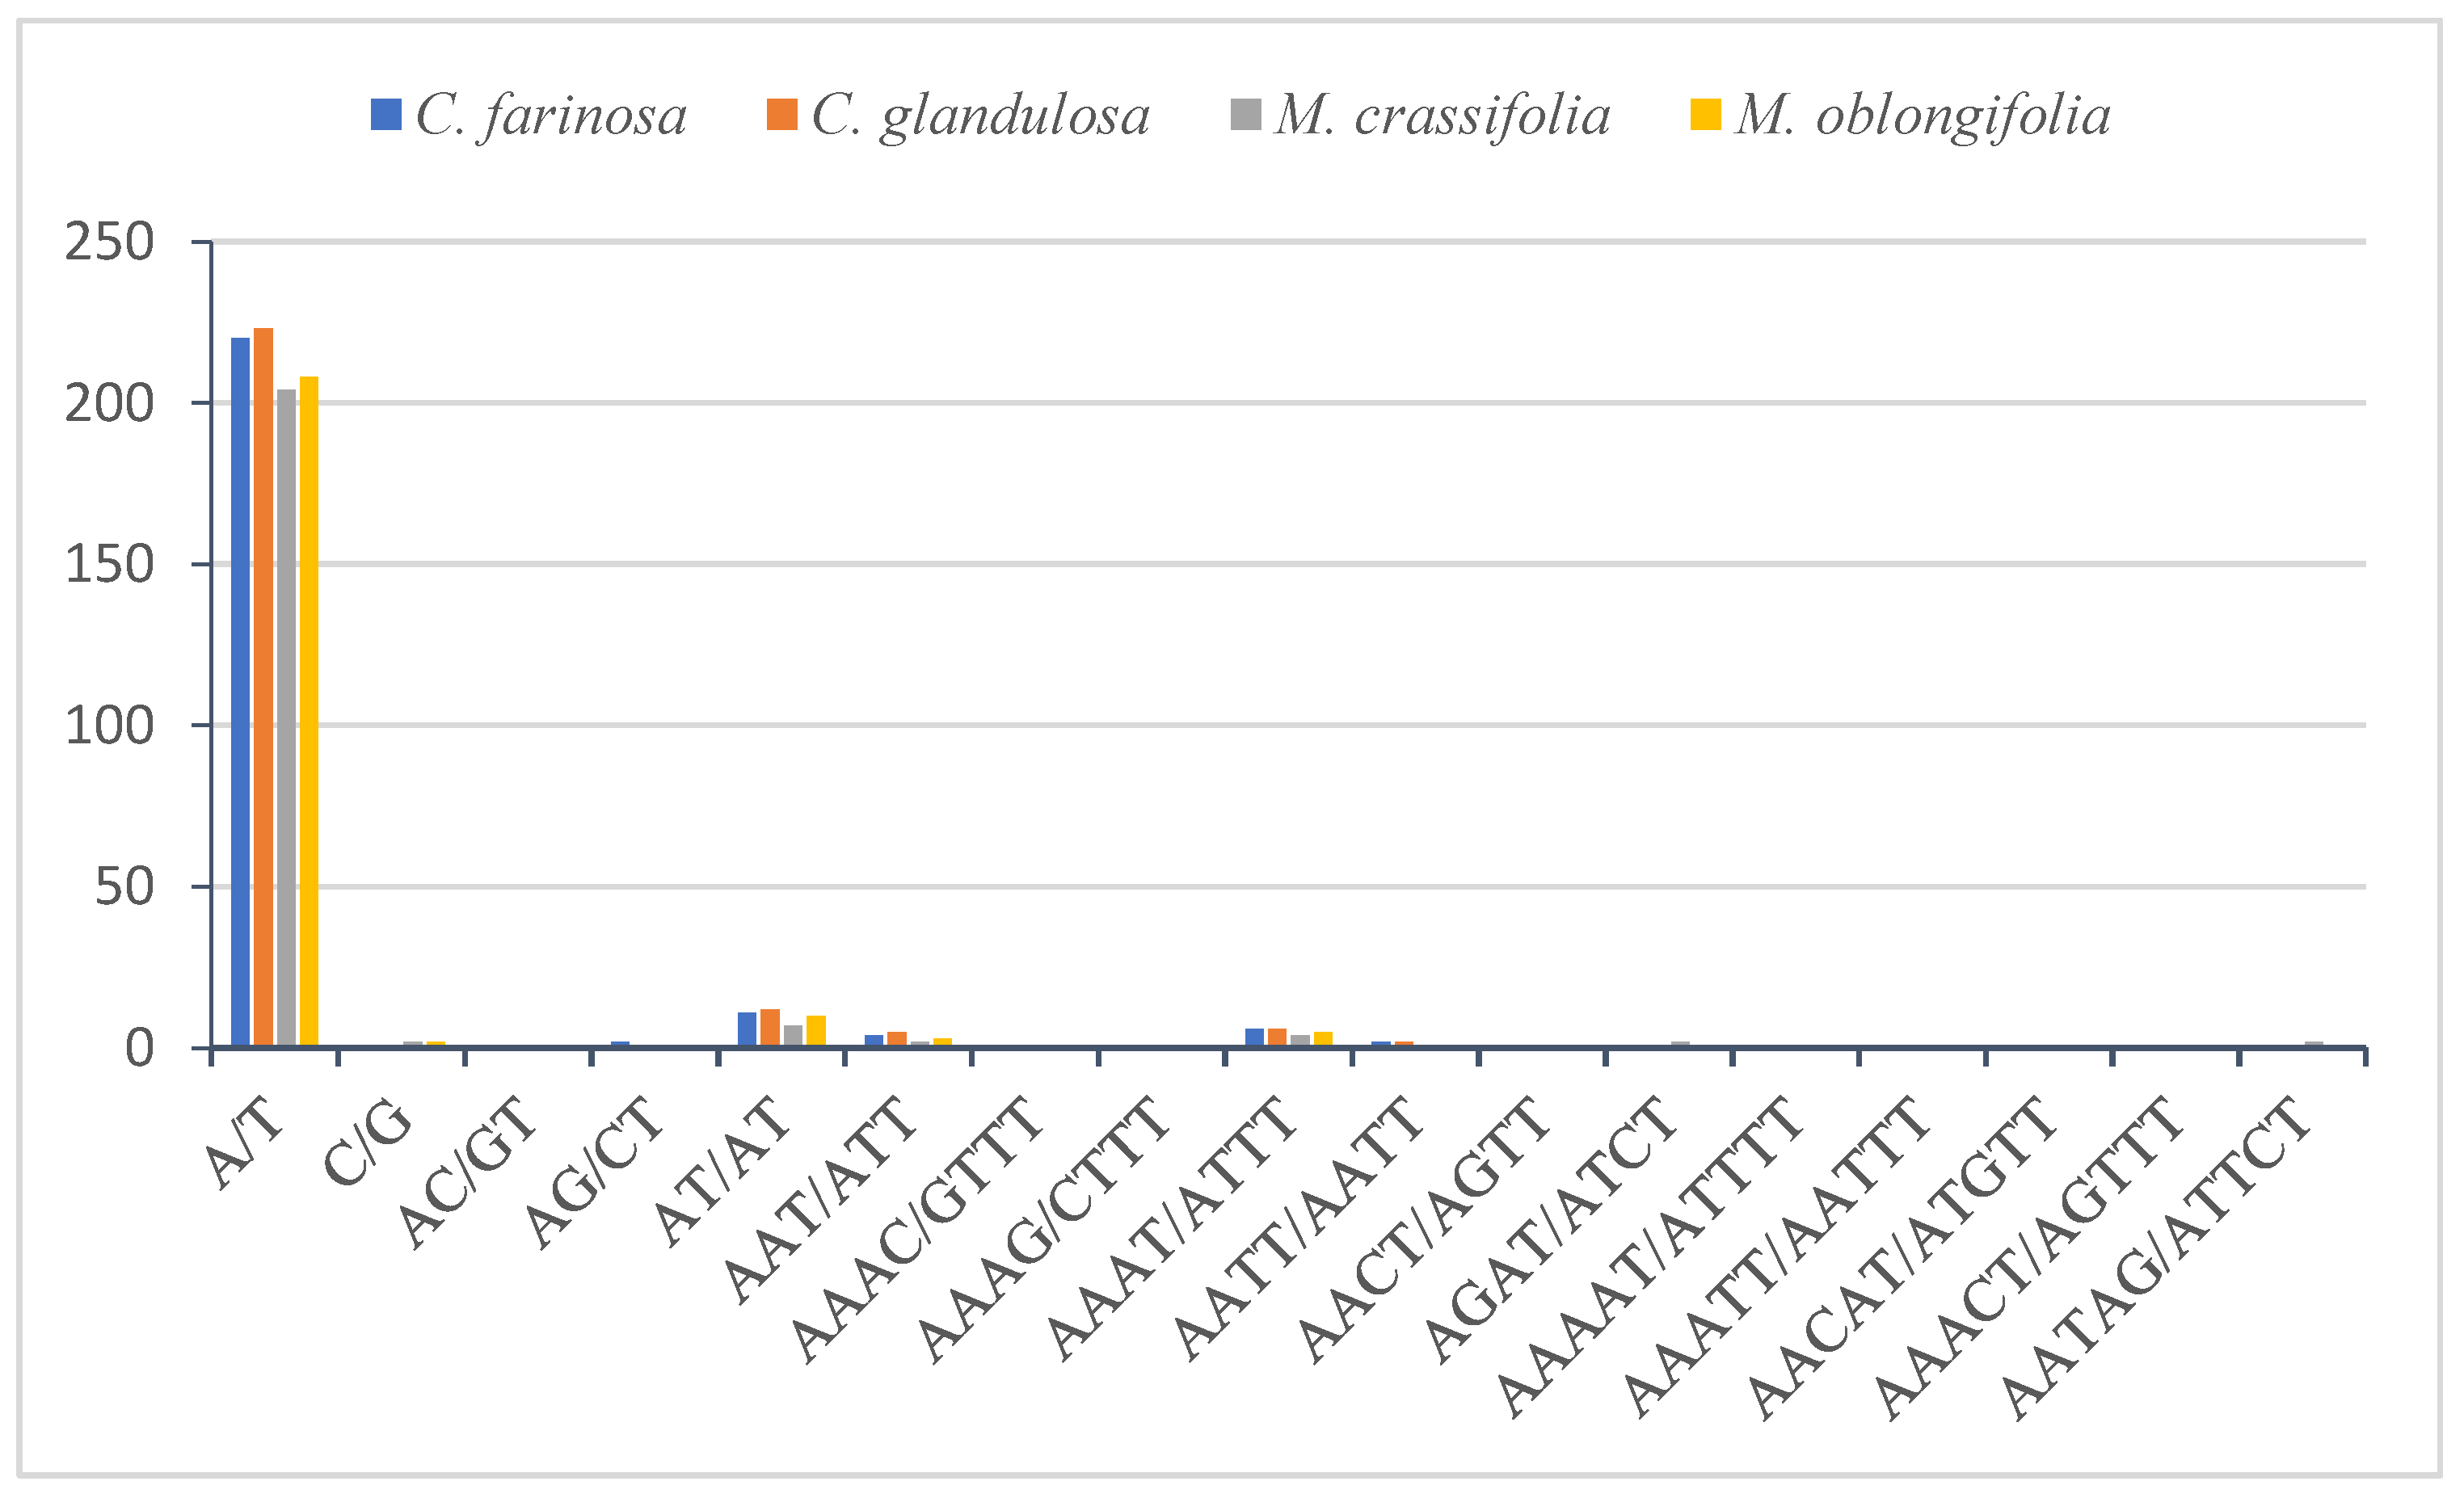
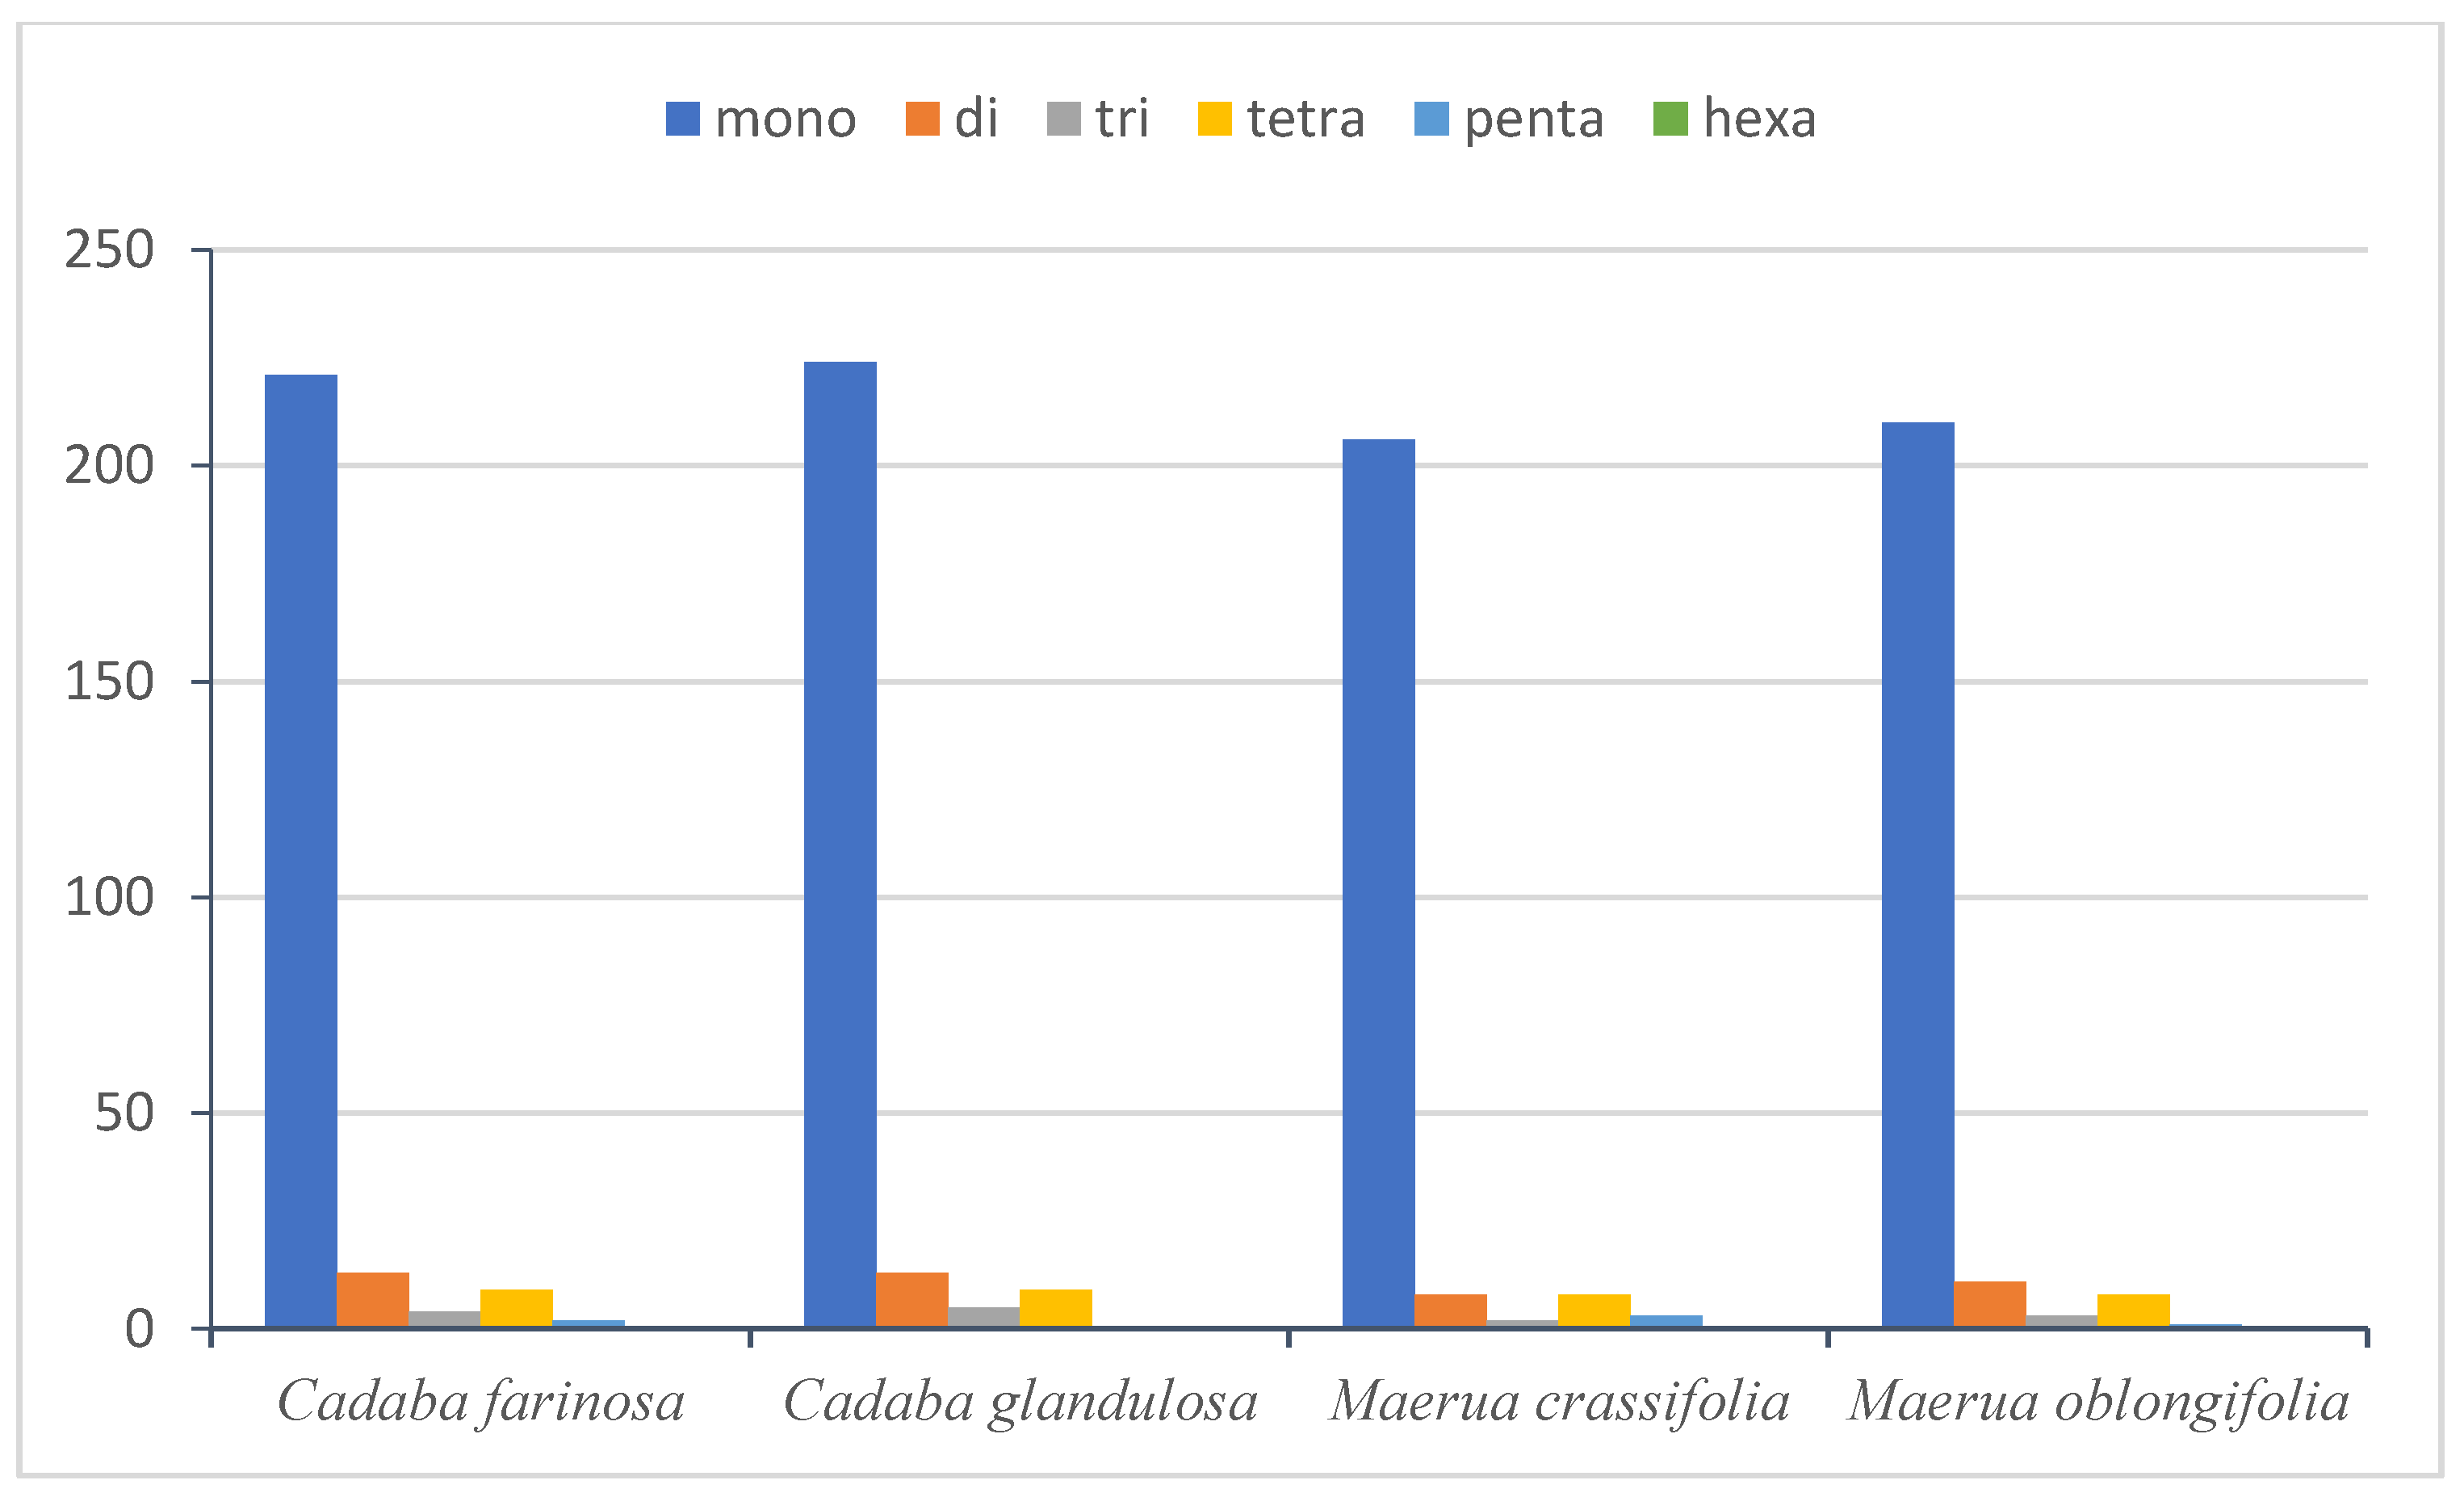
2.4.2. Simple Sequence Repeats (SSRs)

The SSRs or microsatellites are a group of short repeat sequences of nucleotide series (1–6 bp), which are used as a tool to facilitate the assessment of molecular diversity [65]. The genetic variation within and among species with the valuable molecular marker of the SSRs is extremely important for studying genetic heterogeneity and contributes to species recognition [66,67,68]. In this study, there are 249 microsatellites found in the plastid genome of C. farinosa, in C. glandulosa there are 251, in M. crassifolia there are 227 and in M. oblongifolia there are 233 (Table 3). The majority of SSRs in the cp genome in C. farinosa, C. glandulosa, M. crassifolia and M. oblongifolia are mononucleotide (88.75%, 89.24%, 90.74% and 90.12%, respectively), of which most are poly T and A (Figure 4). Polythymine (poly T) constituted 50.60%, 52.19%, 51.98% and 52.78%, respectively, whereas polyadenine (poly A) constituted 37.75%, 36.65%, 37.88% and 36.48%, respectively. Only a single polycytosine (poly C) (0.40% and 0.42%) was present in C. farinosa and M. oblongifolia, whereas two (0.88%) were present in M. crassifolia, and only a single polyguanine (poly G) (0.39% and 0.42%) was present in C. glandulosa and M. oblongifolia. Among the dinucleotides, AT/AT, AC/GT and AG/CT were found in all genomes. Reflecting series complementary, only one trinucleotide, AAT/ATT, six tetranucleotides, AAAC/GTTT, AAAG/CTTT, AAAT/ATTT, AATT/AATT, AACT/AGTT and AGAT/ATCT, and five pentanucleotides, AAAAT/ATTTT, AAATT/AATTT, AACAT/ATGTT, AAACT/AGTTT and AATAG/ATTCT, were discovered in the genome, while no hexanucleotide repeat was present (Figure 4). A high richness in mononucleotides poly A and T has been observed in most flowering plants’ cp genomes [62].
The comparison of simple sequence repeats between the chloroplast genomes of the four Capparaceae species (Figure 5) indicated that the more frequent occurrences are the mononucleotide repeats in all the genomes. The largest number of mononucleotides in C. glandulosa was 224, while it did not possess a pentanucleotide, like the remaining three species. Hexanucleotide was not present in any of the four species.

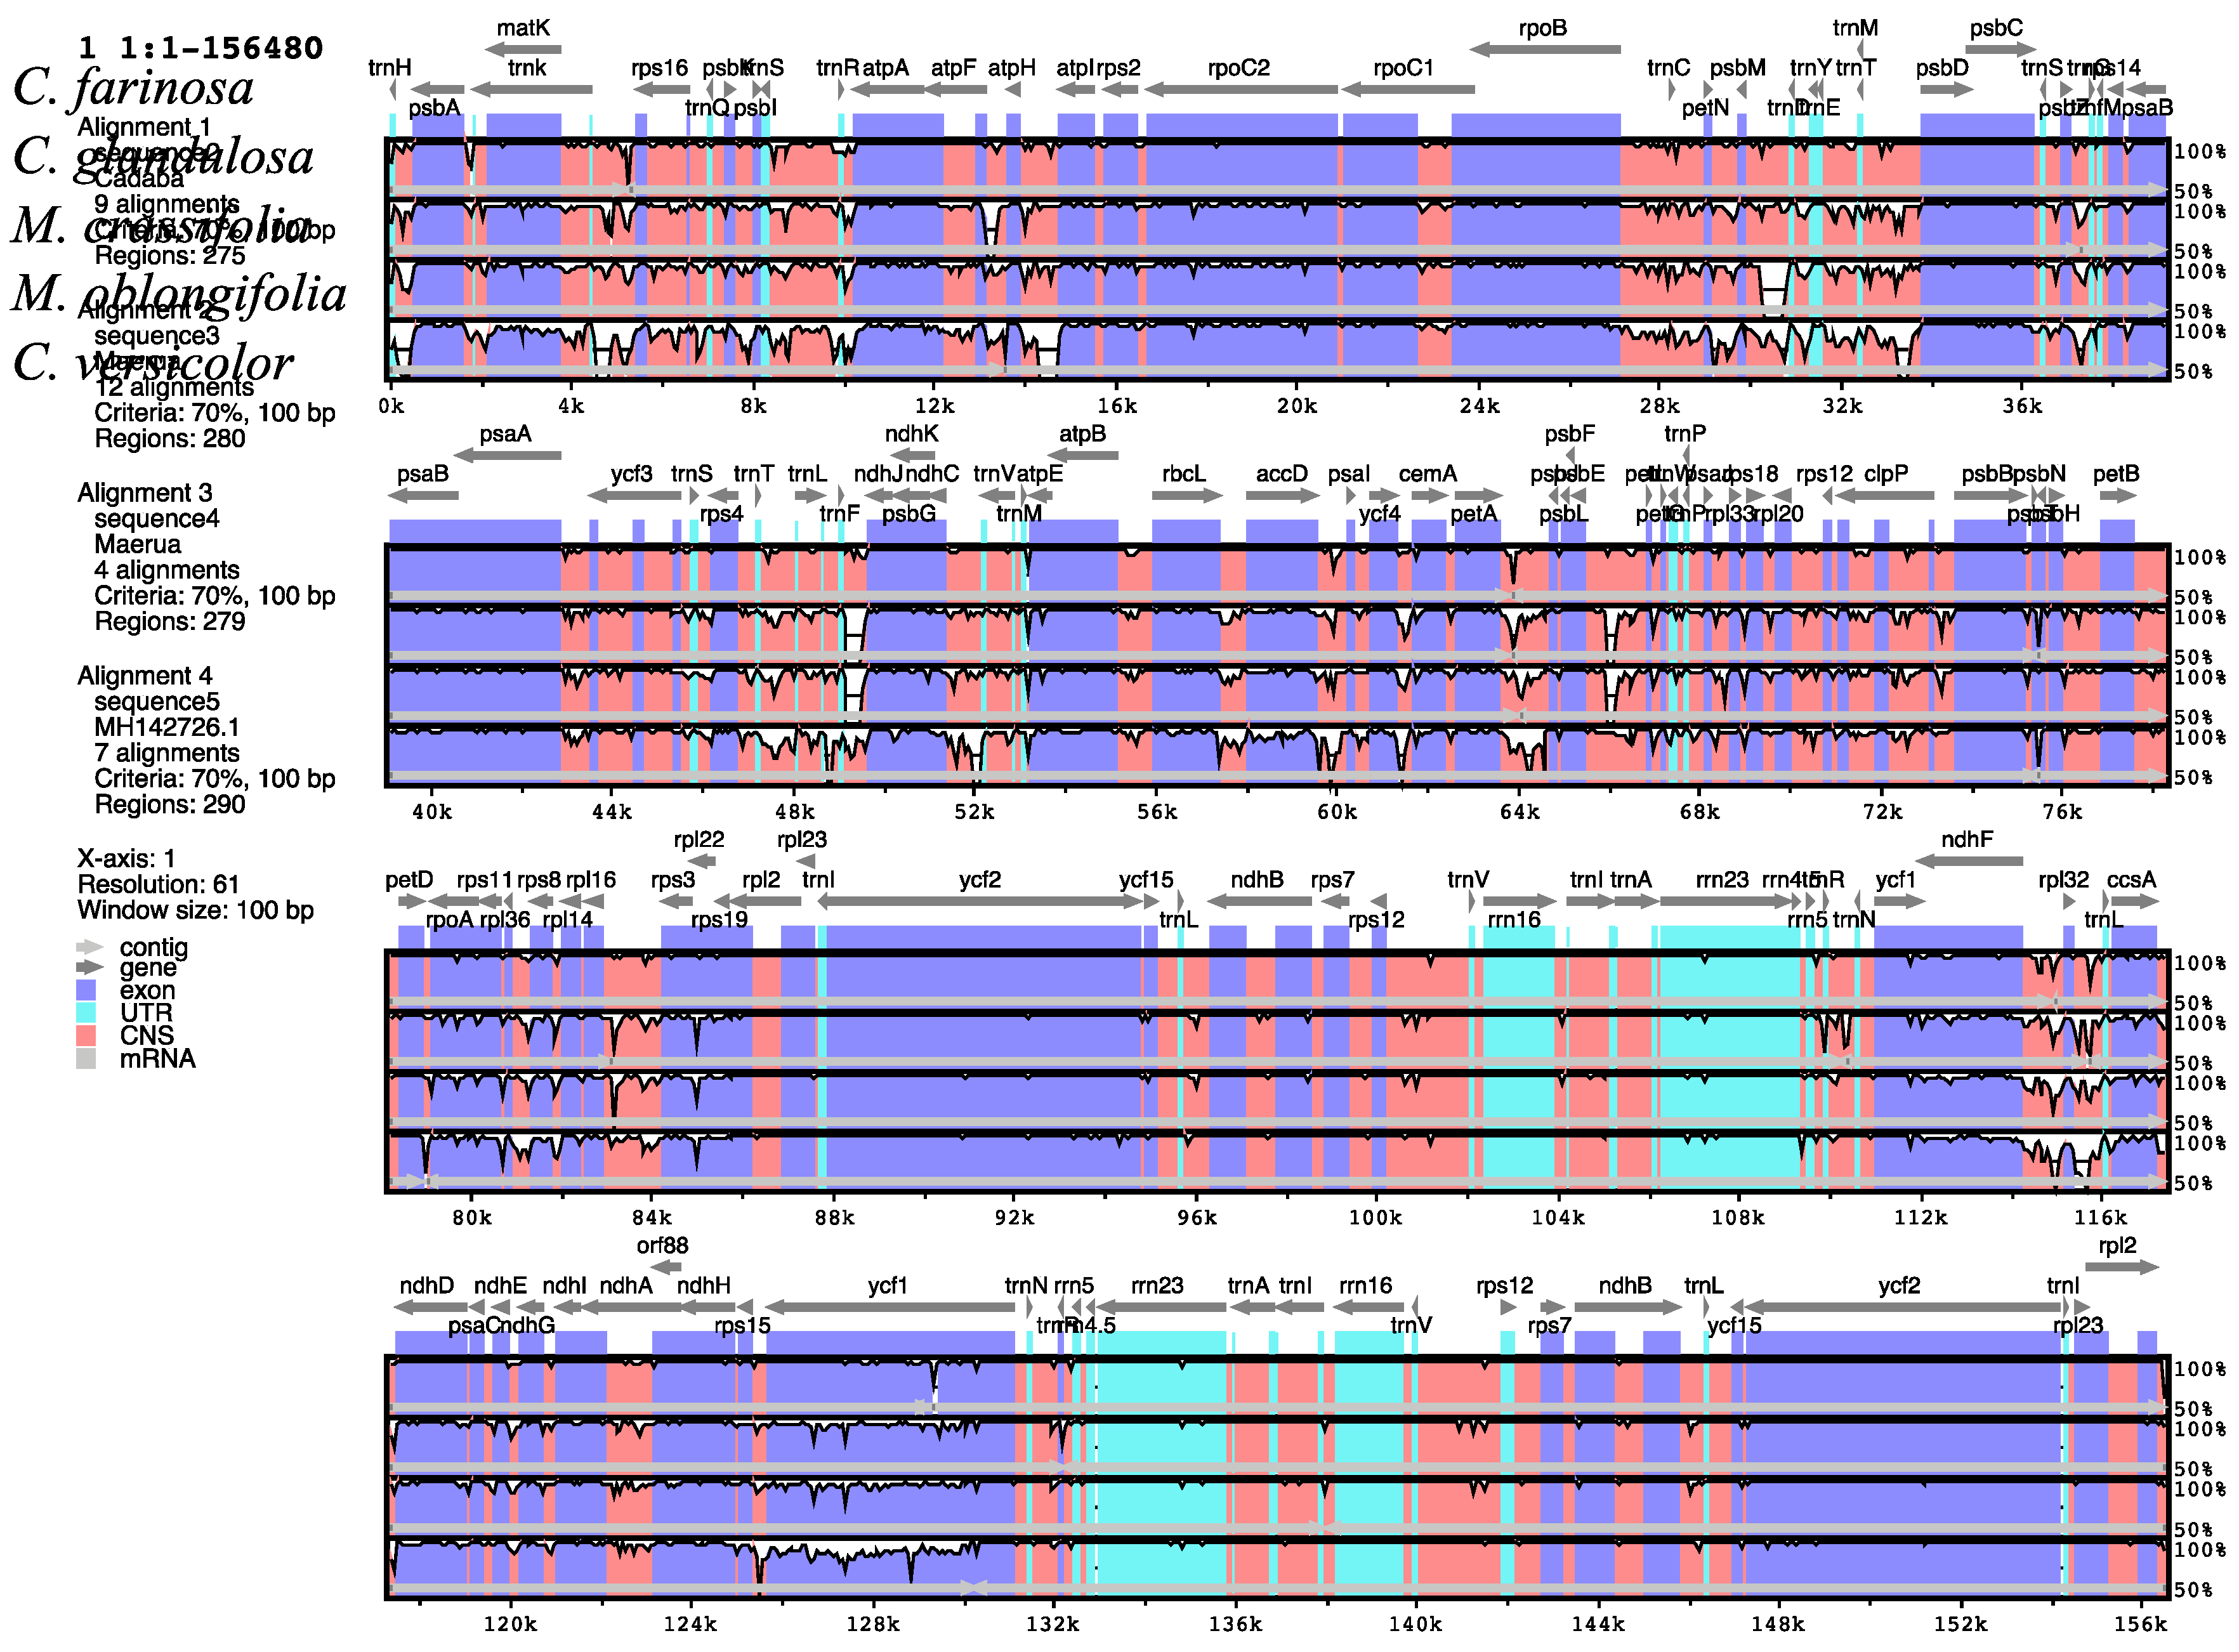
2.5. Comparative Analysis of the Capparaceae Species Cp Genome

To analyze the DNA sequence divergence in the chloroplast genomes of the five species of Capparaceae, a comparative analysis was done using the mVISTA program to align the sequences. Sequence alignment was conducted among four chloroplast genomes of Capparaceae and compared with the chloroplast genome of Capparis versicolor (MH142726), available in GenBank. To understand the structural characteristics in the cp genomes, the annotation of C. farinosa was used as a reference. The alignment outcome reveals highly conserved genomes with few variations. As in most chloroplast genomes of angiosperm plants, non-coding counterparts were conserved less than the gene-coding regions (Figure 6). Among the five cp genomes, the results showed that trnH(GUG)-psbA, rps16-trnQ, psbI-trnS, trnS-trnR, petN-psbM, psbM-trnD, trnE-trnT, trnS-trnG, trnT-trnL, trnF-ndhJ, rbcL-accD, psbE-petL, rbs16-rbs3 and ndhF-rpl32 were the most divergent non-coding regions. However, it was detected that some variations occurred in the following genes: atpF, rpoC2, rps19 and ycf1.
Although angiosperms retain the structure and size of the chloroplast genome [68], some evolutionary events occur in the genome, such as expansion and contraction, that alter the size of the genome and the boundaries of the LSC, SSC, IRa and IRb regions [69,70]. We compared between IR-LCS and IR-SSC the boundaries of the five cp genomes of Capparaceae (Cadaba farinosa, Cadaba glandulosa, Maerua crassifolia, Maerua oblongifolia and Capparis versicolor) and the result presented a similarity among the compared plastomes of Cadaba and Maerua species, with a slight variation among C. versicolor (Figure 7). The chloroplast genome of C. versicolor (155,051 bp) was the smallest, whereas the genome of C. glandulosa (156,560 bp) was the largest. The smallest IR region is in C. versicolor (26,141 bp). The lengths of LSC regions varied among the five Capparaceae species (85,565 bp, 85,681 bp, 84,624 bp, 84,153 bp, 84,315 bp, respectively). The location of the rpsl9 gene is between the junction of the LSC and IRb regions in five species and is in the LSC region in C. versicolor. The ycf1 gene is located in IRb regions, except in C. versicolor, and it crosses the SSC/IRa region and extends by different lengths into the SSC region within the genome (C. farinosa and C. glandulosa 4360 bp; M. crassifolia 4393 bp; M. oblongifolia 4414 bp and C. versicolor 4566 bp). The ndhF gene is found in the IRb/SSC and is 38 bp in C. farinosa and C. glandulosa, 32 bp in M. crassifolia and 35 bp in M. oblongifolia in the IRb region, and it extends into the SSC region by 2209 bp in C. farinosa and C. glandulosa and 2206 bp in M. crassifolia and M. oblongifolia, and is 174 bp away from the border in the C. versicolor genome.

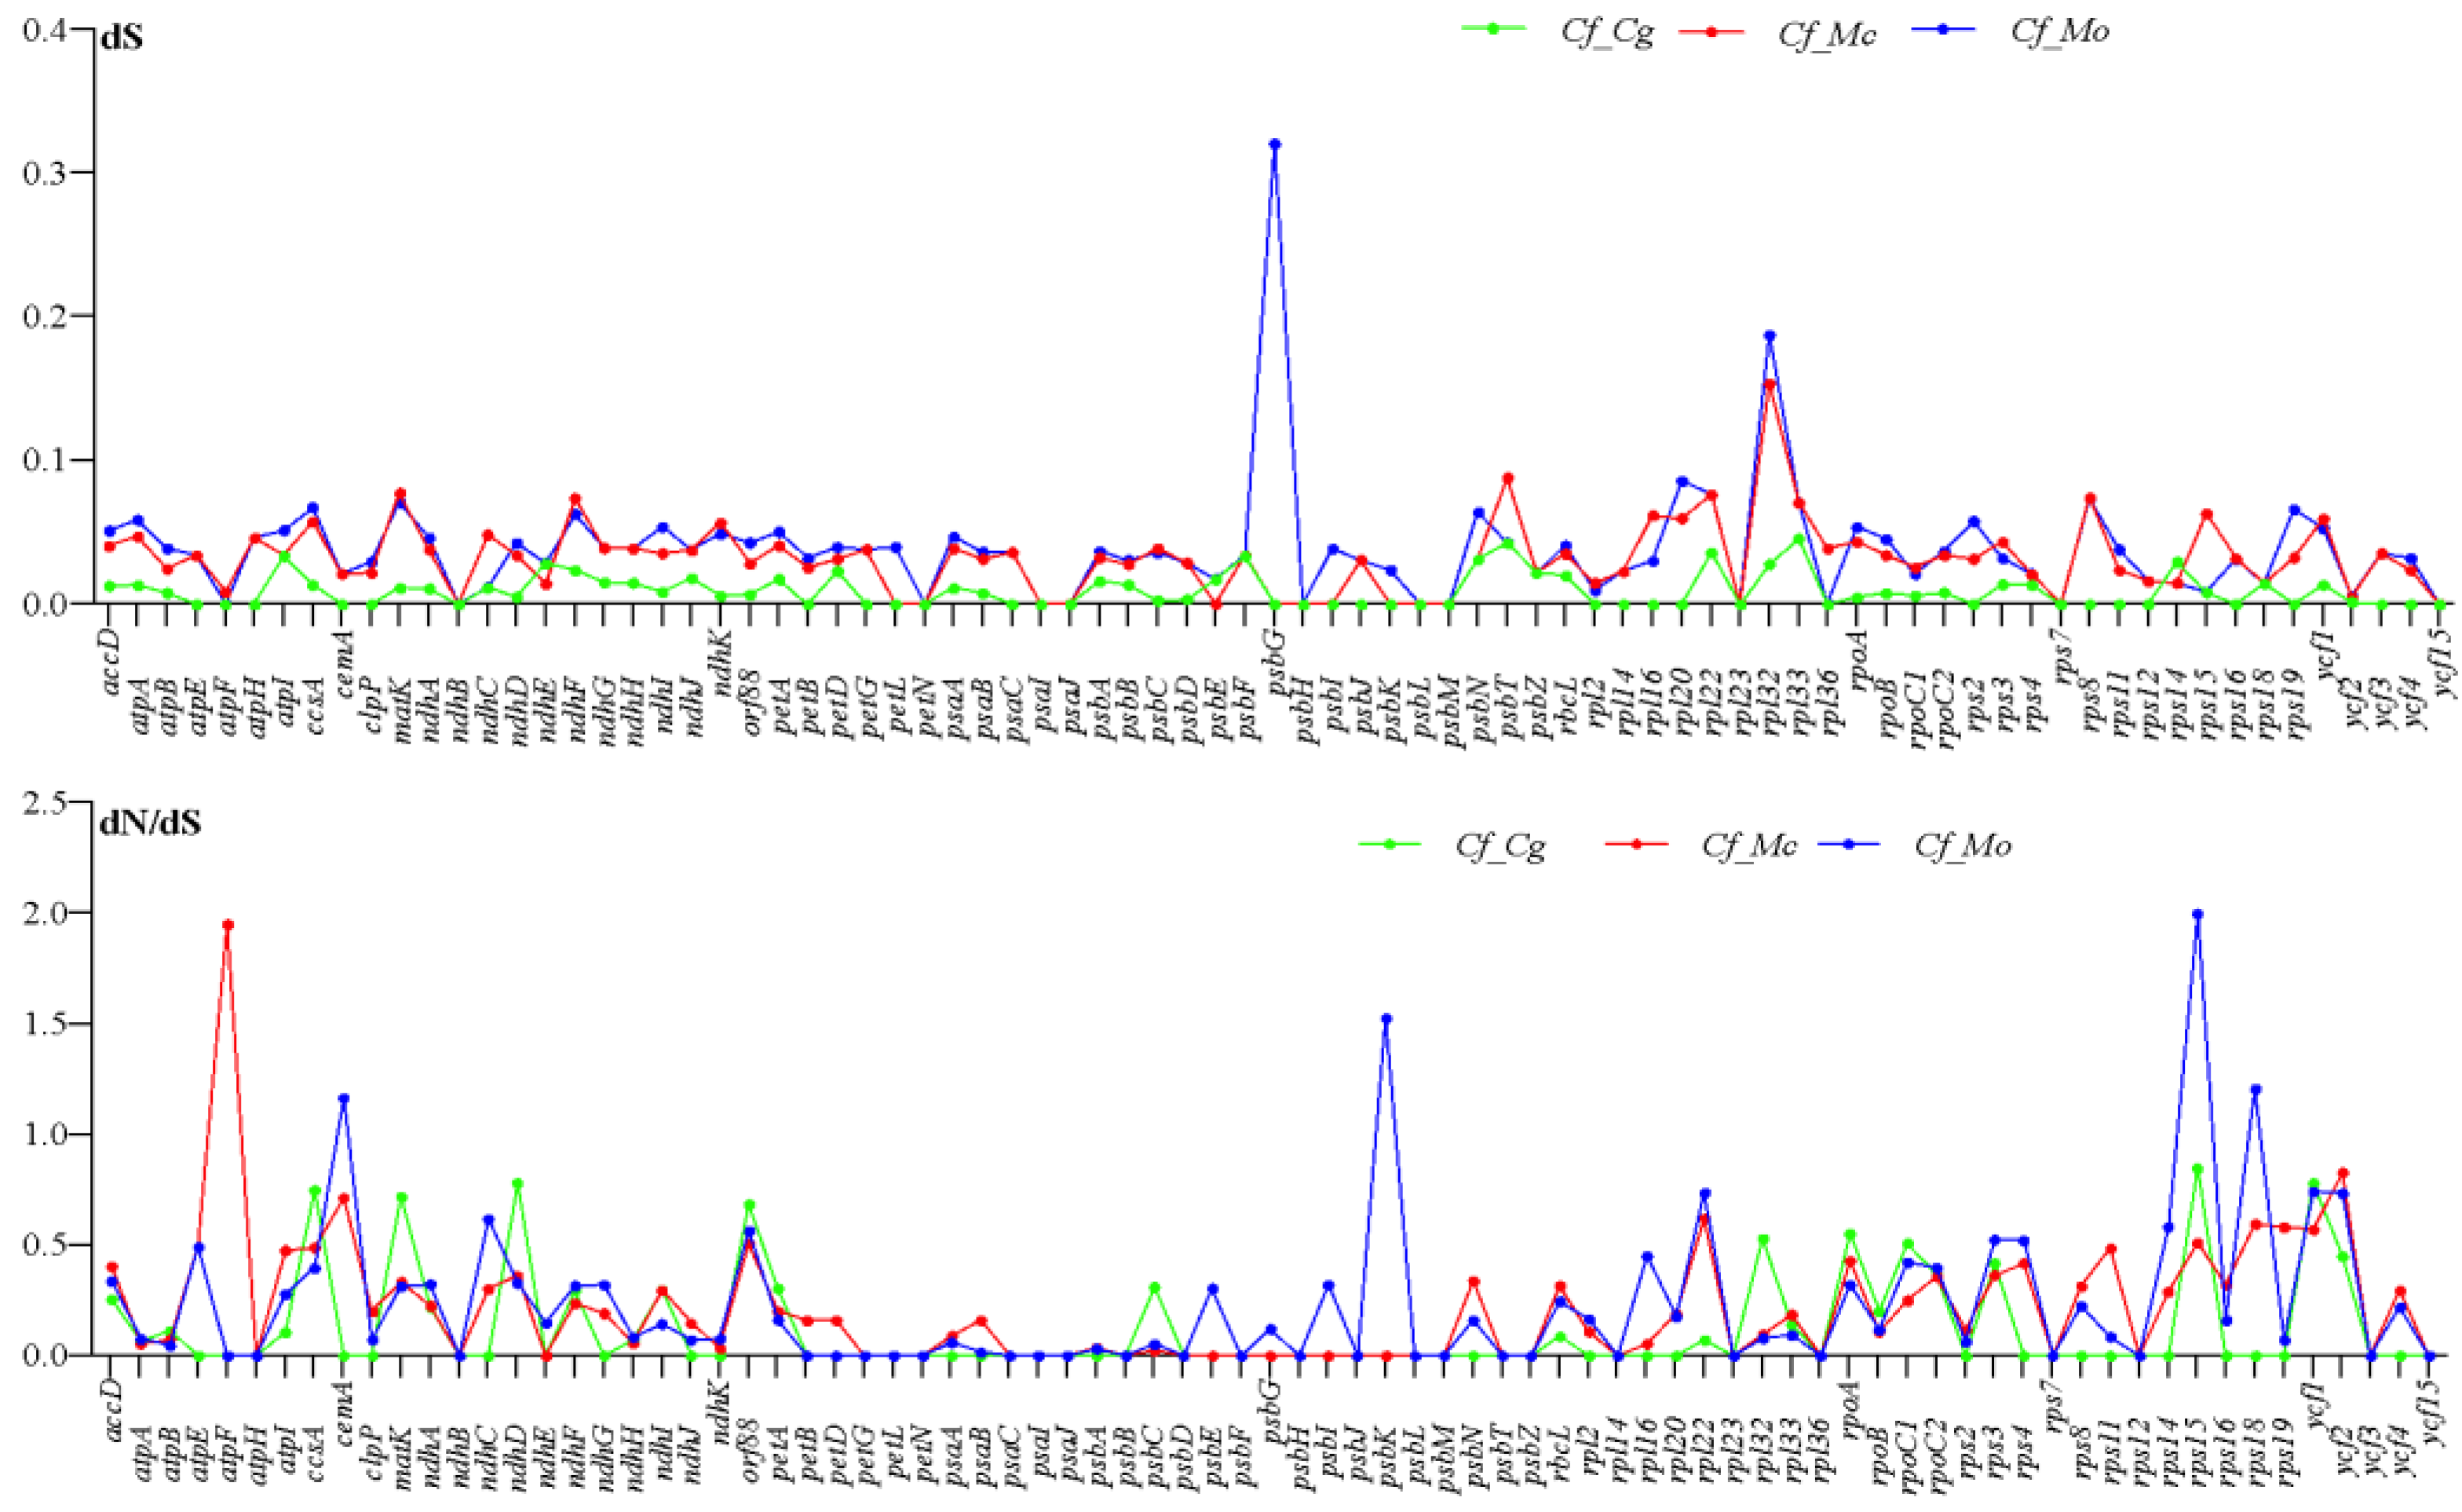
2.6. Divergence of Protein-Coding Gene Sequence

The cp genomes of four Capparaceae species include 80 protein-coding genes in C. glandulosa and 81 genes in other species. To detect the genes under selective pressure, the rates of synonymous (dS) and non-synonymous (dN) substitution and dN/dS ratio were calculated. The results showed that in all of the paired genes of C. farinosa vs. C. glandulosa, the dN/dS ratio is less than 1, and most of the paired genes are less than 1 except atpF in C. farinosa vs. M. crassifolia and cemA, psbK and rps18 in C. farinosa vs. M. oblongifolia, having values of 1.16, 1.52 and 1.2, respectively (Figure 8). The result of the dN/dS ratio obtained in this study is consistent with other related studies [52,53]. In all the genes, the synonymous (dS) values range from 0 to 0.32 (Figure 8).

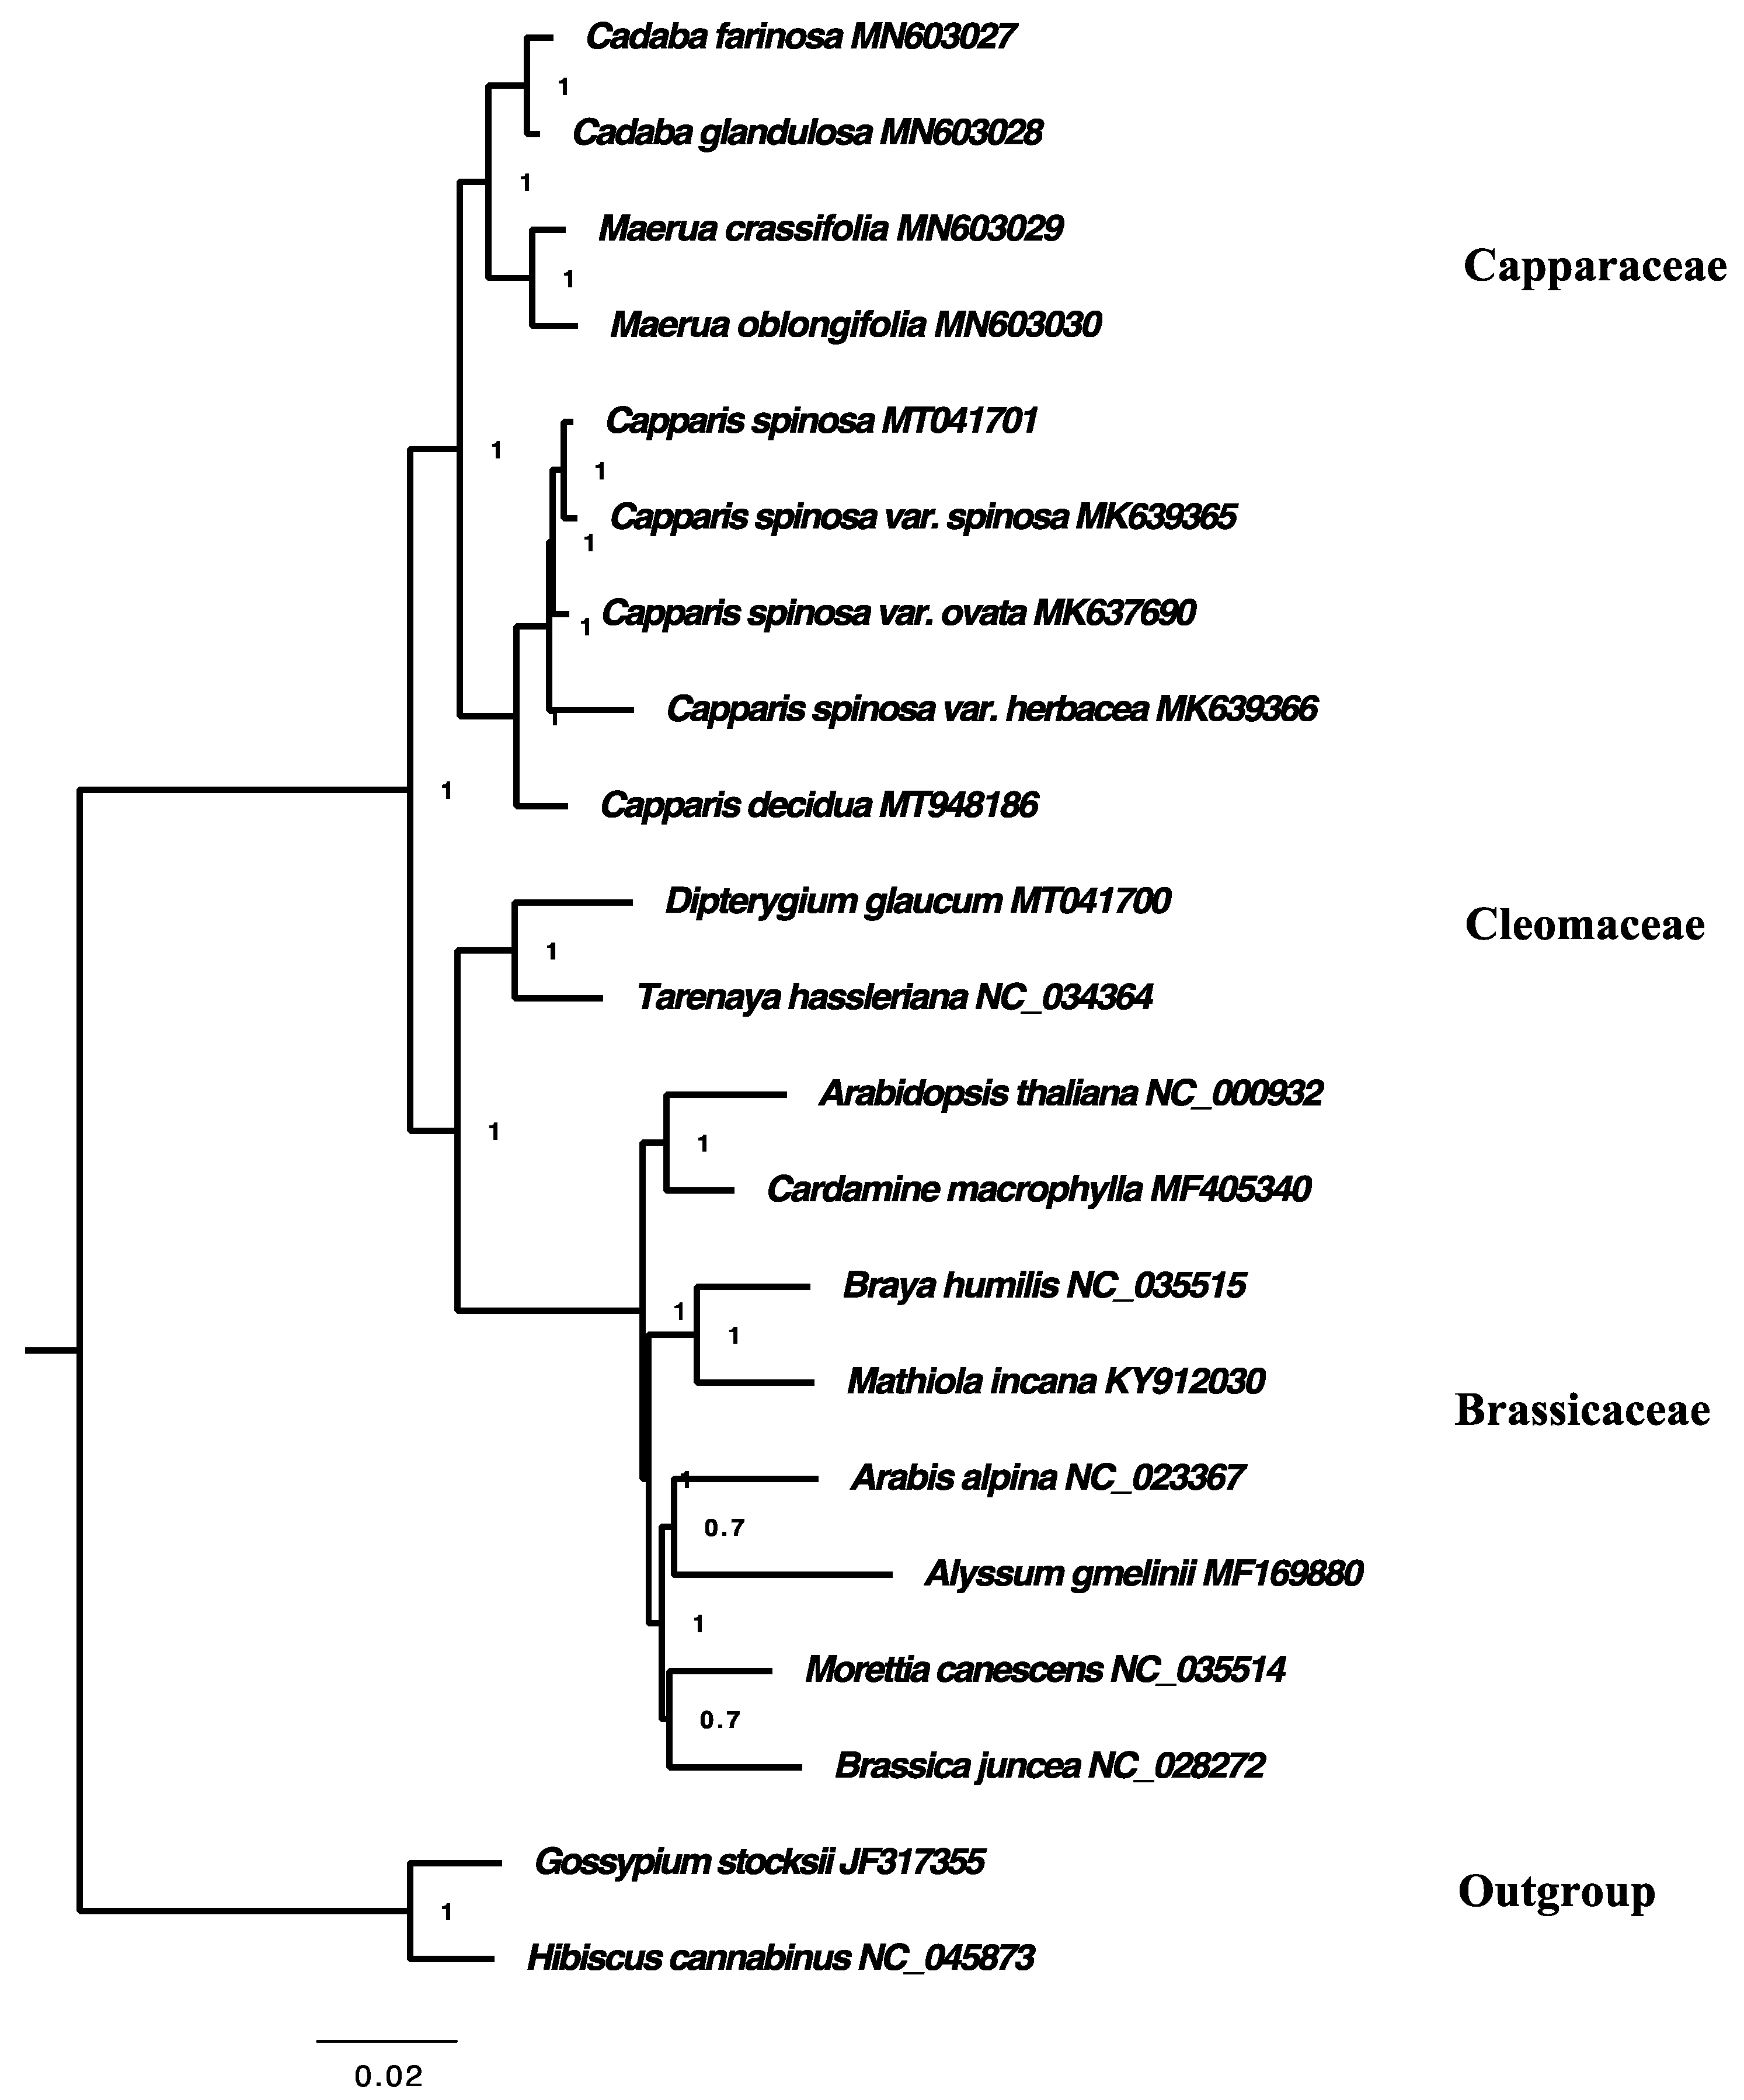
2.7. Phylogenetic Analysis

Phylogenetic relationships based on Bayesian analysis and maximum parsimony were congruent and placed all samples into three main clades, with strong support in all the nodes with PP 1.00 (Figure 9). The first clade contains species of the Capparaceae family and is divided into two subclades; the first subclade includes species of genera Cadaba and Maerua, while the second clade includes species of genus Capparis. The second clade comprises Cleomaceae species, while the third clade includes species from the Brassicaceae family. The phylogenetic tree showed that the Capparaceae family is the earliest diverging lineage among the three families and is sister to Cleomaceae and Brassicaceae. It is clear in this phylogenetic result that Cleomaceae was separated from Capparaceae and became a sister to the Brassicaceae family, as reported by [19,20]; this is consistent with some previous classifications of the order Brassicales.

3. Materials and Methods

3.1. Plant Material and DNA Extraction

Fresh young leaves were collected in 2018 during field investigations in Saudi Arabia: C. farinosa in Jeddah (21°26′45.2″ N 39°25′22.9″ E) on 21 April, C. glandulosa in Jeddah (21°26′45.3″ N 39°25′22.9″ E) on 21 April, M. crassifolia in Makkah (21°13′17.4″ N 39°49′36.1″ E) on 28 April and M. oblongifolia in Jeddah (21°28′31.7″ N 39°50′36.8″ E) on 21 April. No permission was required to collect the plant samples. Species were identified and verified by Dr. Dhafer Alzahrani, Department of Biological Sciences, Faculty of Sciences, King Abdulaziz University, Jeddah, Saudi Arabia. A voucher specimen was prepared and deposited in the herbarium of King Abdulaziz University, Jeddah with the accession numbers: C. farinosa (KAU27480), C. glandulosa (KAU27481) M. crassifolia (KAU27482), M. oblongifolia (KAU27483). Total genomic DNA was extracted from the samples using the Qiagen genomic DNA extraction kit, according to the manufacturer’s protocols.

3.2. Library Construction, Sequencing and Assembly

Input material for the DNA sample preparations was derived (or taken) from a total amount of 1.0 μg DNA. The NEBNext DNA Library Prep Kit was used to generate sequence libraries according to the manufacturer’s recommendation; indices were also added to each sample. Genomic DNA was randomly fragmented by shearing to a size of 350 bases in length. The ends of randomly fragmented DNA were repaired and A-tailed, adapters were ligated with NEBNext for Illumina sequencing, then the PCR improved by P5 and indexed P7 oligo sequences. The AMPure XP system was used to purify the PCR products; subsequent findings were analyzed by the Agilent 2100 Bioanalyzer for size distribution and later quantified using real-time PCR. After pooling, the qualified libraries were fed into an Illumina HiSeq 2500 system (350 bp paired ends reads); this was based on its effective concentration and expected data volume. The raw reads (19,844,190 bp, 19,053,503 bp, 19,440,639 bp and 19,929,468 bp for C. farinosa, C. glandulosa, M. crassifolia and M. oblongifolia, respectively) were cleaned reads (5 Gb) to remove low-quality sequences and adaptors; they were then filtered for PCR duplicates using PRINSEQlite v0.20.4 [71]. The clean raw reads were subjected to de novo assembly from the whole genome sequences using NOVOPlasty 2.7.2 [72] with kmer (K-mer = 31–33). The trnH-psbA of Cadaba farinosa (KR735837.1) was used as a seed and the complete plastome of Arabidopsis thaliana (KX551970.1) was used as a reference for the assembly of the Cadaba farinosa cp genome. The assembled cp genome of Cadaba farinosa was used as seed and reference for the assembly of the Cadaba glandulosa plastome. For Maerua crassifolia, the rpoC1 gene of M. crassifolia (JQ845894.1) was used as seed and the complete cp genome of C. farinosa was used as reference. The assembled cp genome of M. crassifolia was used as seed and reference for the assembly of M. oblongifolia. Finally, each species generated one contig that contained the complete chloroplast genome sequence.

3.3. Gene Annotation

Genes were annotated using the Dual Organellar GenoMe Annotator (DOGMA, University of Texas at Austin, Austin, TX, USA) [73]. The positions of start and stop codons were adjusted manually. tRNA genes were identified by the trnAscan-SE server (http://lowelab.ucsc.edu/tRNAscan-SE/ (accessed on 20 June 2019) [74]. Organellar Genome DRAW (OGDRAW) [75] was used to draw the genome maps.

3.4. Sequence Analysis

MEGA 6.0 was used to compute the codon usage, base composition, and the relative synonymous codon usage values (RSCUs). The RNA editing sites in cp protein-coding genes of the Capparaceae species were predicted using PREP suite [76] with a 0.8 cutoff value. Simple sequence repeats (SSRs) were identified in the chloroplast genomes of the four species (C. farinosa, C. glandulosa, M. crassifolia and M. oblongifolia) using the online software MIcroSAtellite (MISA) [77] with the following parameters set: eight, five, four and three repeat units for mononucleotides, dinucleotides, trinucleotides and tetra-, penta-, hexanucleotide SSR motifs, respectively. To identify the size and location of long repeats (palindromic, forward, reverse and complement) in the four species of Capparaceae being studied, the online program REPuter (https://bibiserv.cebitec.uni-bielefeld.de/reputer (accessed on 22 June 2019) [76], with standard settings, was used.

3.5. Genome Comparison

The chloroplast genomes of C. farinosa, C. glandulosa, M. crassifolia and M. oblongifolia were compared using the program mVISTA [78], and the annotation of C. farinosa was used as a reference in the Shuffle-LAGAN mode [79]. The four species of Capparaceae were compared against the border region between inverted repeat (IR), large single copy (LSC) and small single copy (SSC).

3.6. Characterization of Substitution Rate

To detect the genes that are under selection pressure, the substitution rate of the synonymous (dS) and non-synonymous (dN) substitution and the dN/dS ratio were analyzed using DNAsp v5.10.01 [80], the cp genome of C. farinosa was compared with the cp genome of C. glandulosa, M. crassifolia and M. oblongifolia. Separate protein-coding genes were aligned individually using Geneious version 8.1.3 software, while the protein sequence was translated from aligned sequences.

3.7. Phylogenetic Analysis

The analysis was conducted based on the complete chloroplast genome sequences of nine Capparaceae taxa, six species and three varieties, C. farinosa, MN603027, C. glandulosa, MN603028, M. crassifolia, MN603029, M. oblongifolia, MN603030, Capparis spinosa, MT041701, Capparis spinosa var. spinosa, MK639365, Capparis spinosa var. herbacea, MK639366, Capparis spinosa var. ovata, MK637690 and Capparis decidua MT948186, two Cloemaceae species, eight species of Brassicaceae and two species of Malvaceae, as an outgroup. All sequences were aligned using MAFFT software [81] with default settings. The phylogenetic trees were reconstructed based on maximum parsimony analysis using PAUP software (version 4.0b10) [82], utilizing tree bisection and reconnection branch swapping, with MulTrees on, saving a maximum of 1000 trees per replicate. Missing characters were treated as gaps. The bootstrap analysis confidence was based on 1000 replicates. MrBayes version 3.2.6 [83] was used to conduct Bayesian analysis and jModelTest version 3.7 [84] was used to select the appropriate model.

4. Conclusions

This current study used the Illumina HiSeq 2500 platform to obtain the first complete chloroplast sequences of four medicinal Capparaceae species: C. farinosa, C. glandulosa, M. crassifolia and M. oblongifolia. The four species are divided into two groups: C. farinosa and C. glandulosa belong to the tribe Cadabeae; M. crassifolia and M. oblongifolia belong to the tribe Maerueae. This study can be used to accurately identify species during different medicinal uses based on their plastid genome.

Supplementary Materials

The following are available online at https://www.mdpi.com/article/10.3390/plants10061229/s1, Table S1: Codon–anticodon recognition patterns and codon usage of the Cadaba farinosa chloroplast genome; Table S2: Codon–anticodon recognition patterns and codon usage of the Cadaba glandulosa chloroplast genome; Table S3: Codon–anticodon recognition patterns and codon usage of the Maerua crassifolia chloroplast genome; Table S4: Codon–anticodon recognition patterns and codon usage of the Maerua oblongifolia chloroplast genome; Table S5: Predicted RNA editing site in the Cadaba farinosa chloroplast genome; Table S6: Predicted RNA editing site in the Cadaba glandulosa chloroplast genome; Table S7: Predicted RNA editing site in the Maerua crassifolia chloroplast genome; Table S8: Predicted RNA editing site in the Maerua oblongifolia chloroplast genome; Table S9: Repeat sequences present in the Cadaba farinosa chloroplast genome; Table S10: Repeat sequences present in the Cadaba glandulosa chloroplast genome; Table S11: Repeat sequences present in the Maerua crassifolia chloroplast genome; Table S12: Repeat sequences present in the Maerua oblongifolia chloroplast genome.

Author Contributions

D.A.A. and E.J.A. designed the research and performed the experiments, D.A.A., S.S.Y. and A.A. collected data, E.J.A. and S.S.Y. analyzed the data and drafted the manuscript, D.A.A. supervised the project. All authors have read and agreed to the published version of the manuscript.

Funding

This project was funded by the Deanship of Scientific Research (DSR), King Abdulaziz University, Jeddah, under grant no. DF-294-130-1441. The authors, therefore, gratefully acknowledge DSR technical and financial support.

Data Availability Statement

The complete chloroplast genome sequence of four Capparaceae chloroplast genome sequences were deposited in GenBank at https://www.ncbi.nlm.nih.gov, (accession numbers: C. farinosa, MN603027; C. glandulosa, MN603028; M. crassifolia, MN603029 and M. oblongifolia, MN603030).

Conflicts of Interest

The authors declare no conflict of interest.

References

  1. Cronquist, A.; Takhtadzhiáǹ, A.L. An Integrated System of Classification of Flowering Plants; Columbia University Press: New York, NY, USA, 1981; p. 337. [Google Scholar]
  2. Mabberley, D.J. The Plant-Book: A Portable Dictionary of the Higher Plants; Cambridge University Press: Cambridge, UK, 1997. [Google Scholar]
  3. Heywood, V.H.; Brummitt, R.K.; Culham, A.; Seberg, O. Flowering Plant Families of the World. Royal Botanic Gardens, Kew. Int. J. Pharm. 2007, 11, 874–887. [Google Scholar]
  4. Gibbs, R.D. Chemotaxonomy of Flowering Plants; McGill-Queens University Press: London, UK, 1974; p. 761. [Google Scholar]
  5. Rahman, M.; Mossa, J.S.; Al-Said, M.S.; Al-Yahya, M.A. Medicinal plant diversity in the flora of Saudi Arabia 1: A report on seven plant families. Fitoterapia 2004, 75, 149–161. [Google Scholar] [CrossRef]
  6. Telrandhe, U.B.; Uplanchiwar, V. Phyto-Pharmacological Perspective of Cadaba farinosa forsk. Am. J. Phytomed. Clin. Ther. 2013, 1, 11–22. [Google Scholar]
  7. Agize, M.; Demissew, S.; Asfaw, Z. Ethnobotany of Medicinal Plants in Loma and Gena Bosa Districts (Woredas) of Dawro Zone, Southern Ethiopia. Topclass J. Herb. Med. 2013, 2, 194–212. [Google Scholar]
  8. Laxmichand, B.H.; Modi, N.R. A Comprehensive Review on Maerua Oblongifolia (Forsk.) A. Rich. Int. J. Res. Advent Technol. 2019, 4, 2321–9637. [Google Scholar]
  9. Burkill, H.M.; Dalziel, J.M.; Hutchinson, J. Entry for Maerua crassifolia Forssk. [family CAPPARACEAE]. In Useful Plants of West Tropical Africa, 2nd ed.; Royal Botanic Gardens: Kew, UK, 1985. [Google Scholar]
  10. Akuodor, G.C.; Ibrahim, J.A.; Akpan, J.L.; Okorie, A.U.; Ezeokpo, B.C. Phytochemical and Anti-diarrhoeal Properties of Methanolic Leaf Extract of Maerua crassifolia Forssk. Eur. J. Med. Plants 2014, 4, 1223–1231. [Google Scholar] [CrossRef]
  11. Ckilaka, K.; Akuodor, G.; Akpan, J.; Ogiji, E.; Eze, C.; Ezeokpo, B.C. Antibacterial and antioxidant activities of methanolic leaf extract of Maerua crassifolia. J. Appl. Pharm. Sci. 2015, 5, 147–150. [Google Scholar] [CrossRef] [Green Version]
  12. Bentham, G.; Hooker, J.D. Genera Plantarum ad Eemplaria Imprimis in Herbariis Kewensibus Servata Definite; Reeve and Co.: London, UK, 1883. [Google Scholar]
  13. Engler, A.; Prantl, K. Die Naturlichen Pflanzenfamilien; Wilhelm Engelmann: Leipzig, Germany, 1915. [Google Scholar]
  14. Hutchinson, J. The Genera of Flowering Plants; Clarendon Press: Oxford, UK, 1967. [Google Scholar]
  15. Takhtajan, A. Origins of Angiospermous Plants; American Institute of Biological Science: Washington, DC, USA, 1954. [Google Scholar]
  16. Nee, M. Diversity and Classification of Flowering Plants A. Takhtajan. Brittonia 1998, 50, 191–192. [Google Scholar] [CrossRef]
  17. APG I (Angiosperm Phylogeny Group). An ordinal classification for the families of flowering plants. Ann. Mo. Bot. Gard. 1998, 85, 531–553. [Google Scholar] [CrossRef] [Green Version]
  18. APG II (Angiosperm Phylogeny Group). An update of the Angiosperm Phylogeny Group classification for the orders and families of flowering plants. Bot. J. Linn. Soc. 2003, 141, 399–436. [Google Scholar] [CrossRef] [Green Version]
  19. APG III (Angiosperm Phylogeny Group). An update of the Angiosperm Phylogeny Group classification for the orders and families of flowering plants. Bot. J. Linn. Soc. 2009, 161, 105–121. [Google Scholar]
  20. APG IV (Angiosperm Phylogeny Group). An update of the Angiosperm Phylogeny Group classification for the orders and families of flowering plants. Bot. J. Linn. Soc. 2016, 181, 1–20. [Google Scholar]
  21. Iltis, H.H. Studies in the Capparidaceae. III. Evolution and Phylogeny of the Western North American Cleomoideae. Ann. Mo. Bot. Gard. 1957, 44, 77. [Google Scholar] [CrossRef]
  22. Al-Shehbaz, I.A. The biosystematics of the genus Thelypodium (Cruciferae). Contrib. Gray Herb. Harv. Univ. 1973, 204, 3–148. [Google Scholar]
  23. Al-Shehbaz, I.A. The tribes of Cruciferae (Brassicaceae) in the southeastern United States. J. Arn. Arbor. 1984, 65, 343–373. [Google Scholar]
  24. Dalhgren, R. A System of classification of the angiosperms to be used to demonstrate the distribution of characters. Bot. Not. 1975, 128, 119–147. [Google Scholar]
  25. Takhtajan, A.L. Outline of the classification of flowering plants (magnoliophyta). Bot. Rev. 1980, 46, 225–359. [Google Scholar] [CrossRef]
  26. Hauser, L.A.; Crovello, T.J. Numerical Analysis of Generic Relationships in Thelypodieae (Brassicaceae). Syst. Bot. 1982, 7, 249. [Google Scholar] [CrossRef]
  27. Rodman, J.; Price, R.A.; Karol, K.; Conti, E.; Systma, K.J.; Palmer, J.D. Nucleotide Sequences of the rbcL Gene Indicate Monophyly of Mustard Oil Plants. Ann. Mo. Bot. Gard. 1993, 80, 686. [Google Scholar] [CrossRef]
  28. Rodman, J.E.; Karol, K.G.; Price, R.A.; Sytsma, K.J. Molecules, Morphology, and Dahlgren’s Expanded Order Capparales. Syst. Bot. 1996, 21, 289. [Google Scholar] [CrossRef]
  29. Rodman, J.E.; Soltis, P.S.; Soltis, D.E.; Sytsma, K.J.; Karol, K.G. Parallel evolution of glucosinolate biosynthesis inferred from congruent nuclear and plastid gene phylogenies. Am. J. Bot. 1998, 85, 997–1006. [Google Scholar] [CrossRef] [Green Version]
  30. Schmid, R.; Rollins, R.C. The Cruciferae of Continental North America: Systematics of the Mustard Family from the Arctic to Panama. TAXON 1994, 43, 153. [Google Scholar] [CrossRef]
  31. Judd, W.S.; Sanders, R.W.; Donoghue, M.J. Angiosperm family pairs: Preliminary phylogenetic analyses. Harv. Pap. Bot. 1994, 5, 1–51. [Google Scholar]
  32. Judd, W.S.; Campbell, C.S.; Kellogg, E.A.; Stevens, P.F.; Donoghue, M.J. Plant Systematics: A Phylogenetic Approach, 3rd ed.; Sinauer Associates: Sunderland, MA, USA, 2007. [Google Scholar]
  33. Hall, J.; Sytsma, K.J.; Iltis, H.H. Phylogeny of Capparaceae and Brassicaceae based on chloroplast sequence data. Am. J. Bot. 2002, 89, 1826–1842. [Google Scholar] [CrossRef] [PubMed]
  34. Airy Shaw, H.K. Diagnoses of new families, new names, etc., for the seventh edition of Willis’s ‘Dictionary’. Kew Bull. 1965, 18, 249–273. [Google Scholar] [CrossRef]
  35. Pax, F.; Hoffmann, K. Capparidaceae. In Die Naturlichen Pflanzenfamilien, 2nd ed.; Engler, A., Prantl, K., Eds.; Wilhelm Engelmann: Leipzig, Germany, 1936; Volume 17, pp. 146–223. [Google Scholar]
  36. Hedge, I.C.; Kjaer, A.; Malver, O. Dipterygium—Cruciferaeor Capparaceae? R. Bot. Gard. Edinb. 1980, 38, 247–250. [Google Scholar]
  37. Doweld, A.; Reveal, J.L. New suprageneric names for vascular plants. Phytologia 2008, 90, 416–417. [Google Scholar]
  38. Grevich, J.J.; Daniell, H. Chloroplast Genetic Engineering: Recent Advances and Future Perspectives. Crit. Rev. Plant Sci. 2005, 24, 83–107. [Google Scholar] [CrossRef]
  39. Neuhaus, H.; Emes, M. Nonphotosynthetic metabolism in plastids. Ann. Rev. Plant Biol. 2000, 51, 111–140. [Google Scholar] [CrossRef] [PubMed]
  40. WickeGerald, S.; Schneeweiss, G.M.; Depamphilis, C.W.; Müller, K.F.; Quandt, D. The evolution of the plastid chromosome in land plants: Gene content, gene order, gene function. Plant Mol. Biol. 2011, 76, 273–297. [Google Scholar] [CrossRef] [Green Version]
  41. Raubeson, L.; Jansen, R.; Henry, R.J. (Eds.) Chloroplast genomes of plants. In Plant Diversity and Evolution: Genotypic and Phenotypic Variation in Higher Plants; CABI: London, UK, 2005; pp. 45–68. [Google Scholar]
  42. Greiner, S.; Sobanski, J.; Bock, R. Why are most organelle genomes transmitted maternally? BioEssays 2015, 37, 80–94. [Google Scholar] [CrossRef] [PubMed]
  43. GuisingerTimothy, M.M.; Chumley, T.W.; Kuehl, J.V.; Boore, J.L.; Jansen, R.K. Implications of the Plastid Genome Sequence of Typha (Typhaceae, Poales) for Understanding Genome Evolution in Poaceae. J. Mol. Evol. 2010, 70, 149–166. [Google Scholar] [CrossRef] [Green Version]
  44. Yang, J.-B.; Tang, M.; Li, H.-T.; Zhang, Z.-R.; Li, D.-Z. Complete chloroplast genome of the genus Cymbidium: Lights into the species identification, phylogenetic implications and population genetic analyses. BMC Evol. Biol. 2013, 13, 84. [Google Scholar] [CrossRef] [PubMed] [Green Version]
  45. Alzahrani, D.; Albokhari, E.; Yaradua, S.; Abba, A. The complete plastome sequence for the medicinal species Capparis spinosa L. (Capparaceae). Gene Rep. 2021, 23, 101059. [Google Scholar] [CrossRef]
  46. Maurya, S.; Darshetkar, A.M.; Datar, M.N.; Tamhankar, S.; Li, P.; Choudhary, R.K. Plastome data provide insights into intra and interspecific diversity and ndh gene loss in Capparis (Capparaceae). Phytotaxa 2020, 432, 206–220. [Google Scholar] [CrossRef]
  47. Chen, H.; Shao, J.; Zhang, H.; Jiang, M.; Huang, L.; Zhang, Z.; Yang, D.; He, M.; Ronaghi, M.; Luo, X.; et al. Sequencing and Analysis of Strobilanthes cusia (Nees) Kuntze Chloroplast Genome Revealed the Rare Simultaneous Contraction and Expansion of the Inverted Repeat Region in Angiosperm. Front. Plant Sci. 2018, 9, 324. [Google Scholar] [CrossRef] [Green Version]
  48. Chang, C.C.; Lin, H.C.; Lin, I.P.; Chow, T.Y.; Chen, H.H.; Chen, W.H.; Cheng, C.H.; Lin, C.U.; Liu, S.M.; Chang, C.C.; et al. The chloroplast genome of Phalaenopsis aphrodite (Orchidaceae): Comparative analysis of evolutionary rate with that of grasses and its phylogenetic implications. Mol. Biol. Evol. 2006, 23, 279–291. [Google Scholar] [CrossRef] [Green Version]
  49. Raman, G.; Park, S. The complete chloroplast genome sequence of Ampelopsis: Gene organization, comparative analysis, and phylogenetic relationships to other angiosperms. Front. Plant Sci. 2016, 341, 7. [Google Scholar] [CrossRef] [Green Version]
  50. Park, I.; Kim, W.J.; Yeo, S.-M.; Choi, G.; Kang, Y.-M.; Piao, R.; Moon, B.C. The Complete Chloroplast Genome Sequences of Fritillaria ussuriensis Maxim. And Fritillaria cirrhosa D. Don, and Comparative Analysis with Other Fritillaria Species. Molecules 2017, 22, 982. [Google Scholar] [CrossRef] [Green Version]
  51. Li, B.; Lin, F.; Huang, P.; Guo, W.; Zheng, Y. Complete Chloroplast Genome Sequence of Decaisnea insignis: Genome Organization, Genomic Resources and Comparative Analysis. Sci. Rep. 2017, 7, 10073. [Google Scholar] [CrossRef]
  52. Liu, X.; Li, Y.; Yang, H.; Zhou, B. Chloroplast Genome of the Folk Medicine and Vegetable Plant Talinum paniculatum (Jacq.) Gaertn.: Gene Organization, Comparative and Phylogenetic Analysis. Molecules 2018, 23, 857. [Google Scholar] [CrossRef] [Green Version]
  53. Mower, J.P. The PREP suite: Predictive RNA editors for plant mitochondrial genes, chloroplast genes and user-defined alignments. Nucleic Acids Res. 2009, 37, W253–W259. [Google Scholar] [CrossRef] [PubMed]
  54. Bundschuh, R.; Altmüller, J.; Becker, C.; Nürnberg, P.; Gott, J.M. Complete characterization of the edited transcriptome of the mitochondrion of Physarum polycephalum using deep sequencing of RNA. Nucleic Acids Res. 2011, 39, 6044–6055. [Google Scholar] [CrossRef] [Green Version]
  55. Zeng, W.-H.; Liao, S.-C.; Chang, C.-C. Identification of RNA Editing Sites in Chloroplast Transcripts of Phalaenopsis aphrodite and Comparative Analysis with Those of Other Seed Plants. Plant Cell Physiol. 2007, 48, 362–368. [Google Scholar] [CrossRef] [PubMed] [Green Version]
  56. Luo, J.; Hou, B.-W.; Niu, Z.-T.; Liu, W.; Xue, Q.-Y.; Ding, X.-Y. Comparative Chloroplast Genomes of Photosynthetic Orchids: Insights into Evolution of the Orchidaceae and Development of Molecular Markers for Phylogenetic Applications. PLoS ONE 2014, 9, e99016. [Google Scholar] [CrossRef] [PubMed]
  57. Wang, W.; Yu, H.; Wang, J.; Lei, W.; Gao, J.; Qiu, X.; Wang, J. The Complete Chloroplast Genome Sequences of the Medicinal Plant Forsythia suspensa (Oleaceae). Int. J. Mol. Sci. 2017, 18, 2288. [Google Scholar] [CrossRef] [Green Version]
  58. Kumbhar, F.; Nie, X.; Xing, G.; Zhao, X.; Lin, Y.; Wang, S.; Weining, S. Identification and characterisation of RNA editing sites in chloroplast transcripts of einkorn wheat (Triticum monococcum). Ann. Appl. Biol. 2018, 172, 197–207. [Google Scholar] [CrossRef]
  59. Park, M.; Park, H.; Lee, H.; Lee, B.-H.; Lee, J. The Complete Plastome Sequence of an Antarctic Bryophyte Sanionia uncinata (Hedw.) Loeske. Int. J. Mol. Sci. 2018, 19, 709. [Google Scholar] [CrossRef] [Green Version]
  60. Magdalena, G.N.; Ewa, F.; Wojciech, P. Cucumber, melon, pumpkin, and squash: Are rules of editing in flowering plants chloroplast genes so well-known indeed? Gene 2009, 434, 1–8. [Google Scholar]
  61. Huang, Y.-Y.; Matzke, A.J.M.; Matzke, M. Complete Sequence and Comparative Analysis of the Chloroplast Genome of Coconut Palm (Cocos nucifera). PLoS ONE 2013, 8, e74736. [Google Scholar] [CrossRef] [Green Version]
  62. Li, Y.; Xu, W.; Zou, W.; Jiang, D.; Liu, X. Complete chloroplast genome sequences of two endangered Phoebe (Lauraceae) species. Bot. Stud. 2017, 58, 1–10. [Google Scholar] [CrossRef]
  63. Greiner, S.; Wang, X.; Rauwolf, U.; Silber, M.V.; Mayer, K.; Meurer, J.; Haberer, G.; Herrmann, R.G. The complete nucleotide sequences of the five genetically distinct plastid genomes of Oenothera, subsection Oenothera: I. Sequence evaluation and plastome evolution. Nucleic Acids Res. 2008, 36, 2366–2378. [Google Scholar] [CrossRef] [PubMed] [Green Version]
  64. Song, Y.; Wang, S.; Ding, Y.; Xu, J.; Li, M.F.; Zhu, S.; Chen, N. Chloroplast Genomic Resource of Paris for Species Discrimination. Sci. Rep. 2017, 7, 3427. [Google Scholar] [CrossRef] [Green Version]
  65. Kaila, T.; Chaduvla, P.K.; Rawal, H.C.; Saxena, S.; Tyagi, A.; Mithra, S.V.A.; Solanke, A.U.; Kalia, P.; Sharma, T.R.; Singh, N.K.; et al. Chloroplast Genome sequence of Cluster bean (Cyamopsis tetragonoloba L.): Genome structure and comparative analysis. Genes 2017, 8, 212. [Google Scholar] [CrossRef] [Green Version]
  66. Bryan, G.J.; McNicoll, J.; Ramsay, G.; Meyer, R.C.; De Jong, W.S. Polymorphic simple sequence repeat markers in chloroplast genomes of Solanaceous plants. Theor. Appl. Genet. 1999, 99, 859–867. [Google Scholar] [CrossRef]
  67. Provan, J. Novel chloroplast microsatellites reveal cytoplasmic variation in Arabidopsis thaliana. Mol. Ecol. 2000, 9, 2183–2185. [Google Scholar] [CrossRef] [PubMed]
  68. Ebert, D.; Peakall, R. Chloroplast simple sequence repeats (cpSSRs): Technical resources and recommendations for expanding cpSSR discovery and applications to a wide array of plant species. Mol. Ecol. Resour. 2009, 9, 673–690. [Google Scholar] [CrossRef]
  69. Philippe, H.; Delsuc, F.; Brinkmann, H.; Lartillot, N. Phylogenomics, Annual Review of Ecology. Evol. Syst. 2005, 36, 541–562. [Google Scholar] [CrossRef]
  70. Raubeson, L.A.; Peery, R.; Chumley, T.W.; Dziubek, C.; Fourcade, H.M.; Boore, J.L.; Jansen, R.K. Comparative chloroplast genomics: Analyses including new sequences from the angiosperms Nuphar advena and Ranunculus macranthus. BMC Genom. 2007, 8, 1–27. [Google Scholar] [CrossRef] [PubMed] [Green Version]
  71. Schmieder, R.; Edwards, R. Quality control and preprocessing of metagenomic datasets. Bioinformatics 2011, 27, 863–864. [Google Scholar] [CrossRef] [Green Version]
  72. Dierckxsens, N.; Mardulyn, P.; Smits, G. NOVOPlasty: De novo assembly of organelle genomes from whole genome data. Nucleic Acids Res. 2017, 45, e18. [Google Scholar]
  73. Wyman, S.K.; Jansen, R.K.; Boore, J.L. Automatic annotation of organellar genomes with DOGMA. Bioinformatics 2004, 20, 3252–3255. [Google Scholar] [CrossRef] [Green Version]
  74. Schattner, P.; Brooks, A.N.; Lowe, T.M. The tRNAscan-SE, snoscan and snoGPS web servers for the detection of tRNAs and snoRNAs. Nucleic Acids Res. 2005, 33, W686–W689. [Google Scholar] [CrossRef] [PubMed]
  75. Lohse, M.; Drechsel, O.; Bock, R. OrganellarGenomeDRAW (OGDRAW): A tool for the easy generation of high-quality custom graphical maps of plastid and mitochondrial genomes. Curr. Genet. 2007, 52, 267–274. [Google Scholar] [CrossRef] [PubMed]
  76. Kurtz, S.; Choudhuri, J.V.; Ohlebusch, E.; Schleiermacher, C.; Stoye, J.; Giegerich, R. REPuter: The manifold applications of repeat analysis on a genomic scale. Nucleic Acids Res. 2001, 29, 4633–4642. [Google Scholar] [CrossRef] [PubMed] [Green Version]
  77. Thiel, T.; Michalek, W.; Varshney, R.; Graner, A. Exploiting EST databases for the development and characterization of gene-derived SSR-markers in barley (Hordeum vulgare L.). Theor. Appl. Genet. 2003, 106, 411–422. [Google Scholar] [CrossRef] [PubMed]
  78. Mayor, C.; Brudno, M.; Schwartz, J.R.; Poliakov, A.; Rubin, E.M.; Frazer, K.A.; Pachter, L.S.; Dubchak, I. VISTA: Visualizing global DNA sequence alignments of arbitrary length. Bioinformatics 2000, 16, 1046–1047. [Google Scholar] [CrossRef] [PubMed] [Green Version]
  79. Frazer, K.A.; Pachter, L.; Poliakov, A.; Rubin, E.M.; Dubchak, I. VISTA: Computational tools for comparative genomics. Nucleic Acids Res. 2004, 32, W273–W279. [Google Scholar] [CrossRef]
  80. Librado, P.; Rozas, J. DnaSP v5: A software for comprehensive analysis of DNA polymorphism data. Bioinformatics 2009, 25, 1451–1452. [Google Scholar] [CrossRef] [Green Version]
  81. Katoh, K.; Standley, D.M. MAFFT multiple sequence alignment software version 7: Improvements in performance and usability. Mol. Biol. Evol. 2013, 30, 772–780. [Google Scholar] [CrossRef] [Green Version]
  82. Felsenstein, J. Cases in which parsimony or compatibility methods will be positively misleading. Syst. Zool. 1978, 27, 401–410. [Google Scholar] [CrossRef]
  83. Ronquist, F.; Teslenko, M.; van der Mark, P.; Ayres, D.L.; Darling, A.; Höhna, S.; Larget, B.; Liu, L.; Suchard, M.A.; Huelsenbeck, J.P. MrBayes 3.2: Efficient Bayesian Phylogenetic Inference and Model Choice Across a Large Model Space. Systematic 2012, 61, 539–542. [Google Scholar] [CrossRef] [PubMed] [Green Version]
  84. Posada, D. jModelTest: Phylogenetic Model Averaging. Mol. Biol. Evol. 2008, 25, 1253–1256. [Google Scholar] [CrossRef] [PubMed]
Figure 1. Chloroplast genome maps of the four Capparaceae species. Genes drawn inside the circle are transcribed clockwise, while those outside the circle are transcribed counter-clockwise. The inner dark gray circle corresponds to GC content and the inner light gray circle corresponds to the AT content. Different colors are used as a representation of distinctive genes within separate functional groups.
Plants 10 01229 g001
Figure 2. Amino acid frequencies in the four Capparaceae chloroplast genomes’ protein-coding sequences.
Plants 10 01229 g002
Figure 3. Number of different repeats in four chloroplast genomes of four species of Capparaceae. p = palindromic, F = forward, R = reverse and C= complement.
Plants 10 01229 g003
Figure 4. Frequency of different SSR motifs in different repeat types in C. farinosa, C. glandulosa, M. crassifolia and M. oblongifolia chloroplast genomes.
Plants 10 01229 g004
Figure 5. Number of different SSR types in the four chloroplast genomes of Capparaceae.
Plants 10 01229 g005
Figure 6. Alignment of chloroplast genomes of C. farinosa, C. glandulosa, M. crassifolia, M. oblongifolia and C. versicolor performed with C. farinosa as reference. Transcription direction is indicated by the gray arrows at the top, protein coding is represented by blue bars, non-coding sequence CNS is represented by pink bars and tRNAs and rRNAs are represented by light green. The cp genome is identified by the coordinates in the x-axis, while the y-axis represents the percentage identity within 50–100%.
Plants 10 01229 g006
Figure 7. Comparison of the IR, SSC and LSC junction positions among five chloroplast genomes of Capparaceae.
Plants 10 01229 g007
Figure 8. The synonymous (dS) and dN/dS ratio values of 81 protein-coding genes from four Capparaceae cp genomes.
Plants 10 01229 g008
Figure 9. Phylogenetic tree reconstruction based on the complete chloroplast genome of 21 taxa inferred from Bayesian inference (BI) methods, showing relationships within Brassicales. Numbers in the clade represent posterior probability (PP) values.
Plants 10 01229 g009
Table 1. Base content in the C. farinosa, C. glandulosa, M. crassifolia and M. oblongifolia chloroplast genomes.
SpeciesC. farinosaC. glandulosaM. crassifoliaM. oblongifolia
Genome size (bp)156,481156,560155,685155,436
IR (bp)26,43026,42426,29426,401
LSC (bp)85,56585,68184,62484,153
SSC (bp)18,05618,03118,47318,481
Total number of genes138137138138
rRNA4444
tRNA31313131
Protein-coding genes81808181
A%31313131
C%18181818
T%32323232
G%17171717
Table 2. Gene contents in the chloroplast genomes of Cadaba and Maerua species.
CategoryGene GroupsGene Names
RNA genesRibosomal RNA genes (rRNA)rrn5, rrn4.5, rrn16, rrn23
Transfer RNA genes (tRNA)trnH-GUG, trnK-UUU+, trnQ-UUG, trnS-GCU, trnS-CGA+, trnR-UCU, trnC-GCA, trnD-GUC, trnY-GUA, trnE-UUC, trnT-GGU, trnS-UGA, trnG-GCC, trnfM-CAU, trnS-GGA, trnT-UGU, trnL-UAA+, trnF-GAA, trnV-UAC+, trnM-CAU, trnW-CCA, trnP-UGG, trnP-GGG, trnI-CAUa, trnL-CAAa, trnV-GACa, trnI-GAU+,a, trnA-UGC+,a, trnR-ACGa, trnN-GUUa, trnL-UAG
Ribosomal proteinsSmall ribosomal subunitrps2, rps3, rps4, rps7a, rps8, rps11, rps12a, rps14, rps15, rps16+, rps18, rps19
TranscriptionLarge ribosomal subunitrpl2+,a, rpl14, rpl16, rpl20, rpl22, rpl23a, rpl32, rpl33, rpl36
DNA dependent RNA polymeraserpoA, rpoB, rpoC1+, rpoC2
Protein-coding genesPhotosystem IpsaA, psaB, psaC, psaI, psaJ, ycf3++
Photosystem IIpsbA, psbB, psbC, psbD, psbE, psbF, psbG, psbH, psbI, psbJ, psbK, psbL, psbM, psbN, psbT, psbZ, ndhK *
Subunit of cytochromepetA, petB, petD, petG, petL, petN
Subunit of synthaseatpA, atpB, atpE, atpF+, atpH, atpI
Large subunit of RubiscorbcL
NADH dehydrogenasendhA+, ndhB+,a, ndhC, ndhD, ndhE, ndhF, ndhG, ndhH, ndhI, ndhJ
Other genesATP dependent protease subunit PclpP++
Chloroplast envelope membrane proteincemA
MaturasematK
Subunit of acetyl-CoA carboxylaseaccD
C-type cytochrome synthesisccsA
Translation initiation factorinfA
Hypothetical proteinsycf2a, ycf4, ycf15a
Component of the TIC complexycf1a
+ Gene with one intron, ++ gene with two introns and a gene with multiple copies. a gene with multiple copies. * ndhK in group photosystem II in C. farinosa and group NADH dehydrogenase in C. glandulosa, M. crassifolia and M. oblongifolia.
Table 3. Simple sequence repeats in the C. farinosa, C. glandulosa, M. crassifolia and M. oblongifolia chloroplast genomes.
SSR TypeRepeat UnitSpecies
C. farinosaC. glandulosaM. crassifoliaM. oblongifolia
MonoA/T220223204208
C/G1122
DiAC/GT0100
AG/CT2011
AT/AT1112710
TriAAT/ATT4523
TetraAAAC/GTTT0010
AAAG/CTTT0001
AAAT/ATTT6645
AATT/AATT2210
AACT/AGTT0001
AGAT/ATCT1121
PentaAAAAT/ATTTT1000
AAATT/AATTT0010
AACAT/ATGTT0001
AAACT/AGTTT1000
AATAG/ATTCT0020
Publisher’s Note: MDPI stays neutral with regard to jurisdictional claims in published maps and institutional affiliations.

