
Biometrics Assessment of Cluster- and Berry-Related Traits of Muscadine Grape Population

 , , ,
, , ,
Abstract
1. Introduction
2. Results
2.1. Determination of Flower Structure (FLS) in Muscadine Population
2.2. Cluster-Related Traits
2.2.1. Cluster Length
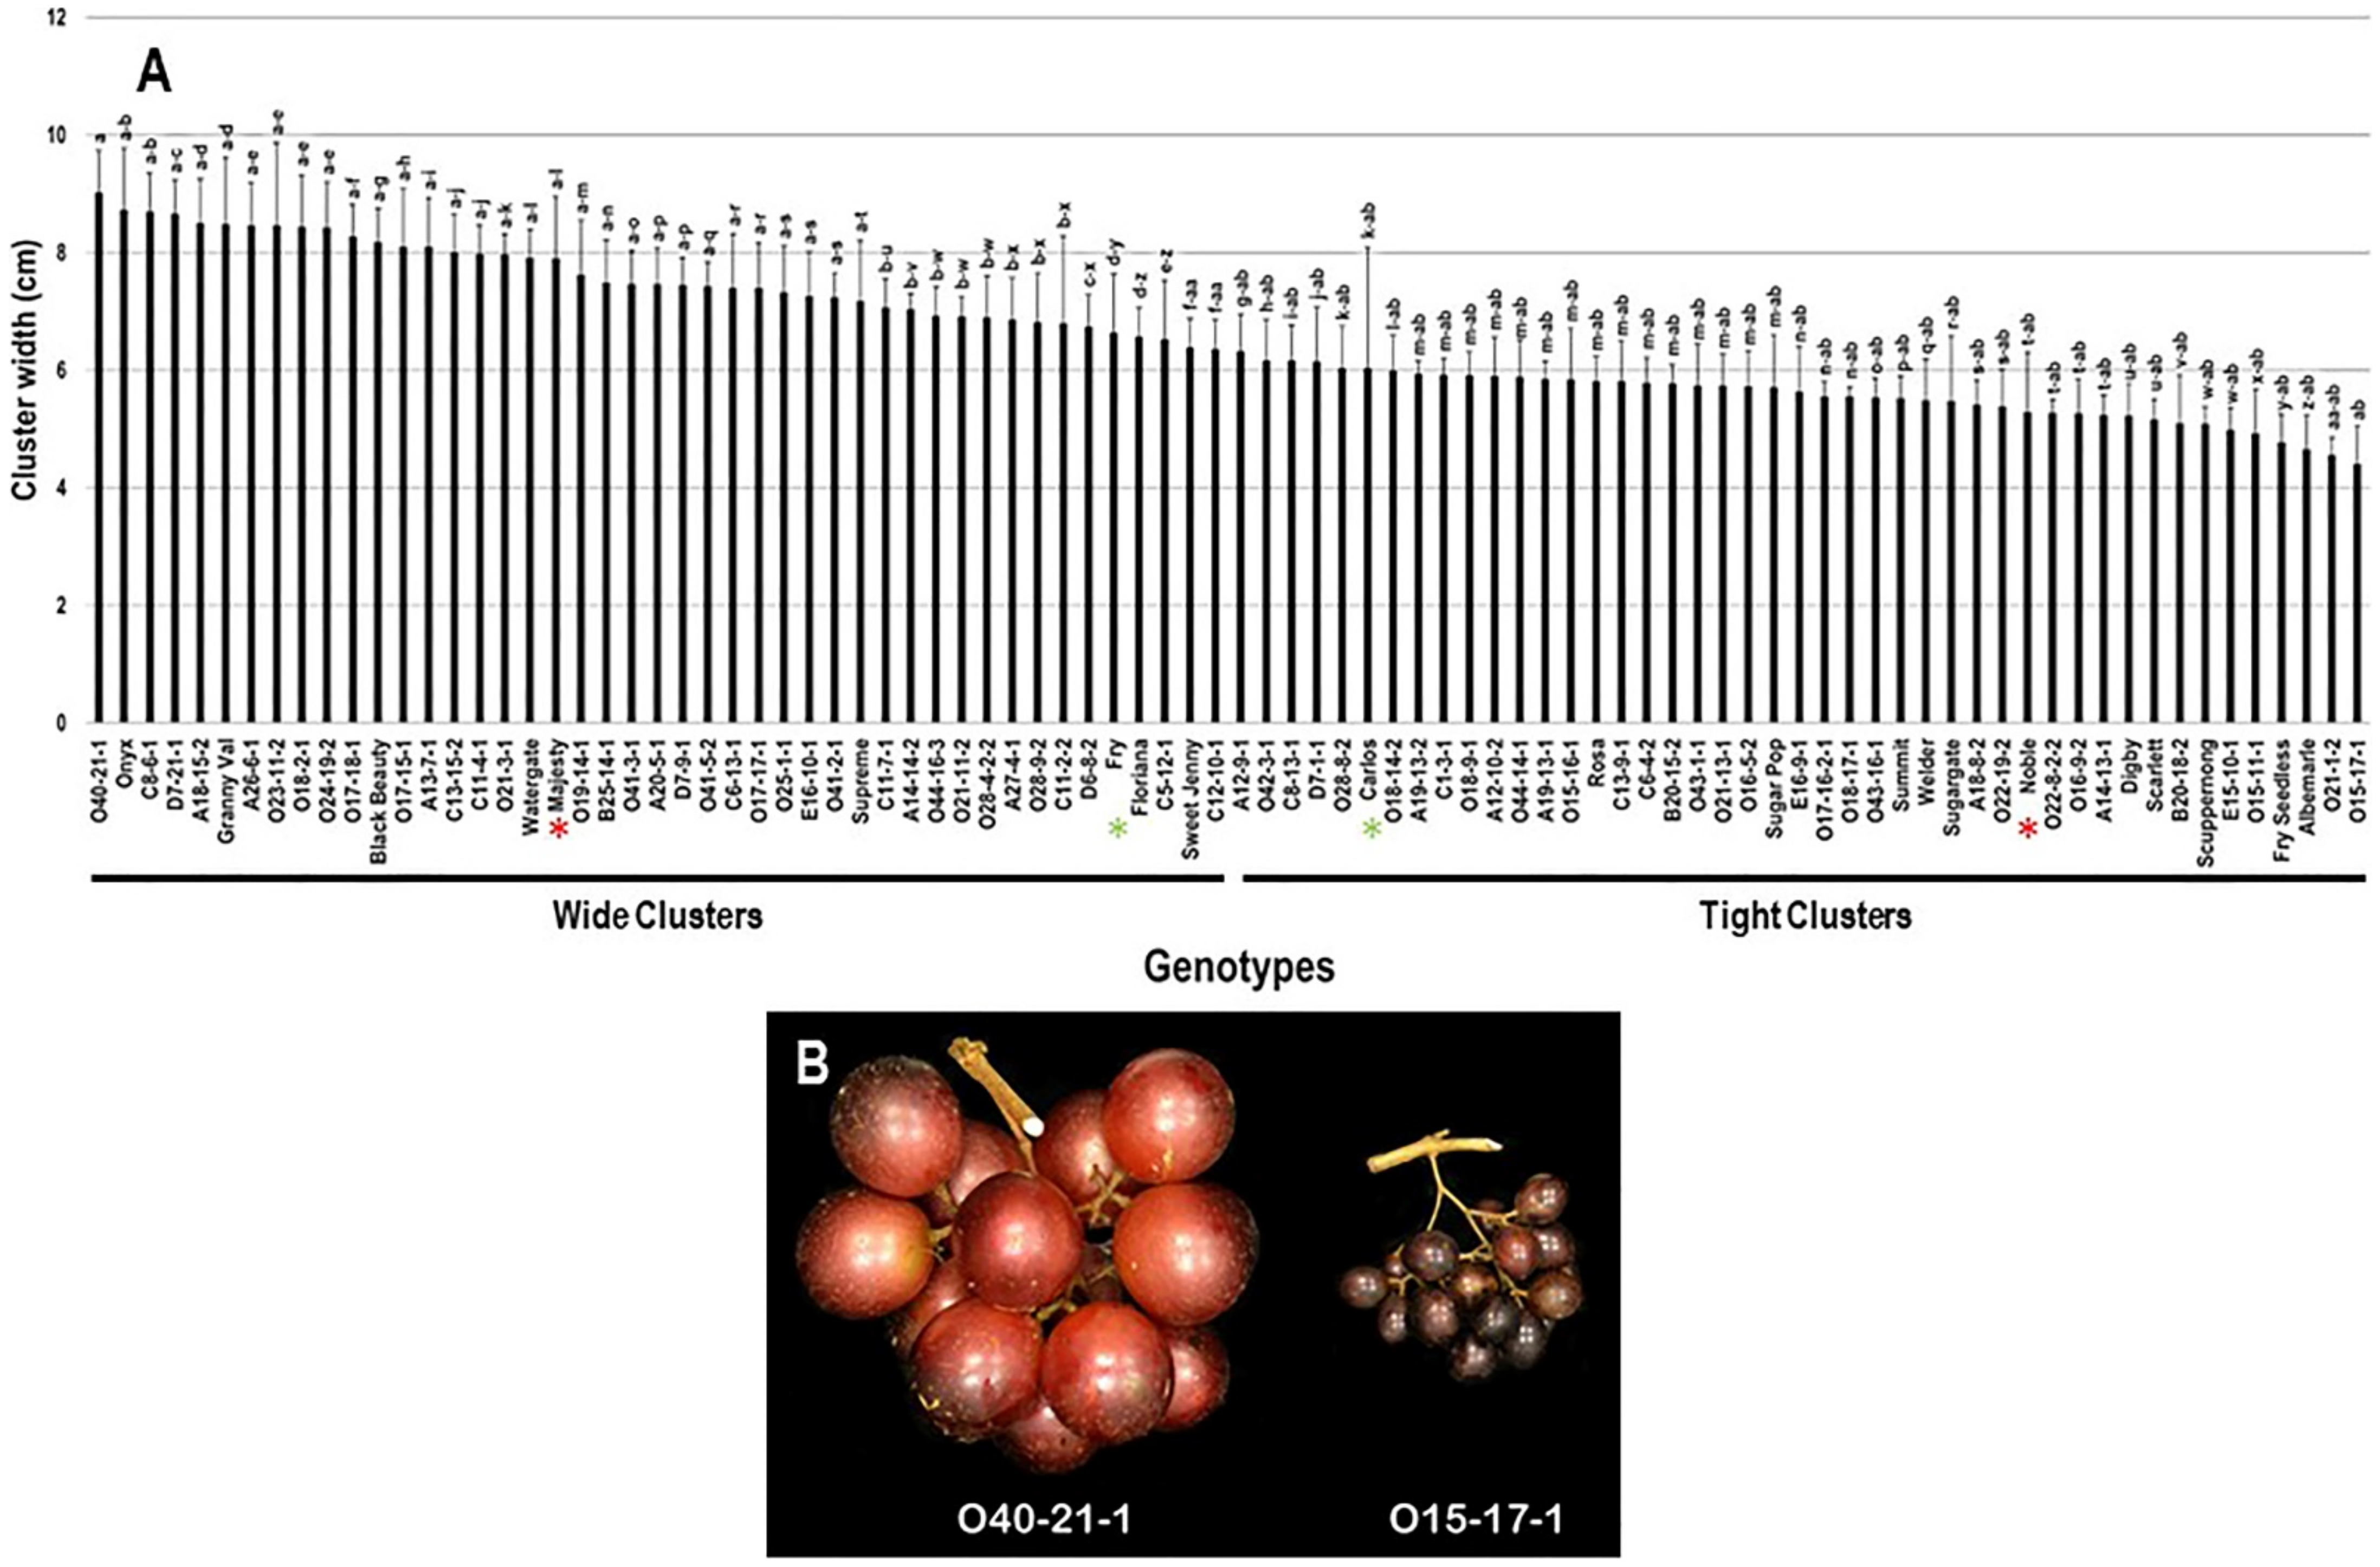
2.2.2. Cluster Width
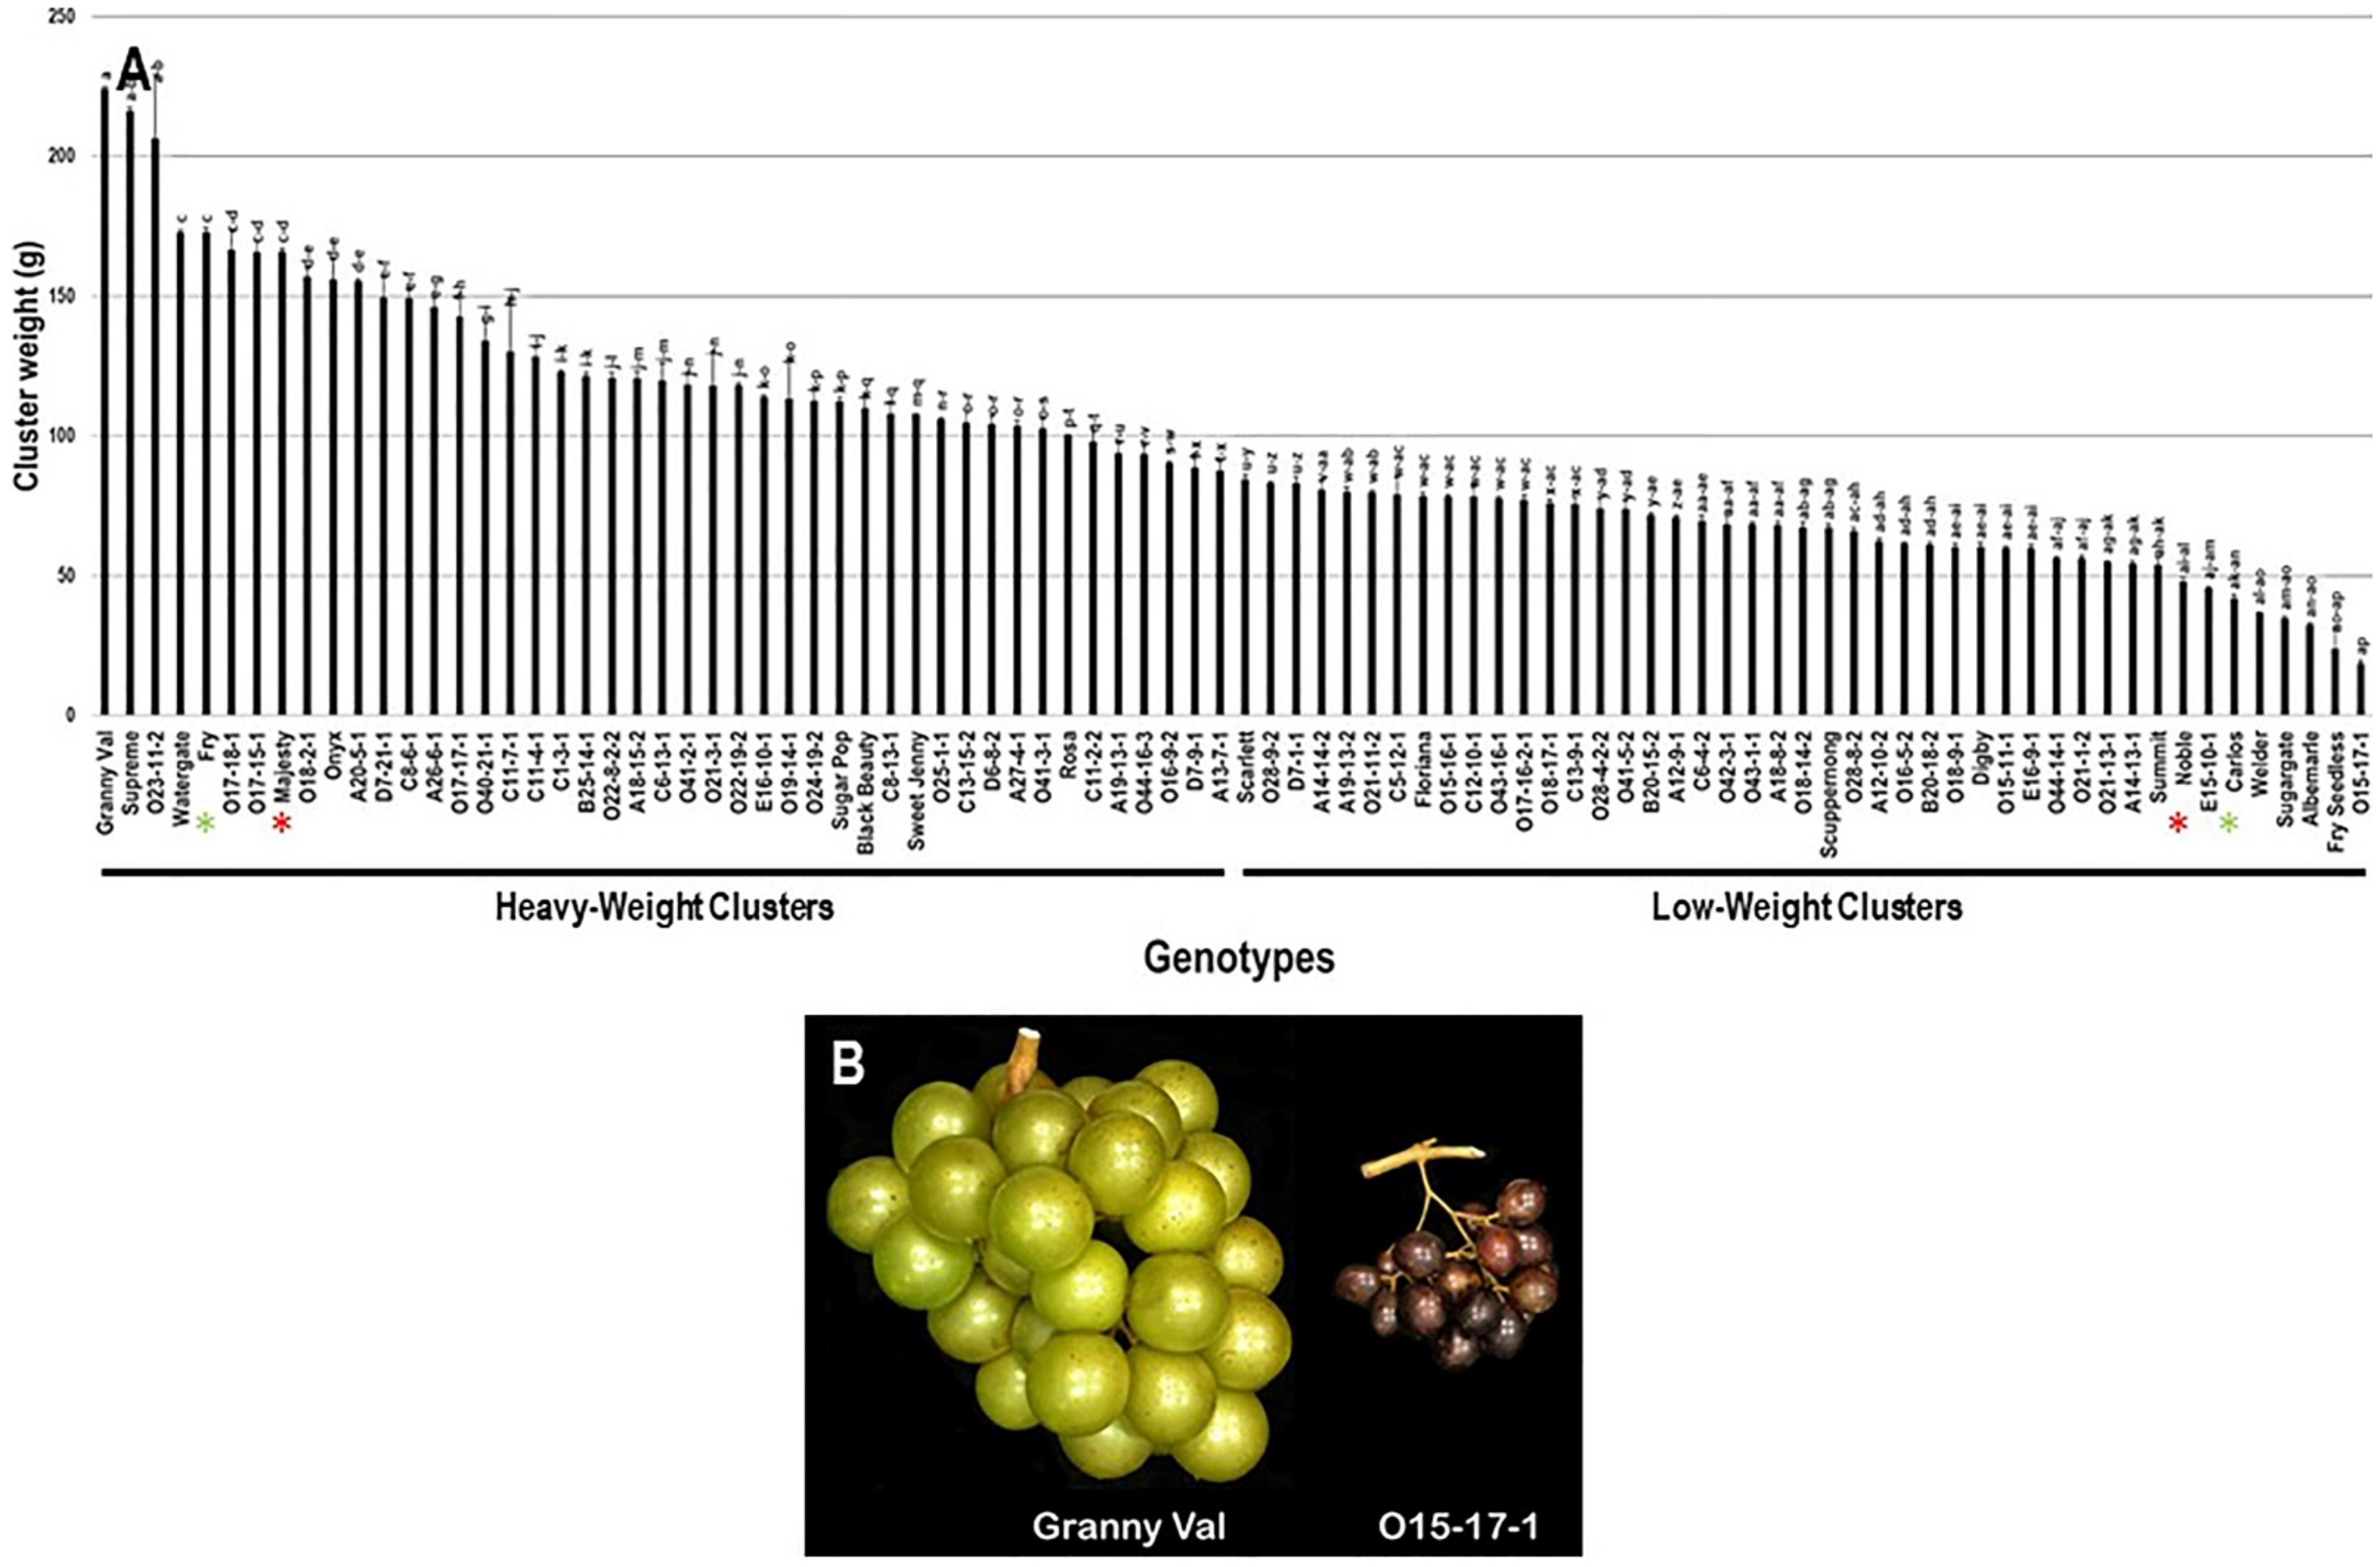
2.2.3. Cluster Weight
2.2.4. Number of Berries/Cluster
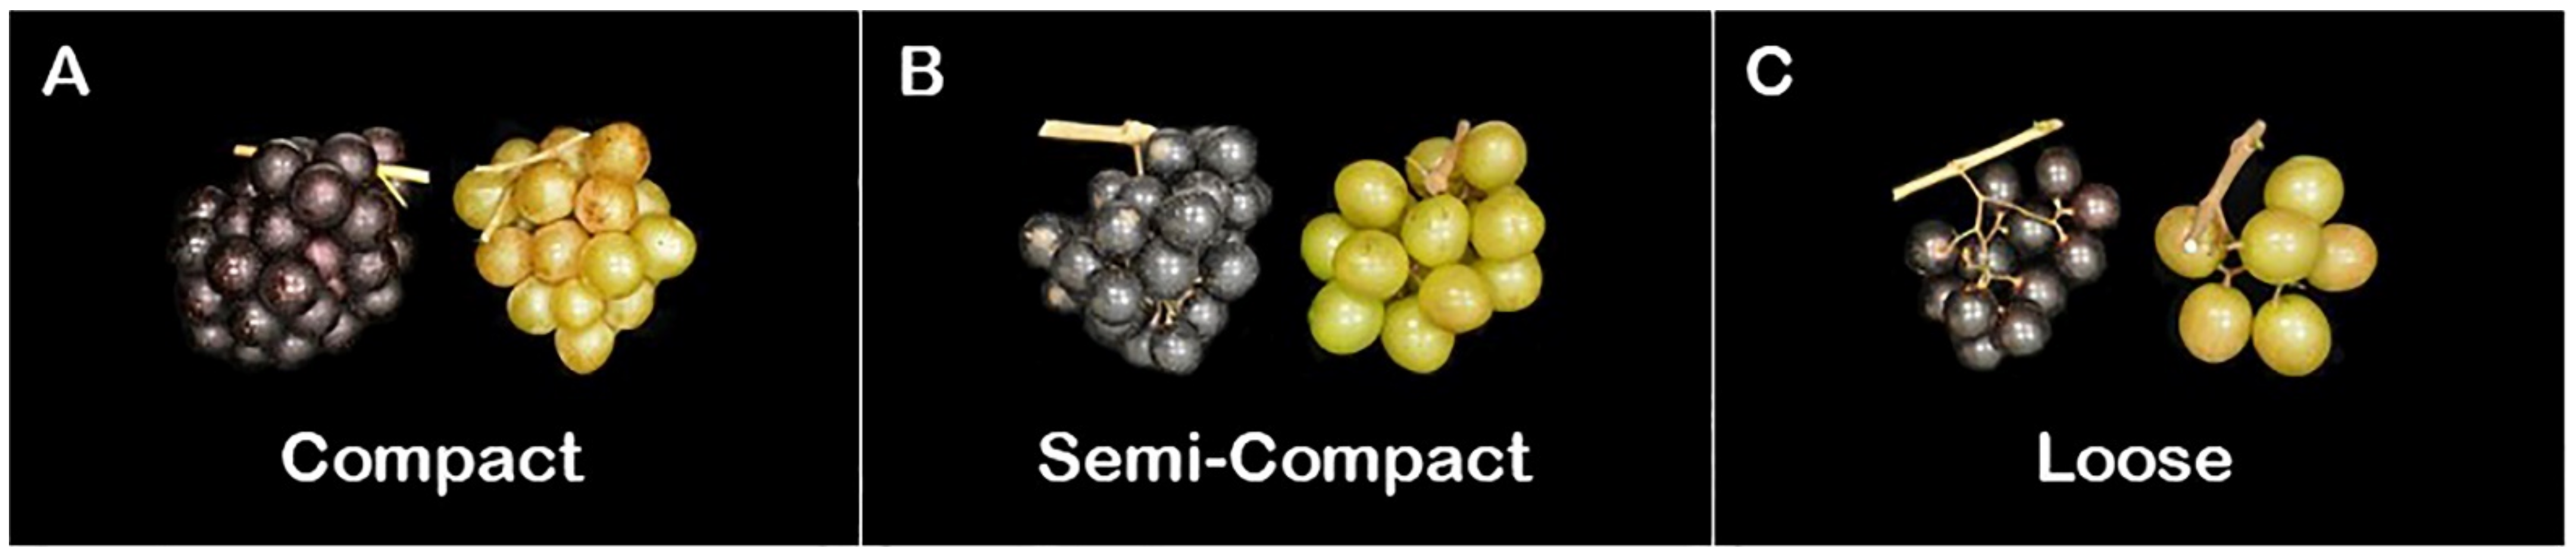
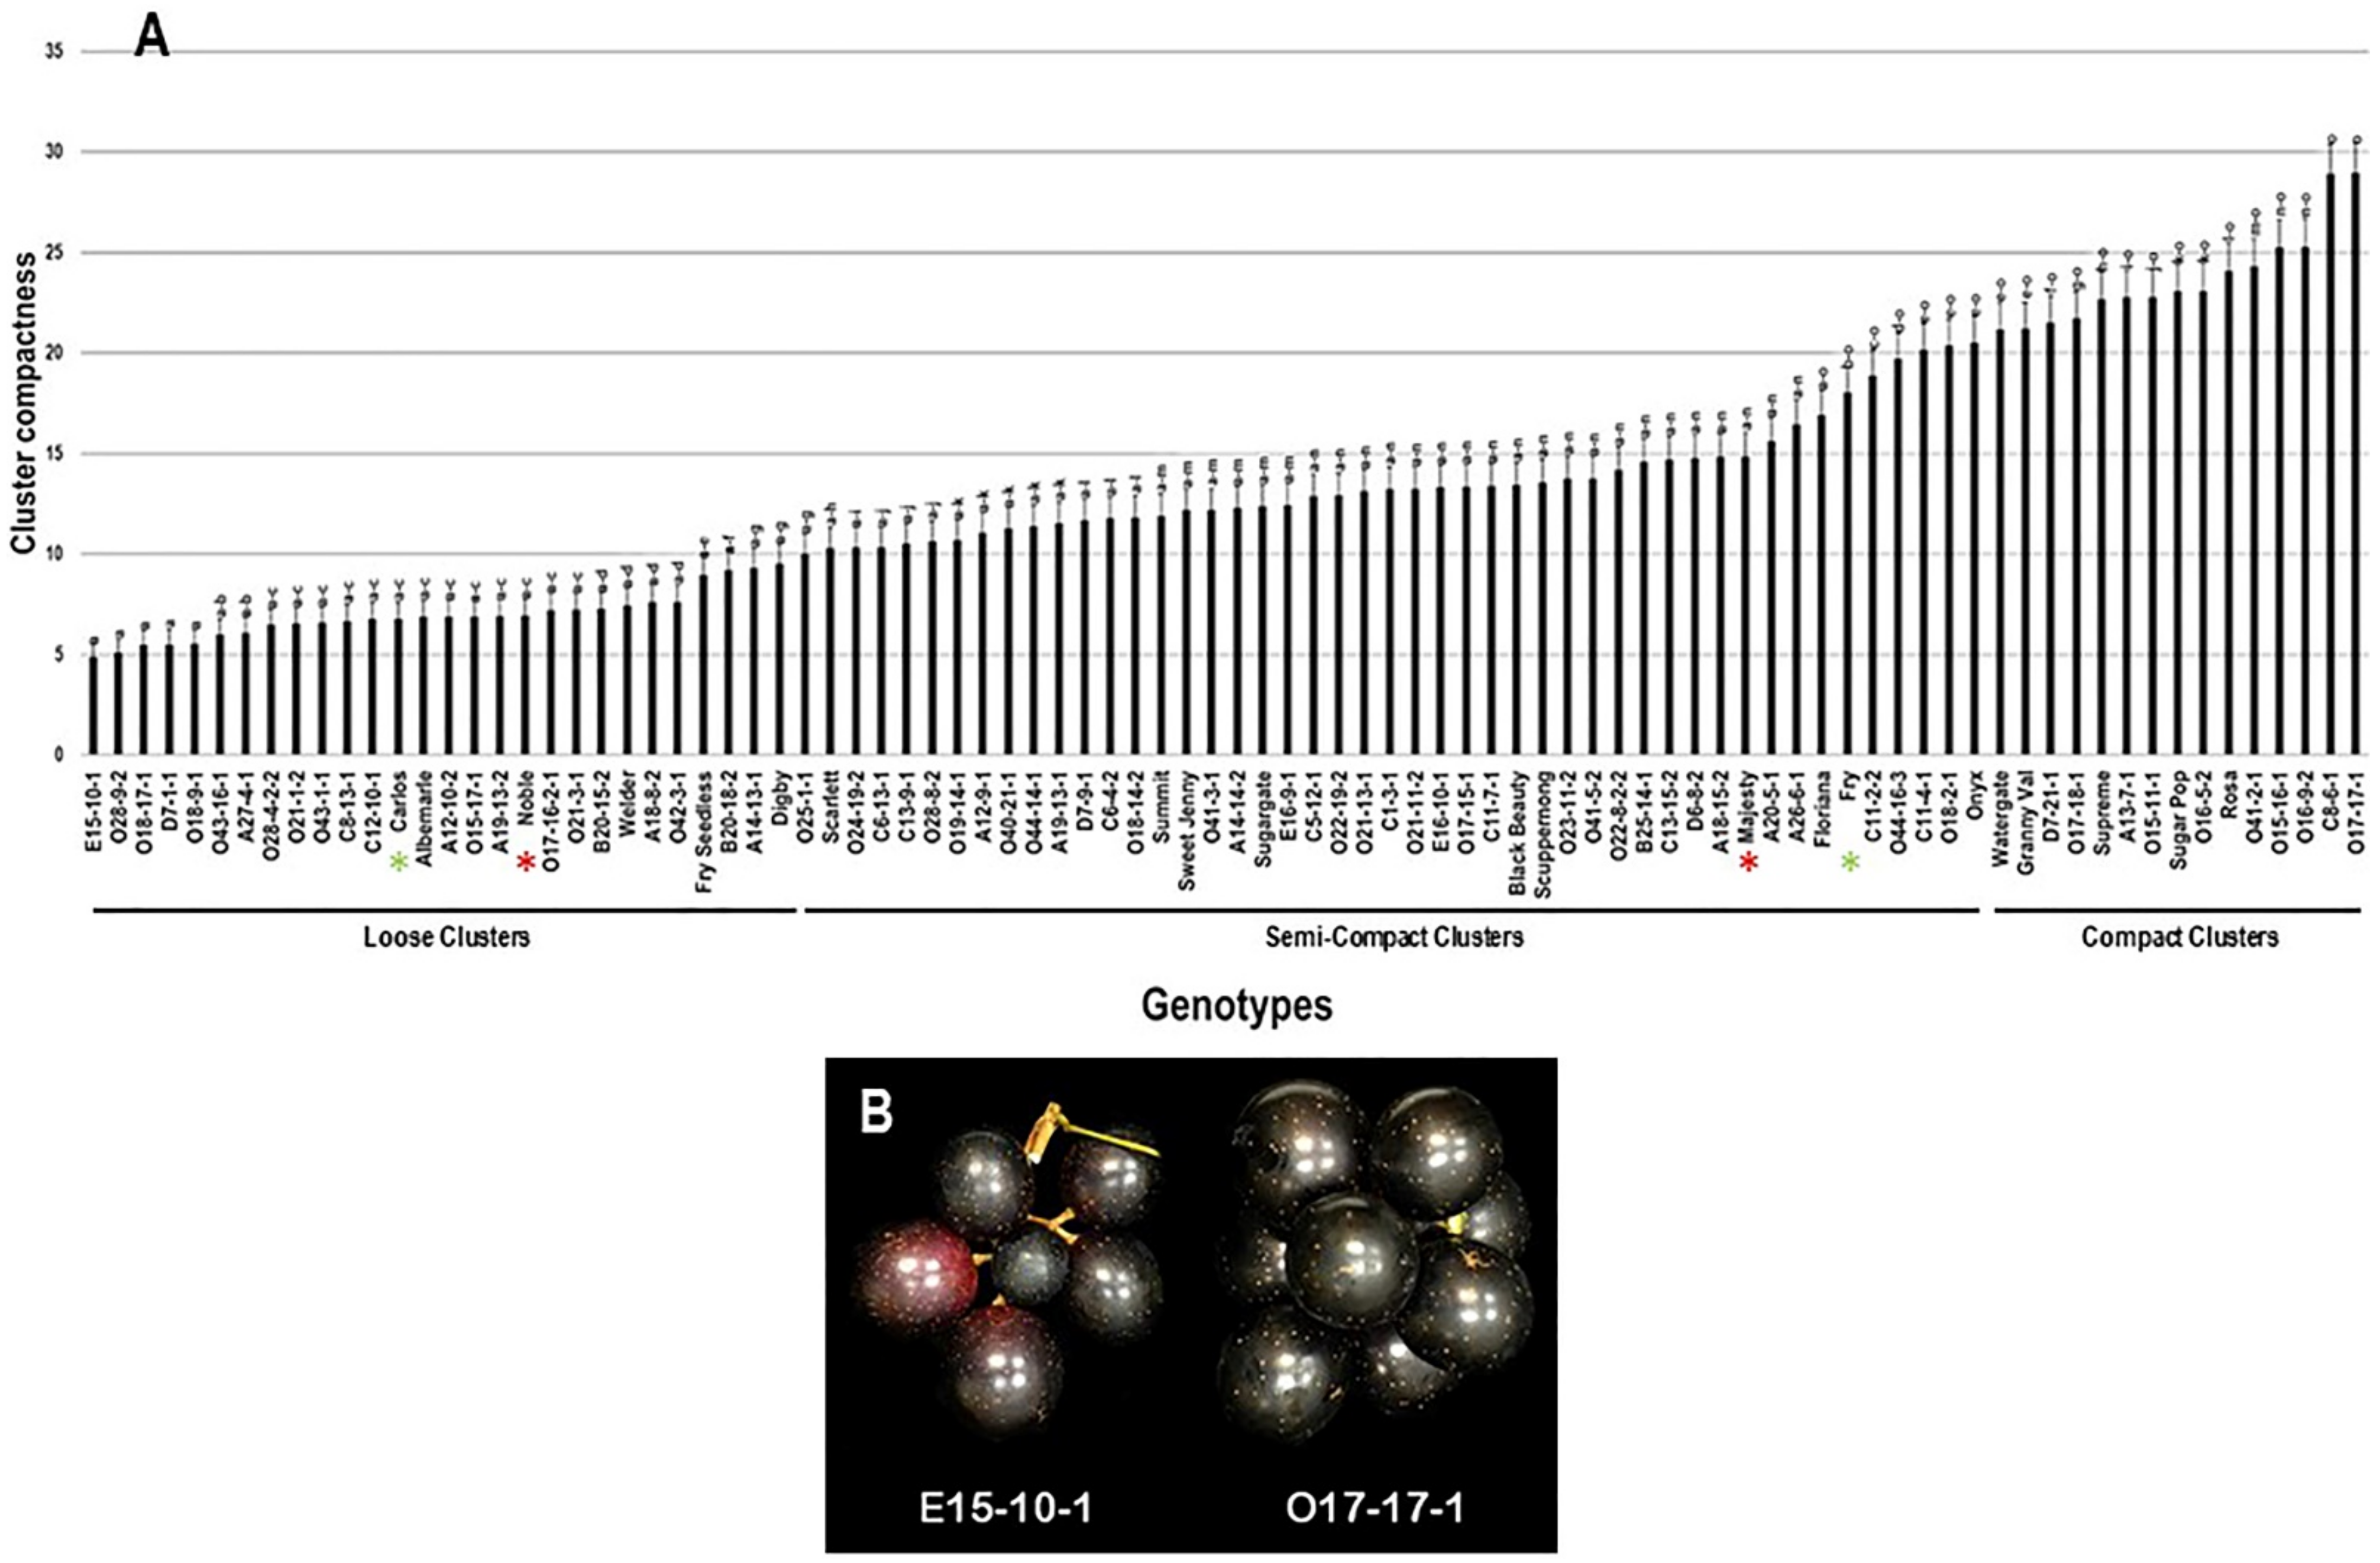
2.2.5. Cluster Compactness
2.2.6. Frequency Distribution of Cluster-Related Traits
2.3. Berry-Related Traits
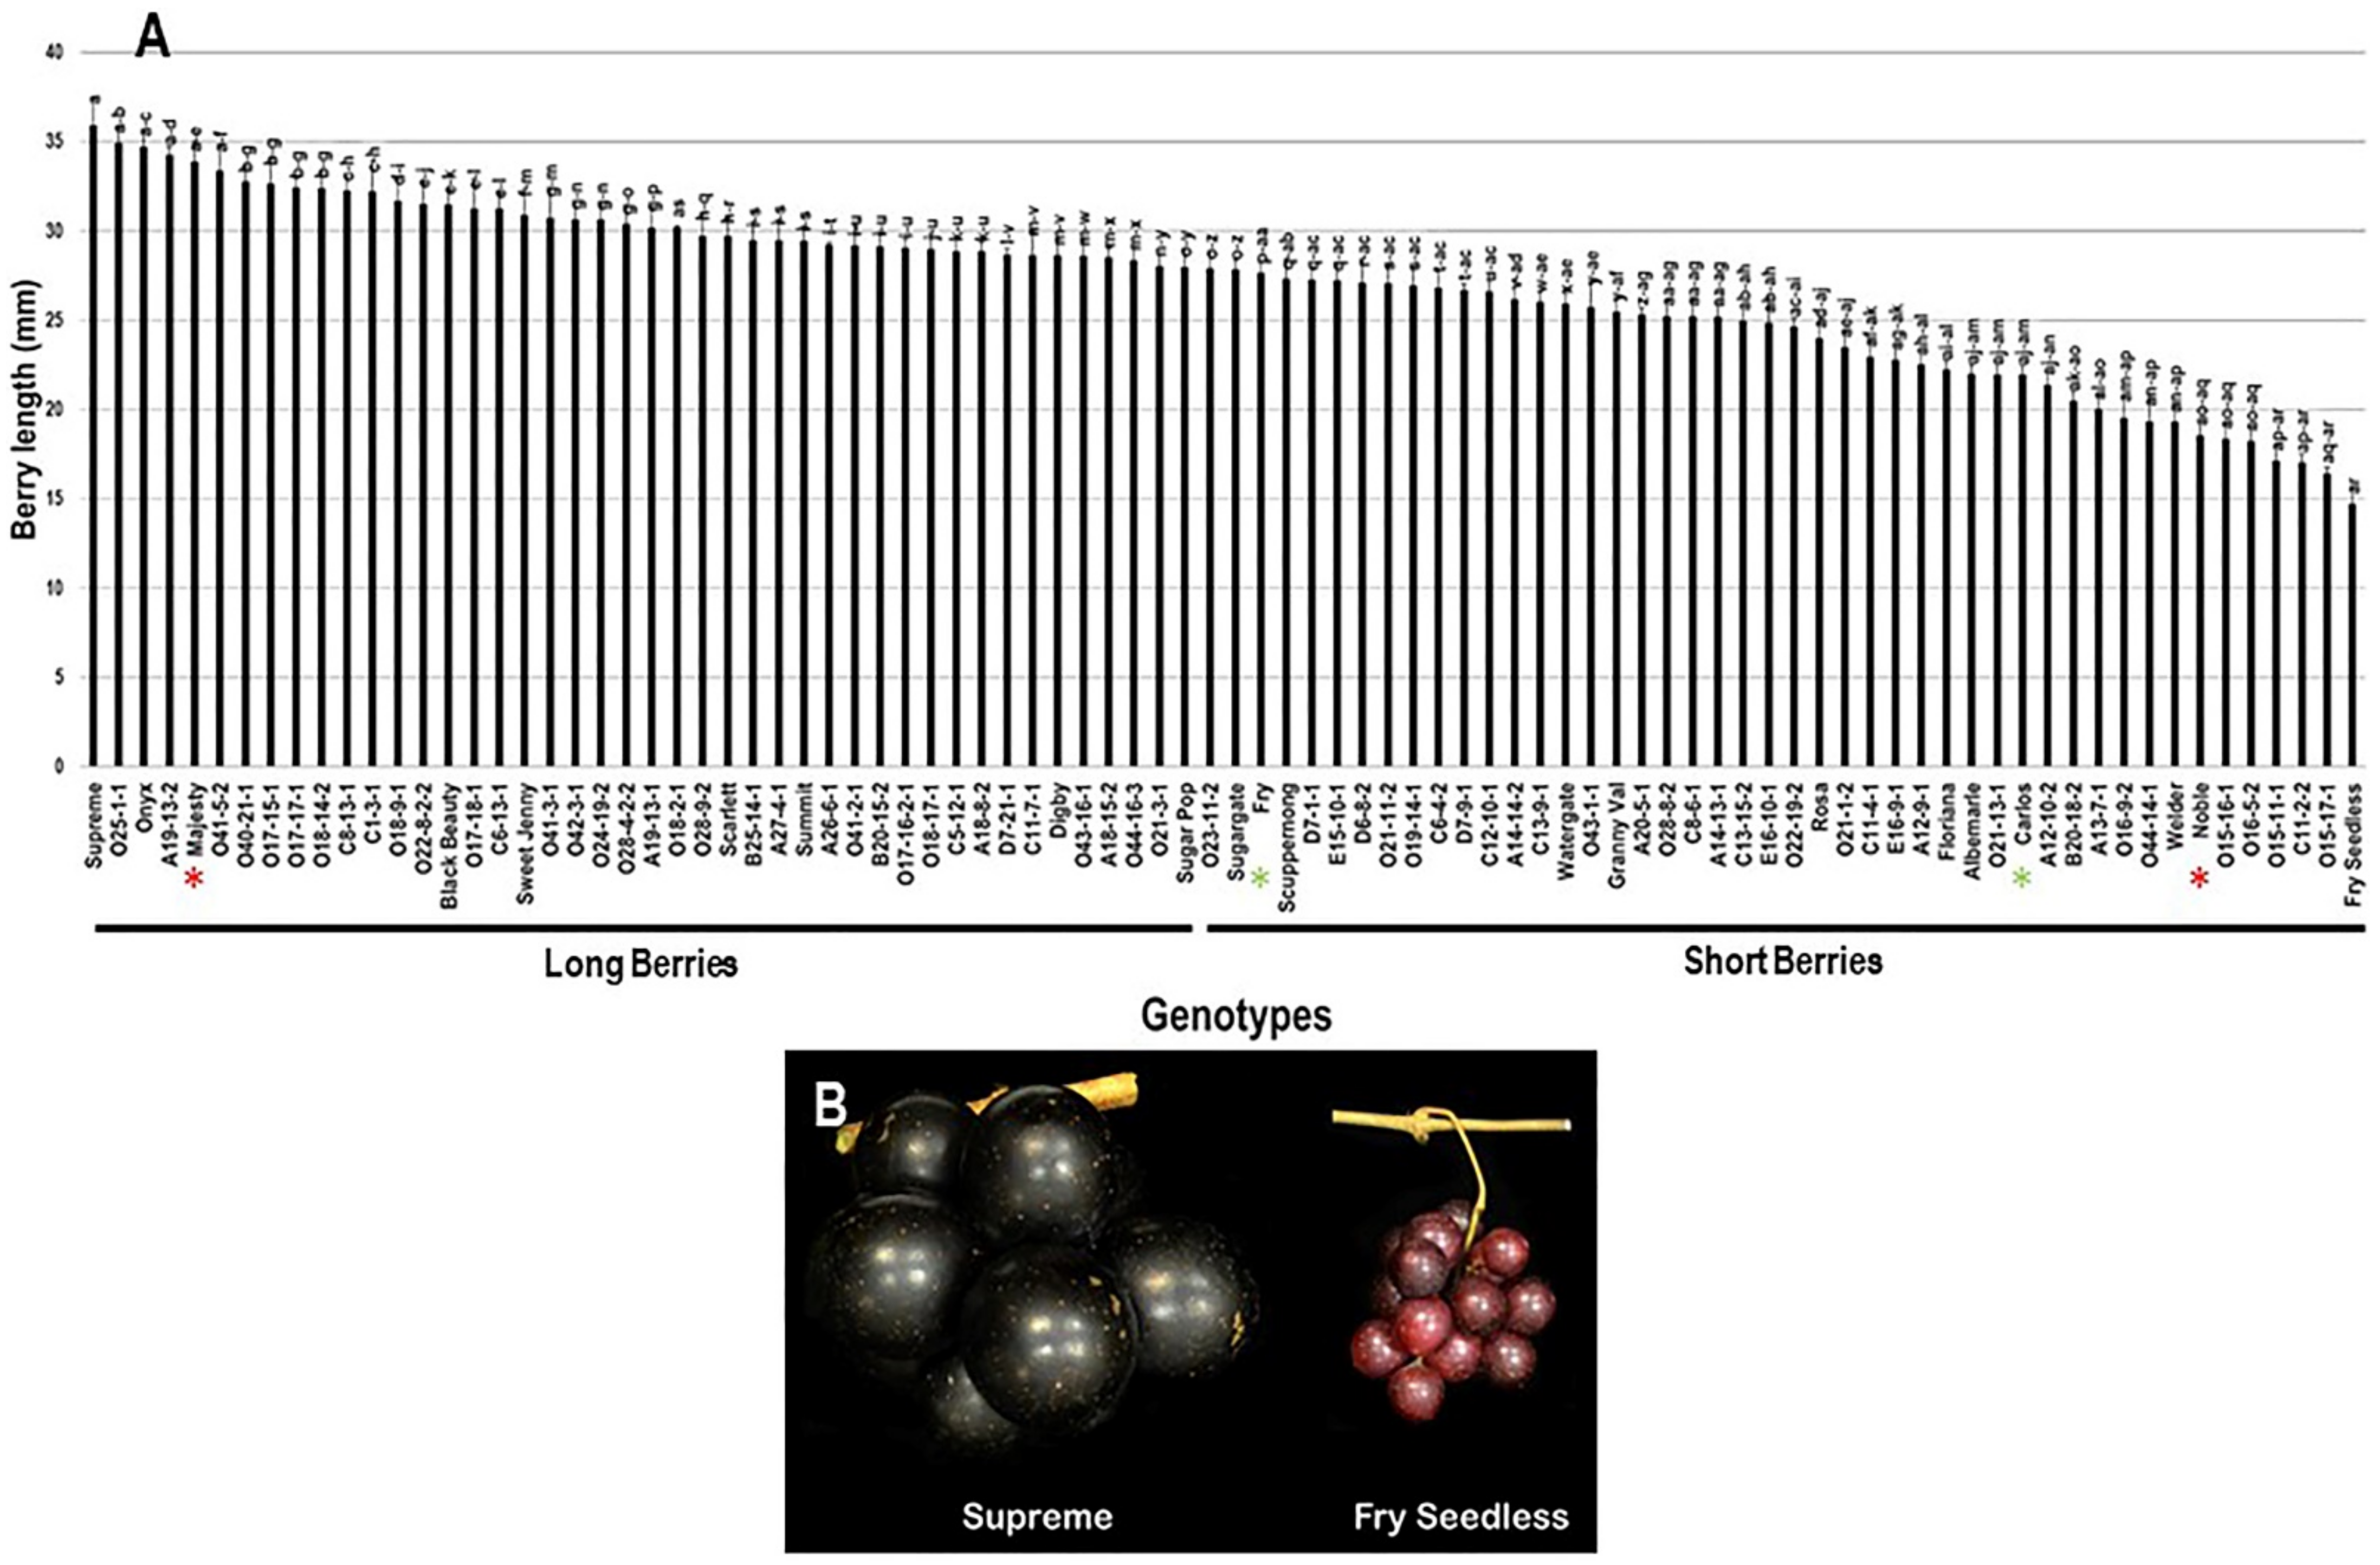
2.3.1. Berry Length
2.3.2. Berry Width
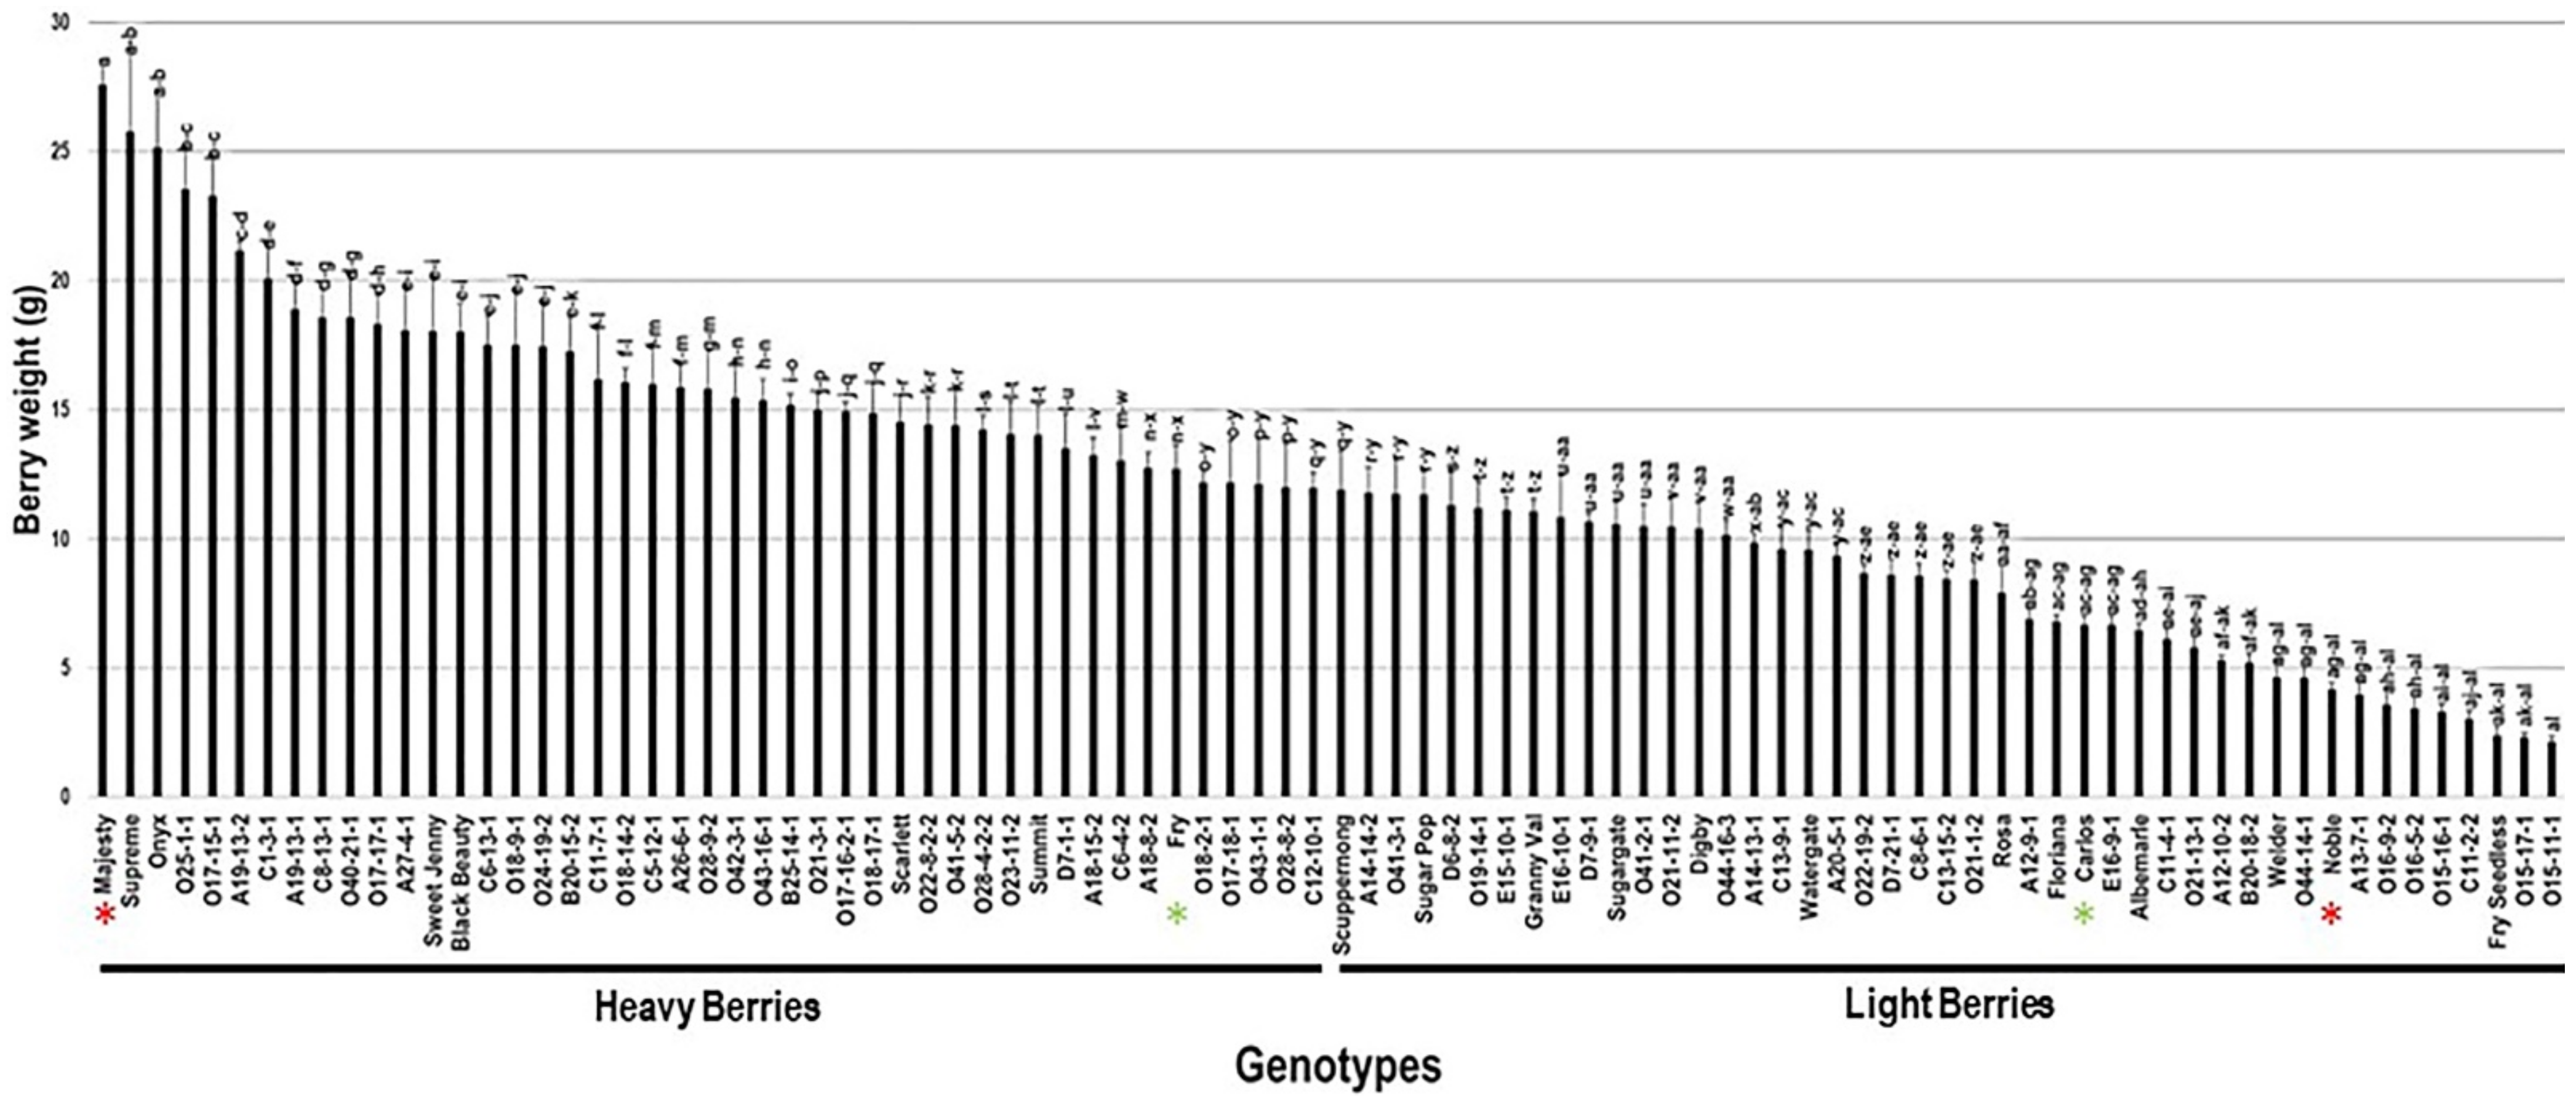
2.3.3. Berry Weight
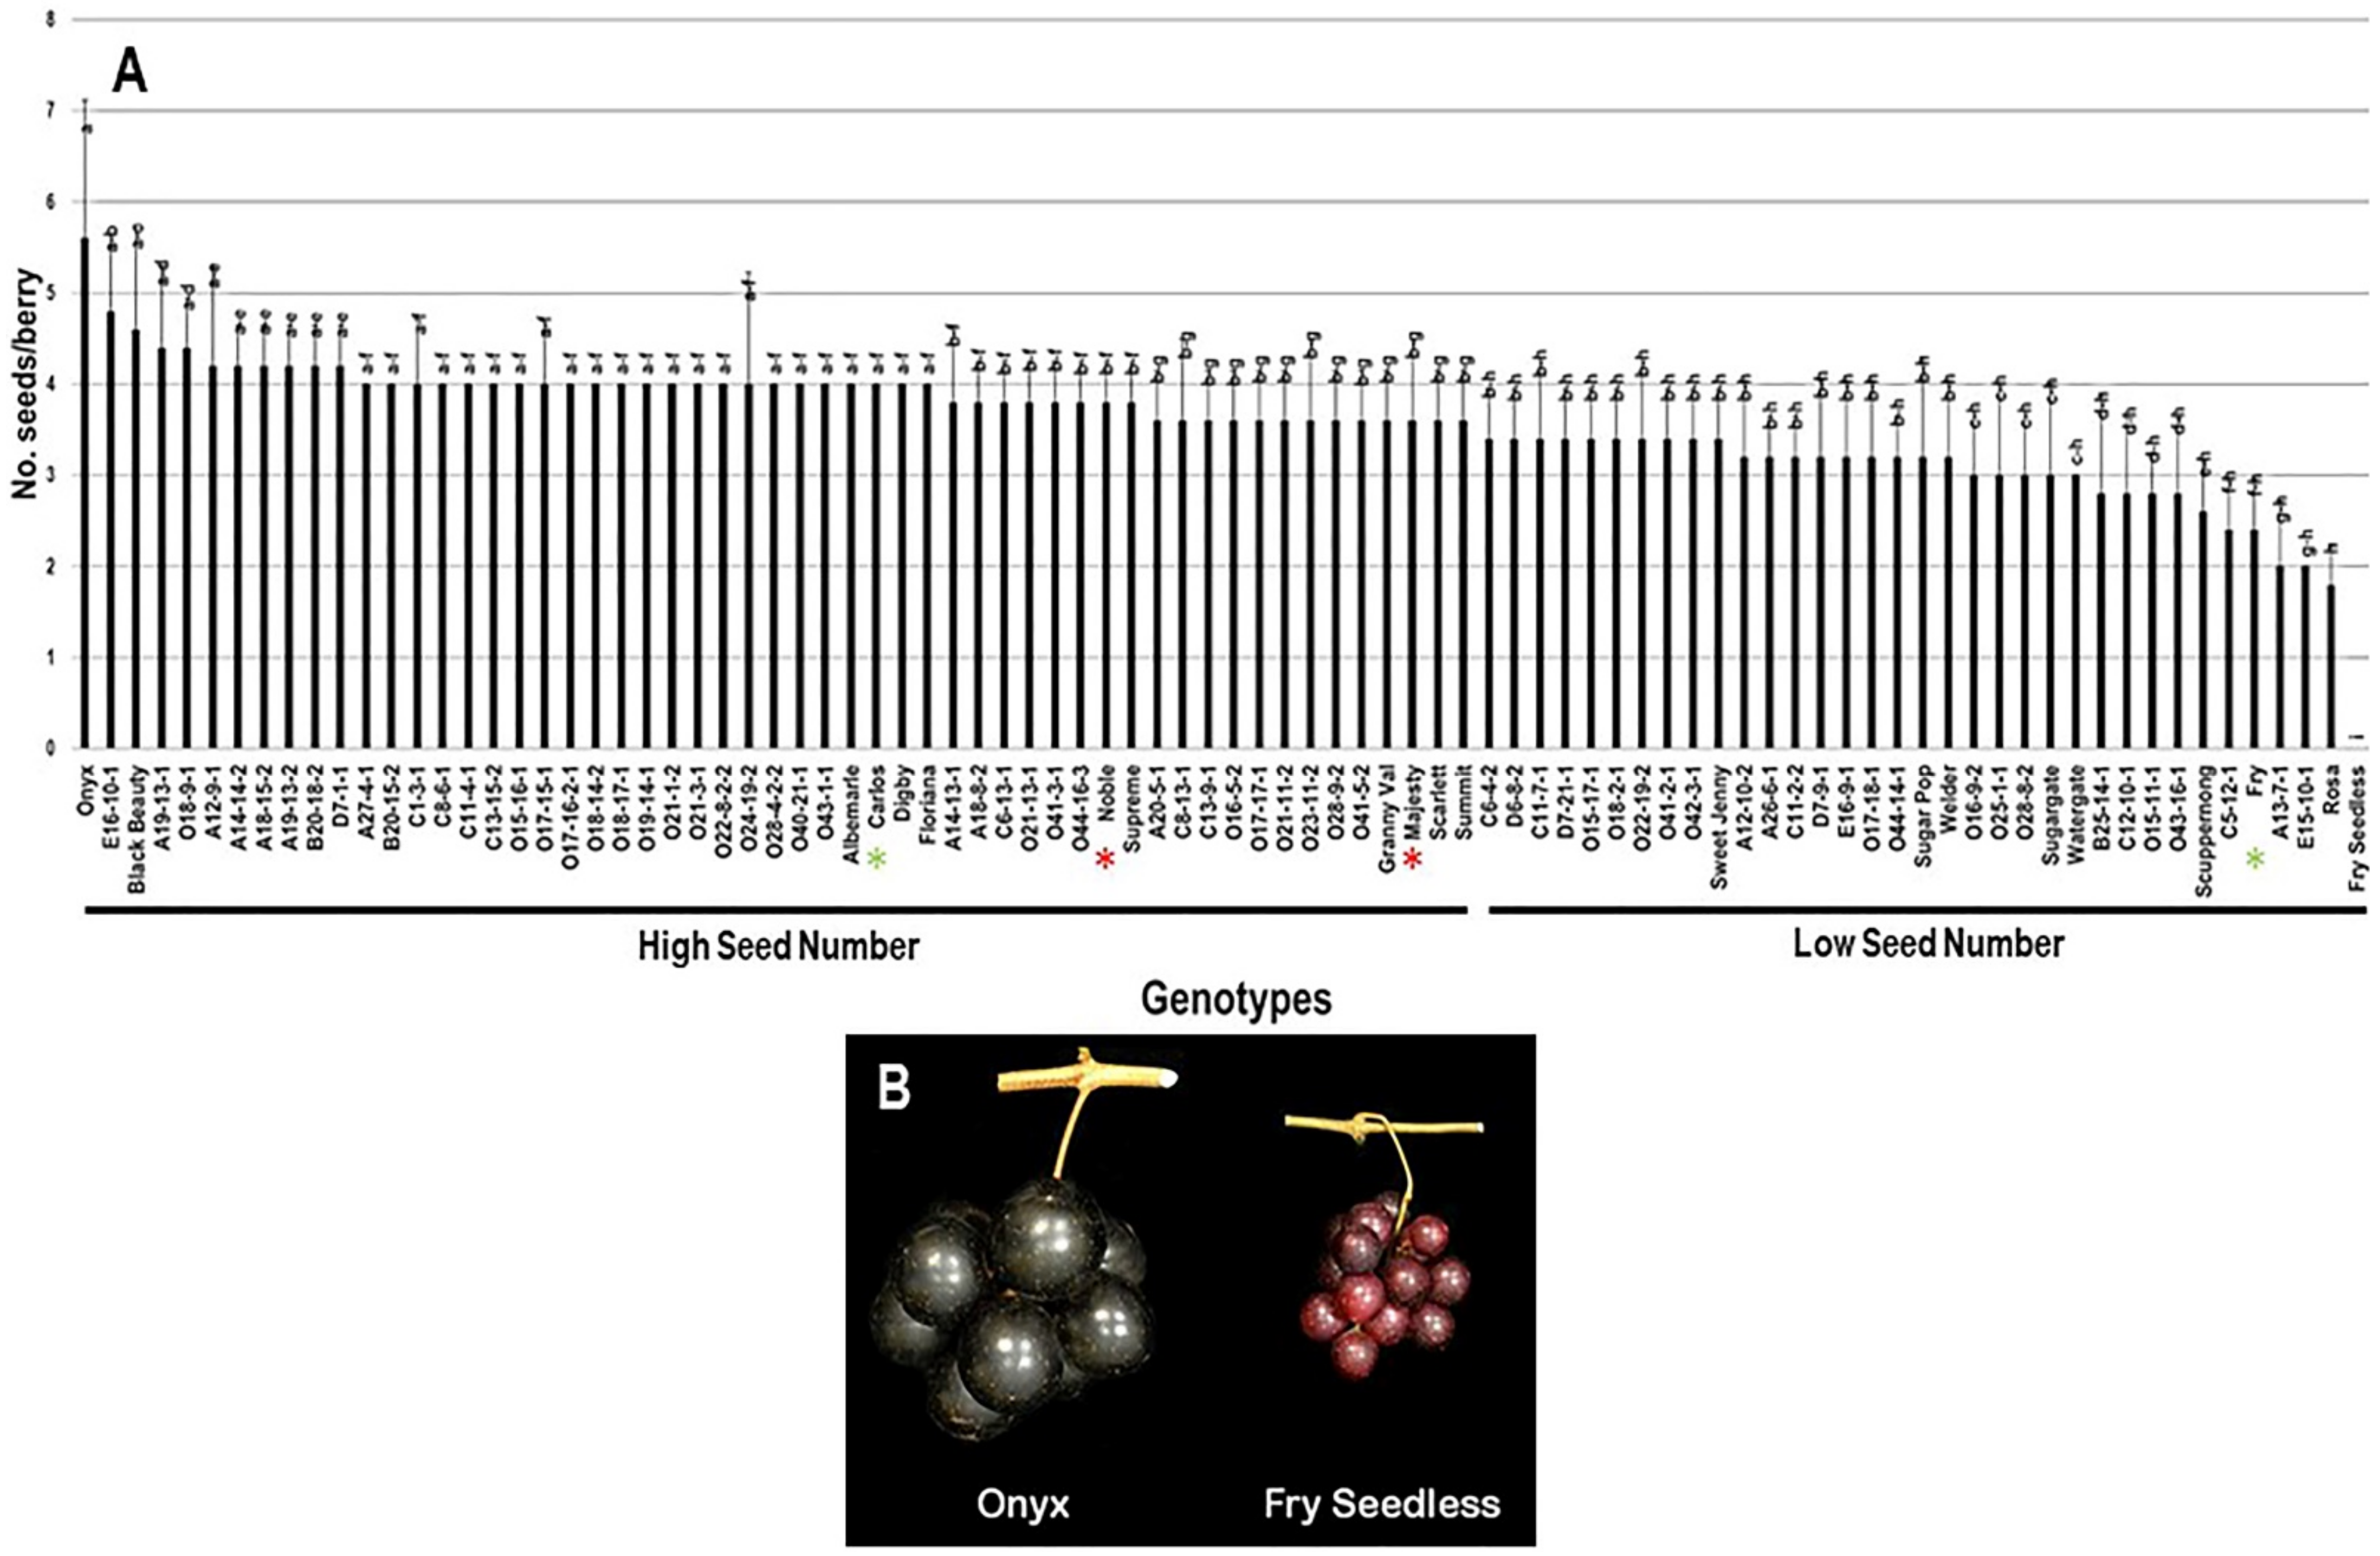
2.3.4. Number of Seeds/Berry (N.S/B)
2.3.5. Weight of Seeds/Berry (W.S/B)
2.3.6. Berry Firmness
2.3.7. Scar Pattern (SP)
2.4. Frequency Distribution of Berry-Related Traits
2.5. Classification of Muscadine Genotypes Based on the Evaluated Traits
2.6. Principal Component Analysis of Different Evaluated Traits
2.7. Dissimilarity Matrix Analysis among the Population
3. Discussion
4. Materials and Methods
4.1. Plant Material
4.2. Cluster-Related Traits
(mm)]/[Rachis length (cm) × Pedicel Length (mm)]
4.3. Berry-Related Traits
4.4. Statistical Analysis
5. Conclusions
Supplementary Materials
Author Contributions
Funding
Institutional Review Board Statement
Informed Consent Statement
Data Availability Statement
Acknowledgments
Conflicts of Interest
References
- O.I.V. OIV Vine and Wine Outlook 2010–2011; Organisation Internationale de la Vigne et du Vin: Paris, France, 2013. [Google Scholar]
- Cliff, M.A.; Dever, M.C.; Reynolds, A.G. Descriptive profiling of new and commercial British Columbia table grape cultivars. Am. J. Enol. Vitic. 1996, 47, 301–308. [Google Scholar]
- Crisosto, C.H.; Crisosto, G.M. Understanding American and Chinese consumer acceptance of “Redglobe” table grapes. Postharvest Biol. Technol. 2002, 24, 155–162. [Google Scholar] [CrossRef]
- Fillion, L.; Kilcast, D. Consumer perception of crispness and crunchiness in fruits and vegetables. Food Qual. Prefer. 2002, 13, 23–29. [Google Scholar] [CrossRef]
- Péneau, S.; Hoehn, E.; Roth, H.R.; Escher, F.; Nuessli, J. Importance and consumer perception of freshness of apples. Food Qual. Prefer. 2006, 17, 9–19. [Google Scholar] [CrossRef]
- Piva, C.R.; Lopez Garcia, J.L.; Morgan, W. Evaluation of the acceptability level for the Italy, Napoleon and Redglobe varieties on the Spanish market. Rev. Bras. Frutic. 2008, 30, 361–364. [Google Scholar] [CrossRef]
- Cochetel, N.; Minio, A.; Massonnet, M.; Vondras, A.M.; Figueroa-Balderas, R.; Cantu, D. Diploid chromosome-scale assembly of the Muscadinia rotundifolia genome supports chromosome fusion and disease resistance gene expansion during Vitis and Muscadinia divergence. G3 2021, 11, jkab033. [Google Scholar] [CrossRef] [PubMed]
- Olmo, H. The potential role of (vinifera x rotundifolia) hybrids in grape variety improvement. Experientia 1986, 42, 921–926. [Google Scholar] [CrossRef]
- Narduzzi, L.; Stanstrup, J.; Mattivi, F. Comparing wild American grapes with Vitis vinifera: A metabolomics study of grape composition. J. Agric. Food Chem. 2015, 63, 6823–6834. [Google Scholar] [CrossRef]
- Coito, J.L.; Silva, H.G.; Ramos, M.J.; Cunha, J.; Eiras-Dias, J.; Amâncio, S.; Costa, M.M.; Rocheta, M. Vitis flower types: From the wild to crop plants. PeerJ 2019, 7, e7879. [Google Scholar] [CrossRef] [PubMed]
- Punyasena, S.W.; Smith, S.Y. Bioinformatic and biometric methods in plant morphology. Appl. Plant. Sci. 2014, 2, 647. [Google Scholar] [CrossRef]
- Goenaga, R. Accumulation and partitioning of dry matter in taro [Colocasia esculenta (L.) Schott]. Ann. Bot. 1995, 76, 337–341. [Google Scholar] [CrossRef]
- Maltoni, D.; Maio, D.; Jain, A.; Prabhakar, S. Handbook of Fingerprint Recognition; Springer: New York, NY, USA, 2003. [Google Scholar]
- Reimer, F.C.; Detjen, L.R. Self-Sterility of the Scuppernong and Other Muscadine Grapes; 209; North Carolina Agricultural Experiment Station: Raleigh, NC, USA, 1910.
- Detjen, L.R. Inheritance of Sex. In Vitis Rotundifolia; 12; North Carolina Agricultural Experiment Station: Raleigh, NC, USA, 1917. [Google Scholar]
- Kicherer, A.; Roscher, R.; Herzog, K.; Förstner, W.; Töpfer, R. Image based evaluation for the detection of cluster parameters in grapevine. Acta Hortic. 2014, 1082, 335–340. [Google Scholar] [CrossRef]
- Naegele, R.P.; Clark, M.; Martinson, T. Getting the perfect cluster shape: Defining traits and developing DNA markers. Am. Vineyard 2020, 29, 22–25. [Google Scholar]
- Morris, J.R.; Brady, P.L. The Muscadine Experience: Adding Value to Enhance Profits; 974; Arkansas Agricultural Experiment Station: Fayetteville, AR, USA, 2004. [Google Scholar]
- Rolle, L.; Giacosa, S.; Gerbi, V.; Bertolino, M.; Novello, V. Varietal comparison of the chemical, physical, and mechanical properties of five colored table grapes. Int. J. Food Prop. 2013, 16, 598–612. [Google Scholar] [CrossRef]
- Vargas, A.; Perez, J.; Pablo Zoffoli, J.; Perez, A. Evolution of the texture in Thompson seedless berries. Cien. Investig. Agrar. 2000, 27, 117–126. [Google Scholar] [CrossRef]
- Le Moigne, M.; Maury, C.; Bertrand, D.; Jourjon, F. Sensory and instrumental characterisation of Cabernet Franc grapes according to ripening stages and growing location. Food Qual. Prefer. 2008, 19, 220–231. [Google Scholar] [CrossRef]
- Maury, C.; Madieta, E.; Le Moigne, M.; Mehinagic, E.; Siret, R.; Jourjon, F. Development of a mechanical texture test to evaluate the ripening process of Cabernet Franc grapes. J. Texture Stud. 2009, 40, 511–535. [Google Scholar] [CrossRef]
- Nuzzo, V.; Matthews, M. Berry size and yield paradigms on grapes and wines quality. Acta Hortic. 2007, 754, 423–436. [Google Scholar]
- Singleton, V. Effects on red wine quality of removing juice before fermentation to simulate variation in berry size. Am. J. Enol. Vitic. 1972, 23, 106–113. [Google Scholar]
- Coombe, B.G. Research on development and ripening of the grape berry. Am. J. Enol. Vitic. 1992, 43, 101–110. [Google Scholar]
- Mullins, M.G.; Bouquet, A.; Williams, L.E. Biology of the Grapevine; Cambridge University Press: New York, NY, USA, 1992. [Google Scholar]
- Du Plessis, B.W. Cellular Factors That Affect Table Grape Berry Firmness. Master’s Thesis, Stellenbosch University, Stellenbosch, South Africa, 29 February 2008. [Google Scholar]
- Bernstein, Z. A new method of firmness measurement of grape berries and other juicy fruits. Vitis 1981, 20, 15–21. [Google Scholar]
- Fuentes, S.; Manso, A.; Fenoll, J.; Cava, J.; Garrido, I.; Molina, M.; Flores, P.; Hellín, P. Optimizing the methodology to measure firmness of grape berries (Vitis vinifera L.) during ripening. Acta Hortic. 2018, 1194, 1103–1110. [Google Scholar] [CrossRef]
- Kok, D.; Celik, S. Determination of characteristics of grape berry skin in some table grape cultivars (V. vinifera L.). Agron. J. 2004, 3, 141–146. [Google Scholar]
- Stafne, E. Establishment and Production of Muscadine Grapes; Mississippi State University Extension Service: Starkville, MS, USA, 2016. [Google Scholar]
- Hoffman, M.; Conner, P.; Brannen, P.; Burrack, H.; Mitchem, W.; Cline, B.; Perkins-Veazie, P.; Poling, B. Muscadine Grape Production Guide for the Southeast; NC State Extension, NC State University: Raleigh, NC, USA, 2020. [Google Scholar]
- Sandhu, A.K.; Gu, L. Antioxidant capacity, phenolic content, and profiling of phenolic compounds in the seeds, skin, and pulp of Vitis rotundifolia (muscadine grapes) as determined by HPLC-DAD-ESI-MS n. J. Agric. Food Chem. 2010, 58, 4681–4692. [Google Scholar] [CrossRef] [PubMed]
- Carroll, D.E. Evaluation of sparkling wines produced from muscadine cultivars (Vitis rotundifolia Michx.). Am. J. Enol. Vitic. 1984, 35, 72–74. [Google Scholar]
- Olien, W. The muscadine grape: Botany, viticulture, history, and current industry. HortScience 1990, 25, 732–739. [Google Scholar] [CrossRef]
- Conner, P.J. Performance of muscadine grape cultivars in southern Georgia. J. Am. Pomol. Soc. 2009, 63, 101–107. [Google Scholar]
- Lu, J.; Ren, Z.-b.; Xu, X. Muscadine Grape Plant Named ‘Majesty’. U.S. Patent No. PP21,965, 7 June 2011. [Google Scholar]


| Genotype | Flower | Cluster Wgt. (g) | No. Berries/Cluster | Cluster Compactness | Yield (kg) |
|---|---|---|---|---|---|
| Carlos * | Perfect | 41.9 ± 1.4 | 7.6 ± 0.6 | 6.8 ± 0.8 | 5.4 ± 0.8 |
| C8-6-1 | Female | 149.1 ± 3.1 | 20.8 ± 2.7 | 28.9 ± 1.5 | 17.3 ± 1.5 |
| O44-14-1 | Perfect | 56.4 ± 0.6 | 13.8 ± 0.4 | 11.4 ± 1.1 | 9.9 ± 1.0 |
| Noble * | Perfect | 47.8 ± 1.5 | 12.2 ± 0.4 | 6.9 ± 0.8 | 3.9 ± 0.4 |
| B20-18-2 | Perfect | 61.1 ± 1.1 | 13.2 ± 1.1 | 9.2 ± 1.0 | 11.2 ± 1.2 |
| C11-2-2 | Perfect | 97.9 ± 5.7 | 27.6 ± 4.7 | 18.9 ± 1.3 | 11.3 ± 1.6 |
| Average ** | - | 96.9 ± 42.7 | 11.1 ± 6.8 | 13.2 ± 6.1 | 6.6 ± 4.5 |
| Median | - | 88.1 | 8.7 | 12.2 | 5.3 |
| Genotype | Color | Berry Wgt. (g) | Dry Scar (%) | Firmness (N) | No. Seeds/Berry | Wgt. Seeds/Berry (g) |
|---|---|---|---|---|---|---|
| Carlos * | Bronze | 6.7 ± 0.4 | 54 ± 1.1 | 0.16 ± 0.04 | 4.0 ± 0 | 0.34 ± 0.05 |
| C8-6-1 | Bronze | 8.6 ± 0.5 | 18 ± 0.9 | 0.10 ± 0 | 4.0 ± 0 | 0.44 ± 0.05 |
| O44-14-1 | Bronze | 4.6 ± 0.5 | 72 ± 2.9 | 0.05 ± 0 | 3.2 ± 0.4 | 0.22 ± 0.04 |
| Noble * | Black | 4.2 ± 0.3 | 28 ± 1.1 | 0.06 ± 0.02 | 3.8 ± 0.4 | 0.24 ± 0.05 |
| B20-18-2 | Black | 5.2 ± 0.3 | 18 ± 0.7 | 0.10 ± 0 | 4.2 ± 0.4 | 0.27 ± 0.03 |
| C11-2-2 | Dark red | 3.0 ± 0.3 | 64 ± 2.6 | 0.03 ± 0 | 3.2 ± 0.4 | 0.28 ± 0.04 |
| Average ** | - | 12.2 ± 5.6 | 49.7 ± 22.4 | 0.12 ± 0.05 | 3.6 ± 0.7 | 0.35 ± 0.11 |
| Median | - | 11.9 | 48 | 0.11 | 3.6 | 0.34 |
Publisher’s Note: MDPI stays neutral with regard to jurisdictional claims in published maps and institutional affiliations. |
© 2021 by the authors. Licensee MDPI, Basel, Switzerland. This article is an open access article distributed under the terms and conditions of the Creative Commons Attribution (CC BY) license (https://creativecommons.org/licenses/by/4.0/).
Share and Cite
Campbell, J.; Sarkhosh, A.; Habibi, F.; Ismail, A.; Gajjar, P.; Zhongbo, R.; Tsolova, V.; El-Sharkawy, I. Biometrics Assessment of Cluster- and Berry-Related Traits of Muscadine Grape Population. Plants 2021, 10, 1067. https://doi.org/10.3390/plants10061067
Campbell J, Sarkhosh A, Habibi F, Ismail A, Gajjar P, Zhongbo R, Tsolova V, El-Sharkawy I. Biometrics Assessment of Cluster- and Berry-Related Traits of Muscadine Grape Population. Plants. 2021; 10(6):1067. https://doi.org/10.3390/plants10061067
Chicago/Turabian StyleCampbell, Jiovan, Ali Sarkhosh, Fariborz Habibi, Ahmed Ismail, Pranavkumar Gajjar, Ren Zhongbo, Violeta Tsolova, and Islam El-Sharkawy. 2021. "Biometrics Assessment of Cluster- and Berry-Related Traits of Muscadine Grape Population" Plants 10, no. 6: 1067. https://doi.org/10.3390/plants10061067
APA StyleCampbell, J., Sarkhosh, A., Habibi, F., Ismail, A., Gajjar, P., Zhongbo, R., Tsolova, V., & El-Sharkawy, I. (2021). Biometrics Assessment of Cluster- and Berry-Related Traits of Muscadine Grape Population. Plants, 10(6), 1067. https://doi.org/10.3390/plants10061067