
Effect of Different Ratios of Blue and Red LED Light on Brassicaceae Microgreens under a Controlled Environment


 , , ,
, , ,
Abstract
1. Introduction
2. Results
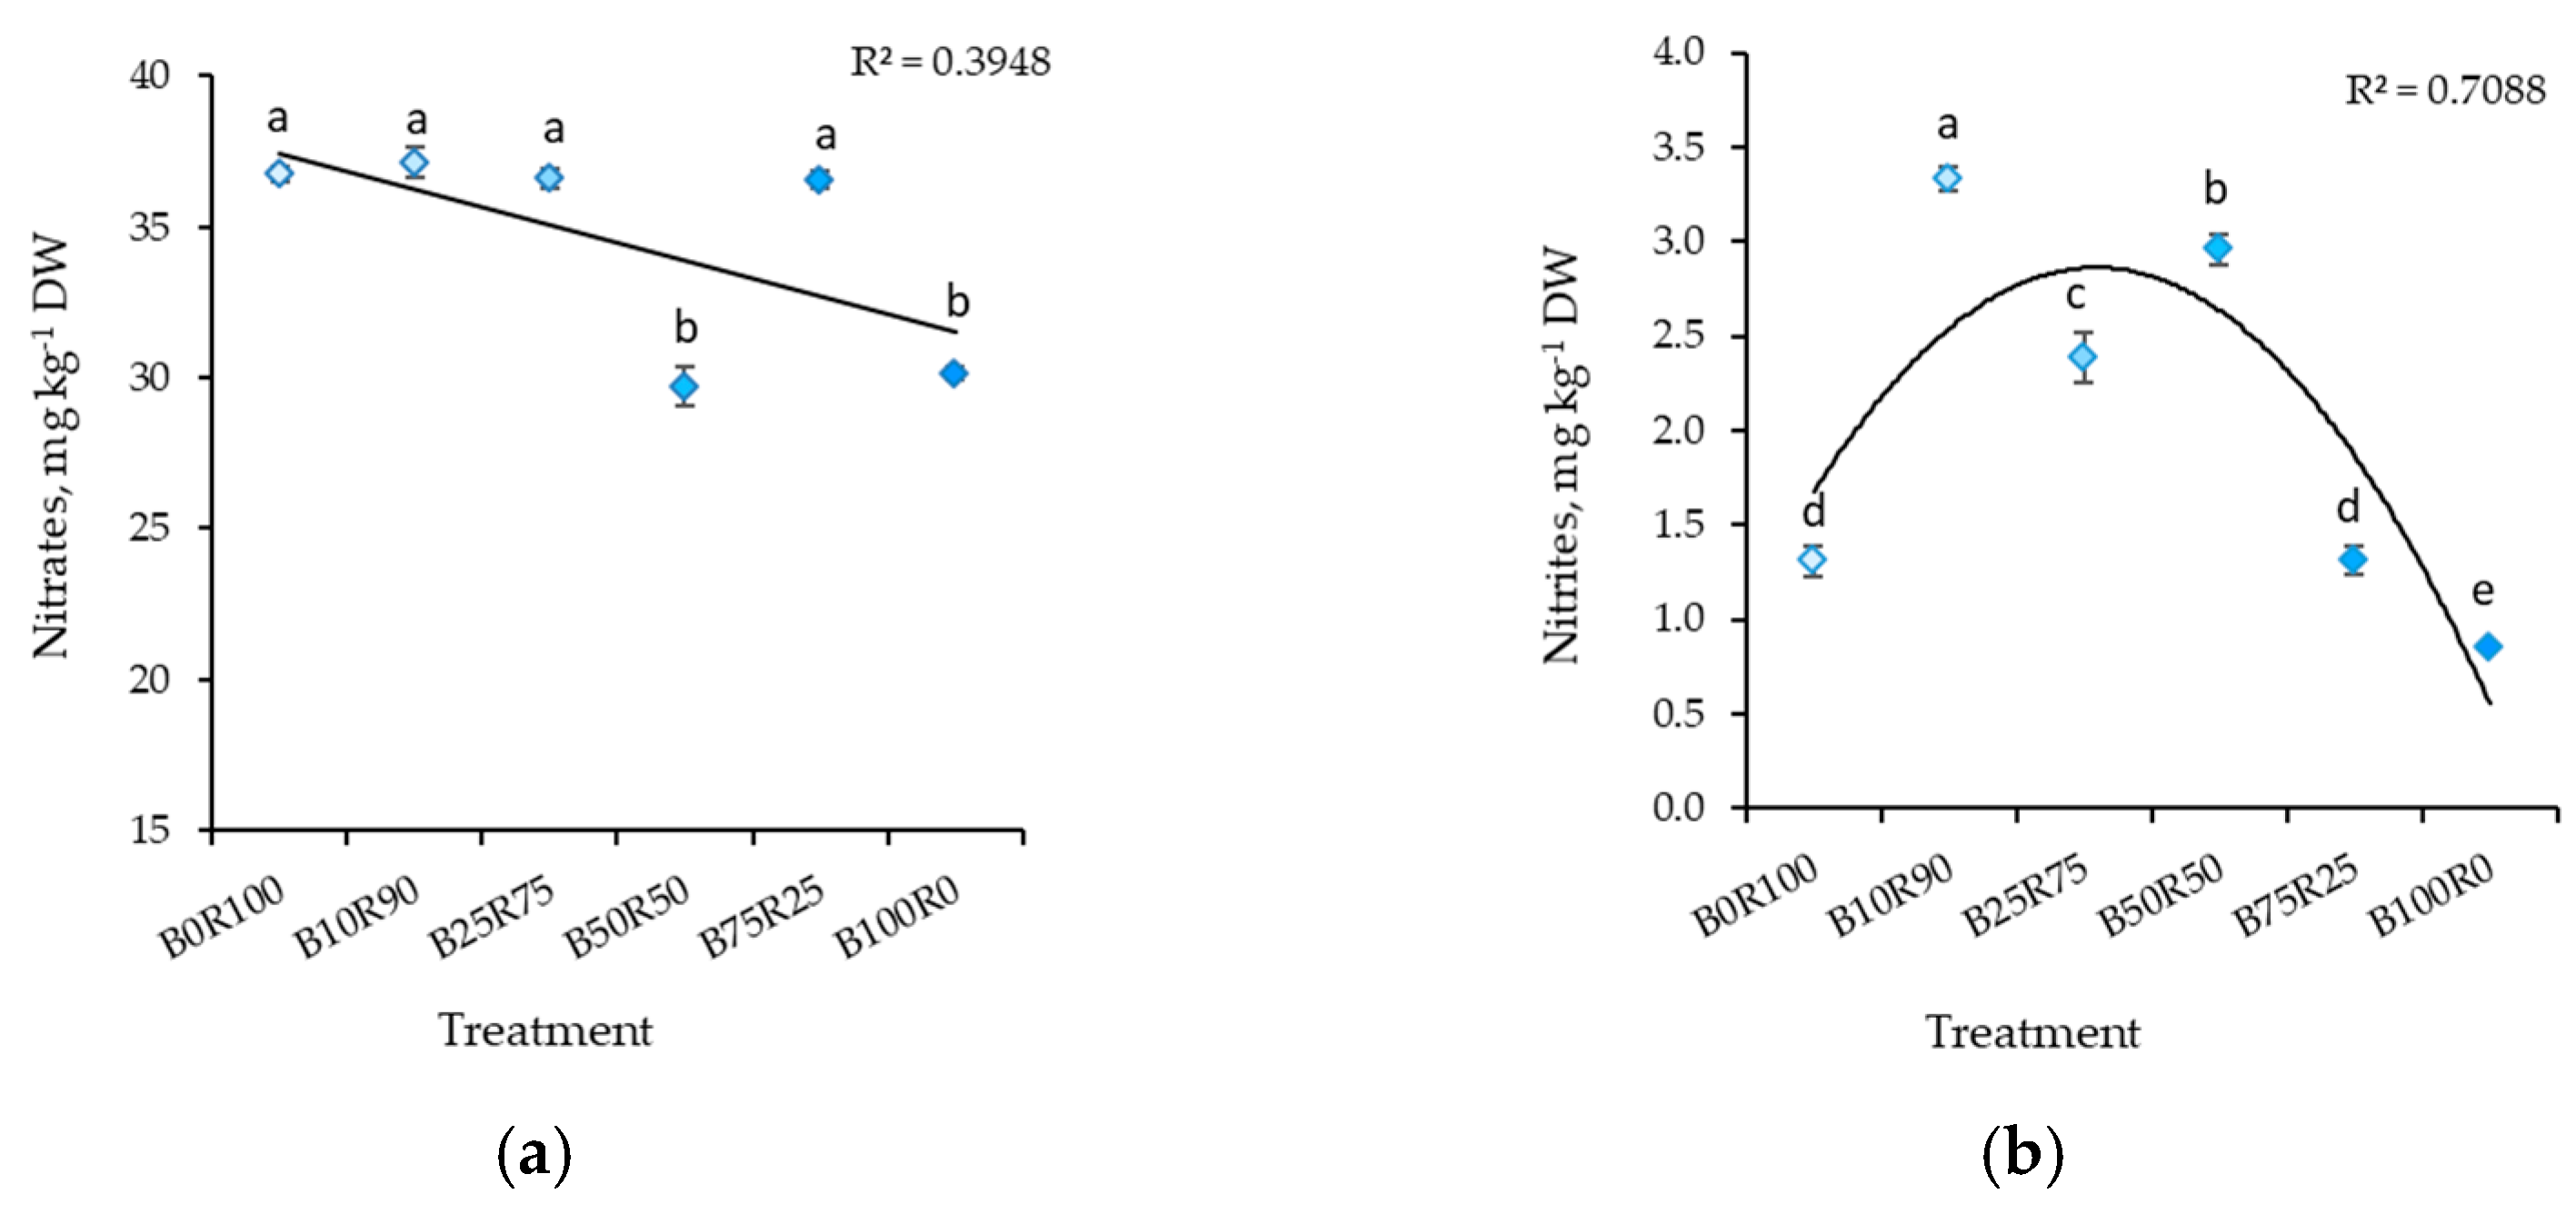
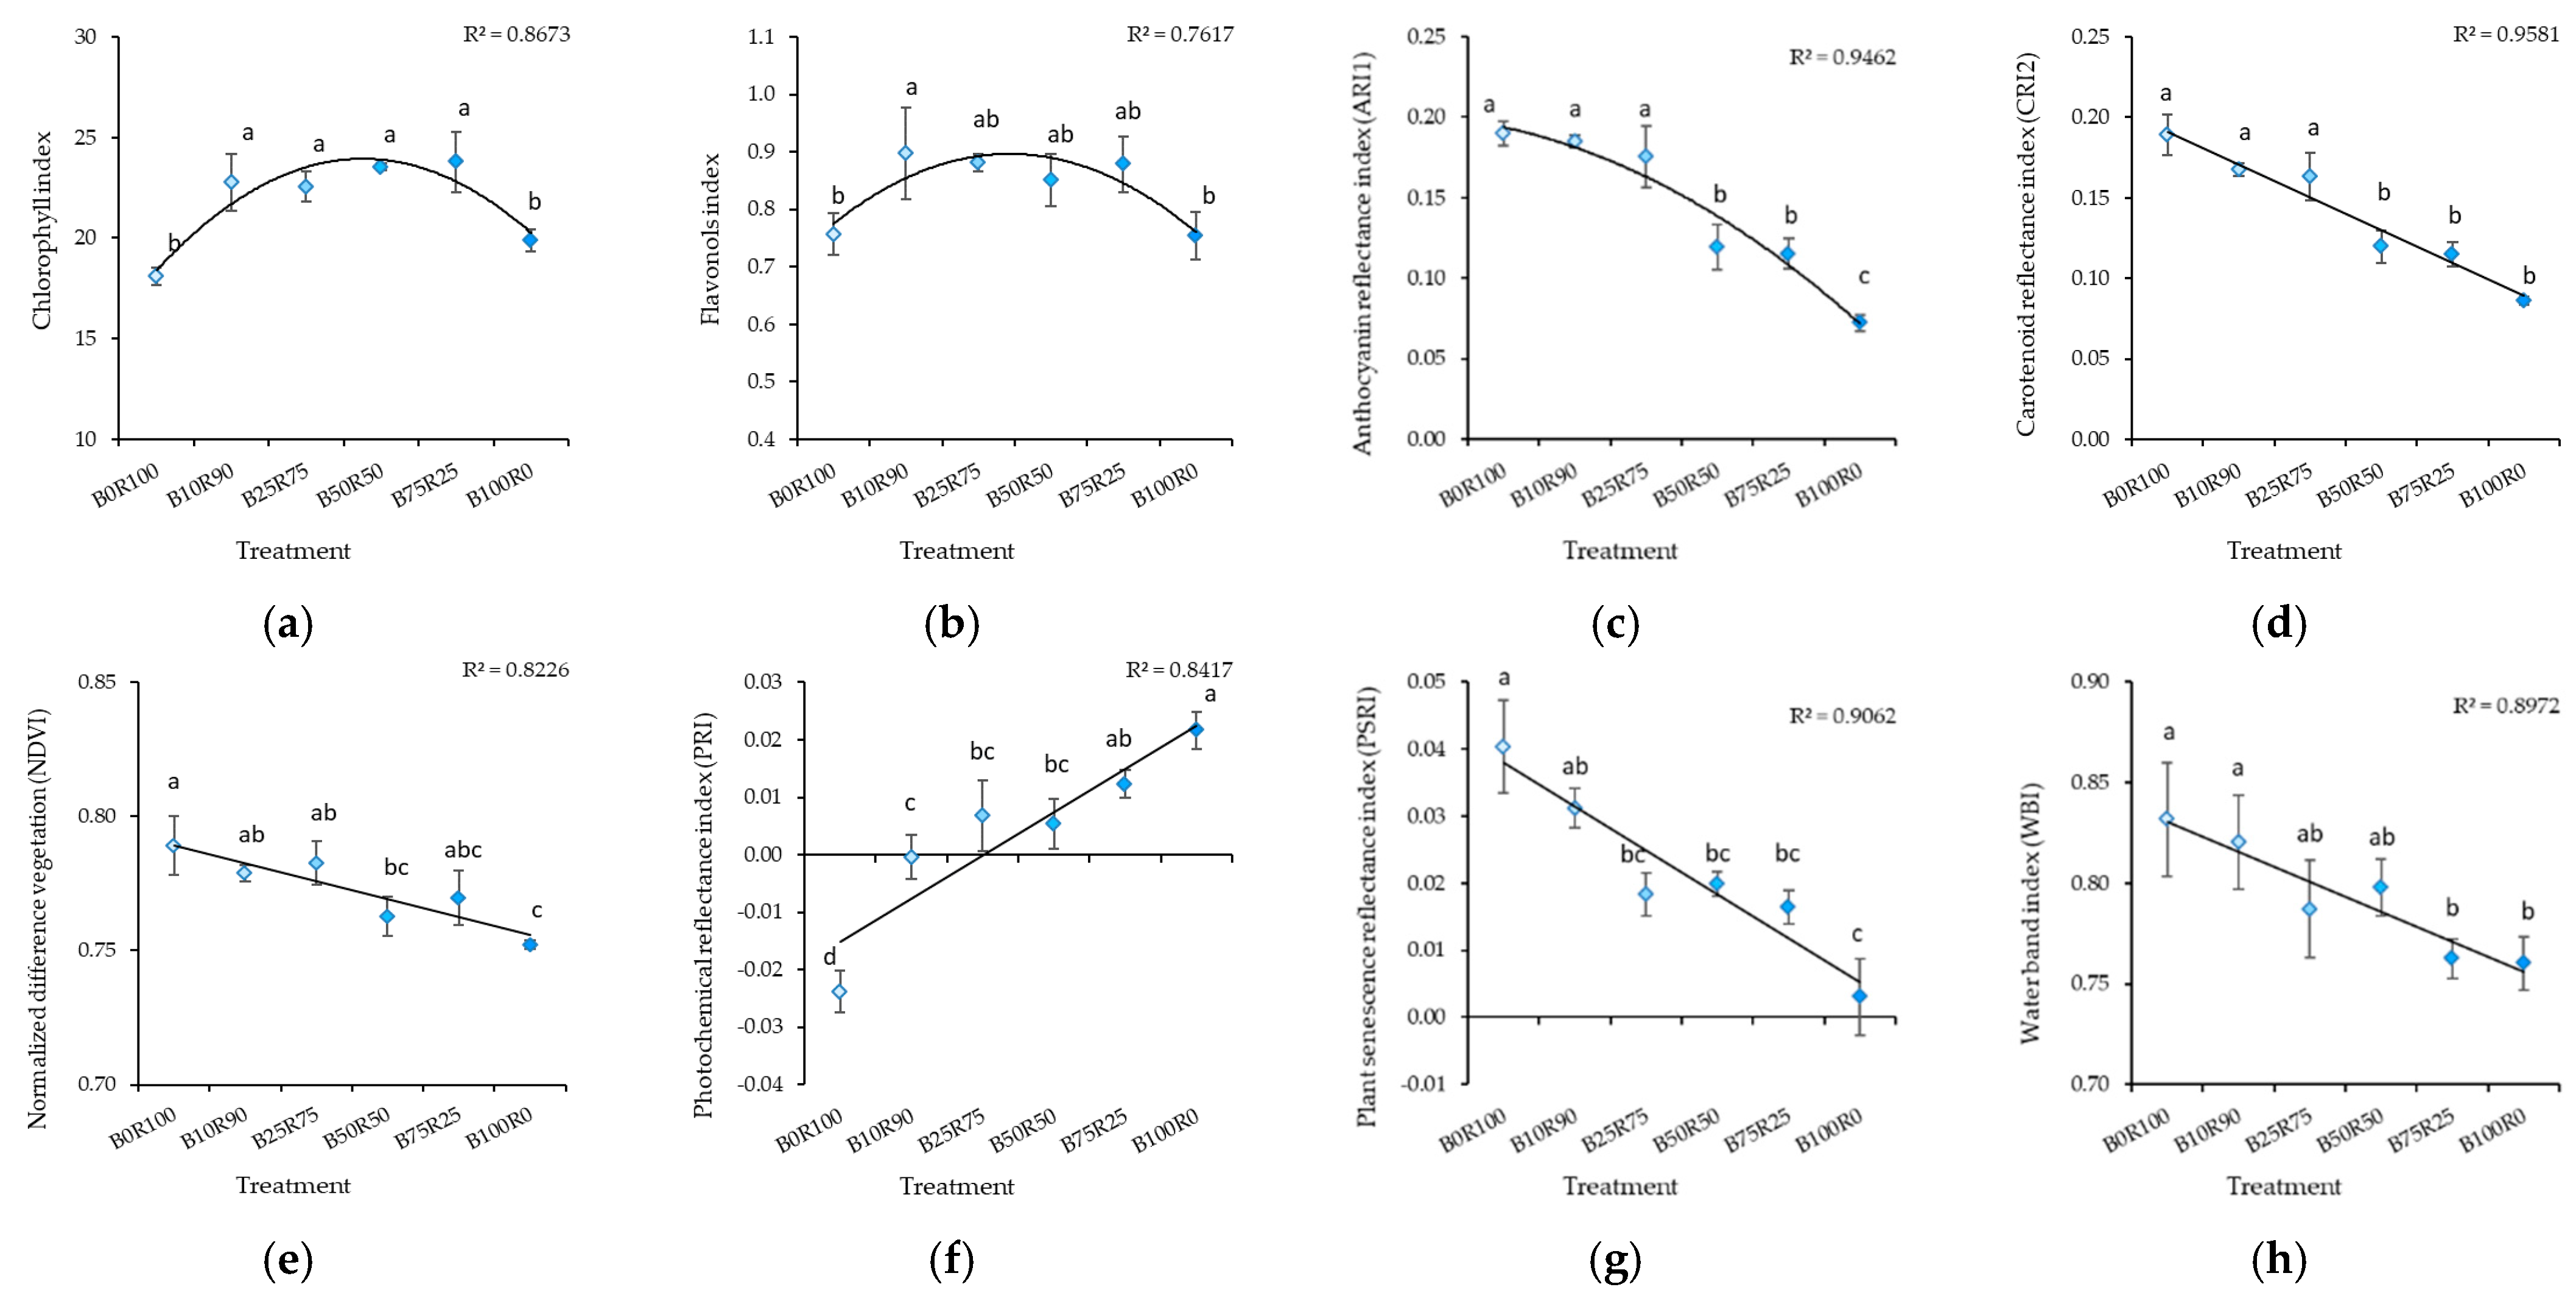
2.1. Mustard
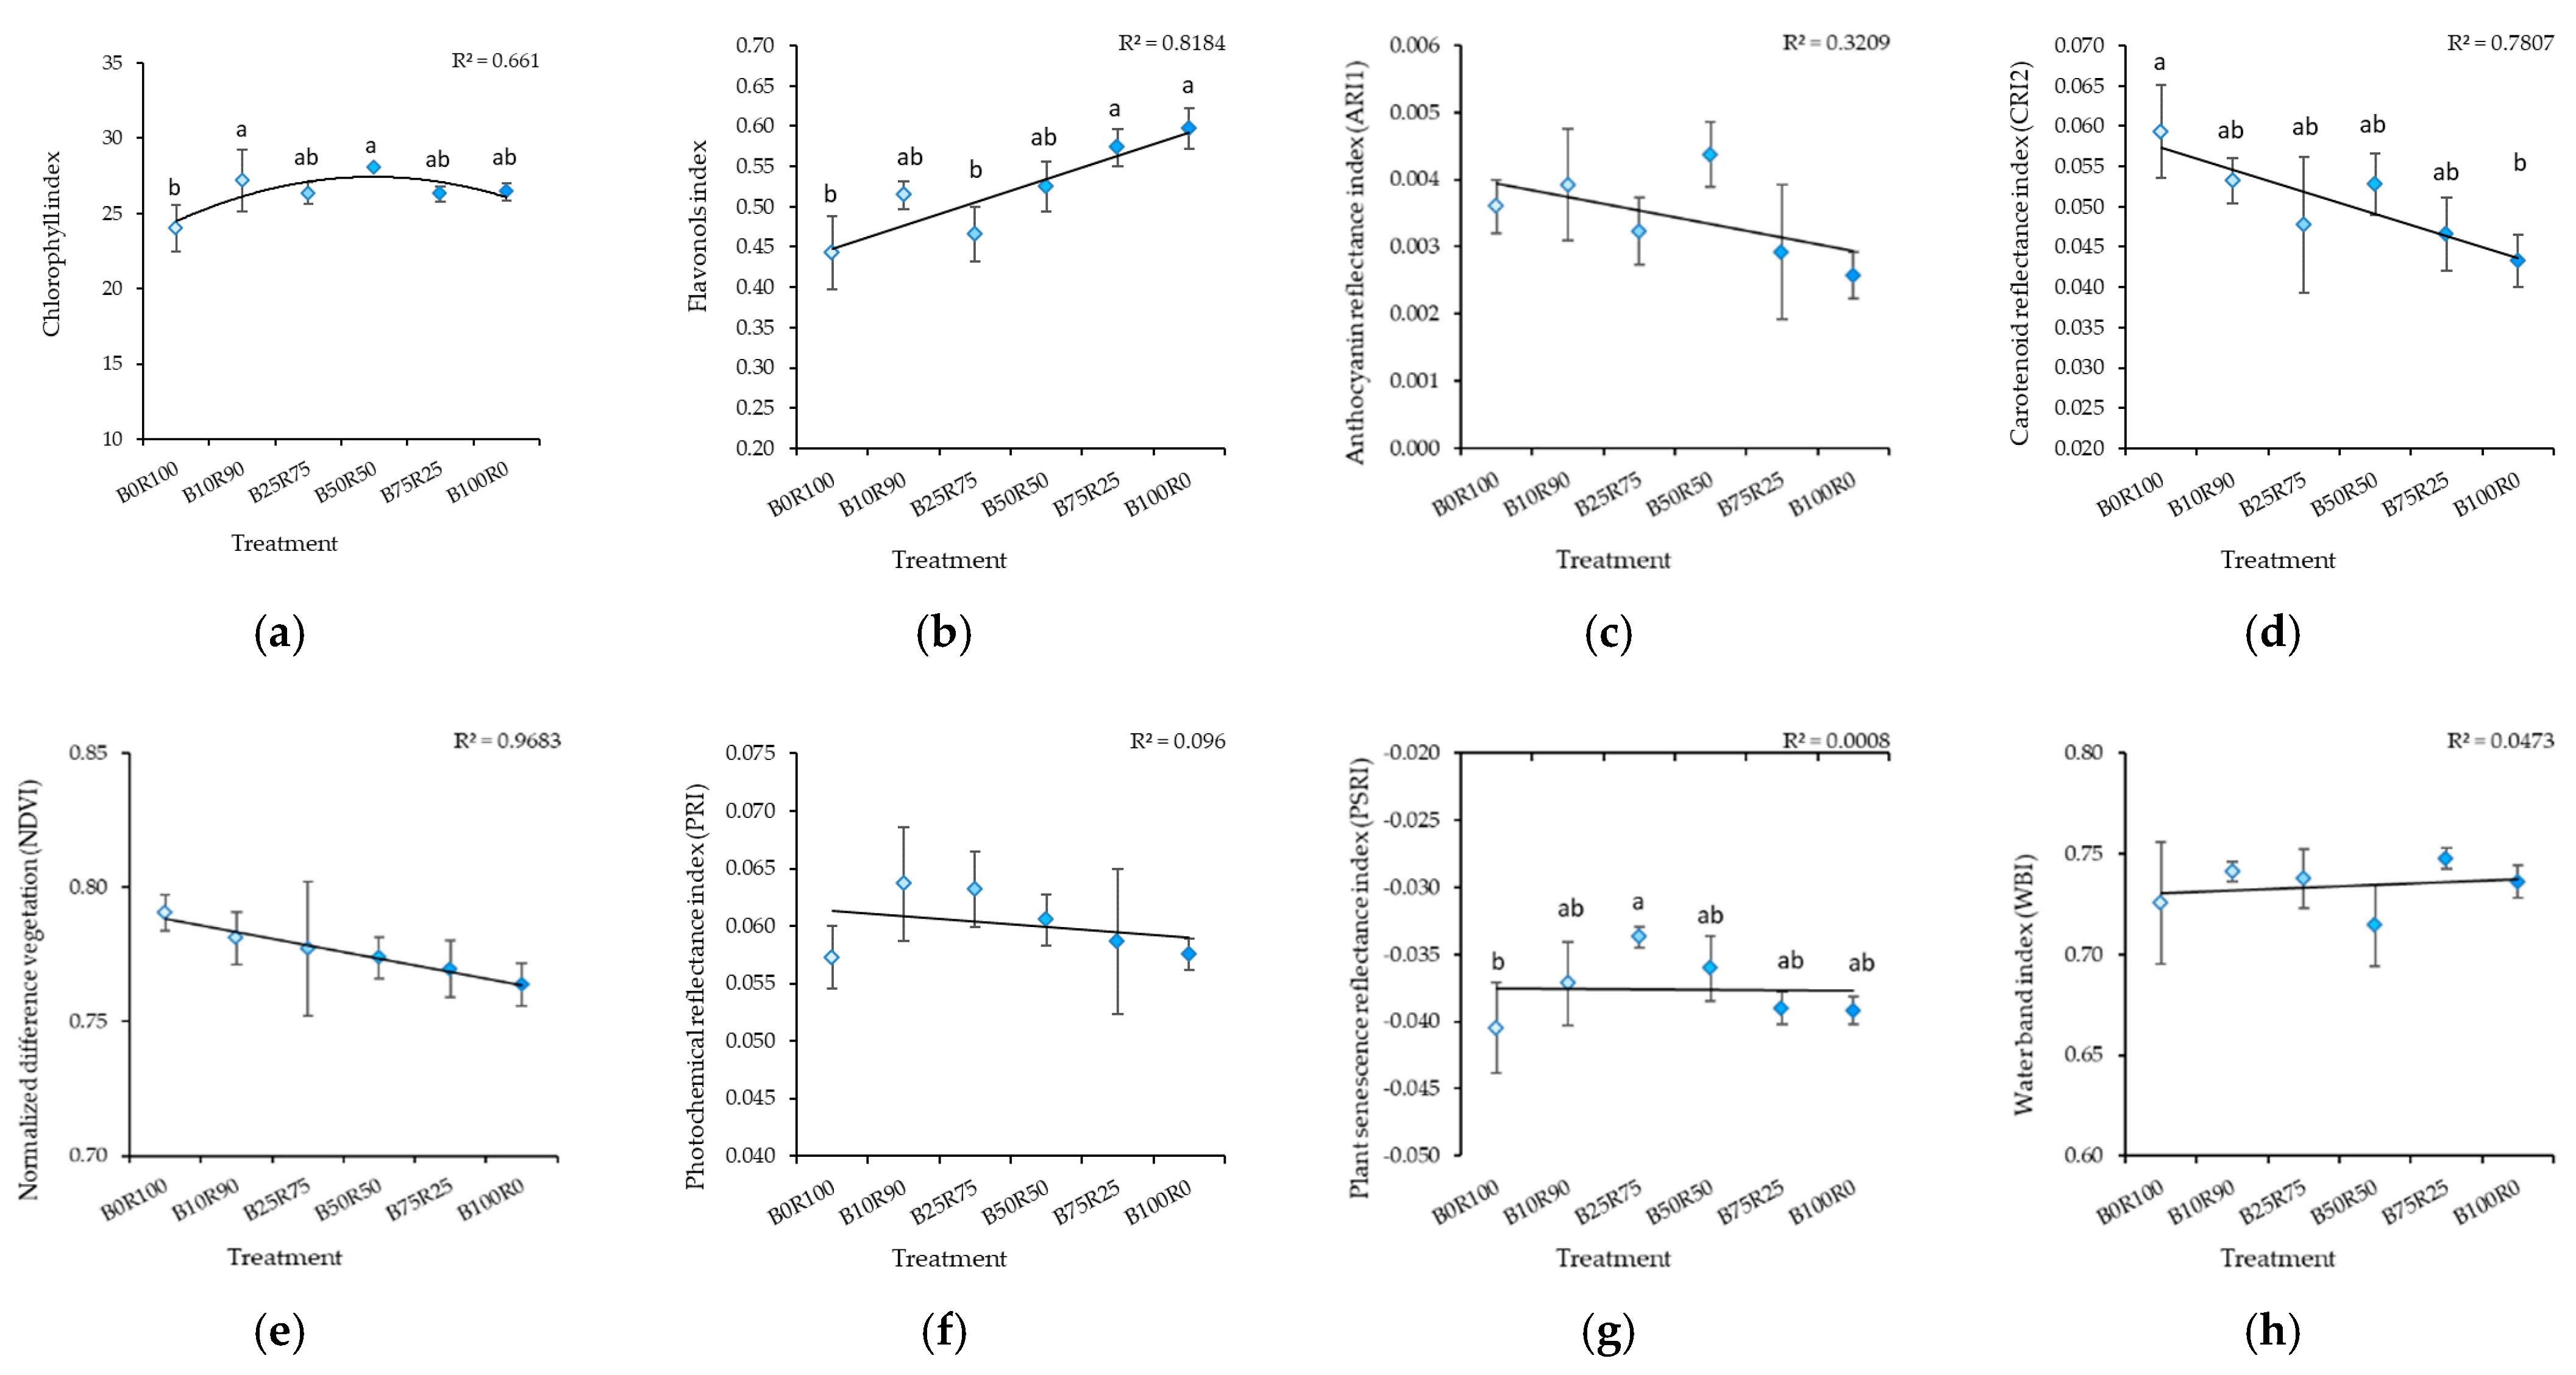
2.2. Kale
3. Discussion
3.1. Mineral Nutrients
3.2. Nitrates and Nitrites
3.3. Growth
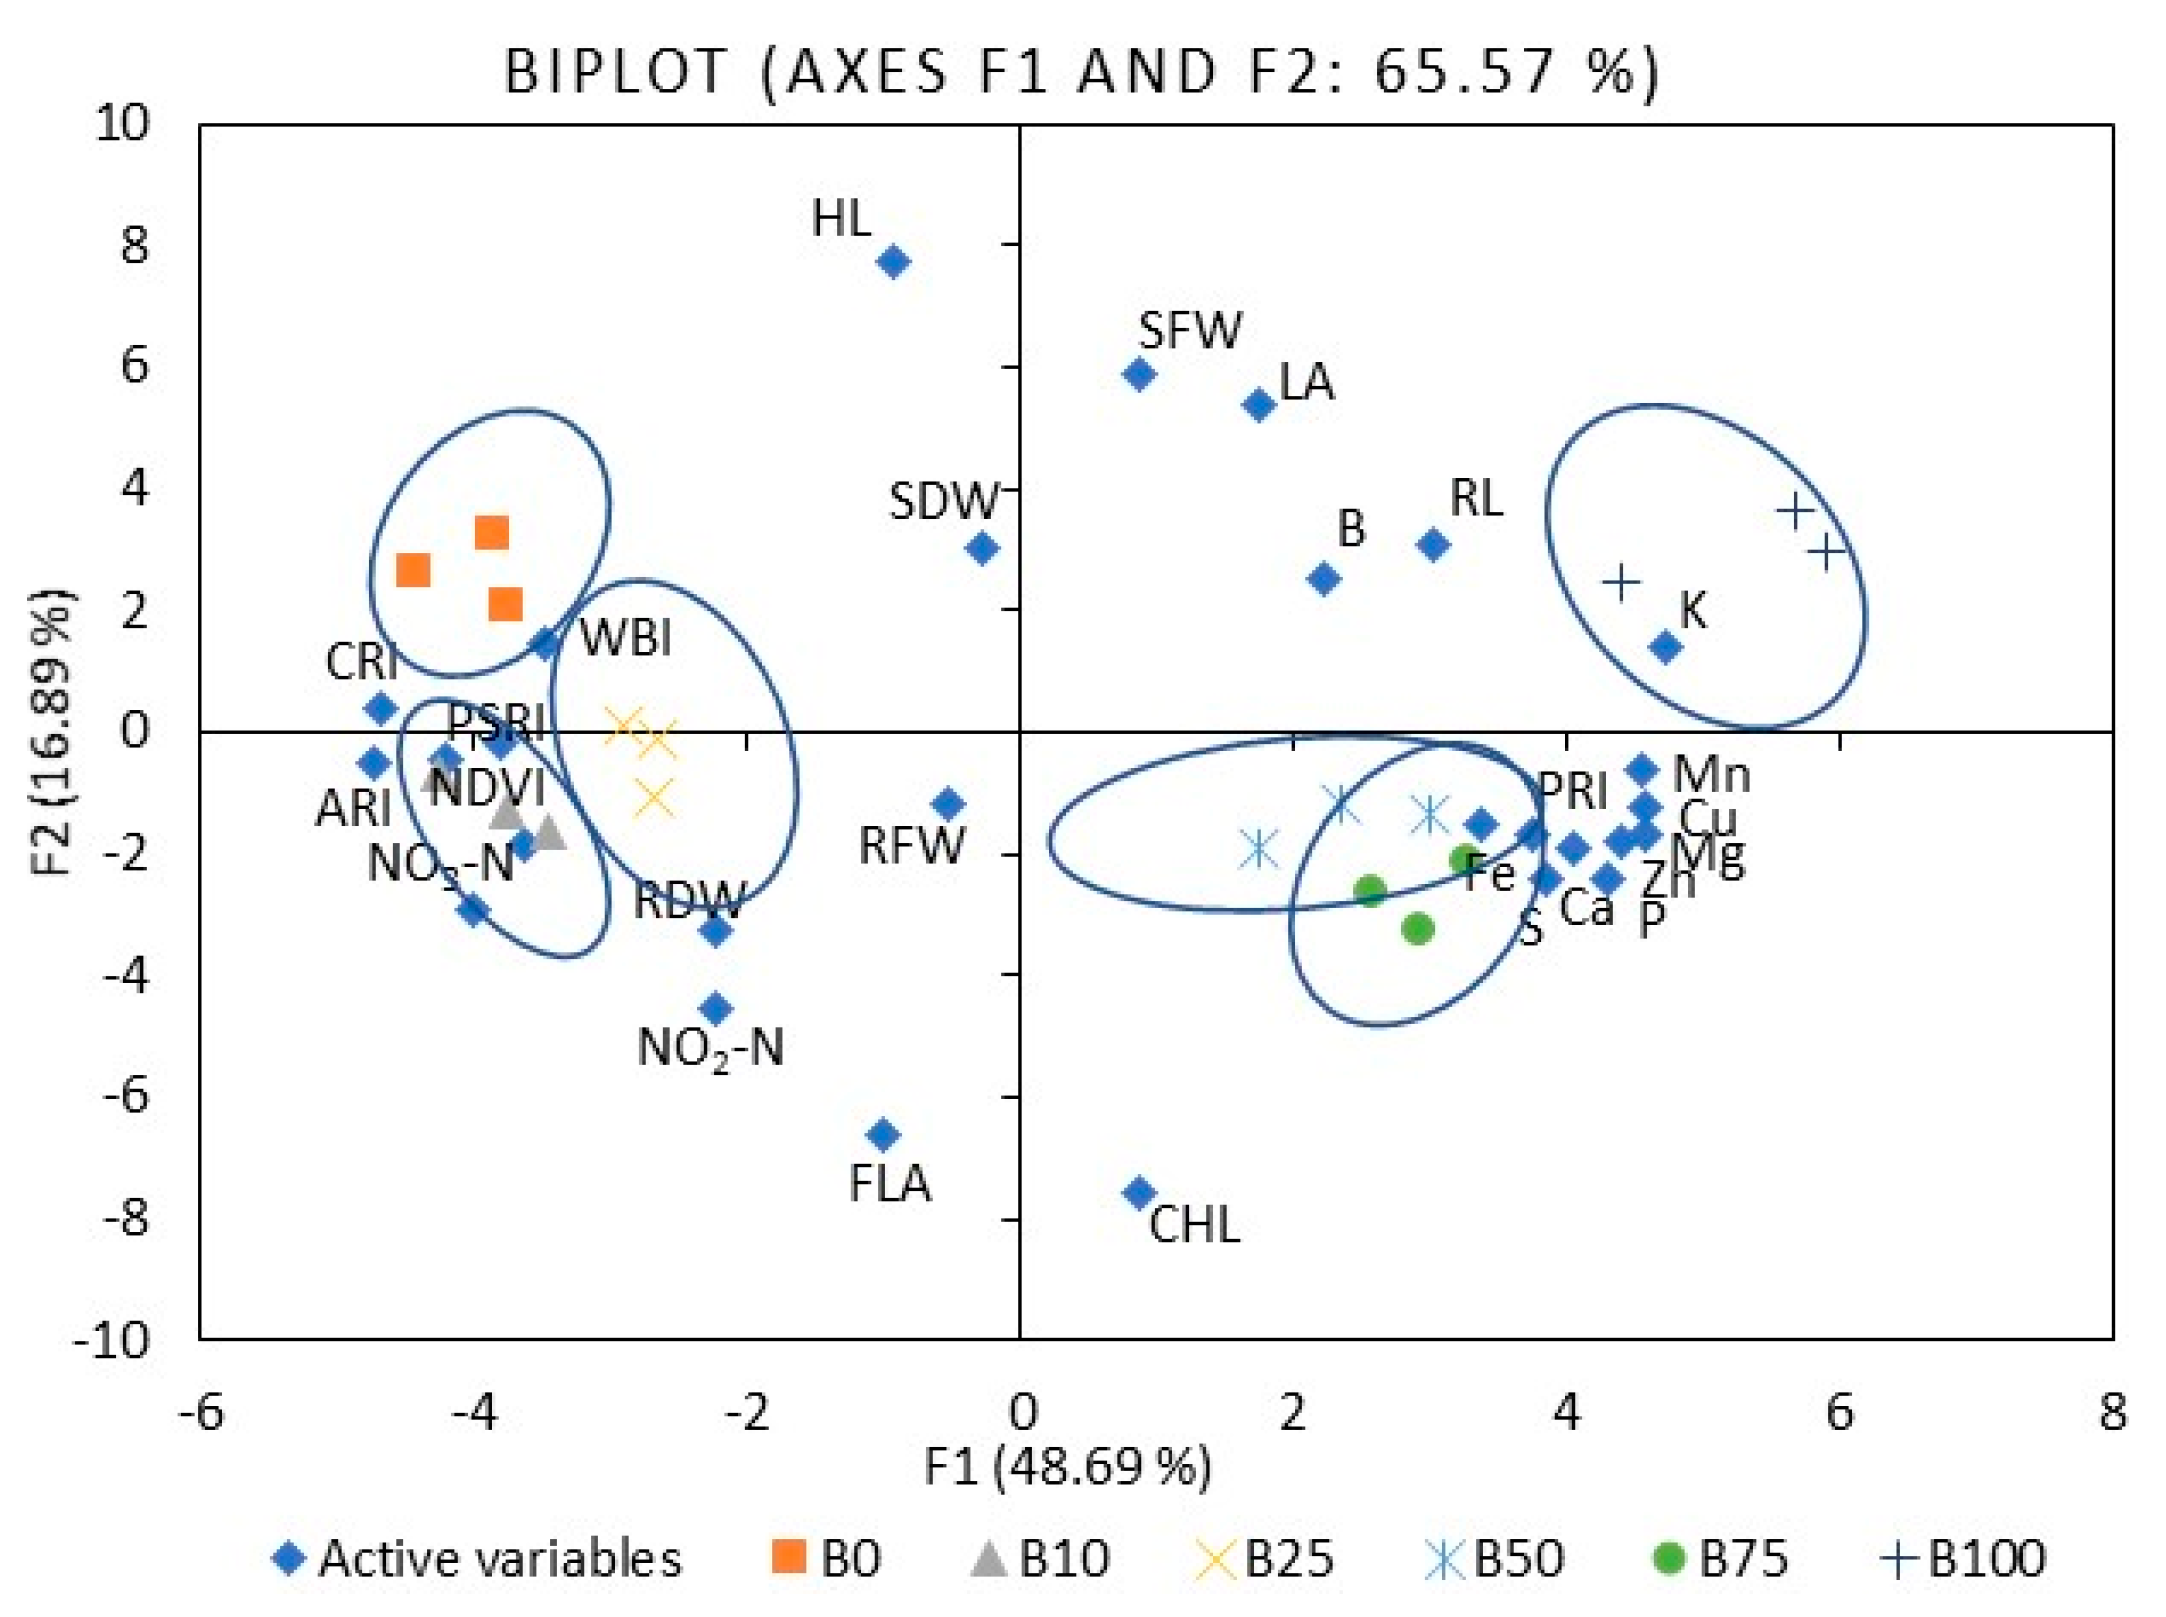
3.4. Leaf Reflectance As an Indicator of Nutritional Value Assessment
4. Materials and Methods
4.1. Plant Materials and Growth Conditions
4.2. Lighting Conditions
4.3. Sampling and Measurements
4.4. Nondestructive Measurements
4.5. Determination of Mineral Nutrients and Their Bioconcentration and Translocation Factors
4.6. Determination of Nitrate and Nitrite
4.7. Statistical Analysis
5. Conclusions
Supplementary Materials
Author Contributions
Funding
Institutional Review Board Statement
Informed Consent Statement
Data Availability Statement
Conflicts of Interest
References
- White, P.J.; Broadley, M.R. Biofortification of crops with seven mineral elements often lacking in human diets-iron, zinc, copper, calcium, magnesium, selenium and iodine. New Phytol. 2009, 182, 49–84. [Google Scholar] [CrossRef]
- Rouphael, Y.; Kyriacou, M.C.; Petropoulos, S.A.; De Pascale, S.; Colla, G. Improving vegetable quality in controlled environments. Sci. Hortic. 2018, 234, 275–289. [Google Scholar] [CrossRef]
- Vicente, A.R.; Manganaris, G.A.; Sozzi, G.O.; Crisosto, C.H. Nutritional quality of fruits and vegetables. In Postharvest Handling, A Systems Approach, 2nd ed.; Florkowski, W.J., Shewfelt, R.L., Brueckner, B., Prussia, S.E., Eds.; Elsevier Inc.: Amsterdam, The Netherlands, 2014; pp. 69–122. [Google Scholar]
- Chitturi, R.; Baddam, V.R.; Prasad, L.; Prashanth, L.; Kattapagari, K. A review on role of essential trace elements in health and disease. J. Dr. NTR Univ. Health Sci. 2015, 4, 75. [Google Scholar] [CrossRef]
- Xiao, Z.; Codling, E.E.; Luo, Y.; Nou, X.; Lester, G.E.; Wang, Q. Microgreens of Brassicaceae: Mineral composition and content of 30 varieties. J. Food Compos. Anal. 2016, 49, 87–93. [Google Scholar] [CrossRef]
- Zhao, F.-J.; McGrath, S.P. Biofortification and phytoremediation. Curr. Opin. Plant Biol. 2009, 12, 373–380. [Google Scholar] [CrossRef]
- Carvalho, S.M.; Vasconcelos, M.W. Producing more with less: Strategies and novel technologies for plant-based food biofortification. Food Res. Int. 2013, 54, 961–971. [Google Scholar] [CrossRef]
- Loedolff, B.; Brooks, J.; Stander, M.; Peters, S.; Kossmann, J. High light bio-fortification stimulates de novo synthesis of resveratrol in Diplotaxis tenuifolia (wild rocket) micro-greens. Funct. Foods Health. Dis. 2017, 7, 859. [Google Scholar] [CrossRef]
- Mitchell, C.A.; Dzakovich, M.P.; Gomez, C.; Lopez, R.G.; Burr, J.F.; Hernández, R.; Kubota, C.; Currey, C.J.; Meng, Q.; Runkle, E.S.; et al. Light-Emitting Diodes in Horticulture. Hortic. Rev. 2015, 43, 1–88. [Google Scholar] [CrossRef]
- Olle, M.; Viršile, A. The effects of light-emitting diode lighting on greenhouse plant growth and quality. Agric. Food Sci. 2013, 22, 223–234. [Google Scholar] [CrossRef]
- Carvalho, S.D.; Folta, K.M. Environmentally modified organisms–expanding genetic potential with light. Crit. Rev. Plant Sci. 2014, 33, 486–508. [Google Scholar] [CrossRef]
- Ouzounis, T.; Rosenqvist, E.; Ottosen, C.-O. Spectral effects of artificial light on plant physiology and secondary metabolism: A Review. HortScience 2015, 50, 1128–1135. [Google Scholar] [CrossRef]
- Bian, Z.H.; Yang, Q.C.; Liu, W.K. Effects of light quality on the accumulation of phytochemicals in vegetables produced in controlled environments: A review. J. Sci. Food Agric. 2015, 95, 869–877. [Google Scholar] [CrossRef]
- Brazaitytė, A.; Viršilė, A.; Samuolienė, G.; Jankauskienė, J.; Sakalauskienė, S.; Sirtautas, R.; Novičkovas, A.; Dabašinskas, L.; Vaštakaitė, V.; Miliauskienė, J.; et al. Light quality: Growth and nutritional value of microgreens under indoor and greenhouse conditions. Acta Hortic. 2016, 1134, 277–284. [Google Scholar] [CrossRef]
- Kyriacou, M.C.; Rouphael, Y.; Di Gioia, F.; Kyratzis, A.; Serio, F.; Renna, M.; De Pascale, S.; Santamaria, P. Micro-scale vegetable production and the rise of microgreens. Trends Food Sci. Technol. 2016, 57, 103–115. [Google Scholar] [CrossRef]
- Bantis, F.; Smirnakou, S.; Ouzounis, T.; Koukounaras, A.; Ntagkas, N.; Radoglou, K. Current status and recent achievements in the field of horticulture with the use of light-emitting diodes (LEDs). Sci. Hortic. 2018, 235, 437–451. [Google Scholar] [CrossRef]
- Alrifai, O.; Hao, X.; Marcone, M.F.; Tsao, R. Current review of the modulatory effects of LED lights on photosynthesis of secondary metabolites and future perspectives of m icrogreen vegetables. J. Agric. Food Chem. 2019, 67, 6075–6090. [Google Scholar] [CrossRef]
- Zhang, X.; Bian, Z.; Yuan, X.; Chen, X.; Lu, C. A review on the effects of light-emitting diode (LED) light on the nutrients of sprouts and microgreens. Trends Food Sci. Technol. 2020, 99, 203–216. [Google Scholar] [CrossRef]
- Wang, H.; Gu, M.; Cui, J.; Shi, K.; Zhou, Y.; Yu, J. Effects of light quality on CO2 assimilation, chlorophyll-fluorescence quenching, expression of Calvin cycle genes and carbohydrate accumulation in Cucumis sativus. J. Photochem. Photobiol. B Biol. 2009, 96, 30–37. [Google Scholar] [CrossRef]
- Son, K.-H.; Oh, M.-M. Leaf shape, growth, and antioxidant phenolic compounds of two lettuce cultivars grown under various combinations of blue and red light-emitting diodes. HortScience 2013, 48, 988–995. [Google Scholar] [CrossRef]
- Kopsell, D.A.; Sams, C.E.; Morrow, R.C. Blue wavelengths from LED lighting increase nutritionally important metabolites in specialty crops. HortScience 2015, 50, 1285–1288. [Google Scholar] [CrossRef]
- Huché-Thélier, L.; Crespel, L.; Le Gourrierec, J.; Morel, P.; Sakr, S.; Leduc, N. Light signaling and plant responses to blue and UV radiations—Perspectives for applications in horticulture. Environ. Exp. Bot. 2016, 121, 22–38. [Google Scholar] [CrossRef]
- Pennisi, G.; Orsini, F.; Blasioli, S.; Cellini, A.; Crepaldi, A.; Braschi, I.; Spinelli, F.; Nicola, S.; Fernandez, J.A.; Stanghellini, C.; et al. Resource use efficiency of indoor lettuce (Lactuca sativa L.) cultivation as affected by red:blue ratio provided by LED lighting. Sci. Rep. 2019, 9, 1–11. [Google Scholar] [CrossRef] [PubMed]
- Pennisi, G.; Blasioli, S.; Cellini, A.; Maia, L.; Crepaldi, A.; Braschi, I.; Spinelli, F.; Nicola, S.; Fernandez, J.A.; Stanghellini, C.; et al. Unraveling the role of red:blue LED lights on resource use efficiency and nutritional properties of indoor grown sweet basil. Front. Plant Sci. 2019, 10, 305. [Google Scholar] [CrossRef]
- Kopsell, D.A.; Sams, C.E. Increases in shoot tissue pigments, glucosinolates, and mineral elements in sprouting broccoli after exposure to short-duration blue light from light emitting diodes. J. Am. Soc. Hortic. Sci. 2013, 138, 31–37. [Google Scholar] [CrossRef]
- Kopsell, D.A.; Sams, C.E.; Barickman, T.C.; Morrow, R.C. sprouting broccoli accumulate higher concentrations of nutritionally important metabolites under narrow-band light-emitting diode lighting. J. Am. Soc. Hortic. Sci. 2014, 139, 469–477. [Google Scholar] [CrossRef]
- Shin, Y.-S.; Lee, M.-J.; Lee, E.-S.; Ahn, J.-H.; Do, H.-W.; Choi, D.-W.; Jeong, J.-D.; Lee, J.-E.; Kim, M.-K.; Park, J.-U.; et al. Effect of light emitting diodes treatment on growth and mineral contents of lettuce (Lactuca sativa L. ‘Chung Chi Ma’)*. Korean J. Org. Agric. 2013, 21, 659–668. [Google Scholar] [CrossRef]
- Choi, M.-K.; Chang, M.-S.; Eom, S.-H.; Min, K.-S.; Kang, M.-H. Physicochemical composition of buckwheat microgreens grown under different light conditions. J. Korean Soc. Food Sci. Nutr. 2015, 44, 709–715. [Google Scholar] [CrossRef]
- Gerovac, J.R.; Craver, J.K.; Boldt, J.K.; Lopez, R.G. Light intensity and quality from sole-source light-emitting diodes impact growth, morphology, and nutrient content of Brassica microgreens. HortScience 2016, 51, 497–503. [Google Scholar] [CrossRef]
- Sams, C.; Kopsell, D.; Morrow, R. Light quality impacts on growth, flowering, mineral uptake and petal pigmentation of marigold. Acta Hortic. 2016, 1134, 139–146. [Google Scholar] [CrossRef]
- Amoozgar, A.; Mohammadi, A.; Sabzalian, M.R. Impact of light-emitting diode irradiation on photosynthesis, phytochemical composition and mineral element content of lettuce cv. Grizzly. Photosynth. 2017, 55, 85–95. [Google Scholar] [CrossRef]
- Xiao, Z.; Lester, G.E.; Luo, Y.; Wang, Q. Assessment of vitamin and carotenoid concentrations of emerging food products: Edible microgreens. J. Agric. Food Chem. 2012, 60, 7644–7651. [Google Scholar] [CrossRef] [PubMed]
- Xiao, Z.; Rausch, S.R.; Luo, Y.; Sun, J.; Yu, L.; Wang, Q.; Chen, P.; Yu, L.; Stommel, J.R. Microgreens of Brassicaceae: Genetic diversity of phytochemical concentrations and antioxidant capacity. LWT 2019, 101, 731–737. [Google Scholar] [CrossRef]
- Ilakiya, T.; Parameswari, E.; Davamani, V.; Prakash, E. Microgreens-combacting malnutrition problem. Biot. Res. Today. 2020, 2, 110–112. [Google Scholar]
- Kinoshita, T.; Doi, M.; Suetsugu, N.; Kagawa, T.; Wada, M.; Shimazaki, K.-I. Phot1 and phot2 mediate blue light regulation of stomatal opening. Nature 2001, 414, 656–660. [Google Scholar] [CrossRef] [PubMed]
- Babourina, O.; Newman, I.; Shabala, S. Blue light-induced kinetics of H+ and Ca2+ fluxes in etiolated wild-type and phototropin-mutant Arabidopsis seedlings. Proc. Natl. Acad. Sci. USA 2002, 99, 2433–2438. [Google Scholar] [CrossRef]
- Xu, J.; Guo, Z.; Jiang, X.; Ahammed, G.J.; Zhou, Y. Light regulation of horticultural crop nutrient uptake and utilization. Hortic. Plant J. 2021, in press. [Google Scholar] [CrossRef]
- Brazaitytė, A.; Vaštakaitė, V.; Viršilė, A.; Jankauskienė, J.; Samuolienė, G.; Sakalauskienė, S.; Novičkovas, A.; Miliauskienė, J.; Duchovskis, P. Changes in mineral element content of microgreens cultivated under different lighting conditions in a greenhouse. Acta Hortic. 2018, 1227, 507–516. [Google Scholar] [CrossRef]
- Kyriacou, M.C.; El-Nakhel, C.; Pannico, A.; Graziani, G.; Soteriou, G.A.; Giordano, M.; Zarrelli, A.; Ritieni, A.; De Pascale, S.; Rouphael, Y. Genotype-specific modulatory effects of select spectral bandwidths on the nutritive and phytochemical composition of microgreens. Front. Plant Sci. 2019, 10, 1501. [Google Scholar] [CrossRef]
- Brazaitytė, A.; Vaštakaitė-Kairienė, V.; Jankauskienė, J.; Viršilė, A.; Samuolienė, G.; Sakalauskienė, S.; Novičkovas, A.; Miliauskienė, J.; Duchovskis, P. Effect of blue light percentage on mineral elements content in Brassica microgreens. Acta Hortic. 2020, 1271, 119–126. [Google Scholar] [CrossRef]
- Bartucca, M.L.; Del Buono, D.; Ballerini, E.; Benincasa, P.; Falcinelli, B.; Guiducci, M. Effect of light spectrum on gas exchange, growth and biochemical characteristics of einkorn seedlings. Agronomy 2020, 10, 1042. [Google Scholar] [CrossRef]
- Kamal, K.Y.; Khodaeiaminjan, M.; El-Tantawy, A.A.; Moneim, D.A.; Salam, A.A.; Ash-Shormillesy, S.M.A.I.; Attia, A.; Ali, M.A.S.; Herranz, R.; El-Esawi, M.A.; et al. Evaluation of growth and nutritional value of Brassica microgreens grown under red, blue and green LEDs combinations. Physiol. Plant. 2020, 169, 625–638. [Google Scholar] [CrossRef] [PubMed]
- Frąszczak, B.; Gąsecka, M.; Golcz, A.; Zawirska-Wojtasiak, R. The effect of radiation of LED modules on the growth of dill (Anethum graveolens L.). Open Life Sci. 2016, 11, 61–70. [Google Scholar] [CrossRef][Green Version]
- Hammock, H.A. The Impact of Blue and Red LED Lighting on Biomass Accumulation, Flavor Volatile Production, and Nutrient Uptake in Hydroponically Grown Genovese Basil. Master’s Thesis, University of Tennessee, Knoxville, TN, USA, 2018. [Google Scholar]
- Sakuraba, Y.; Yanagisawa, S. Light signalling-induced regulation of nutrient acquisition and utilisation in plants. Semin. Cell Dev. Biol. 2018, 83, 123–132. [Google Scholar] [CrossRef] [PubMed]
- Radulescu, L.C.; Stihi, C.; Popescu, I.V.; Dulama, I.D.; Chelarescu, E.D.; Chilian, A. Heavy metal accumulation and translocation in different parts of Brassica oleracea. Rom. J. Phys. 2013, 58, 1337–1354. [Google Scholar]
- Mishra, T.; Pandey, V.C. Phytoremediation of red mud deposits through natural succession. In Phytomanagement of Polluted Sites; Elsevier: Amsterdam, The Netherlands, 2019; pp. 409–424. [Google Scholar]
- Li, X.; Wu, Y.; Li, B.; Yang, Y.; Yang, Y. Selenium accumulation characteristics and biofortification potentiality in turnip (Brassica rapa var. rapa) Supplied with Selenite or Selenate. Front. Plant Sci. 2018, 8, 2207. [Google Scholar] [CrossRef]
- Bian, Z.-H.; Lei, B.; Cheng, R.-F.; Wang, Y.; Li, T.; Yang, Q.-C. Selenium distribution and nitrate metabolism in hydroponic lettuce (Lactuca sativa L.): Effects of selenium forms and light spectra. J. Integr. Agric. 2020, 19, 133–144. [Google Scholar] [CrossRef]
- Wang, R.-H.; Chang, J.-C.; Li, K.-T.; Lin, T.-S.; Chang, L.-S. Leaf age and light intensity affect gas exchange parameters and photosynthesis within the developing canopy of field net-house-grown papaya trees. Sci. Hortic. 2014, 165, 365–373. [Google Scholar] [CrossRef]
- Clavijo-Herrera, J.; Van Santen, E.; Gómez, C. Growth, water-use efficiency, stomatal conductance, and nitrogen uptake of two lettuce cultivars grown under different percentages of blue and red light. Horticulturae 2018, 4, 16. [Google Scholar] [CrossRef]
- Lillo, C. Signalling cascades integrating light-enhanced nitrate metabolism. Biochem. J. 2008, 415, 11–19. [Google Scholar] [CrossRef] [PubMed]
- Viršilė, A.; Brazaitytė, A.; Vaštakaitė-Kairienė, V.; Jankauskienė, J.; Miliauskienė, J.; Samuolienė, G.; Novičkovas, A.; Duchovskis, P. Nitrate, nitrite, protein, amino acid contents, and photosynthetic and growth characteristics of tatsoi cultivated under various photon flux densities and spectral light compositions. Sci. Hortic. 2019, 258, 108781. [Google Scholar] [CrossRef]
- Kyriacou, M.C.; Soteriou, G.A.; Colla, G.; Rouphael, Y.; Soteriou, G. The occurrence of nitrate and nitrite in Mediterranean fresh salad vegetables and its modulation by preharvest practices and postharvest conditions. Food Chem. 2019, 285, 468–477. [Google Scholar] [CrossRef]
- The European Commission. Commission Regulation (EU) No 1258/2011 Amending Regulation (EC) No 1881/2006 as Regards Maximum Levels for Nitrates in Foodstuffs. Off. J. Eur. Union. 2011, 320, 15–17. Available online: https://eur-lex.europa.eu/eli/reg/2011/1258/oj (accessed on 9 April 2021).
- Chen, X.-L.; Guo, W.-Z.; Xue, X.-Z.; Wang, L.-C.; Qiao, X.-J. Growth and quality responses of ‘Green Oak Leaf’ lettuce as affected by monochromic or mixed radiation provided by fluorescent lamp (FL) and light-emitting diode (LED). Sci. Hortic. 2014, 172, 168–175. [Google Scholar] [CrossRef]
- Zhang, T.; Shi, Y.; Piao, F.; Sun, Z. Effects of different LED sources on the growth and nitrogen metabolism of lettuce. Plant Cell Tissue Organ Cult. (PCTOC) 2018, 134, 231–240. [Google Scholar] [CrossRef]
- Lin, K.-H.; Huang, M.-Y.; Huang, W.-D.; Hsu, M.-H.; Yang, Z.-W.; Yang, C.-M. The effects of red, blue, and white light-emitting diodes on the growth, development, and edible quality of hydroponically grown lettuce (Lactuca sativa L. var. capitata). Sci. Hortic. 2013, 150, 86–91. [Google Scholar] [CrossRef]
- Ying, Q.; Jones-Baumgardt, C.; Zheng, Y.; Bozzo, G. The Proportion of blue light from light-emitting diodes alters microgreen phytochemical profiles in a species-specific manner. HortScience 2021, 56, 13–20. [Google Scholar] [CrossRef]
- Correia, M.; Barroso, Â.; Barroso, M.F.; Soares, D.; Oliveira, M.B.P.P.; Delerue-Matos, C. Contribution of different vegetable types to exogenous nitrate and nitrite exposure. Food Chem. 2010, 120, 960–966. [Google Scholar] [CrossRef]
- Bian, Z.; Cheng, R.; Wang, Y.; Yang, Q.; Lu, C. Effect of green light on nitrate reduction and edible quality of hydroponically grown lettuce (Lactuca sativa L.) under short-term continuous light from red and blue light-emitting diodes. Environ. Exp. Bot. 2018, 153, 63–71. [Google Scholar] [CrossRef]
- Ying, Q.; Kong, Y.; Jones-Baumgardt, C.; Zheng, Y. Responses of yield and appearance quality of four Brassicaceae microgreens to varied blue light proportion in red and blue light-emitting diodes lighting. Sci. Hortic. 2020, 259, 108857. [Google Scholar] [CrossRef]
- Su, J.; Liu, B.; Liao, J.; Yang, Z.; Lin, C.; Oka, Y. Coordination of cryptochrome and phytochrome signals in the regulation of plant light responses. Agronomy 2017, 7, 25. [Google Scholar] [CrossRef]
- Kong, Y.; Stasiak, M.; Dixon, M.A.; Zheng, Y. Blue light associated with low phytochrome activity can promote elongation growth as shade-avoidance response: A comparison with red light in four bedding plant species. Environ. Exp. Bot. 2018, 155, 345–359. [Google Scholar] [CrossRef]
- Hernández, R.; Kubota, C. Physiological responses of cucumber seedlings under different blue and red photon flux ratios using LEDs. Environ. Exp. Bot. 2016, 121, 66–74. [Google Scholar] [CrossRef]
- Vaštakaitė, V.; Viršilė, A.; Brazaitytė, A.; Samuolienė, G.; Jankauskienė, J.; Sirtautas, R.; Novičkovas, A.; Dabašinskas, L.; Sakalauskienė, S.; Miliauskienė, J.; et al. The effect of blue light dosage on growth and antioxidant properties of microgreens. Sodinink. Daržinink. 2015, 34, 25–35. [Google Scholar]
- Samuolienė, G.; Sirtautas, R.; Brazaitytė, A.; Sakalauskaitė, J.; Sakalauskienė, S.; Duchovskis, P. The impact of red and blue light-emitting diode illumination on radish physiological indices. Open Life Sci. 2011, 6, 821–828. [Google Scholar] [CrossRef]
- Lobiuc, A.; Vasilache, V.; Oroian, M.; Stoleru, T.; Burducea, M.; Pintilie, O.; Zamfirache, M.-M. Blue and red LED illumination improves growth and bioactive compounds contents in acyanic and cyanic Ocimum basilicum L. microgreens. Molecules 2017, 22, 2111. [Google Scholar] [CrossRef] [PubMed]
- Gundel, P.E.; Pierik, R.; Mommer, L.; Ballaré, C.L. Competing neighbors: Light perception and root function. Oecologia 2014, 176, 1–10. [Google Scholar] [CrossRef] [PubMed]
- Samuolienė, G.; Viršilė, A.; Brazaitytė, A.; Jankauskienė, J.; Sakalauskienė, S.; Vaštakaitė, V.; Novičkovas, A.; Viškelienė, A.; Sasnauskas, A.; Duchovskis, P. Blue light dosage affects carotenoids and tocopherols in microgreens. Food Chem. 2017, 228, 50–56. [Google Scholar] [CrossRef]
- Gamon, J.A.; Surfus, J.S. Assessing leaf pigment content and activity with a reflectometer. New Phytol. 1999, 143, 105–117. [Google Scholar] [CrossRef]
- Jansen, M.; Pinto, P.; Nagel, K.A.; van Dusschoten, D.; Fiorani, F.; Rascher, U.; Schneider, H.U.; Walter, A.; Schurr, U. Non-invasive phenotyping methodologies enable the accurate characterization of growth and performance of shoots and roots. In Genomics of Plant Genetic Resources, 1st ed.; Tuberosa, R., Graner, A., Frison, E., Eds.; Springer: Berlin, Germany, 2014; pp. 173–206. [Google Scholar]
- Zheng, L.; Van Labeke, M.-C. Long-term effects of red- and blue-light emitting diodes on leaf anatomy and photosynthetic efficiency of three ornamental pot plants. Front. Plant Sci. 2017, 8, 917. [Google Scholar] [CrossRef]
- Araújo, G.C.; Gonzalez, M.H.; Ferreira, A.G.; Nogueira, A.R.A.; Nóbrega, A.J. Effect of acid concentration on closed-vessel microwave-assisted digestion of plant materials. Spectrochim. Acta Part B Spectrosc. 2002, 57, 2121–2132. [Google Scholar] [CrossRef]
- Barbosa, J.T.P.; Santos, C.M.; Peralva, V.N.; Flores, E.M.; Korn, M.; Nóbrega, J.A.; Korn, M.G.A. Microwave-assisted diluted acid digestion for trace elements analysis of edible soybean products. Food Chem. 2015, 175, 212–217. [Google Scholar] [CrossRef] [PubMed]
- Merino, L. Development and Validation of a Method for Determination of Residual Nitrite/Nitrate in Foodstuffs and Water After Zinc Reduction. Food Anal. Methods 2009, 2, 212–220. [Google Scholar] [CrossRef]


| Treatment | Phosphorus | Potassium | Calcium | Magnesium | Sulfur |
|---|---|---|---|---|---|
| B0R100 | 8.27 ± 0.12 b | 22.44 ± 0.43 c | 16.92 ± 0.12 c | 5.21 ± 0.07 b | 13.78 ± 0.26 bc |
| B10R90 | 8.04 ± 0.14 b | 22.62 ± 0.17 c | 16.43 ± 0.13 c | 5.24 ± 0.07 b | 13.62 ± 0.17 c |
| B25R75 | 8.40 ± 0.20 b | 22.61 ± 0.16 c | 16.78 ± 0.28 c | 5.36 ± 0.11 b | 13.44 ± 0.10 c |
| B50R50 | 9.84 ± 0.10 a | 24.37 ± 0.11 b | 19.01 ± 0.25 a | 5.90 ± 0.10 a | 14.66 ± 0.14 a |
| B75R25 | 9.78 ± 0.17 a | 24.67 ± 0.20 b | 18.37 ± 0.18 ab | 5.86 ± 0.11 a | 14.77 ± 0.14 a |
| B100R0 | 9.34 ± 0.38 a | 26.53 ± 0.54 a | 17.82 ± 0.51 b | 5.86 ± 0.19 a | 14.39 ± 0.46 ab |
| Treatment | Manganese | Iron | Zinc | Copper | Boron |
|---|---|---|---|---|---|
| B0R100 | 0.062 ± 0.000 bc | 0.094 ± 0.002 d | 0.078 ± 0.001 de | 0.0099 ± 0.0004 d | 0.029 ± 0.001 ab |
| B10R90 | 0.060 ± 0.001 c | 0.114 ± 0.002 b | 0.080 ± 0.000 d | 0.0103 ± 0.0001 b | 0.029 ± 0.002 ab |
| B25R75 | 0.065 ± 0.002 b | 0.100 ± 0.002 cd | 0.076 ± 0.001 e | 0.0102 ± 0.0001 cd | 0.025 ± 0.002 b |
| B50R50 | 0.068 ± 0.001 a | 0.102 ± 0.001 c | 0.089 ± 0.001 c | 0.0112 ± 0.0002 c | 0.034 ± 0.006 a |
| B75R25 | 0.070 ± 0.001 a | 0.129 ± 0.003 a | 0.097 ± 0.001 a | 0.0122 ± 0.0002 a | 0.026 ± 0.001 ab |
| B100R0 | 0.070 ± 0.002 a | 0.126 ± 0.003 a | 0.093 ± 0.003 b | 0.0121 ± 0.0002 a | 0.033 ± 0.001 a |
| Treatment | Hypocotyl Length, cm | Root Length, cm | Leaf Area, cm2 | Shoot Fresh Weight, mg | Shoot Dry Weight, mg | Root Fresh Weight, mg | Root Dry Weight, mg | Shoot-to-Root Ratio |
|---|---|---|---|---|---|---|---|---|
| B0R100 | 3.37 ± 0.10 a | 6.95 ± 0.42 ab | 2.43 ± 0.31 b | 68.65 ± 5.07 ab | 4.10 ± 0.86 a | 10.82 ± 1.04 a | 0.68 ± 0.03 a | 5.95 ± 0.98 ab |
| B10R90 | 2.49 ± 0.14 b | 6.30 ± 0.13 b | 2.19 ± 0.19 b | 63.20 ± 4.05 ab | 4.14 ± 0.09 a | 11.97 ± 0.09 a | 0.75 ± 0.04 a | 5.51 ± 0.16 b |
| B25R75 | 2.30 ± 0.26 b | 6.53 ± 0.27 ab | 2.73 ± 0.19 a | 70.46 ± 4.23 ab | 4.27 ± 0.48 a | 12.46 ± 2.64 a | 0.78 ± 0.04 a | 5.46 ± 0.44 b |
| B50R50 | 2.15 ± 0.14 b | 6.80 ± 0.55 ab | 2.30 ± 0.15 b | 60.07 ± 1.54 b | 3.60 ± 0.35 b | 11.60 ± 2.31 a | 0.69 ± 0.09 a | 5.24 ± 0.25 b |
| B75R25 | 1.38 ± 0.20 c | 7.14 ± 0.23 ab | 2.25 ± 0.11 b | 60.99 ± 3.52 b | 3.79 ± 0.24 b | 11.25 ± 0.50 a | 0.70 ± 0.06 a | 5.43 ± 0.23 b |
| B100R0 | 3.29 ± 0.22 a | 7.46 ± 0.42 a | 3.08 ± 0.23 a | 78.73 ± 13.21 a | 4.41 ± 0.77 a | 11.34 ± 1.51 a | 0.62 ± 0.13 a | 7.17 ± 0.79 a |
| Treatment | Phosphorus | Potassium | Calcium | Magnesium | Sulfur |
|---|---|---|---|---|---|
| B0R100 | 7.89 ± 0.17 bc | 23.56 ± 0.36 ab | 14.71 ± 0.12 b | 5.67 ± 0.05 a | 10.3 ± 0.45 e |
| B10R90 | 7.70 ± 0.26 bc | 22.53 ± 0.64 b | 15.53 ± 0.47 ab | 5.57 ± 0.22 a | 10.90 ± 0.06 d |
| B25R75 | 8.56 ± 0.08 a | 23.51 ± 0.26 ab | 16.33 ± 0.09 a | 5.71 ± 0.08 a | 12.30 ± 0.20 c |
| B50R50 | 8.39 ± 0.28 ab | 23.30 ± 0.27 ab | 16.34 ± 0.41 a | 5.61 ± 0.15 a | 13.19 ± 0.23 b |
| B75R25 | 8.51 ± 0.26 a | 23.26 ± 0.43 ab | 15.48 ± 0.39 ab | 5.70 ± 0.14 a | 13.86 ± 0.30 b |
| B100R0 | 8.90 ± 0.17 a | 24.46 ± 0.55 a | 16.20 ± 0.37 a | 5.88 ± 0.14 a | 14.95 ± 0.19 a |
| Treatment | Manganese | Iron | Zinc | Copper | Boron |
|---|---|---|---|---|---|
| B0R100 | 0.056 ± 0.000 b | 0.082 ± 0.001 c | 0.051 ± 0.001 b | 0.0052 ± 0.0001 b | 0.018 ± 0.001 a |
| B10R90 | 0.054 ± 0.001 c | 0.090 ± 0.003 bc | 0.052 ± 0.002 b | 0.0056 ± 0.0002 b | 0.022 ± 0.005 a |
| B25R75 | 0.056 ± 0.000 b | 0.083 ± 0.001 c | 0.053 ± 0.001 b | 0.0059 ± 0.0001 b | 0.018 ± 0.003 a |
| B50R50 | 0.055 ± 0.001 bc | 0.084 ± 0.004 c | 0.055 ± 0.005 ab | 0.0076 ± 0.0001 a | 0.021 ± 0.002 a |
| B75R25 | 0.055 ± 0.001 bc | 0.103 ± 0.004 a | 0.060 ± 0.001 a | 0.0079 ± 0.0011 a | 0.021 ± 0.006 a |
| B100R0 | 0.062 ± 0.000 a | 0.095 ± 0.003 b | 0.061 ± 0.002 a | 0.0089 ± 0.0001 a | 0.026 ± 0.001 a |
| Treatment | Hypocotyl Length, cm | Root Length, cm | Leaf Area, cm2 | Shoot Fresh Weight, mg | Shoot Dry Weight, mg | Root Fresh Weight, mg | Root Dry Weight, mg | Shoot-to-Root Ratio |
|---|---|---|---|---|---|---|---|---|
| B0R100 | 4.92 ± 0.20 a | 10.00 ± 0.36 a | 3.44 ± 0.20 a | 109.65 ± 6.58 ab | 6.24 ± 0.62 ab | 20.80 ± 1.96 b | 1.35 ± 0.14 c | 4.63 ± 0.07 b |
| B10R90 | 3.64 ± 0.24 b | 8.45 ± 1.26 a | 3.1 ± 0.25 a | 112.38 ± 5.92 ab | 7.23 ± 0.15 a | 28.65 ± 0.89 a | 1.72 ± 0.04 a | 4.20 ± 0.13 c |
| B25R75 | 3.67 ± 0.12 b | 9.04 ± 1.85 a | 3.0 ± 0.30 a | 116.19 ± 6.51 ab | 6.69 ± 0.12 ab | 28.02 ± 2.94 a | 1.61 ± 0.02 ab | 4.15 ± 0.14 c |
| B50R50 | 3.37 ± 0.13 b | 9.29 ± 0.83 a | 3.2 ± 0.29 a | 119.42 ± 6.65 a | 6.93 ± 0.26 a | 28.91 ± 2.06 a | 1.67 ± 0.14 ab | 4.15 ± 0.26 c |
| B75R25 | 3.38 ± 0.16 b | 8.2 ± 1.00 a | 2.9 ± 0.25 a | 100.14 ± 1.80 b | 5.82 ± 0.14 b | 23.01 ± 0.88 b | 1.44 ± 0.03 bc | 4.04 ± 0.13 c |
| B100R0 | 5.18 ± 0.14 a | 9.9 ± 0.85 a | 3.1 ± 0.17 a | 125.16 ± 8.64 a | 6.71 ± 0.61 ab | 22.60 ± 1.01 b | 1.29 ± 0.09 c | 5.18 ± 0.16 a |
| Treatments | Treatment Code | 660 nm LED | 447 nm LED |
|---|---|---|---|
| μmol m−2 s−1 | |||
| 0%B:100%R | B0R100 | 250 | 0 |
| 10%B:90%R | B10R90 | 225 | 25 |
| 25%B:75%R | B25R75 | 187 | 63 |
| 50%B:50%R | B50R50 | 125 | 125 |
| 75%B:25%R | B75R25 | 63 | 187 |
| 100%B:0%R | B100R0 | 0 | 250 |
Publisher’s Note: MDPI stays neutral with regard to jurisdictional claims in published maps and institutional affiliations. |
© 2021 by the authors. Licensee MDPI, Basel, Switzerland. This article is an open access article distributed under the terms and conditions of the Creative Commons Attribution (CC BY) license (https://creativecommons.org/licenses/by/4.0/).
Share and Cite
Brazaitytė, A.; Miliauskienė, J.; Vaštakaitė-Kairienė, V.; Sutulienė, R.; Laužikė, K.; Duchovskis, P.; Małek, S. Effect of Different Ratios of Blue and Red LED Light on Brassicaceae Microgreens under a Controlled Environment. Plants 2021, 10, 801. https://doi.org/10.3390/plants10040801
Brazaitytė A, Miliauskienė J, Vaštakaitė-Kairienė V, Sutulienė R, Laužikė K, Duchovskis P, Małek S. Effect of Different Ratios of Blue and Red LED Light on Brassicaceae Microgreens under a Controlled Environment. Plants. 2021; 10(4):801. https://doi.org/10.3390/plants10040801
Chicago/Turabian StyleBrazaitytė, Aušra, Jurga Miliauskienė, Viktorija Vaštakaitė-Kairienė, Rūta Sutulienė, Kristina Laužikė, Pavelas Duchovskis, and Stanisław Małek. 2021. "Effect of Different Ratios of Blue and Red LED Light on Brassicaceae Microgreens under a Controlled Environment" Plants 10, no. 4: 801. https://doi.org/10.3390/plants10040801
APA StyleBrazaitytė, A., Miliauskienė, J., Vaštakaitė-Kairienė, V., Sutulienė, R., Laužikė, K., Duchovskis, P., & Małek, S. (2021). Effect of Different Ratios of Blue and Red LED Light on Brassicaceae Microgreens under a Controlled Environment. Plants, 10(4), 801. https://doi.org/10.3390/plants10040801