Article

Effects of Monochromatic Illumination with LEDs Lights on the Growth and Photosynthetic Performance of Auxenochlorella protothecoides in Photo- and Mixotrophic Conditions

by
Giorgos Markou
1,*,
Alexandros Diamantis
1,
Evagelina Korozi
2,
Vasiliki Tsagou
2,
Io Kefalogianni
2 and
Iordanis Chatzipavlidis
2
1
Institute of Technology of Agricultural Products, Hellenic Agricultural Organization-Demeter, L. Sof. Venizelou 1, 14123 Lykovrysi, Greece
2
Laboratory of General and Agricultural Microbiology, Department of Crop Science, Agricultural University of Athens, Iera Odos 75, 11855 Athens, Greece
*
Author to whom correspondence should be addressed.
Plants 2021, 10(4), 799; https://doi.org/10.3390/plants10040799
Submission received: 24 February 2021 / Revised: 10 April 2021 / Accepted: 11 April 2021 / Published: 19 April 2021
(This article belongs to the Special Issue Algal Biomass)

Abstract

:
This study examined the effects of monochromatic illumination (blue, red, green and yellow) employing light-emitting diodes (LEDs), trophic conditions (photoautotrophic and mixotrophic), and nitrogen availability (high and low peptone concentration) on the growth and biochemical composition of Auxenochlorella protothecoides. The results revealed that mixotrophic conditions did not favor A. protothecoides, giving lower growth rates compared to heterotrophy (dark conditions). However, mixotrophy gave significantly higher growth rates compared to photoautotrophy. The best light wavelengths for mixotrophic cultivation were that of white and red. In all cases investigated in this study, high peptone concentration (4 g/L) resulted in decreased growth rates. Regarding the biochemical composition of A. protothecoides, the strongest effect, irrespective of trophic conditions, was caused by nitrogen availability (peptone concentration). Specifically, at nitrogen replete conditions (4 g/L peptone), biomass was rich in proteins (32–67%), whereas under deplete conditions (0.5 g/L peptone), A. protothecoides accumulated mainly carbohydrates (up to 56%). Mixotrophic conditions generally favored higher carbohydrate content, whereas photoautotrophic conditions favored higher protein content. The different illumination spectra did not have any clear effect on the biochemical composition (metabolites content), except that, in all trophic conditions, the use of the green spectrum resulted in higher chlorophyll b content. Chlorophyll a fluorescence studies revealed that the trophic conditions and the high peptone concentrations impacted the photosystem II (PSII) performance, and also affected plastoquinone re-oxidation kinetics and the heterogeneity of the PSII reaction centers.

1. Introduction

Microalgae are an important renewable source for the production of various biomolecules applied in different sectors (food industry, chemical industry, medicine, etc.) and offer numerous possibilities for developing a modern bioeconomy [1]. Microalgae are mainly photoautotrophic (photosynthetic) microorganisms and thus have attracted interest as a means of harvesting light energy and converting it into valuable metabolites [1,2]. However, microalgae display flexibility in their metabolism and are capable of growing under different trophic conditions, namely photoautotrophy, heterotrophy, and mixotrophy. Under photoautotrophic growth conditions, microalgae utilize sunlight as an energy source and fix CO2. Under heterotrophic conditions, microalgae utilize organic molecules, such as glucose, glycerol, and acetate, as energy and carbon sources, and under mixotrophic conditions, in addition to the effects of heterotrophy, they also perform photosynthesis and can simultaneously utilize CO2 and organic substrates as a carbon source [3]. Mixotrophic growth conditions are of particular importance, particularly at the industrial scale, because they overcome the light limitation of photoautotrophy and significantly reduce the requirements of large land areas for the production of microalgal biomass [4]. A suitable organic carbon source for the mixotrophic or heterotrophic growth of microalgae is glycerol, a waste-stream of industrial biodiesel production that is available in large quantities [5]. Α highly promising microalgal species for glycerol utilization is Auxenochlorella protothecoides, and several studies have demonstrated its strong potential to be grown using glycerol [6,7,8,9,10].
Light intensity (quantity) and light spectra (quality) are important parameters for microalgal growth. Although microalgal growth using solar energy is the most economical way to produce microalgae, it requires large outdoor areas and also suffers from the eventually low photosynthetic efficiency observed at full sunlight intensities, i.e., the low conversion of light energy into biomass (in practice 1–1.5% of solar light) equivalent to 2–3% of photosynthetically active radiation. Even at the maximum theoretical efficiency of solar energy conversion (≈11%), the strongest illuminated outer cell layers lead to a high dissipation rate (>80%) of light energy because unused thermal energy activates photoprotective mechanisms (such as non-photochemical quenching), thus resulting in overall low photosynthetic efficiencies. This high energy dissipation is due to the mismatch between the absorption and the utilization of energy during the dark reactions [11,12,13]. Artificial illumination can significantly increase photosynthetic efficiency by avoiding photoinhibition due to high light intensities [14]. Light spectra have an important impact on the photosynthetic process and hence on growth because not all light wavelengths are absorbed equally by the photosynthetically active pigments of microalgae. Chlorophyll a is the core photosynthetically active pigment of the reaction centers, whereas chlorophyll b, c and d are accessory pigments that extend the range of light absorption. Chlorophylls (green pigments) have two major absorption bands: blue or blue-green (450–475 nm) and red (630–675 nm) [15]. Moreover, several studies have demonstrated that the light quality has an impact on the biochemical composition of microalgae, triggering the accumulation of major metabolites, such as lipids, proteins, and carbohydrates, or pigments such as chlorophylls, carotenoids, or cyanobacterial phycocyanin [16,17,18,19]. Light-emitting diodes (LEDs) can serve as an energy efficient light source for microalgal growth compared to traditional lighting (halogen bulbs, fluorescence bulbs, incandescent bulbs, etc.), because they emit only at given bands of wavelengths that are absorbed by the photosynthetic pigments [18,20]. Moreover, LEDs can potentially serve as an effective light source providing improved capabilities for the control and manipulation of the biochemical composition of microalgae. However, there is a lack of published research work using monochromatic illumination for the growth and the manipulation of the biochemical composition of microalgae grown under mixotrophic conditions.
Chlorophyll fluorescence analysis is a highly useful tool for obtaining information about the photosynthetic process and in particular of the photosystem II (PSII). Although a vast literature exists on chlorophyll fluorescence studies on higher plants and photosynthetic microorganisms (such as microalgae) grown under different conditions (focusing mainly on stress conditions), few data are available regarding chlorophyll fluorescence of mixotrophically grown microalgae [21,22]. Hence, the overall aim of this work was to study the effect of selected monochromatic LEDs (blue, green, yellow, and red) on the growth and biochemical composition of the microalga A. protothecoides. In addition, this study aimed to study the effect of the trophic conditions on the PSII performance through chlorophyll fluorescence measurements and analysis.

2. Results and Discussion

There is an increased interest in utilizing artificial light for growing microalgae, particularly for the production of high value products, such as pigments, unsaturated fatty acids, and proteins. Among different artificial light types, the use of LEDs is considered to be the most energy efficient, mainly because they emit precise light wavelength bands that can be absorbed by the photosynthetic antenna [23,24]. Therefore, in this study different LED colors were used to assess the growth ability of A. protothecoides and its biochemical composition changes in photoautotrophic and mixotrophic metabolisms. The cultures with low glycerol concentration (0.5 g/L) were considered as photoautotrophic, and those with high glycerol concentration (10 g/L) as mixotrophic (see Section 3.2 for more details on the experimental design).

2.1. Effect of Trophic Conditions and Monochromatic Illumination on the Growth Rates of A. protothecoides

2.1.1. Photoautotrophic Conditions

Figure 1 presents the effect of the trophic conditions and the monochromatic illumination on the growth rates of A. protothecoides with 0.5 and 4 g/L peptone (PL and PH, respectively). Figure 1a shows the photoautotrophic cultures with low peptone concentration (PL), which are considered to reflect a typical form of photoautotrophy (see Section 2.2 for more details). The highest growth rates were obtained with white LEDs (0.18 1/d) followed by red (0.158 1/d; with statistically significant differences between them; p < 0.05), whereas blue (0.111 1/d), green (0.101 1/d), and yellow light (0.074 1/d) displayed much lower growth rates. However, all cultures illuminated with monochromatic lights had significantly higher growth rates compared to the negative control (grown on dark conditions). Because the PL cultures grew photoautotrophically, the differences in the growth rates reflect the diverse ability of A. protothecoides to harvest the different light wavelengths. Figure A2 (see Appendix A) shows the spectrum analysis of each monochromatic LED used in the study and the associated absorption peaks of the different pigments of the photosynthetic antenna of microalgae. Based on the absorption peaks of chlorophyll a, b, and carotenoids, yellow and green lights are poorly absorbed, whereas white, blue, and red are absorbed by the main photosynthetic pigments. Because white, red, and blue are the main light wavelengths that are absorbed by the photosynthetic pigments, it was initially hypothesized that they would display higher growth rates compared to the poorly absorbed green and yellow. The effects on the PL cultures confirm this hypothesis. A few other reports confirm that microalgae do not grow well under green light [25,26,27] because this wavelength is poorly absorbed by the photosynthetic antenna and cannot provide useful energy for photosynthesis. However, there is disagreement concerning yellow light, as Hultberg et al. [26] and de Mooij et al. [28] found that yellow light was very effective for biomass production of Chlorella vulgaris and Chlamydomonas reinhardtii, respectively. de Mooij et al. [28] indicate that yellow light could be used more efficiently, especially when light is provided in high densities compared to red, blue, or white because the latter result in an oversaturation of the photosynthetic antenna, whereas the excess light is wasted as energy through heat dissipation. However, because light was provided in the present study significantly below the saturation point (usually around 200–400 μmol/m2/s) [15], yellow light resulted in lower growth rates compared to red, white, and blue.
In Figure 1b the effect of the different light wavelengths on the cultures with high peptone (PH) content is shown. In all cases there is a marked decrease (p < 0.01) in the growth rates compared to the low peptone cultures (PL), except for the negative control (dark conditions), where it seems that peptone acted in the long term as an energy source for cells and supported a slightly better growth (see Section 3.2 for more details on peptone used as a carbon source). The decreased growth rates of PH suggest that peptone at relative higher concentrations has an inhibitory effect on A. protothecoides grown under photoautotrophic conditions. Among the wavelengths that are more strongly absorbed by the photosynthetic pigments, blue LEDs showed significantly lower growth rates compared to white and red. These results are in agreement with the study of Chen and Su [29], who also obtained lower biomass production using blue light in Auxenochlorella pyrenoidosa compared to red and white. Blue light has shorter wavelengths and therefore contains higher energy [30]. Hence, it is more likely to cause photo-inhibition. However, various studies demonstrate that blue color is very effective and promotes higher biomass production in other microalgal species [19,24,31]. The diverse results on the literature reflect that the effectiveness of light wavelength on biomass production could be species dependent. This could be the outcome of the content and ratio of photosynthetically active pigments, the light saturation level, and in general the physiological characteristics of each microalgal species [15,32]. The present results suggest that A. protothecoides reproduction capacity is not favored by the illumination with blue light.

2.1.2. Mixotrophic Conditions

Figure 2 illustrates the growth rates of A. protothecoides grown mixotrophically on glycerol with 0.5 and 4 g/L peptone (ML and MH, respectively) and illuminated with different light wavelengths. Mixotrophy gave significantly higher growth rates (p < 0.01) compared to the autotrophic conditions, which shows the positive response and ability of A. protothecoides to grow on glycerol as a source of energy and organic carbon. Dark conditions in the presence of glycerol (heterotrophic) gave the highest growth rates for both MH and ML (0.231 and 0.279 1/d, respectively). In the series of cultures with low peptone concentration (ML; 0.5 g/L), the highest growth rates were obtained under mixotrophic conditions with yellow illumination (0.277 1/d), followed by white illumination (0.245 1/d), red and green (0.220 and 0.212 1/d, respectively), whereas blue light displayed the lowest values (0.189 1/d). As in photoauthotrophic conditions, under mixotrophy the increased peptone concentration also showed lower growth rates in all individual treatments studied (p < 0.01). Among the light wavelengths tested on MH cultures, yellow, white, and blue gave the highest values (0.215, 0.208, and 0.207 1/d, respectively) followed by green and red lights (0.181 and 0.165 1/d, respectively).
The lower growth rates of illuminated cells were most probably due to a potential inhibition effect of light on A. protothecoides grown mixotrophycally. As was reported by Xiao et al. [33], the proteomics analysis of A. protothecoides cultivated in glucose revealed that light had an apparent restrictive effect on the metabolic process of organic carbon assimilation. In addition, it was demonstrated here that the mixotrophic conditions also affected the photosynthetic process and the photosynthetic apparatus heterogeneity of A. protothecoides. The various parameters and indexes of chlorophyll fluorescence (such as Fv/Fm and PIABS) revealed that in the presence of glycerol the overall photosynthetic performance was reduced (see Section 2.3). These results suggest that A. protothecoides is not favored by the mixotrophic conditions, probably due to a combination of reduced organic carbon assimilation and lower photosynthetic performance. It should be noted however that various microalgal species, for example Nannochloropsis sp. (Xu et al., 2004) or Platymonas subcordiformis (Xie et al., 2001), display higher growth rates and grow more quickly under mixotrophic conditions and therefore mixotrophy is considered as a beneficial culturing technique [34]. Α three-way ANOVA analysis revealed that there was a statistically significant difference (p < 0.01) between all three variable categories studied (light wavelengths, glycerol presence, and high/low peptone concentrations), confirming that each one of the three variables is a significant bioprocess parameter that influences the overall growth capability of A. protothecoides.

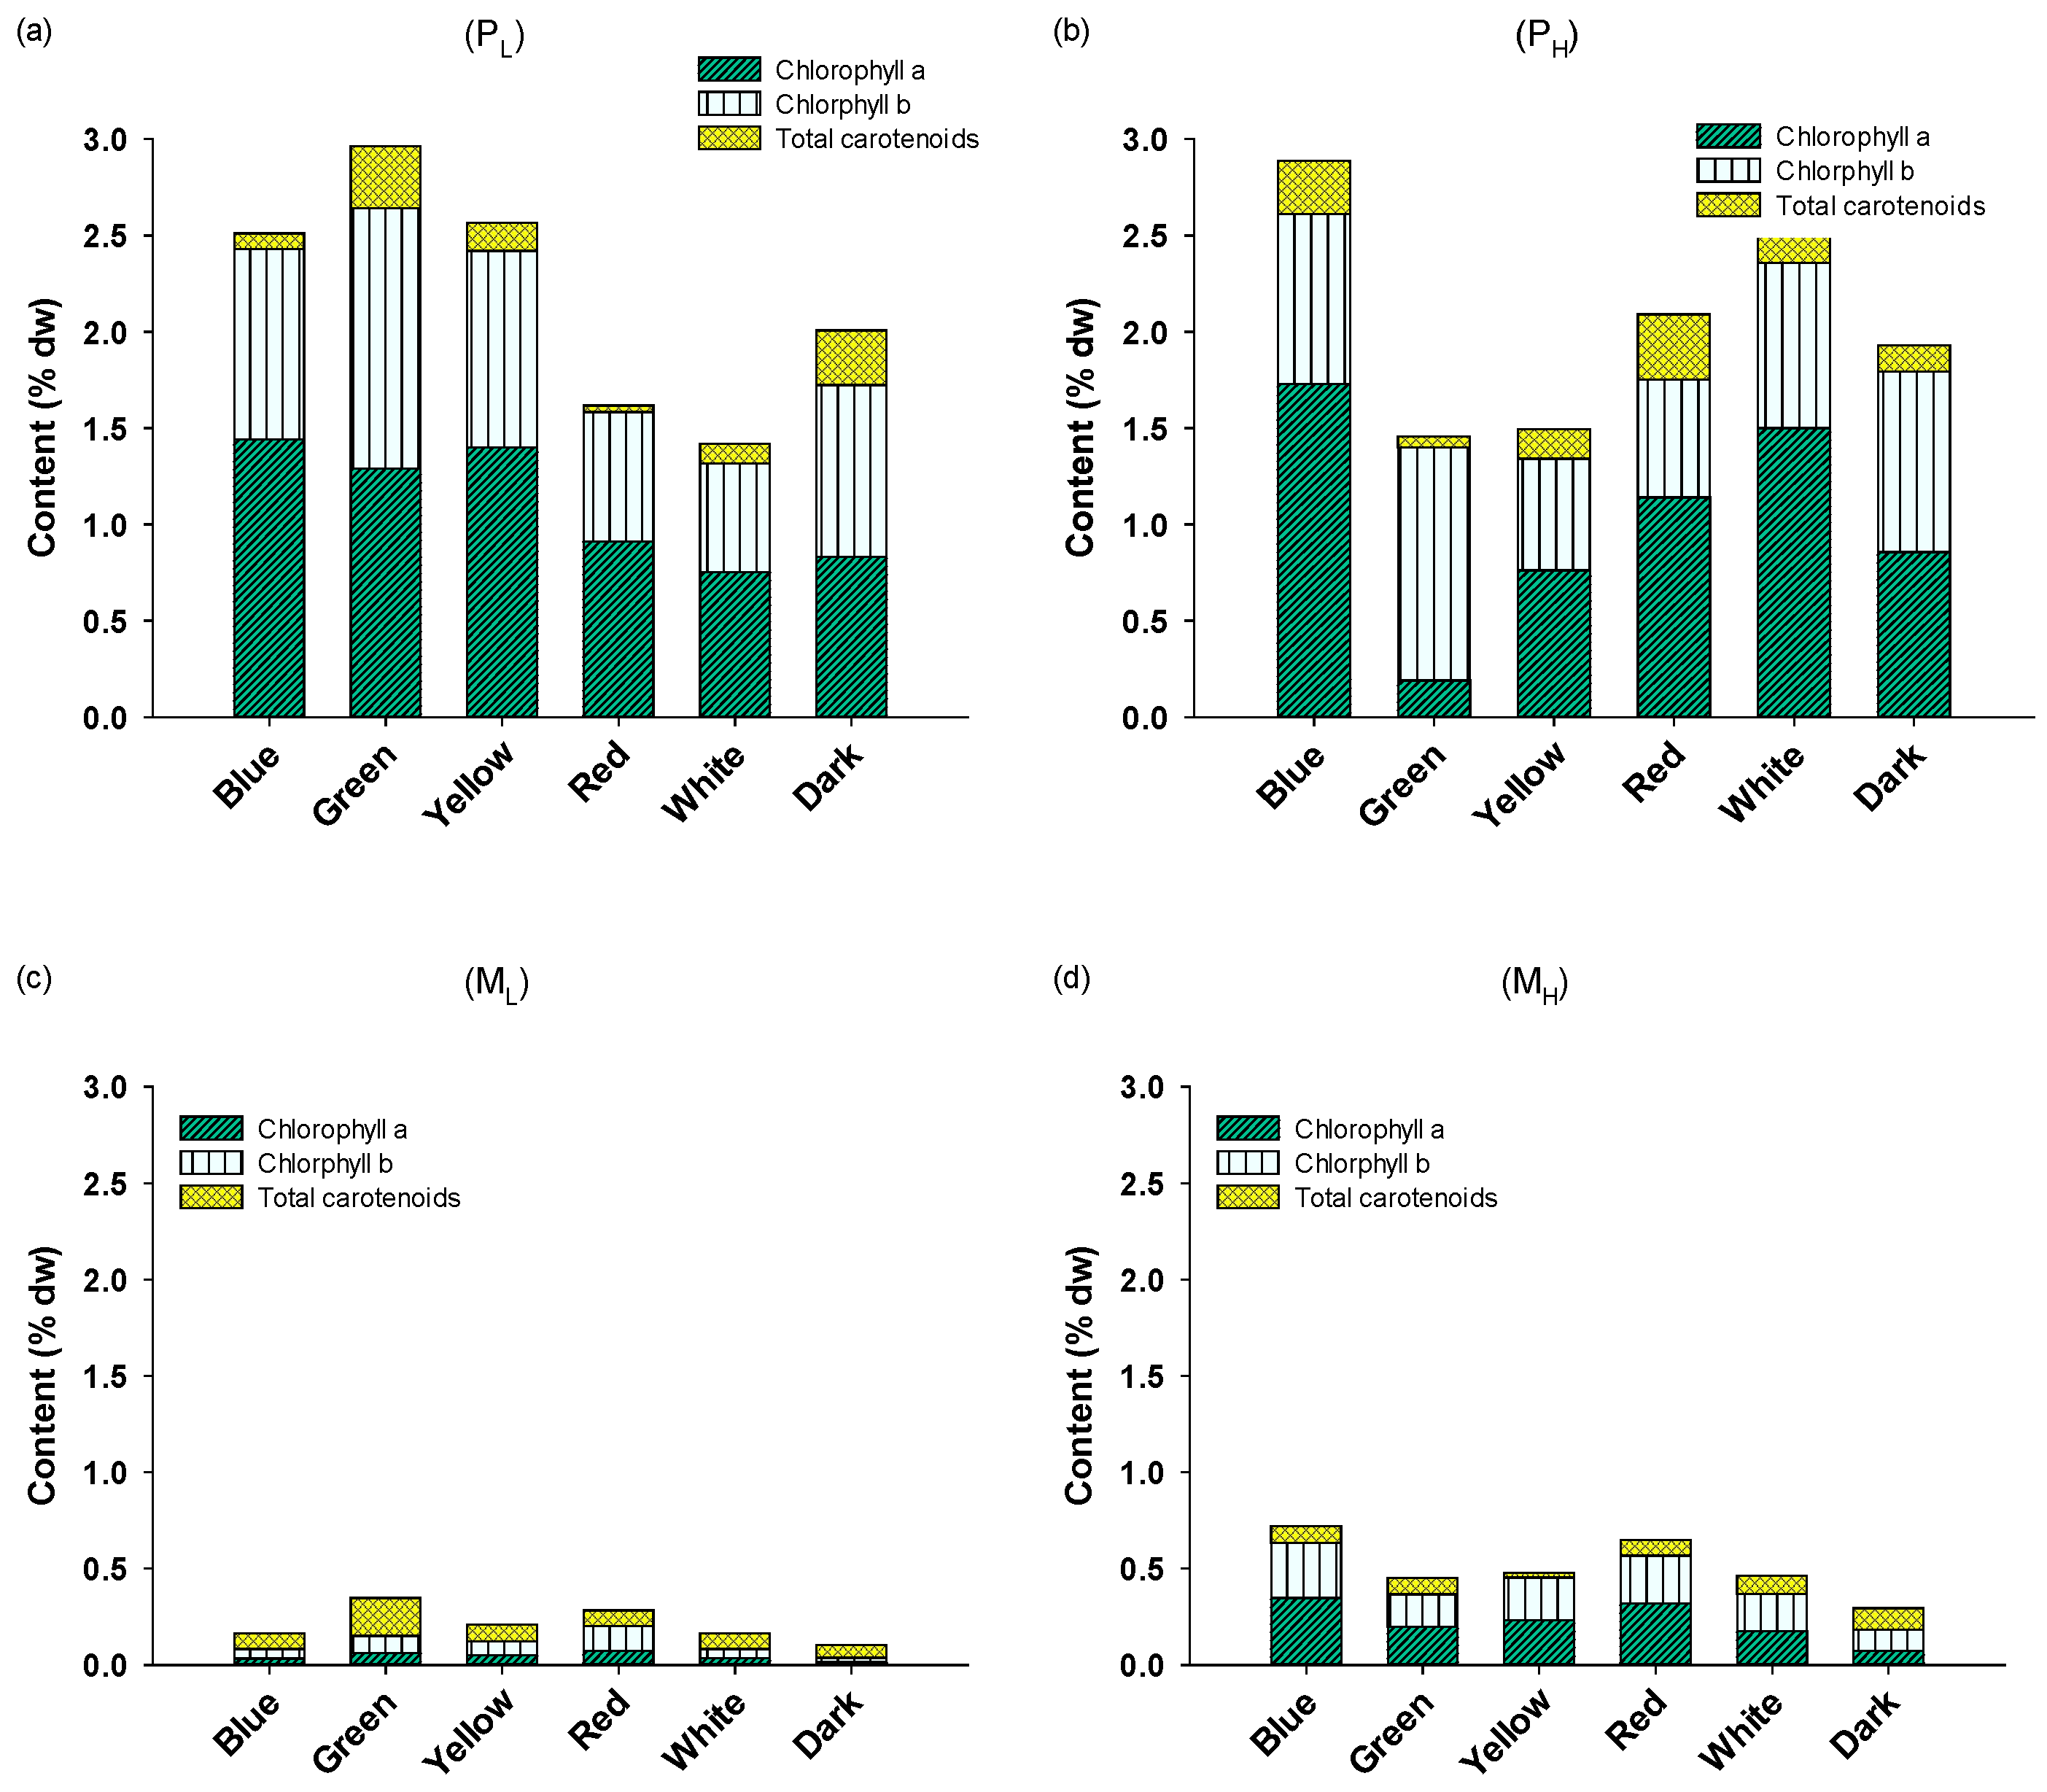
2.2. Biochemical Composition and Pigment Content of A. protothecoides

Figure 3 illustrates the biochemical composition (proteins, lipids, and carbohydrates) of A. protothecoides cultivated in the different conditions tested in this study. The main trend observed was that cultures with higher peptone concentrations (PH and MH) generally displayed increased (p < 0.01) protein content (49.5% on average) compared to PL and ML (29% on average) apparently due to the higher availability of nitrogen. Carbohydrate content was in general higher (p < 0.01) in the associated cultures with lower peptone content (42.5% vs. 29% on average in low and high peptone, respectively). Between the trophic conditions, photoautotrophic cultures gave higher contents for protein (48% on average) and lipid (11% on average), and lower for carbohydrates (26% on average) compared to the mixotrophic (30%, 5%, and 41% on average for proteins, lipids, and carbohydrates, respectively) (p < 0.01). Regarding lipid content, it was found that higher availability of nitrogen in the photoautotrophic cultures resulted in higher lipid content (p < 0.05). These results are not in line with other studies on A. protothecoides, which report lipid contents of more than 50% [35,36]. It appears that the strain used in this study under the specific conditions resulted in the accumulation either of proteins (when grown under nitrogen replete conditions) or carbohydrates (when grown under low nitrogen availability). It is well documented that under nitrogen limitation, microalgae change their metabolic pathways towards the synthesis of carbonaceous compounds (carbohydrates or lipids). In particular, the accumulation of carbohydrates has been observed as the first response of microalgae to nitrogen starvation, whereas lipids start to accumulate in later cultivation stages [37].
Regarding the effects of light wavelength, yellow light and dark conditions displayed the highest protein content, whereas the wavelengths white, red, and blue resulted in the triggering of the accumulation of carbohydrates. Overall, the three-way ANOVA analysis revealed that there was a significant interaction between the two variables (peptone concentration and trophic conditions), whereas the light wavelength did not result in statistically significant interactions. These results suggest that biochemical composition was ruled mainly by the availability of nitrogen and the trophic condition. Regarding the effect of light wavelength on lipid production, no clear observation was drawn (no statistically significant differences p > 0.05). Overall, there was a strong negative correlation (R2 = 0.83) between the protein and carbohydrate content, which indicates that the accumulation of one of them was accompanied by the decrease in the content of the other. No other strong correlation between proteins or carbohydrates and lipids or pigments was obtained (R2 < 0.5).
Mixotrophy significantly affected the pigment content (p < 0.01) (Figure 4), which was highly decreased (from about 2.1% on average for all pigments for PL and PH to about 0.35% on average for ML and MH). It has been frequently reported that mixotrophy itself influences the pigment content of microalgae [38], because in the presence of organic molecules (such as glucose or glycerol) cells synthesize less photosynthetically active pigments. Thus, under mixotrophic conditions cells can harvest energy from the organic compounds and are therefore less dependent on light availability compared to the photoautotrophic conditions, under which they absolutely depend on light energy for their growth [38]. A strong effect was also observed in green light, where chlorophyll b content was the highest in both PL and PH cultures (1.35% and 1.21%, respectively). No other clear effect of light wavelength on pigments was observed. Three-way ANOVA analysis revealed that the only statistically significant variable was the trophic conditions, and any other interaction was not significant.

2.3. Chlorophyll Fluorescence Studies

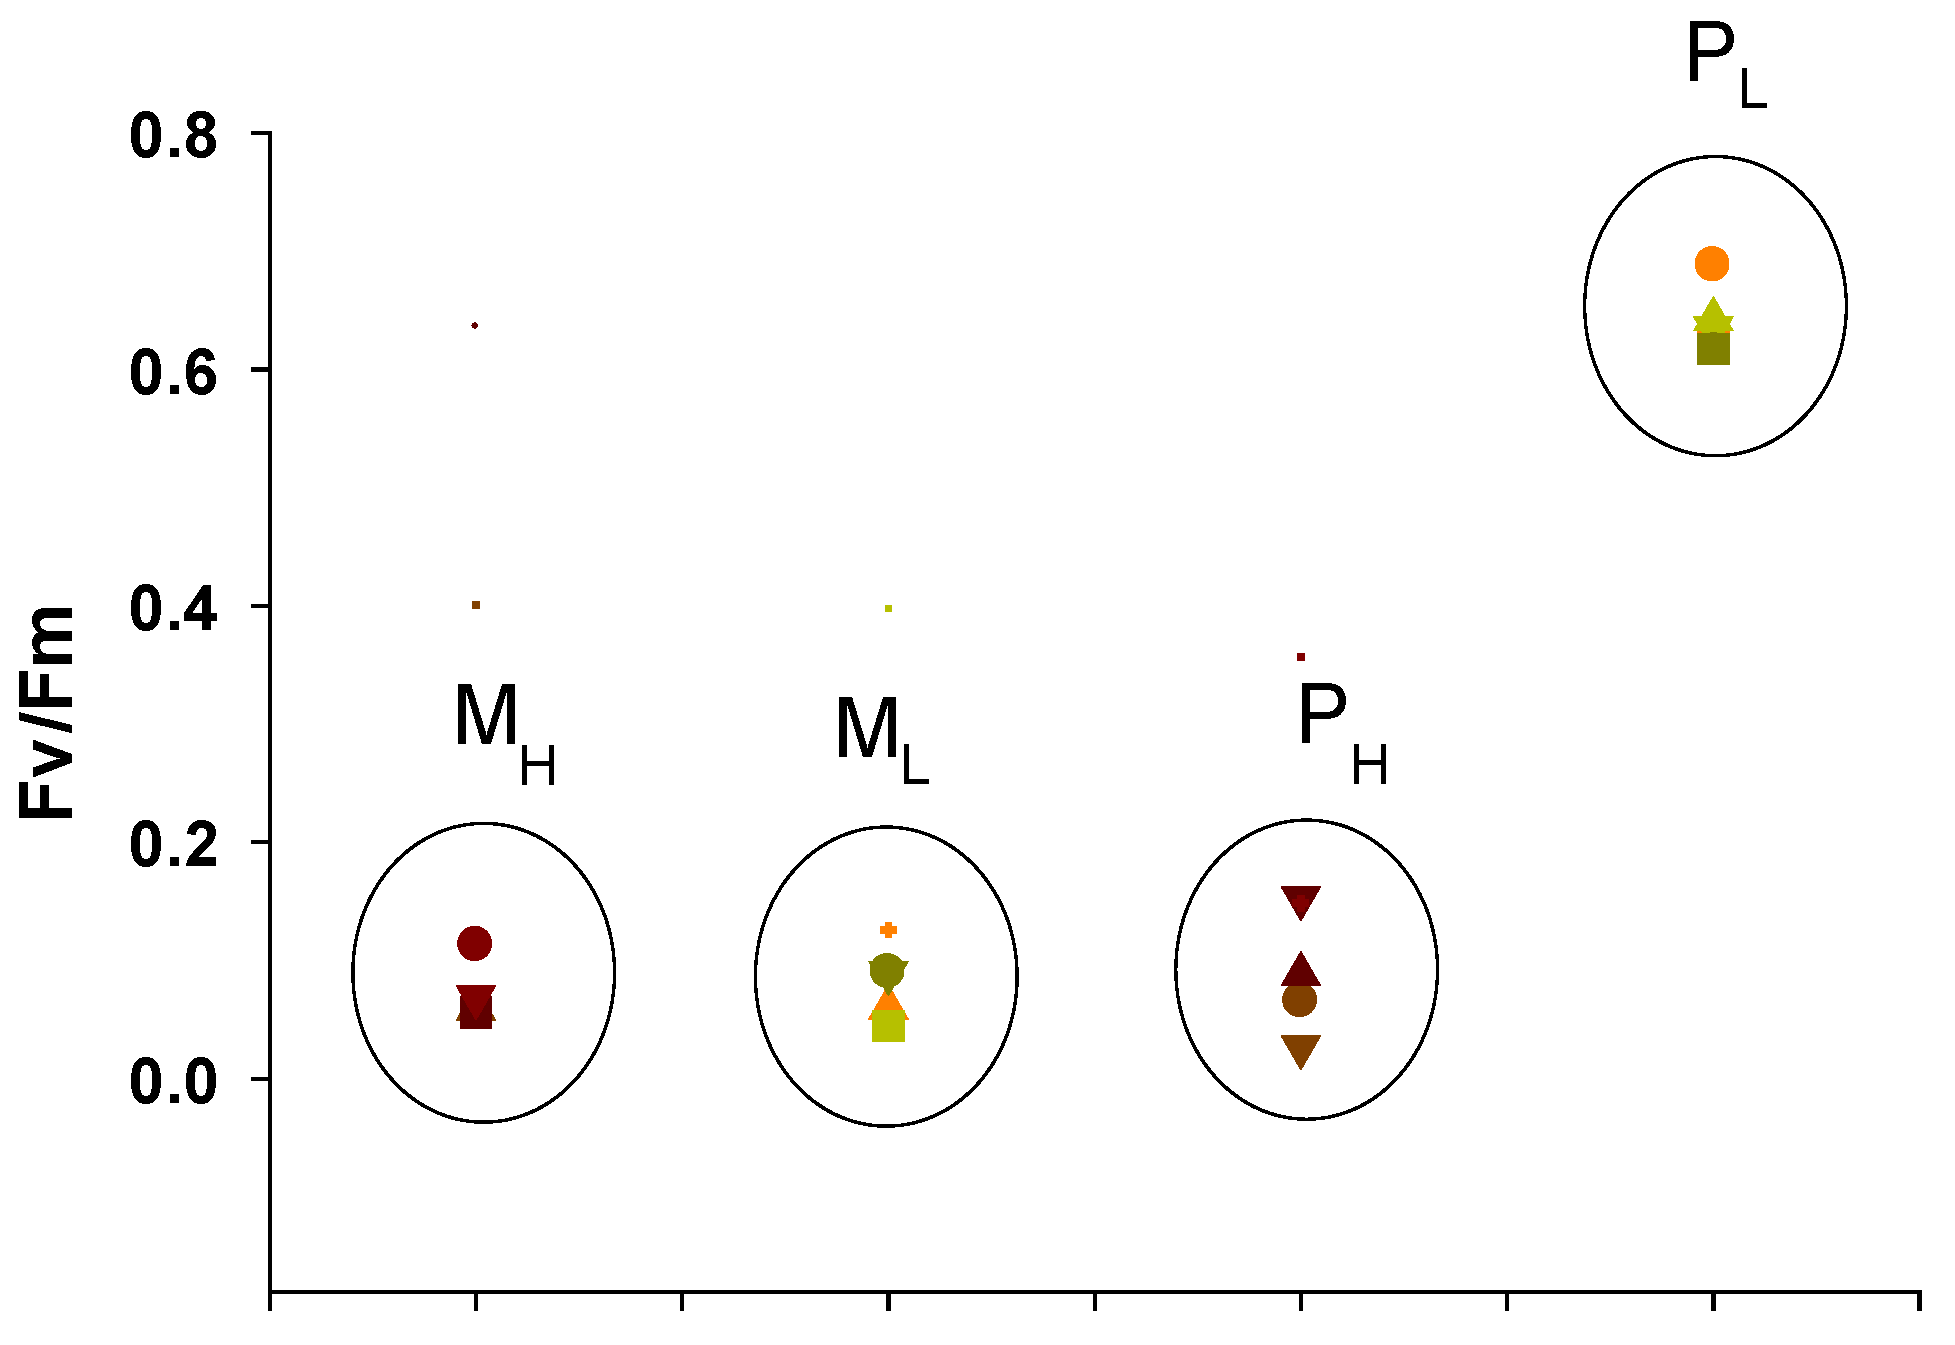
2.3.1. Maximum Quantum Yields of Primary Photochemistry and Non-Photochemical Quenching (NPQ)

Figure 5 illustrates the maximum quantum yields for primary photochemistry (Fv/Fm) of A. protothecoides cultivated under the different conditions. The results clearly show that the PL cultures, which represent the most typical photoautotrophic conditions, displayed Fv/Fm values in the range of 0.62–0.69, while all other cultures (MH, ML, and PH) had Fv/Fm in the range of 0.05–0.15. These results indicate that in the presence of organic substrate (glycerol) and under relatively high concentration of peptone, the photosynthetic efficiency of A. protothecoides was impacted and all the calculated parameters of the chlorophyll fluorescence analysis (Figure 5, Table 1) were significantly different compared to the PL cultures. The overall results (data not shown) indicated that there were similar trends in the chlorophyll fluorescence analysis of A. protothecoides grown under the different wavelengths, suggesting that the main factors influencing the photosynthetic performance were the trophic conditions and the availability of nitrogen. Therefore, in the following, for an easier discussion of the findings, only the results of the white LEDs as the reference light source are shown.
Table 1 lists the main calculated OJIP and non-photochemical quenching (NPQ) parameters that give an overview of the photosynthetic performance and photoprotection process. As shown in the inset figures of Table 1, chlorophyll fluorescence kinetics strongly impacted the cultures MH, ML, and PH. The presence of glycerol in MH and ML, i.e., the switching of the trophic conditions into mixotrophy and probably the alteration of the pigment content (Section 3.2) strongly impacted the photosynthetic processes, as shown by the chlorophyll fluorescence analysis. Regarding PH, the decrease in Fv/Fm should be related to some kind of inhibitory effect of peptone, because it is also reflected by the impacted growth rates (see Section 2.3.1). The most apparent changes revealed by the OJIP test were the increased absorption of light per reaction center (RC) and the increased dissipated energy (DIo/RC and φDo) of A. protothecoides in all three series (MH, ML, and PH). This subsequently had a strong effect on PIABS (Table 1). The parameter PIABS is an index that reflects the functionality of PSII, giving quantitative information on the current state of the PSII performance. This index can indicate whether the photosynthetic microorganisms are under stress conditions or whether they diversify their photosynthetic process for other reasons [39].
NPQ and qp values were very low for MH and PH, whereas they were much higher for ML and PL. These results suggest that under high peptone concentration the lower values of NPQ and qp indicate that non-photochemical and photochemical mechanism(s) were not able to be activated, and thus might cause photoinhibition, leading subsequently to lower growth rates. The low values of NPQ and qp may indicate possible alterations in the proton gradient formation across the thylakoid membrane. In contrast, ML and PL had significantly higher NPQ values, and therefore in these cultures the excess of light energy was probably dissipated more efficiently. These findings are more profound considering that growth rates were significantly and negatively impacted in PH. This fact suggests that mixotrophic conditions could provide somehow a growth protection against photoinhibition. Li et al. [40] observed that in the cyanobacterium Arthrospira platensis the addition of glucose protected against strong photoinhibition caused by ammonia toxicity. This point deserves to be more thoroughly investigated.

2.3.2. QA Re-Oxidation Kinetics on Cultures with White Light

Table 2 shows the half-time (t1/2) of the three phases of the QA re-oxidation kinetics (inset figures) without and with 50 μM 3-(3,4-dichlorophenyl)-1,1-dimethylurea (DCMU). In the kinetics without DCMU, the fast phase, which is related to the re-oxidation of QA by QB, was significantly affected by the trophic conditions and the peptone concentration, while the medium phase was not altered for MH and PL and was much slower for ML and PH. The slow phase had higher values in MH and PH than in PL. In the presence of DCMU, MH, ML, and PH displayed faster half times compared to PL, whereas the medium and slow phases were significantly slower (Table 2). The medium and slow phases reflect the binding of quinone to the QB site and the recombination of QA with the S2 state of the oxygen evolving complex (OEC), respectively [41,42]. The faster kinetics of QA re-oxidation in PL suggest a faster re-opening of RCs, which is consistent with the higher qp values also found in this culture. The QA re-oxidization depends mainly on the rate of forward electron transport and consequently on the redox state of the electron transfer chain, whereas in the presence of DCMU, the QA re-oxidation kinetics are an indicator of the condition of the donor side of PSII [42]. Overall, these results suggest that the trophic conditions and the peptone concentration have a strong effect on the electron transfer chain process. This could be an outcome of the overall alteration of some metabolic pathways, and of cell organization under the mixotrophic conditions, as was also shown for Chlorella vulgaris after transcriptomics and proteomics analysis [43].

2.3.3. Inactive PSII RCs and QB Non-Reducing RCs on Cultures with White Light

The S-States test, which was conducted for the determination of the inactive PSII reaction centers (Table 3), revealed that the only involved inactive PSII RC was observed in PL cultures, where 8.5% of the total PSII RCs was inactive. In the other cultures, the figures were negative values, suggesting that under mixotrophic conditions or high peptone concentration no inactive PSII RCs were present because no fluorescence decay after the fourth flash (S4 → S0/S1) was observed. However, it should be noted that the fluorescence signals in ML were significantly weaker than in the other cultures and that possibly the calculations were influenced by strong noise. Moreover, the double OJIP protocol revealed that the QB non-reducing RCs were almost doubled in the ML, MH, and PH compared to the PL (Table 3). These results suggest that the trophic conditions and the peptone concentration have a strong effect on the heterogeneity of the PSII reaction centers. However, no further literature is available on this topic and more research is needed.

3. Materials and Methods

3.1. Microorganism and Cultivation Conditions

Auxenochlorella protothecoides (CCAP 211/8D) was taken from the Culture Collection of Algae and Protozoa SAMS Limited Scottish Marine Institute. The basic growth medium (BGM) consisted of 0.5 g/L KH2PO4, 25 mg/L CaCl2, 10 mg/L Na2EDTA, 75 mg/L MgSO4·7H2O, 5 mg/L FeSO4·7H2O and 1.0 mL of trace elements stock solution: 2.86 g/L H3BO3, 20 mg/L (NH4)6Mo7O24, 1.8 g/L MnCl2·4H2O, 80 mg/L CuSO4·5H2O and 220 mg/L ZnSO4·7H2O. For the growth of stock cultures, 2 g/L peptone as nitrogen source and 5 g/L glycerol as organic carbon source were used. The inoculum cultures, which were used to inoculate the main experimental cultures, were grown with 2.5 g/L glycerol for three days under cool white LED panel illumination (100 μmol/m2/s; measured on the top of the transparent basis on which the photobioreactors where placed, i.e., on the outside of the bottom of the photobioreactors. Photon flux was measured with a SpectraPen LM 510 (Photon Systems Instruments, Czech Republic)). The experimental cultures were inoculated with 20% of inoculum cultures.
All cultivations were performed in 500 mL Duran flasks with a working volume of 300 mL (250 mL of fresh growth medium and 50 mL of inoculum). All cultures were axenic and performed under sterile conditions. The cultures were aerated with 0.2 μm filter-sterilized air for agitation and oxygen enrichment. Illumination was provided by five LEDs (SMD type; 14.4 W per meter, 60 SMD LEDs per meter; GloboStar, Greece) per flask (Figure A1 in the Appendix A). Illumination was provided from the bottom of the flasks at a photon flux of 100 ± 5 μmol/m2/s. Four monochromatic colors of illumination were used, namely blue, red, green, and yellow. Cool white LEDs were employed as controls (standard illumination). The Spectrum analysis of each monochromatic LED is shown in Figure A2 in the Appendix A.

3.2. Experimental Design

For each different LED light, four cultures were used (Table 4), two in which A. protothecoides was grown mixotrophically on glycerol (10 g/L) (MH and ML = mixotrophic conditions (M) with high (H) or low (L) peptone concentration)–and two cultures of A. protothecoides grown photoautotrophically (PH and PL = photoautotrophic conditions (P) with high (H) or low (L) peptone concentration), applying also KHCO3 as an inorganic carbon source. For mixotrophic and photoautotrophic cultures, the photoperiod was set at 16 h light and 8 h dark. The overall duration of the cultures was 7 days. The varied nitrogen (peptone) concentrations aimed, in addition to the light wavelength, at investigating the effect of nitrogen availability on the growth, biochemical profile, and photosynthetic efficiency of A. protothecoides. Moreover, in preliminary trials it was obtained that A. protothecoides is unable to uptake nitrates or ammoniacal nitrogen as a nitrogen source, therefore the use of peptone as a nitrogen source was also unavoidable in the photoautotrophic cultures. However, because peptone is an organic compound that probably can also be used as organic carbon, the low peptone concentration (0.5 g/L) in the PL cultures aimed at ensuring that at the time point of conducting the Chl-fluorescence analyses on day 2, A. protothecoides had consumed all the available peptone and therefore grew under photoautotrophic conditions. Thus, PL cultures were considered as the main representative of the photoautotrophic conditions in this study, whereas PH due to the higher peptone concentration could not be fully considered as photoautotrophic cultures. However, for the sake of the simplicity of the results presentation, photoautotrophic conditions were assessed in both PL and PH. A series of cultures kept in the dark for the same duration as the illuminated ones were performed in order to see if the microalga could grow heterotrophically using as sole carbon and energy sourcethe organic substances provided (glycerol and peptone). Dark grown cultures are referred to as negative controls.

3.3. Analytical Methods

3.3.1. Biomass Analysis

Biomass production as dry weight was measured after separating cells from the growth medium through centrifugation (2500 rpm for 10 min) and washing them with deionized (DI) water at least 3 times to remove and exclude the culture medium, and drying overnight in an oven (80 °C) until constant weight. Biomass concentration was also measured indirectly by the optical density (OD) at the wavelength of 750 nm [44]. Specific growth rates (μ) were calculated as: μ = (lnN1 − lnxN2)/(t), where N1, and N2 are the biomass concentrations after the inoculation of the cultures (N1) and the time of harvesting (N2), respectively after 7 days of cultivation (t).
Carbohydrates were measured by a modified phenol-sulfuric acid method [45]: briefly, in 0.5 mL of cell sample containing 10–50 mg/L carbohydrates, 10 μL of 90% phenol solution were added and mixed, followed by the addition of 1.25 mL of concentrated sulfuric acid (96%). After 30 min OD was measured at 485 nm using D-glucose as the standard sugar. Lipids were measured by a modification of the sulfo-vanillin method [46] after extraction of lipids with 2:1:0.2 chloroform:methanol and water. Briefly, 20 μL of extracted sample containing 200–500 mg/L of lipids were incubated in 80 °C to evaporate chloroform and then 0.4 mL of 96% sulfuric acid w added and samples were placed in boiling water for 10 min. Samples were then left at room temperature for 15 min to cool and 1.0 mL of phosphoric-acid/vanillin solution was added (solution stock was prepared by dissolving 0.12 g of vanillin in 20 mL DI water and finally in 80 mL of 85% phosphoric acid). The samples were incubated at 37 °C for 15 min and OD was measured at 530 nm. For the standard curve maize oil was used. Proteins were assayed according to Lowry et al. [47] after the extraction with 0.5 N NaOH: in brief, 1.5 mL of samples were centrifuged, the pelleted biomass was resuspended in 1.5 mL 0.5 N NaOH and then incubated on an agitation heating plate at 100 °C for 20 min. An aliquot of 100 μL of extracted proteins was then added to 100 μL 5% SDS, and supplemented with 1 mL of a solution consisting of 2% Na2CO3 in 0.1 N NaOH. After 15 min, 100 μL of freshly prepared 1 N Folin and Ciocalteu reagent was added and samples were left for 30 min in the dark. OD was measured at 750 nm using bovine serum albumin as the standard. Chlorophylls and total carotenoids were extracted with 90% methanol. In short, 2 mL of samples were centrifuged and the pellet was suspended in 2 mL of 90% methanol and incubated at 70 °C for 5 min. The concentrations of chlorophylls and total carotenoids were measured according to the equations given by Lichtenthaler [48]. All biomass composition analyses were performed after the samples were washed several times with DI water. All spectrophotometric determinations were carried out by a Cadas 50 (Dr. Lange GmBH, Saarbrücken, Germany) spectrophotometer and analyses were carried out at least in triplicate for each replicate. The final data given are the average of three analytical replicates from each of the three biological replicates (n = 3) with standard deviation. Statistical analysis was based on analysis of variance ANOVA (one-, two-, and three-way comparisons), conducted using SigmaPlot 12.0 software (Systat Software, Inc., San Jose, CA, USA). All data were tested for Normality (Shapiro–Wilk test) and for equal variance between treatments. Post-hoc statistical analysis was based on Duncan’s pairwise multiple comparison procedure.

3.3.2. Chlorophyll Fluorescence Measurements and Analysis

Chlorophyll fluorescence measurements were taken after the adaptation of cells in the dark (>20 min). The fluorescence transients of the OJIP test reflect the kinetics during the reduction of the plastoquinone (PQ) pool [14]. The model of QA on which the chlorophyll fluorescence analysis is based can be described briefly as follows: photons are absorbed by the antennae pigments (absorption flux: ABS) which are excited. A part of the excitation energy, the trapping flux (TR), is transferred to the reaction center (RC) while the remaining part is dissipated either as fluorescence or as heat. The TR is converted in the RCs to redox energy by reducing the electron acceptor QA to QA, which is then re-oxidized to QA leading to electron transport (ET) and consequently to photochemistry [39]. The terms and formulae for the various parameters of the OJIP test are shown in Table 5 and were based on Strasser et al. [39] unless otherwise stated in the text.
Photochemical and non-photochemical quenching: Photochemical and non-photochemical quenching measurements and analysis were routinely performed using an AquaPen 110-C fluorometer (PSI Instruments, Czech Republic). The NPQ protocol begins by measuring the minimal level of fluorescence Fo in dark-adapted cells. After recording Fo, a short saturating flash reduces the PQ pool and Fm is recorded. A short dark relaxation period is followed, and then actinic light is supplied for tens to hundreds of seconds to provoke the Kautsky effect and fluorescence signals (Ft) are recorded. Then, a sequence of additional saturating flashes is applied on top of the actinic light to measure the NPQ and the effective quantum yield measuring Fm’ in light adapted state. NPQ was calculated as (Fm − Fm’)/Fm’ [49]. qp reflects the level of open PSII centers and it gives higher values when the photochemistry potential is high. In contrast, NPQ increases as the fluorescence is quenched due to processes other than photochemistry [50,51].
QA re-oxidation kinetics: The QA re-oxidation kinetics were recorded using the Fluorometer FL 6000F (PSI Instruments, Czech Republic) after a single turnover flash, with actinic flash duration of 50 μs and intensity of 2500 μmol photons/(m2 s). The total duration of the test was 50 s. The kinetic data were recorded with six points per decay. The QA re-oxidation process consists of three phases (fast, medium, slow). In order to calculate their half-times of decay, the kinetics were fitted to the following exponential function [52]:
F(t) = Fr + A1*e−K1*t + A2*e−K2*t + A3*e−K3*t
where F(t) is the fluorescence at time t, K1, K2, and K3 are the decay rate constants, A1, A2, and A3 are the amplitudes of the fluorescence associated relaxation phases (fast, medium, and slow, respectively), and Fr is the remaining fluorescence at the end of the decay. DCMU (3-(3,4-dichlorophenyl)-1,1-dimethylurea) was also used (50 μM) as an electron transport inhibitor.
Determination of the inactive PSII reaction centers and QB non-reducing RCs: The oxygen evolving complex (OEC) generates oxygen after a series of oxidations of four intermediate states (S0→S4). The PSII RCs of dark-adapted cells are in the S0 and S1 states (S0/S1; slash indicates a mixture of Sx/Sy). In the S-states test, the five S-states are advanced stepwise by short actinic light flashes, i.e., first flash advances S1/S2, second flash S2/S3, third flash S3/S4 →S0 and the fourth flash S4 → S0/S1 [53,54]. S-states were advanced by 50 μs long flashes at 200 ms periods. S-states tests were employed for the determination of the contribution of inactive PSII RCs, because the fluorescence decay after the fourth flash (S4 → S0/S1) is controlled by inactive RCs. Inactive PSII were calculated according to [55]:
Inactive PSII RCs (%) = 100*ΔF4/[(F3d/F0) − 1]
where F3d is the first fluorescence signal recorded after the third flash, ΔF4 = (F4th99ms/F0) − 1, and F4th99ms is the fluorescence 99 ms after the fourth flash. S-states were recorded on the Fluorometer FL 6000F. For the determination of reducing site heterogeneity, a double pulse OJIP was performed in order to determine the contribution of QB non-reducing centers. More specifically two fluorescence transients were induced by two subsequent light pulses (each of 1 s duration). The QB non-reducing centers were determined as:
NQB = [(Fv/Fm)first pulse − (Fv/Fm)second pulse]/(Fv/Fm)first pulse
This section is not mandatory but can be added to the manuscript if the discussion is unusually long or complex.

4. Conclusions

The results of the present study revealed that A. protothecoides growth under mixotrophic conditions is not as favored as it is for several other microalgae. A. protothecoides displayed better growth rates under heterotrophy (dark conditions) probably due to some kind of photoinhibition, as NPQ analyses suggested. White and red were the best light wavelengths, in which A. protothecoides had the highest growth rates under mixotrophic conditions. The availability of nitrogen had the strongest effect on the biochemical composition; indeed, under nitrogen replete conditions there was a trend for protein accumulation, whereas under deplete conditions biomass tend to accumulate carbohydrates. Pigment content was affected mainly by the trophic conditions, because in the presence of glycerol (mixotrophy) pigment content was significantly decreased compared to the photoautotrophic. The light wavelength did not have any clear effect on the biomass production and the microalgal metabolites synthesis in A. protothecoides. The overall results suggest that trophic conditions and, in particular, the availability of nitrogen (peptone concentration), had a stronger effect on the growth, the production of metabolites, and the photosynthetic machinery than the different light wavelengths. Chlorophyll fluorescence studies suggest that the photosystem II performance and the heterogeneity of the PSII reaction centers were affected by the trophic conditions and the high peptone concentrations. The present study highlights several points that need more research, so that the overall process is better understood and optimized.

Author Contributions

Conceptualization, G.M.; methodology, G.M.; investigation, G.M.; formal analysis, G.M. and A.D.; resources, G.M. and I.C.; writing—original draft preparation, G.M.; writing—review and editing G.M., A.D., E.K., V.T., I.K. and I.C.; project administration, V.T.; funding acquisition, G.M. and I.C. All authors have read and agreed to the published version of the manuscript.

Funding

This research has been co-financed by the European Regional Development Fund of the European Union and Greek national funds through the Operational Program Competitiveness, Entrepreneurship and Innovation, under the call RESEARCH—CREATE—INNOVATE (T1EDK-02142).

Institutional Review Board Statement

Not applicable.

Informed Consent Statement

Not applicable.

Data Availability Statement

The data presented in this study are available in the article.

Acknowledgments

The authors would like to thank Miltiadis Christopoulos (Institute of Technology of Agricultural Products, Hellenic Agricultural Organization–Demeter, Greece) for his suggestions and support on the statistical analysis.

Conflicts of Interest

The authors declare no conflict of interest.

Appendix A

Figure A1. Experimental configuration for growing A. protethecoides with monochromatic illumination by LEDs in 500 mL flasks aerated with sterilized air.
Plants 10 00799 g0a1
Figure A2. Spectra of the LEDs used for the illumination of the cultures of A. protothecoides and the associated absorption of the photosynthetically active pigments (chlorophyll a, chlorophyll b, and carotenoids).
Plants 10 00799 g0a2

References

  1. Fernández, F.G.A.; Reis, A.; Wijffels, R.H.; Barbosa, M.; Verdelho, V.; Llamas, B. The role of microalgae in the bioeconomy. New Biotechnol. 2021, 61, 99–107. [Google Scholar] [CrossRef] [PubMed]
  2. Spolaore, P.; Joannis-Cassan, C.; Duran, E.; Isambert, A. Commercial applications of microalgae. J. Biosci. Bioeng. 2006, 101, 87–96. [Google Scholar] [CrossRef] [Green Version]
  3. Pang, N.; Gu, X.; Chen, S.; Kirchhoff, H.; Lei, H.; Roje, S. Exploiting mixotrophy for improving productivities of biomass and co-products of microalgae. Renew. Sustain. Energy Rev. 2019, 112, 450–460. [Google Scholar] [CrossRef]
  4. D’Imporzano, G.; Silvia, S.; Davide, V.; Barbara, S.; Fabrizio, A. Microalgae Mixotrophic Growth: Opportunity for Stream Depuration and Carbon Recovery. In Prospects and Challenges in Algal Biotechnology; Springer: Berlin/Heidelberg, Germany, 2017; pp. 141–177. [Google Scholar]
  5. Paranjape, K.; Leite, G.B.; Hallenbeck, P.C. Strain variation in microalgal lipid production during mixotrophic growth with glycerol. Bioresour. Technol. 2016, 204, 80–88. [Google Scholar] [CrossRef] [Green Version]
  6. Cerón-García, M.C.; Macías-Sánchez, M.D.; Sánchez-Mirón, A.; García-Camacho, F.; Molina-Grima, E. A process for biodiesel production involving the heterotrophic fermentation of Chlorella protothecoides with glycerol as the carbon source. Appl. Energy 2013, 103, 341–349. [Google Scholar] [CrossRef]
  7. Chen, Y.-H.; Walker, T.H. Biomass and lipid production of heterotrophic microalgae Chlorella protothecoides by using biodiesel-derived crude glycerol. Biotechnol. Lett. 2011, 33, 1973. [Google Scholar] [CrossRef]
  8. O’Grady, J.; Morgan, J.A. Heterotrophic growth and lipid production of Chlorella protothecoides on glycerol. Bioprocess Biosyst. Eng. 2011, 34, 121–125. [Google Scholar] [CrossRef]
  9. Xiao, Y.; Lu, Y.; Dai, J.; Wu, Q. Industrial fermentation of auxenochlorella protothecoides for production of biodiesel and Its application in vehicle diesel engines. Front. Bioeng. Biotechnol. 2015, 3, 164. [Google Scholar] [CrossRef] [PubMed] [Green Version]
  10. Gopalakrishnan, K. Heterotrophic Culture of Microalgae Using Biodiesel Derived Glycerol. Ph.D. Thesis, Clemson University, Clemson, SC, USA, 2014. [Google Scholar]
  11. Murata, N.; Takahashi, S.; Nishiyama, Y.; Allakhverdiev, S.I. Photoinhibition of photosystem II under environmental stress. Biochim. Biophys. Acta (BBA) Bioenerg. 2007, 1767, 414–421. [Google Scholar] [CrossRef] [Green Version]
  12. Masojídek, J.; Vonshak, A.; Torzillo, G. Chlorophyll fluorescence applications in microalgal mass cultures. In Chlorophyll a Fluorescence in Aquatic Sciences: Methods and Applications; Springer: Berlin/Heidelberg, Germany, 2010; pp. 277–292. [Google Scholar]
  13. Keren, N.; Krieger-Liszkay, A. Photoinhibition: Molecular mechanisms and physiological significance. Physiol. Plant 2011, 142, 1–5. [Google Scholar] [CrossRef]
  14. Strasser, R.J.; Srivastava, A. Polyphasic chlorophyll a fluorescence transient in plants and cyanobacteria. Photochem. Photobiol. 1995, 61, 32–42. [Google Scholar] [CrossRef]
  15. Carvalho, A.; Silva, S.; Baptista, J.; Malcata, F. Light requirements in microalgal photobioreactors: An overview of biophotonic aspects. Appl. Microbiol. Biotechnol. 2011, 89, 1275–1288. [Google Scholar] [CrossRef]
  16. Lababpour, A.; Hada, K.; Shimahara, K.; Katsuda, T.; Katoh, S. Effects of nutrient supply methods and illumination with blue light emitting diodes (LEDs) on astaxanthin production by Haematococcus pluvialis. J. Biosci. Bioeng. 2004, 98, 452–456. [Google Scholar] [CrossRef]
  17. Markou, G. Effect of Various Colors of Light-Emitting Diodes (LEDs) on the Biomass Composition of Arthrospira platensis Cultivated in Semi-continuous Mode. Appl. Biochem. Biotechnol. 2014, 172, 2758–2768. [Google Scholar] [CrossRef]
  18. Schulze, P.S.; Barreira, L.A.; Pereira, H.G.; Perales, J.A.; Varela, J.C. Light emitting diodes (LEDs) applied to microalgal production. Trends Biotechnol. 2014, 32, 422–430. [Google Scholar] [CrossRef]
  19. Ra, C.-H.; Kang, C.-H.; Jung, J.-H.; Jeong, G.-T.; Kim, S.-K. Effects of light-emitting diodes (LEDs) on the accumulation of lipid content using a two-phase culture process with three microalgae. Bioresour. Technol. 2016, 212, 254–261. [Google Scholar] [CrossRef]
  20. Pattison, P.; Tsao, J.; Brainard, G.; Bugbee, B. LEDs for photons, physiology and food. Nature 2018, 563, 493–500. [Google Scholar] [CrossRef] [PubMed]
  21. Li, T.; Kirchhoff, H.; Gargouri, M.; Feng, J.; Cousins, A.B.; Pienkos, P.T.; Gang, D.R.; Chen, S. Assessment of photosynthesis regulation in mixotrophically cultured microalga Chlorella sorokiniana. Algal Res. 2016, 19, 30–38. [Google Scholar] [CrossRef] [Green Version]
  22. Liu, X.; Duan, S.; Li, A.; Xu, N.; Cai, Z.; Hu, Z. Effects of organic carbon sources on growth, photosynthesis, and respiration of Phaeodactylum tricornutum. J. Appl. Phycol. 2009, 21, 239–246. [Google Scholar] [CrossRef]
  23. Jacobi, A.; Steinweg, C.; Sastre, R.R.; Posten, C. Advanced photobioreactor LED illumination system: Scale-down approach to study microalgal growth kinetics. Eng. Life Sci. 2012, 12, 621–630. [Google Scholar] [CrossRef]
  24. Ma, R.; Thomas-Hall, S.R.; Chua, E.T.; Eltanahy, E.; Netzel, M.E.; Netzel, G.; Lu, Y.; Schenk, P.M. LED power efficiency of biomass, fatty acid, and carotenoid production in Nannochloropsis microalgae. Bioresour. Technol. 2018, 252, 118–126. [Google Scholar] [CrossRef]
  25. Jung, J.-H.; Sirisuk, P.; Ra, C.H.; Kim, J.-M.; Jeong, G.-T.; Kim, S.-K. Effects of green LED light and three stresses on biomass and lipid accumulation with two-phase culture of microalgae. Process Biochem. 2019, 77, 93–99. [Google Scholar] [CrossRef]
  26. Hultberg, M.; Jönsson, H.L.; Bergstrand, K.-J.; Carlsson, A.S. Impact of light quality on biomass production and fatty acid content in the microalga Chlorella vulgaris. Bioresour. Technol. 2014, 159, 465–467. [Google Scholar] [CrossRef] [PubMed]
  27. Ra, C.H.; Kang, C.-H.; Jung, J.-H.; Jeong, G.-T.; Kim, S.-K. Enhanced biomass production and lipid accumulation of Picochlorum atomus using light-emitting diodes (LEDs). Bioresour. Technol. 2016, 218, 1279–1283. [Google Scholar] [CrossRef] [PubMed]
  28. de Mooij, T.; de Vries, G.; Latsos, C.; Wijffels, R.H.; Janssen, M. Impact of light color on photobioreactor productivity. Algal Res. 2016, 15, 32–42. [Google Scholar] [CrossRef] [Green Version]
  29. Chen, Z.; Su, B. Influence of Medium Frequency Light/Dark Cycles on the Cultivation of Auxenochlorella pyrenoidosa. Appl. Sci. 2020, 10, 5093. [Google Scholar] [CrossRef]
  30. Das, P.; Lei, W.; Aziz, S.S.; Obbard, J.P. Enhanced algae growth in both phototrophic and mixotrophic culture under blue light. Bioresour. Technol. 2011, 102, 3883–3887. [Google Scholar] [CrossRef] [PubMed]
  31. Oh, S.-J.; Kwon, H.-K.; Jeon, J.-Y.; Yang, H.-S. Effect of monochromatic light emitting diode on the growth of four microalgae species (Chlorella vulgaris, Nitzschia sp., Phaeodactylum tricornutum, Skeletonema sp.). J. Korean Soc. Mar. Environ. Saf. 2015, 21, 1–8. [Google Scholar] [CrossRef]
  32. Wang, S.K.; Stiles, A.R.; Guo, C.; Liu, C.Z. Microalgae cultivation in photobioreactors: An overview of light characteristics. Eng. Life Sci. 2014, 14, 550–559. [Google Scholar] [CrossRef] [Green Version]
  33. Xiao, Y.; Guo, J.; Zhu, H.; Muhammad, A.; Deng, H.; Hu, Z.; Wu, Q. Inhibition of glucose assimilation in Auxenochlorella protothecoides by light. Biotechnol. Biofuels 2020, 13, 146. [Google Scholar] [CrossRef]
  34. Zhan, J.; Rong, J.; Wang, Q. Mixotrophic cultivation, a preferable microalgae cultivation mode for biomass/bioenergy production, and bioremediation, advances and prospect. Int. J. Hydrogen Energy 2017, 42, 8505–8517. [Google Scholar] [CrossRef]
  35. Heredia-Arroyo, T.; Wei, W.; Hu, B. Oil Accumulation via Heterotrophic/Mixotrophic Chlorella protothecoides. Appl. Biochem. Biotechnol. 2010, 162, 1978–1995. [Google Scholar] [CrossRef]
  36. Rismani-Yazdi, H.; Hampel, K.H.; Lane, C.D.; Kessler, B.A.; White, N.M.; Moats, K.M.; Allnutt, F.T. High-productivity lipid production using mixed trophic state cultivation of Auxenochlorella (Chlorella) protothecoides. Bioprocess Biosyst. Eng. 2015, 38, 639–650. [Google Scholar] [CrossRef] [PubMed]
  37. Zhu, S.; Huang, W.; Xu, J.; Wang, Z.; Xu, J.; Yuan, Z. Metabolic changes of starch and lipid triggered by nitrogen starvation in the microalga Chlorella zofingiensis. Bioresour. Technol. 2014, 152, 292–298. [Google Scholar] [CrossRef] [PubMed]
  38. Kong, W.; Yang, S.; Wang, H.; Huo, H.; Guo, B.; Liu, N.; Zhang, A.; Niu, S. Regulation of biomass, pigments, and lipid production by Chlorella vulgaris 31 through controlling trophic modes and carbon sources. J. Appl. Phycol. 2020, 32, 1569–1579. [Google Scholar] [CrossRef]
  39. Strasser, R.J.; Tsimilli-Michael, M.; Srivastava, A. Analysis of the Chlorophyll a Fluorescence Transient; Springer: Berlin/Heidelberg, Germany, 2004. [Google Scholar]
  40. Li, X.; Li, W.; Zhai, J.; Wei, H.; Wang, Q. Effect of ammonium nitrogen on microalgal growth, biochemical composition and photosynthetic performance in mixotrophic cultivation. Bioresour. Technol. 2019, 273, 368–376. [Google Scholar] [CrossRef] [PubMed]
  41. Antal, T.; Mattila, H.; Hakala-Yatkin, M.; Tyystjarvi, T.; Tyystjarvi, E. Acclimation of photosynthesis to nitrogen deficiency in Phaseolus vulgaris. Planta 2010, 232, 887–898. [Google Scholar] [CrossRef]
  42. Mamedov, F.; Rintamaki, E.; Aro, E.M.; Andersson, B.; Styring, S. Influence of protein phosphorylation on the electron-transport properties of Photosystem II. Photosynth. Res. 2002, 74, 61–72. [Google Scholar] [CrossRef] [PubMed]
  43. Vidotti, A.D.S.; Riaño-Pachón, D.M.; Mattiello, L.; Giraldi, L.A.; Winck, F.V.; Franco, T.T. Analysis of autotrophic, mixotrophic and heterotrophic phenotypes in the microalgae Chlorella vulgaris using time-resolved proteomics and transcriptomics approaches. Algal Res. 2020, 51, 102060. [Google Scholar] [CrossRef]
  44. Griffiths, M.J.; Garcin, C.; van Hille, R.P.; Harrison, S.T.L. Interference by pigment in the estimation of microalgal biomass concentration by optical density. J. Microbiol. Methods 2011, 85, 119–123. [Google Scholar] [CrossRef]
  45. Kochert, G. Carbohydrate determination by phenol-sulfuric acid method. In Handbook of Phycological Methods. Physiological and Biochemical Methods; Hellebust, J.A., Craige, J.S., Eds.; Cambridge University Press: London, UK, 1978; pp. 95–97. [Google Scholar]
  46. Izard, J.; Limberger, R.J. Rapid screening method for quantitation of bacterial cell lipids from whole cells. J. Microbiol. Methods 2003, 55, 411–418. [Google Scholar] [CrossRef]
  47. Lowry, O.H.; Rosebrough, N.J.; Farr, A.L.; Randall, R.J. Protein measurement with the Folin phenol reagent. J. Biol. Chem. 1951, 193, 265–275. [Google Scholar] [CrossRef]
  48. Lichtenthaler, H.K. [34] Chlorophylls and carotenoids: Pigments of photosynthetic biomembranes. Methods Enzymol. 1987, 148, 350–382. [Google Scholar]
  49. PSI. Operation Manual. Available online: http://www.psi.cz/download/document/manuals/aquapen/AquaPen_Manual.pdf (accessed on 1 February 2016).
  50. Campbell, D.; Hurry, V.; Clarke, A.K.; Gustafsson, P.; Öquist, G. Chlorophyll fluorescence analysis of cyanobacterial photosynthesis and acclimation. Microbiol. Mol. Biol. Rev. 1998, 62, 667–683. [Google Scholar] [CrossRef] [Green Version]
  51. Kalaji, H.M.; Schansker, G.; Ladle, R.J.; Goltsev, V.; Bosa, K.; Allakhverdiev, S.I.; Brestic, M.; Bussotti, F.; Calatayud, A.; Dabrowski, P.; et al. Frequently asked questions about in vivo chlorophyll fluorescence: Practical issues. Photosynth. Res. 2014, 122, 121–158. [Google Scholar] [CrossRef] [Green Version]
  52. Belatik, A.; Hotchandani, S.; Carpentier, R. Inhibition of the water oxidizing complex of photosystem II and the reoxidation of the quinone acceptor QA− by Pb 2+. PLoS ONE 2013, 8, e68142. [Google Scholar] [CrossRef] [PubMed] [Green Version]
  53. Navarro, M.P.; Ames, W.M.; Nilsson, H.; Lohmiller, T.; Pantazis, D.A.; Rapatskiy, L.; Nowaczyk, M.M.; Neese, F.; Boussac, A.; Messinger, J. Ammonia binding to the oxygen-evolving complex of photosystem II identifies the solvent-exchangeable oxygen bridge (μ-oxo) of the manganese tetramer. Proc. Natl. Acad. Sci. USA 2013, 110, 15561–15566. [Google Scholar] [CrossRef] [Green Version]
  54. Oyala, P.H.; Stich, T.A.; Debus, R.J.; Britt, R.D. Ammonia Binds to the Dangler Manganese of the Photosystem II Oxygen-Evolving Complex. J. Am. Chem. Soc. 2015, 137, 8829–8837. [Google Scholar] [CrossRef] [PubMed]
  55. Pan, X.; Deng, C.; Zhang, D.; Wang, J.; Mu, G.; Chen, Y. Toxic effects of amoxicillin on the photosystem II of Synechocystis sp. characterized by a variety of in vivo chlorophyll fluorescence tests. Aquat. Toxicol. 2008, 89, 207–213. [Google Scholar] [CrossRef] [PubMed]
Figure 1. Growth rates of A. protothecoides cultivated photoautotrophically for seven days with different light wavelengths: (a) with low peptone (PL) and (b) with high peptone (PH). Each bar represents the average ± SD of n = 3 replicates. The letters (b: blue, g: green, y: yellow, r: red. w: white, and d: dark) indicate that there were no statistically significant differences between the means (two-way ANOVA; Duncan method; p < 0.05) of the pairwise comparisons between the different wavelengths. Between the variable groups PL and PH there were statistically significant differences (p < 0.01).
Plants 10 00799 g001
Figure 2. Growth rates of A. protothecoides cultivated mixotrophically for seven days with different light wavelengths: (a) with low peptone (ML) and (b) with high peptone (MH). Each bar represents the average ± SD of n = 3 replicates. The letters (b: blue, g: green, y: yellow, r: red. w: white, and d: dark) indicate that there were no statistically significant differences between the means (two-way ANOVA; Duncan method; p < 0.05) of the pairwise comparisons between the different wavelengths. Between the variable groups ML and MH there were statistically significant differences (p < 0.01).
Plants 10 00799 g002
Figure 3. Biochemical composition of A. protothecoides cultivated in different light wavelengths under photoautotrophic conditions with (a) low peptone and (b) high peptone concentration, and in mixotrophic conditions with (c) low peptone and (d) high peptone concentration. Each bar represents the average of n = 3 replicates.
Plants 10 00799 g003
Figure 4. Pigments content of A. protothecoides cultivated in different light wavelengths under photoautotrophic conditions with (a) low peptone and (b) high peptone concentration, and in mixotrophic conditions with (c) low peptone and (d) high peptone concentration. Each bar represents the average of n = 3 replicates.
Plants 10 00799 g004
Figure 5. Maximum quantum yields of primary photochemistry (Fv/Fm) of A. protothecoides cultivated under the different conditions (each circle represents a different cultivation treatment; MH and ML stand for mixotrophy with high and low peptone, respectively, and PH and PL stand for photoautotrophy with high and low peptone, respectively).
Plants 10 00799 g005
Table 1. Selected calculated parameters of the OJIP and non-photochemical quenching (NPQ) tests of A. protothecoides cultivated under white light. Inset figures: OJIP (a) and NPQ (b) signals of the associated cultures. Data represent the average ± SD of three replicates (n = 3). (MH and ML stand for mixotrophy with high and low peptone, respectively, and PH and PL stand for photoautotrophy with high and low peptone, respectively).
ParameterCulture Plants 10 00799 i001
MHMLPHPL
ABS/RC54.37 ± 4.5926.56 ± 3.7167.23 ± 22.811.28 ± 0.11
DIo/RC50.42 ± 3.4624.60 ± 4.72160.94 ± 33.470.40 ± 0.02
φDo0.93 ± 0.090.91 ± 0.070.96 ± 0.080.31 ± 0.03
PIABS0.01 ± 0.0010.01 ± 0.0010.01 ± 0.0014.50 ± 0.48
NPQ0.04 ± 0.0020.417 ± 0.0310.097 ± 0.0090.517 ± 0.027
qp0.01 ± 0.0010.107 ± 0.0050.01 ± 0.0010.783 ± 0.081
Table 2. QA re-oxidation kinetics of A. protothecoides cultivated under white light. Inset figures: QA re-oxidation kinetics without (a) and with 50 μM 3-(3,4-dichlorophenyl)-1,1-dimethylurea (DCMU) (b). Data represent the average ± SD of three replicates (n = 3). (MH and ML stands for mixotrophy with high and low peptone, respectively, and PH and PL stands for photoautotrophy with high and low peptone, respectively).
Kinetic PhasesMHMLPHPL Plants 10 00799 i002
Without DCMU
Fast Phase (t1/2, ms)116 ± 15207 ± 56237 ± 1610.3 ± 0.3
Medium Phase (t1/2, s)11.3 ± 0.4720.1 ± 2.746.5 ± 12.410.1 ± 0.8
Slow Phase (t1/2, s)12,172 ± 1192Not computable18,783 ± 16911685 ± 190
With 50 μM DCMU
Fast Phase (t1/2, ms)849 ± 614801 ± 3269763 ± 5622,847 ± 1438
Medium Phase (t1/2, s)43 ± 4.534.5 ± 0.546.4 ± 4.3 8.2 ± 0.9
Slow Phase (t1/2, s)2001 ± 3043698 ± 5579677 ± 1056328 ± 25
Table 3. Inactive PSII RCs and QB Non-Reducing RCs of A. protothecoides cultivated under white light. (MH and ML stands for mixotrophy with high and low peptone, respectively, and PH and PL stands for photoautotrophy with high and low peptone, respectively).
CultureInactive PSII RCsQB Non-Reducing RCs
MHNegative value21.36% ± 3.35%
MLNegative value22.61% ± 0.93%
PHNegative value23.24% ± 5.3%
PL8.5% ± 1.3%11.10% ± 1.34%
Table 4. Basic experimental design of A. protothecoides grown mixotrophically or photoauthotrophically under different light qualities. (MH and ML stands for mixotrophy with high and low peptone, respectively and PH and PL stands for photoautotrophy with high and low peptone, respectively).
Culture NameGlycerol (g/L)KHCO3 (g/L)Peptone (g/L)
MH10-4
ML10-0.5
PH02.54
PL02.50.5
Table 5. Parameters, formulae, and terms used in the OJIP test (adapted from [39]).
ParametersFormulaeTerms
VJ(F2ms − F0)/(Fm − F0)Variable fluorescence at the J step
VI(F60ms − F0)/(Fm − F0)Variable fluorescence at the I step
M04*(F300μs − F0)/(Fm − F0)Approximated initial slope of the fluorescence transients
φPoTRo/ABS = 1 − (F0/Fm) = Fv/FmMaximum quantum yield for primary photochemistry (at t = 0)
φDo= 1 − ΦPo-(F0/Fm)Quantum yield of energy dissipation (at t = 0)
PIABS(RC/ABS) [φPo/(1 φPo)] . [Ψo/(1 − Ψo)]Performance index
ABS/RCM0*(1/VJ)*(1/φPo)Absorption flux per RC
Publisher’s Note: MDPI stays neutral with regard to jurisdictional claims in published maps and institutional affiliations.

